Embed Size (px)
Citation preview

RISK PROFILE: CAFFEINE IN ENERGY DRINKS
AND ENERGY SHOTS
Prepared for New Zealand Food Safety Authority under project CFS/09/04 - Science Programme Reporting, as part of overall contract for scientific services
By
Dr Barbara Thomson Sonja Schiess
April 2010
Institute of Environmental Science & Research Limited Christchurch Science Centre Location address: 27 Creyke Road, Ilam, Christchurch Postal address: P O Box 29 181, Christchurch, New Zealand Website: www.esr.cri.nz
A CROWN RESEARCH INSTITUTE
Client Report FW10002
RISK PROFILE: CAFFEINE IN ENERGY DRINKS
AND ENERGY SHOTS
Dr Stephen On Food Safety Programme Leader
Dr Barbara Thomson Peter Cressey Project Leader Peer Reviewer

DISCLAIMER This report or document (“the Report”) is given by the Institute of Environmental Science and Research Limited (“ESR”) solely for the benefit of the New Zealand Food Safety Authority (“NZFSA”), Public Health Services Providers and other Third Party Beneficiaries as defined in the Contract between ESR and the NZFSA, and is strictly subject to the conditions laid out in that Contract. Neither ESR nor any of its employees makes any warranty, express or implied, or assumes any legal liability or responsibility for use of the Report or its contents by any other person or organisation. The information contained in this Risk Profile is current to the date of publication. Please be aware that new information on the subject may have arisen since the document was finalized.
.
Risk Profile: Caffeine in energy drinks and energy shots April 2010

ACKNOWLEDGMENTS The authors wish to acknowledge the Ministry of Health as owner of the copyright and funders of the 1997 National Nutrition Survey and the 2002 National Children’s Nutrition Survey and to thank them for access to food consumption information (24-hour dietary recall and qualitative food frequency questionnaire) from these surveys. Thanks to Peter Cressey, ESR, for undertaking the @Risk simulations.
Risk Profile: Caffeine in energy drinks and energy shots April 2010

CONTENTS
EXECUTIVE SUMMARY..................................................................................................1
GLOSSARY OF TERMS, ABBREVIATIONS AND ACRONYMS ..............................3
1 STATEMENT OF PURPOSE.................................................................................4
1.1 Hazard/Food Combination and Risk Management Questions............................5
2 HAZARD AND FOOD.............................................................................................6
2.1 Caffeine...............................................................................................................6 2.1.1 Caffeine structure and nomenclature ............................................................6
2.2 Sources of Caffeine.............................................................................................6 2.3 Caffeine in Food and Beverages .........................................................................7 2.4 Exposure Assessment..........................................................................................8
2.4.1 Caffeine concentrations in New Zealand foods and beverages from natural sources and kola type soft drinks..................................................................8
2.4.2 New Zealand data for dietary caffeine concentrations compared with overseas data .................................................................................................8
2.4.3 New Zealand caffeinated beverages .............................................................9 2.4.4 New Zealand data for concentrations of caffeine in caffeinated beverages
compared with overseas data ......................................................................13 2.4.5 Caffeinated beverage consumption information.........................................13 2.4.6 New Zealand baseline dietary exposure estimate for caffeine ...................14 2.4.7 Overseas estimates of caffeine exposure ....................................................17 2.4.8 Comparison of New Zealand dietary caffeine exposures with overseas
estimates......................................................................................................17 2.4.9 Major contributing foods ............................................................................18 2.4.10 Potential caffeine exposures from ingestion of energy drinks and energy
shots, additional to a baseline dietary exposure for children, teenagers and young males ................................................................................................19
3 EVALUATION OF ADVERSE HEALTH EFFECTS .......................................22
3.1 Absorption, Distribution and Pharmacokinetics ...............................................22 3.2 Adverse Effects .................................................................................................22
3.2.1 General adverse effects ...............................................................................22 3.2.2 Central nervous system effects ...................................................................22 3.2.3 Cardiovascular effects.................................................................................23 3.2.4 Mutagenicity, carcinogenicity ....................................................................23 3.2.5 Pregnancy outcomes and reproductive effects............................................23 3.2.6 Effects on bone and calcium balance..........................................................24 3.2.7 Effects on children ......................................................................................24 3.2.8 Death...........................................................................................................24 3.2.9 Tolerance, dependence and sensitivity .......................................................25
3.3 Dose Response ..................................................................................................25 3.4 Establishment of Safe Limits ............................................................................26
3.4.1 General population......................................................................................26 3.4.2 Children ......................................................................................................26 3.4.3 Reproductive aged women..........................................................................27
Risk Profile: Caffeine in energy drinks and energy shots April 2010

3.5 New Zealand reports of Caffeine Poisoning .....................................................27 3.5.1 National Poisons Centre..............................................................................27 3.5.2 Additional report.........................................................................................28
4 EVALUATION OF RISK......................................................................................29
4.1 Estimate of Risk for New Zealand....................................................................29 4.1.1 Adverse effect levels applied to New Zealand exposures ..........................29 4.1.2 Comparison of baseline dietary exposure to caffeine with adverse effect
level.............................................................................................................29 4.1.3 Impact of caffeinated beverages on caffeine exposure relative to adverse
effect level...................................................................................................29 4.2 Uncertainties and Data Gaps.............................................................................30
4.2.1 Uncertainties ...............................................................................................30 4.2.2 Data Gaps....................................................................................................31
5 AVAILABILITY OF CONTROL MEASURES..................................................32
5.1 Existing Control Measures in New Zealand .....................................................32 5.1.1 Regulatory...................................................................................................32 5.1.2 Advisory......................................................................................................32
5.2 Existing Control Measures Overseas ................................................................33 5.2.1 Canada ........................................................................................................33 5.2.2 United Kingdom .........................................................................................33 5.2.3 USA ............................................................................................................33 5.2.4 European Food Safety Authority (EFSA)...................................................34 5.2.5 Finnish Food Safety Authority (Evira) .......................................................34
5.3 Control Options.................................................................................................34
6 REFERENCES .......................................................................................................36
APPENDIX 1: Concentration of Caffeine In New Zealand Foods (NZ Food Composition, 8th Edition, 2009)...........................................................40
APPENDIX 2: Overseas concentration of caffeine in coffee, tea and chocolate and food products containing coffee or chocolate......................................43
APPENDIX 3: New Zealand Exposure Estimate to Caffeine......................................45 APPENDIX 4: Overseas Estimates Of Caffeine Exposure..........................................48 APPENDIX 5: Cumulative probability curves of total caffeine exposure for
children, teenagers and young males consuming 1-4 energy drinks or energy shots in addition to baseline dietary exposure...................51
Risk Profile: Caffeine in energy drinks and energy shots April 2010

LIST OF TABLES
Table 1: Caffeine content of various plant materials and products......................7
Table 2: Claimed caffeine content of energy drinks and energy shots available in New Zealand..........................................................................................10
Table 3: Claimed caffeine content of caffeinated alcoholic beverages and kola type soft drinks available in New Zealand..............................................12
Table 4: Respondent numbers and proportion (%) of caffeine consumers for exposure estimates ....................................................................................14
Table 5: Dietary baseline caffeine exposure estimates for various New Zealand population groups (mg/day). ....................................................................15
Table 6: Dietary baseline caffeine exposure estimates for caffeine consumers for various New Zealand population groups (mg/kg bw/day) ....................15
Table 7: Percentage contributions of caffeine containing foods to caffeine dietary exposure for different population groups..................................18
Table 8: Mean and 95th percentile (P95) daily baseline caffeine exposures (mg/kg bw/day) of New Zealand children, teenagers and young males and potential additional exposures if 1-4 retail units of energy drinks or energy shots are consumed........................................................................21
Table 9: Proportion (%) of caffeine consumers and respondents with estimated baseline dietary exposure to caffeine greater than caffeine adverse effect levels for different population groups ..........................................29
Table 10: Proportion (%) of New Zealand children, teenagers and young males with potential caffeine intakes above an adverse effect level of 3mg/kg bw/day if one - four retail units of energy drinks or energy shots are consumed ...................................................................................................30
LIST OF FIGURES
Figure 1: The four steps of the Risk Management Framework..............................4
Figure 2: Chemical structures of caffeine, theobromine and theophylline............6
Figure 3 : Distribution of dietary baseline caffeine exposure estimates for children (5-12 yrs)..................................................................................16
Figure 4: Distribution of dietary baseline caffeine exposure estimates for teenagers (13-19 yrs)...............................................................................16
Risk Profile: Caffeine in energy drinks and energy shots April 2010

Figure 5: Distribution of dietary baseline caffeine exposure estimates for young males (19-24 yrs) .......................................................................................17
Figure 6: Estimated distribution of exposure for children (5-12 yrs) following the consumption of 1-4 retail units of energy drinks or energy shots. .......19
Figure 7: Estimated distribution of exposure for teenagers (13-19 yrs) following the consumption of 1-4 retail units of energy drinks or energy shots..20
Figure 8: Estimated distribution of exposure for young males (19-24 yrs) following the consumption of 1-4 retail units of energy drinks or energy shots. ..............................................................................................20
Figure 9: Cumulative probability curve of children (5-12 yrs) consuming 1-4 retail units of energy drinks or energy shots..........................................51
Figure 10: Cumulative probability curve of teenagers (13-19 yrs) consuming 1-4 retail units of energy drinks or energy shots..........................................52
Figure 11: Cumulative probability curve of young males (19-24 yrs) consuming 1-4 retail units of energy drinks or energy shots..............................................52
Risk Profile: Caffeine in energy drinks and energy shots April 2010

EXECUTIVE SUMMARY This Risk Profile addresses the risk from exposure to caffeine from energy drinks and energy shots available in New Zealand against a background dietary exposure from naturally occurring caffeine in foods and beverages and kola type soft drinks. In the New Zealand diet, caffeine occurs naturally in coffee, tea, cocoa and foods containing these ingredients. Caffeine may also be added to a range of beverages including energy drinks, energy shots, kola type soft drinks and alcoholic beverages. A total of 28 energy drinks and 16 energy shots were identified as available on the New Zealand market at February 2010. Caffeine has a range of adverse effects. Common acute adverse effects associated with stimulation of the central nervous system following caffeine ingestion include dizziness, rapid heartbeat, irritability, anxiety, tremors and insomnia. Irritation of the gastrointestinal tract can result in diarrhoea, nausea and/or vomiting. Single high doses of caffeine can affect the cardiovascular system causing rapid heart beat and high blood pressure. The risk of high blood pressure associated with coffee consumption may be higher in certain genotypes and in individuals with reduced liver function. Caffeine intake is associated with a slight deterioration in calcium balance, particularly if calcium intake is low. There is limited evidence for caffeine as a carcinogen but results are inconsistent and not conclusive. Caffeine consumption during pregnancy has been associated with an increased risk of foetal growth restriction. No studies have been reported for potential chronic effects of caffeine consumption by children. Tolerance to effects on blood pressure and heart rate, but not to sleep disturbance, develop quickly and virtually completely. Deaths attributed to caffeine consumption are rare. Moderate daily caffeine intake by healthy adults with adequate nutrition, up to 400 mg/day (5.7 mg/kg bw/day for a 70kg adult) is unlikely to result in adverse effects. Twenty calls relating to energy drinks and energy shots were recorded at the New Zealand National Poisons Centre in the five year period 2005 to 2009. Minimum and maximum self reported intakes that elicited symptoms of caffeine toxicity were 4.0 mg/kg and 35.5 mg/kg for persons 13 and 14 years of age respectively. There is currently no recognised reference health standard established for caffeine exposure, such as an Acceptable Daily Intake (ADI). An upper exposure of 2.5 mg/kg bw/day has been suggested as a cautious toxicological limit on which to base risk assessments for children, based on limited evidence. An adverse effect level of 3 mg/kg bw/day for adults is a conservative reference level based on limited evidence of acute anxiety effects. A reference level of 200 mg/day for pregnant women is used in this report and is based on recent evidence of foetal growth restriction. Baseline dietary exposure to caffeine (including coffee, tea, chocolate, kola type soft drinks and any foods containing these ingredients) was estimated for seven New Zealand population groups based on New Zealand caffeine concentration data for 52 foods and consumption information from the 1997 National Nutrition Survey and the 2002 Children’s Nutrition Survey. Most survey respondents consumed products containing caffeine on the surveyed day, with the proportion of caffeine consumers varying from 73 to 96 percent across the
Risk Profile:Caffeine in energy drinks and energy shots 1

seven population groups. Between two and 38 percent of New Zealand caffeine consumers were estimated to have a baseline dietary caffeine exposure above an adverse effect level of 3 mg/kg bw/day, depending on the population group to which they belonged. Retail units of energy drinks ranged from 250 to 600 ml resulting in caffeine exposures of 75 to 240 mg caffeine per retail unit. Energy shots ranged from 30 to 120 ml resulting in exposures of 10 to 300 mg caffeine per retail unit consumed. The estimated caffeine exposure following the consumption of energy drinks or energy shots was calculated for New Zealand children (5-12 yrs), teenagers (13-19 yrs) and young males (19-24 yrs). Scenarios were estimated for consumption of one, two, three or four retail units of any of the energy drinks or energy shots available in New Zealand. Our estimates indicate that approximately 70% of children and 40% of teenagers who consume caffeine are estimated to exceed an adverse effect level of 3 mg/kg bw/day after consumption of a single retail unit of an energy drink or energy shot in addition to a baseline dietary exposure. Areas of uncertainty are: further products on the market not identified, out-dated consumption and concentration information, inappropriate mapping and caffeine concentration data, weak evidence of adverse effects on which to base safety levels, lack of market share weighting in the risk scenario modeling, inappropriate assumptions with respect to energy drink and energy shot choices and the contribution of caffeinated alcoholic beverages to caffeine exposure. Risk management options include revision of regulations with respect to the composition and/or volume of energy drinks or energy shots and additional risk communication for children, teenagers, pregnant and caffeine sensitive individuals. The most significant data gap in this assessment is the lack of current information on consumption of energy drinks and energy shots. There is no current information on how many New Zealanders are consuming which energy drinks or energy shots or how much they are consuming. Further data gaps are the lack of independently verified caffeine levels in energy drinks and energy shots and evidence of health effects of frequent high caffeine intakes for children and adults. For these reasons the present risk to New Zealanders from energy drinks and energy shots cannot be accurately quantified.
Risk Profile:Caffeine in energy drinks and energy shots 2

GLOSSARY OF TERMS, ABBREVIATIONS AND ACRONYMS 1997 NNS The (New Zealand) National Nutrition Survey conducted in 1997. 2002 CNS The (New Zealand) National Children’s Nutrition Survey conducted in 2002. ADI Acceptable Daily Intake. The amount of a chemical that an individual
may consume on a daily basis over a lifetime with no adverse effect to health
caffeinated 1 A beverage to which caffeine has been added. May include energy beverage drink, energy shot, kola type soft drink or caffeinated alcoholic beverage. CNS Central Nervous System. energy drink1 A beverage containing added caffeine, vitamins and other bioactive
substances marketed in retail units typically between 250ml and 600ml.
energy shot1 A small volume liquid product containing added caffeine, vitamins and other bioactive substances. FCT New Zealand Food Composition Tables. FSANZ Food Standards Australia New Zealand. IARC International Agency for Research on Cancer kola type soft drink1 A flavoured carbonated beverage containing added caffeine. Caffeine
can be added to a maximum level of 145mg/l (Standard 1.3.1 of the Australia New Zealand Food Standards Code)
mg/kg bw/day A dosage unit of milligrams per kilogram body weight per day. NIP Nutrition Information Panel. NZFSA New Zealand Food Safety Authority. QFFQ Qualitative Food Frequency Questionnaire, a component of the 1997
NNS RMF Risk Management Framework. 1 definitions for the purposes of this report
Risk Profile:Caffeine in energy drinks and energy shots 3

1 STATEMENT OF PURPOSE The purpose of a Risk Profile is to provide contextual and background information relevant to a food/hazard combination so that risk managers can make decisions and, if necessary, take further action. Risk Profiles are part of the Risk Management Framework (RMF, http://www.nzfsa.govt.nz/about-us/risk-management-framework/index.htm) approach taken by the New Zealand Food Safety Authority (NZFSA). The Framework consists of a four step process, as shown in Figure 1.
Figure 1: The four steps of the Risk Management Framework
This initial step in the RMF, Preliminary Risk Management Activities, includes a number of tasks:
• identification of food safety issues • risk profiling • establishing broad risk management goals • deciding on the need for a risk assessment • if needed, setting risk assessment policy and commissioning of the risk assessment • considering the results of the risk assessment • ranking and prioritisation of the food safety issue for risk management action.
Risk profiling may be used directly by risk managers to guide identification and selection of risk management options, for example where:
• rapid action is needed • there is sufficient scientific information for action • embarking on a risk assessment is impractical.
The sections in this Risk Profile are organised as much as possible as they would be for a conventional qualitative risk assessment, including hazard and food, evaluation of adverse health effects, evaluation of risk, and availability of control measures.
Risk Profile:Caffeine in energy drinks and energy shots 4

1.1 Hazard/Food Combination and Risk Management Questions There is current public and regulatory concern regarding the exposure of children to caffeine from beverages to which caffeine has been added. There is now a wide range of energy drinks and energy shots available on the New Zealand market. NZFSA has commissioned this Risk Profile in order to address the following specific risk management question: Is any sub group of the New Zealand population at risk of adverse effects from the consumption of energy drinks or energy shots currently available in New Zealand? This Risk Profile considers the potential risk from the consumption of energy drinks and energy shots in addition to a background exposure from the more traditional food sources of caffeine, namely, coffee, tea, chocolate and kola type soft drinks.
Risk Profile:Caffeine in energy drinks and energy shots 5

2 HAZARD AND FOOD 2.1 Caffeine 2.1.1 Caffeine structure and nomenclature Caffeine (CAS 58-08-2) belongs to a class of compounds called methylxanthines. Its chemical structure is shown in Figure 2. Caffeine is found in many plant species and is believed to help protect the plant from insect pests (Nathanson, 1984).
CH3 CH3CH3
F
2 C(I Cvscu2 Gthlamr
R
N
N
N
OCH3
O
NH
N
NH
N
O
O
NCH3
N
N
N
OCH3
O
NCH3
e e
igure 2
.2 S
affeineARC, 1
affeinearietiespecies aontent ose (IAR006).
uaranaat mayrge amethylxa
ichest k
isk Profile
caffein
: Chemical structu
ources of Caffeine
is produced commerciall991).
is found in more than 60 that humans commonly nd typical levels of cafff plant materials may be aC, 1991). Caffeine cont
is used to refer both to t be used as an ingredient ounts of caffeine (4-8
nthines, theobromine andnown natural source of caf
:Caffeine in energy drinks and ene
res of caffeine, theobromine and
y by both extraction from plant m
plant species worldwide, althoueat (IARC, 1991; Steffen, 2000
eine found in them are summariffected by genetic and climatic fa
ent of tea leaves decreases with l
he plant Paullinia cupana and thin energy drinks. The berries of %), as well as significant a
theophylline (Figure 2) (Babu et feine (Walker et al., 2000).
rgy shots 6
theobromine
theo
ateri
gh th). In
sed inctors,eaf m
e extrthe gumounal., 20
theophyllin
phylline
al and by synthesis
ere are only a few formation on plant Table 1. Caffeine as well as fertiliser aturity (Yao et al.,
act from its berries arana plant contain ts of the related 08). Guarana is the
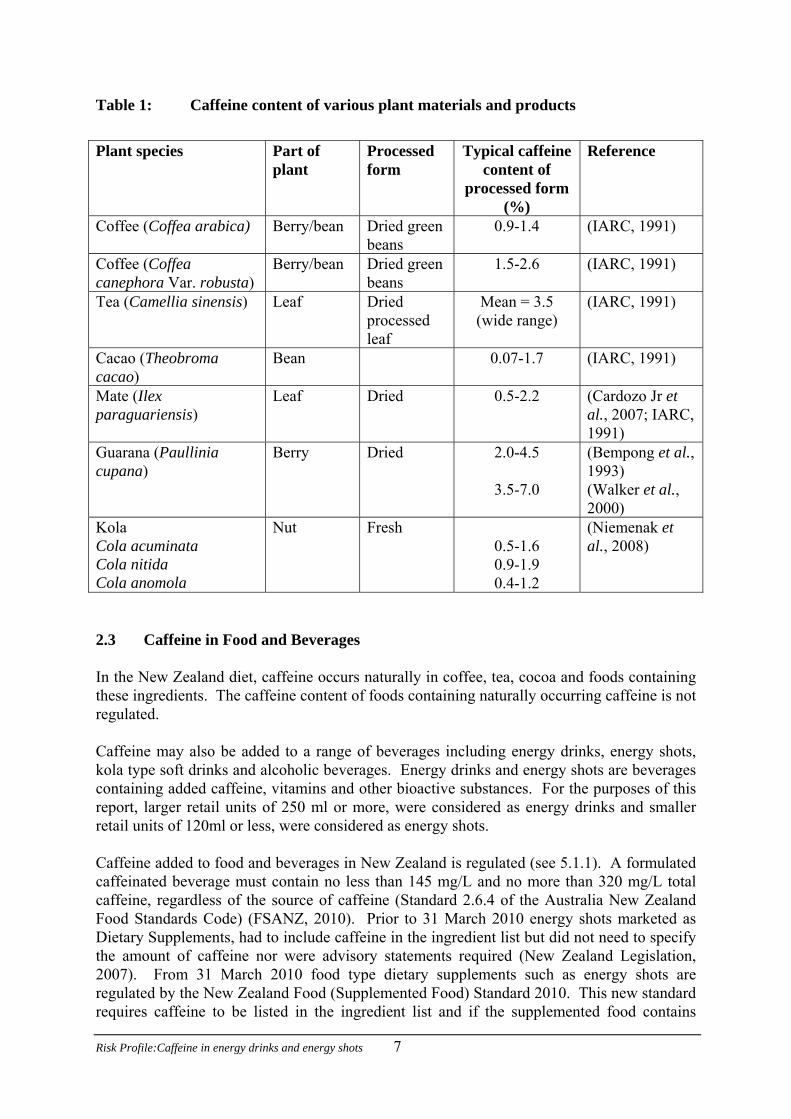
Table 1: Caffeine content of various plant materials and products
Plant species Part of
plant Processed form
Typical caffeine content of
processed form (%)
Reference
Coffee (Coffea arabica) Berry/bean Dried green beans
0.9-1.4 (IARC, 1991)
Coffee (Coffea canephora Var. robusta)
Berry/bean Dried green beans
1.5-2.6 (IARC, 1991)
Tea (Camellia sinensis) Leaf Dried processed leaf
Mean = 3.5 (wide range)
(IARC, 1991)
Cacao (Theobroma cacao)
Bean 0.07-1.7 (IARC, 1991)
Mate (Ilex paraguariensis)
Leaf Dried 0.5-2.2 (Cardozo Jr et al., 2007; IARC, 1991)
Guarana (Paullinia cupana)
Berry Dried 2.0-4.5
3.5-7.0
(Bempong et al., 1993) (Walker et al., 2000)
Kola Cola acuminata Cola nitida Cola anomola
Nut Fresh 0.5-1.6 0.9-1.9 0.4-1.2
(Niemenak et al., 2008)
2.3 Caffeine in Food and Beverages In the New Zealand diet, caffeine occurs naturally in coffee, tea, cocoa and foods containing these ingredients. The caffeine content of foods containing naturally occurring caffeine is not regulated. Caffeine may also be added to a range of beverages including energy drinks, energy shots, kola type soft drinks and alcoholic beverages. Energy drinks and energy shots are beverages containing added caffeine, vitamins and other bioactive substances. For the purposes of this report, larger retail units of 250 ml or more, were considered as energy drinks and smaller retail units of 120ml or less, were considered as energy shots. Caffeine added to food and beverages in New Zealand is regulated (see 5.1.1). A formulated caffeinated beverage must contain no less than 145 mg/L and no more than 320 mg/L total caffeine, regardless of the source of caffeine (Standard 2.6.4 of the Australia New Zealand Food Standards Code) (FSANZ, 2010). Prior to 31 March 2010 energy shots marketed as Dietary Supplements, had to include caffeine in the ingredient list but did not need to specify the amount of caffeine nor were advisory statements required (New Zealand Legislation, 2007). From 31 March 2010 food type dietary supplements such as energy shots are regulated by the New Zealand Food (Supplemented Food) Standard 2010. This new standard requires caffeine to be listed in the ingredient list and if the supplemented food contains
Risk Profile:Caffeine in energy drinks and energy shots 7
added caffeine greater than 145mg/L the level of caffeine and the advisory statements that apply to formulated caffeinated beverages regulated under Standard 2.6.4 of the Australia New Zealand Food Standards Code must be included on the label (NZFSA,2010). Kola type soft drinks, which include Cola, Coke, and Pepsi products, contain added caffeine. The maximum permissible level of caffeine in these soft drinks is 145 mg/L (mg/kg) (Standard 1.3.1, Schedule 1) (FSANZ, 2010). Kola type soft drinks have been included in background exposure to caffeine within this Risk Profile. The global energy drink market was 3.9 billion litres in 2008 and the market has shown 14% growth over the period 2003 to 2008. Consumption per person, globally, has risen from 0.4 litres in 2003 to 0.8 litres in 2008. North America is the leading region with a 37% share of global volume, followed by Asia Pacific with 30% share, and West Europe with 15% (Zenith, 2010). 2.4 Exposure Assessment Exposure to caffeine from added caffeine in energy drinks and energy shots occurs against a background exposure from naturally occurring caffeine and kola type soft drinks. 2.4.1 Caffeine concentrations in New Zealand foods and beverages from natural sources
and kola type soft drinks Data on the caffeine content of non-alcoholic beverages, chocolate or cocoa flavoured foods and confectionery are reported in the New Zealand Food Composition Tables (Lesperance, 2009). Most of these data were sourced, or derived, from Australian analytical data (42/48) except for two foods (Milo made with water and self-saucing chocolate pudding) that were calculated from New Zealand data, and three foods (espresso brewed coffee, chocolate éclairs and McDonalds sundae) that were derived from a United States Department of Agriculture database (FOODfiles, 2006). Caffeine concentrations per 100 g (or 100 ml) and caffeine content per serving of food are shown in Appendix 1. 2.4.2 New Zealand data for dietary caffeine concentrations compared with overseas data A compilation of caffeine levels reported in the open literature, for overseas countries, is shown in Appendix 2. Whilst the majority of these data are from publications in the peer reviewed scientific literature, some government website (NSW Food Authority, 2009) and industry supplied data on caffeine content of energy drinks is also included (Meltzer et al., 2008). A comparison of the New Zealand and international concentration data for the caffeine content of foods and beverages shows reasonable consistency except for the concentrations of caffeine per serving of latte and espresso (Appendices 1 and 2). For these beverages, the New Zealand levels per serve appear unrealistically high. The New Zealand values for caffeine per serve are extrapolated from a concentration per 100g to a serve of 272 ml (i.e. the caffeine concentration per 100g is multiplied by 272/100). It is likely a serve of latte or espresso is equivalent to a coffee shot, typically of 50-100 mg per shot, rather than a
Risk Profile:Caffeine in energy drinks and energy shots 8

multiplication factor based on volume. This may account for the apparent difference between New Zealand and overseas data for these two beverages. The caffeine content of coffee and tea beverages varies greatly depending on the preparation of the beverage. McCusker et al. (2003, 2006) reported variabilities expressed as coefficient of variation of 81% and 34% for the caffeine content of the same coffee purchased from the same outlet on different occasions. A comprehensive study of caffeine levels in 400 samples of teas, instant and ground coffee beverages as consumed, was undertaken by the UK Food Standards Agency in 2004. These samples were collected from family homes, workplaces, cafes and restaurants from 10 areas over the UK and measured by validated methodology. This data set provides robust data on the variability of caffeine concentrations, as likely to be encountered by the consumer (FSA, 2004). 2.4.3 New Zealand caffeinated beverages Information on caffeinated beverages available in New Zealand, and their claimed caffeine content was retrieved by browsing retail outlets, representing both the major supermarket companies, namely Progressive and Foodstuffs, two independent outlets (dairies), two petrol service station outlets and four liquor outlets in Christchurch, augmented with information from NZFSA (Ursula Egan, NZFSA, personal communication, October 2009). Further information was sourced from the Manufactured Food Database (Alannah Steeper, Manufactured Food Database, personal communication, October 2009) from the Energy Fiend website (Energy Fiend, 2009) and other New Zealand websites relating to specific products. The availability of drinks was also confirmed against those analysed by the NSW Food Authority (Ursula Egan, NZFSA, personal communication, October 2009). As independent analytical data were not available, information on the claimed caffeine content of energy drinks and energy shots are summarised in Table 2. Information on the claimed caffeine content of caffeinated alcoholic beverages and kola type soft drinks are shown in Table 3. A total of 64 products containing added caffeine were identified as available on the New Zealand market at the present time. These comprised energy drinks (28), energy shots (16), caffeinated alcoholic beverages (5) and kola type soft drinks (15) including multiple flavours and sugar free options when available. In addition, and excluded from product summaries, some products are available in more than one retail unit volume. The caffeinated beverage market is dynamic with online purchasing available. It is possible that additional products are currently being sold in New Zealand that were not captured in this report. Retail units of energy drinks ranged from 250 to 600 ml resulting in caffeine exposures of 75 to 240 mg caffeine per retail unit consumed. Energy shots ranged from 30 to 120 ml resulting in exposures of 10 to 300 mg caffeine per retail unit consumed. The caffeine dose per retail unit consumed was similar for energy drinks and energy shots. Caffeinated alcoholic beverages ranged in volume from 250 to 300 ml. These products claimed to contain between 7 and 32 mg/100ml of caffeine. Consumption of any one of these five products would provide between 21 and 96 mg caffeine per retail unit consumed.
Risk Profile:Caffeine in energy drinks and energy shots 9
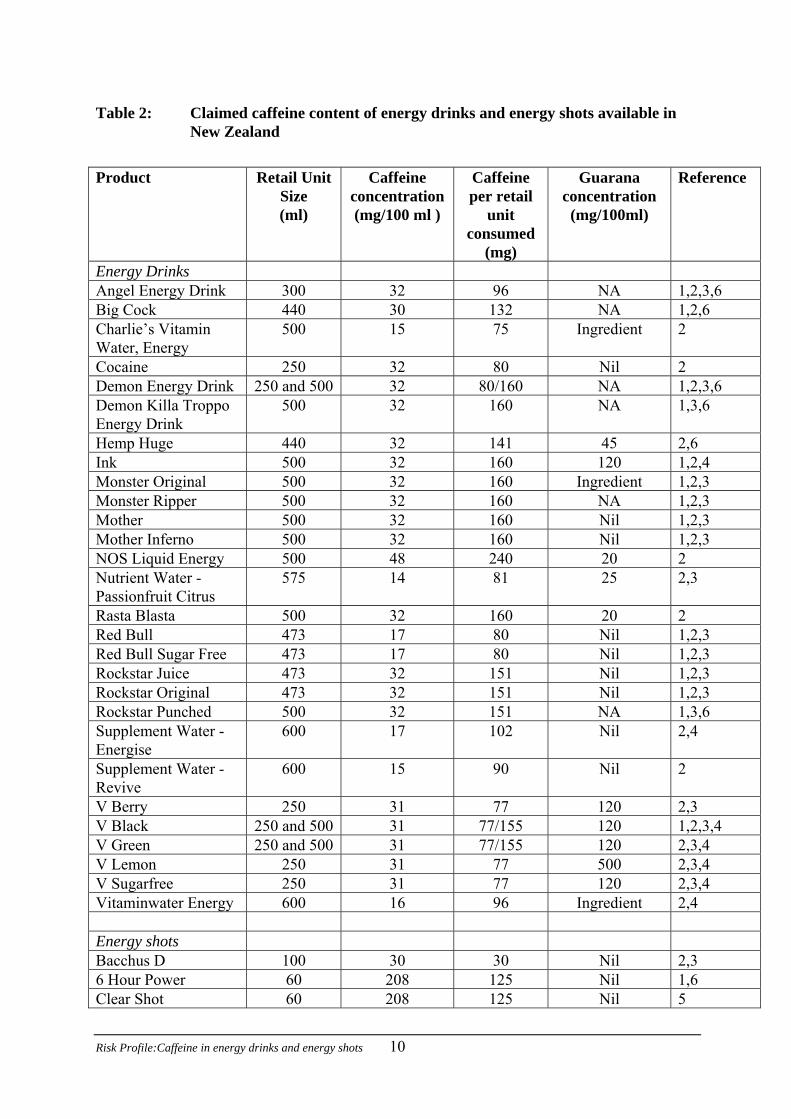
Table 2: Claimed caffeine content of energy drinks and energy shots available in New Zealand
Product Retail Unit
Size (ml)
Caffeine concentration (mg/100 ml )
Caffeine per retail
unit consumed
(mg)
Guarana concentration (mg/100ml)
Reference
Energy Drinks Angel Energy Drink 300 32 96 NA 1,2,3,6 Big Cock 440 30 132 NA 1,2,6 Charlie’s Vitamin Water, Energy
500 15 75 Ingredient 2
Cocaine 250 32 80 Nil 2 Demon Energy Drink 250 and 500 32 80/160 NA 1,2,3,6 Demon Killa Troppo Energy Drink
500 32 160 NA 1,3,6
Hemp Huge 440 32 141 45 2,6 Ink 500 32 160 120 1,2,4 Monster Original 500 32 160 Ingredient 1,2,3 Monster Ripper 500 32 160 NA 1,2,3 Mother 500 32 160 Nil 1,2,3 Mother Inferno 500 32 160 Nil 1,2,3 NOS Liquid Energy 500 48 240 20 2 Nutrient Water - Passionfruit Citrus
575 14 81 25 2,3
Rasta Blasta 500 32 160 20 2 Red Bull 473 17 80 Nil 1,2,3 Red Bull Sugar Free 473 17 80 Nil 1,2,3 Rockstar Juice 473 32 151 Nil 1,2,3 Rockstar Original 473 32 151 Nil 1,2,3 Rockstar Punched 500 32 151 NA 1,3,6 Supplement Water - Energise
600 17 102 Nil 2,4
Supplement Water - Revive
600 15 90 Nil 2
V Berry 250 31 77 120 2,3 V Black 250 and 500 31 77/155 120 1,2,3,4 V Green 250 and 500 31 77/155 120 2,3,4 V Lemon 250 31 77 500 2,3,4 V Sugarfree 250 31 77 120 2,3,4 Vitaminwater Energy 600 16 96 Ingredient 2,4 Energy shots Bacchus D 100 30 30 Nil 2,3 6 Hour Power 60 208 125 Nil 1,6 Clear Shot 60 208 125 Nil 5
Risk Profile:Caffeine in energy drinks and energy shots 10

Product Retail Unit Size (ml)
Caffeine concentration (mg/100 ml )
Caffeine per retail
unit consumed
(mg)
Guarana concentration (mg/100ml)
Reference
Demon Citrus Blast 60 333 200 12 2,3 Demon Tropical Punch’d
60 333 200 12 2,3
Monster Hitman 89 Ingredient NA Ingredient 2 NOS Energy Shot 60 416 250 NA 1,6 NOS High Octane 60 333 200 12 2 NOS Supercharged 60 333 200 12 2 Octane 30 33 10 Nil 1,2 Octane Citrus 30 50 15 Nil 2 Reckless Energy Shot 70 178 125 NA 1,6 Red Bull Energy Shot 60 133 80 Nil 1,2,3 Top Flight 60 Ingredient NA Nil 5 V Pocket Rocket Energy Shot
60 267 160 Nil 1,2
X Shot 120 250 300 20 5 NA = not available, Nil = none present, Ingredient = present, but amount not specified 1=Energy Fiend, 2009, A website run by caffeine enthusiasts James Foster and Ted Kallmyer, owned by Exis Holdings Limited, a New Zealand corporation that is neither a beverage manufacturer nor lobby group. Caffeine amounts reported on this website were obtained from brand websites, nutrition panels or directly from beverage manufacturers. The site includes links to a number of scientific papers, consumer reports, and governmental sources or reports. 2=Christchurch retail outlets 3=Included in NSW study, October 2009 4=Alannah Steeper, Manufactured Foods Database, personal communication, identifies caffeine and guarana as ingredients but not amounts 5=Ursula Egan, NZFSA, personal communication, 9 November, 2009. 6=New Zealand company websites
Risk Profile:Caffeine in energy drinks and energy shots 11
Risk Profile:Caffeine in energy drinks and energy shots 12
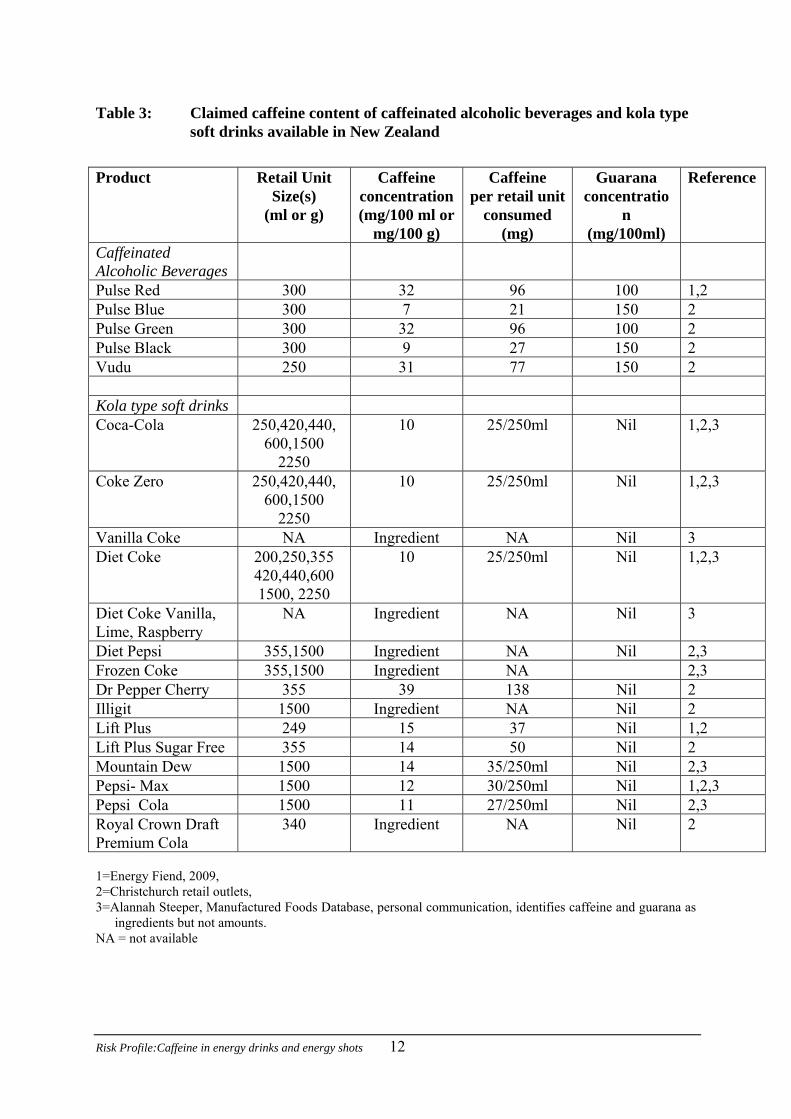
Table 3: Claimed caffeine content of caffeinated alcoholic beverages and kola type soft drinks available in New Zealand
Product Retail Unit
Size(s) (ml or g)
Caffeine concentration (mg/100 ml or
mg/100 g)
Caffeine per retail unit
consumed (mg)
Guarana concentratio
n (mg/100ml)
Reference
Caffeinated Alcoholic Beverages
Pulse Red 300 32 96 100 1,2 Pulse Blue 300 7 21 150 2 Pulse Green 300 32 96 100 2 Pulse Black 300 9 27 150 2 Vudu 250 31 77 150 2 Kola type soft drinks Coca-Cola 250,420,440,
600,1500 2250
10 25/250ml Nil 1,2,3
Coke Zero 250,420,440, 600,1500
2250
10 25/250ml Nil 1,2,3
Vanilla Coke NA Ingredient NA Nil 3 Diet Coke 200,250,355
420,440,600 1500, 2250
10 25/250ml Nil 1,2,3
Diet Coke Vanilla, Lime, Raspberry
NA Ingredient NA Nil 3
Diet Pepsi 355,1500 Ingredient NA Nil 2,3 Frozen Coke 355,1500 Ingredient NA 2,3 Dr Pepper Cherry 355 39 138 Nil 2 Illigit 1500 Ingredient NA Nil 2 Lift Plus 249 15 37 Nil 1,2 Lift Plus Sugar Free 355 14 50 Nil 2 Mountain Dew 1500 14 35/250ml Nil 2,3 Pepsi- Max 1500 12 30/250ml Nil 1,2,3 Pepsi Cola 1500 11 27/250ml Nil 2,3 Royal Crown Draft Premium Cola
340 Ingredient NA Nil 2
1=Energy Fiend, 2009, 2=Christchurch retail outlets, 3=Alannah Steeper, Manufactured Foods Database, personal communication, identifies caffeine and guarana as
ingredients but not amounts. NA = not available
Risk Profile:Caffeine in energy drinks and energy shots 13
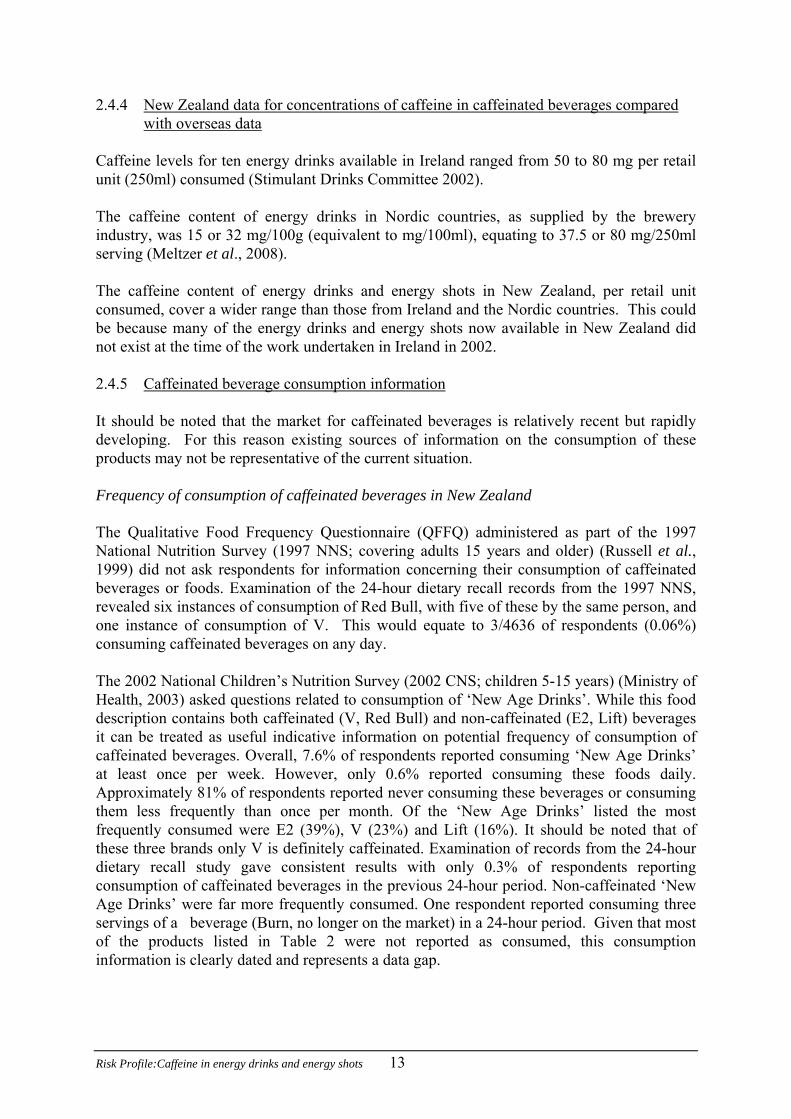
2.4.4 New Zealand data for concentrations of caffeine in caffeinated beverages compared with overseas data
Caffeine levels for ten energy drinks available in Ireland ranged from 50 to 80 mg per retail unit (250ml) consumed (Stimulant Drinks Committee 2002). The caffeine content of energy drinks in Nordic countries, as supplied by the brewery industry, was 15 or 32 mg/100g (equivalent to mg/100ml), equating to 37.5 or 80 mg/250ml serving (Meltzer et al., 2008). The caffeine content of energy drinks and energy shots in New Zealand, per retail unit consumed, cover a wider range than those from Ireland and the Nordic countries. This could be because many of the energy drinks and energy shots now available in New Zealand did not exist at the time of the work undertaken in Ireland in 2002. 2.4.5 Caffeinated beverage consumption information It should be noted that the market for caffeinated beverages is relatively recent but rapidly developing. For this reason existing sources of information on the consumption of these products may not be representative of the current situation. Frequency of consumption of caffeinated beverages in New Zealand The Qualitative Food Frequency Questionnaire (QFFQ) administered as part of the 1997 National Nutrition Survey (1997 NNS; covering adults 15 years and older) (Russell et al., 1999) did not ask respondents for information concerning their consumption of caffeinated beverages or foods. Examination of the 24-hour dietary recall records from the 1997 NNS, revealed six instances of consumption of Red Bull, with five of these by the same person, and one instance of consumption of V. This would equate to 3/4636 of respondents (0.06%) consuming caffeinated beverages on any day. The 2002 National Children’s Nutrition Survey (2002 CNS; children 5-15 years) (Ministry of Health, 2003) asked questions related to consumption of ‘New Age Drinks’. While this food description contains both caffeinated (V, Red Bull) and non-caffeinated (E2, Lift) beverages it can be treated as useful indicative information on potential frequency of consumption of caffeinated beverages. Overall, 7.6% of respondents reported consuming ‘New Age Drinks’ at least once per week. However, only 0.6% reported consuming these foods daily. Approximately 81% of respondents reported never consuming these beverages or consuming them less frequently than once per month. Of the ‘New Age Drinks’ listed the most frequently consumed were E2 (39%), V (23%) and Lift (16%). It should be noted that of these three brands only V is definitely caffeinated. Examination of records from the 24-hour dietary recall study gave consistent results with only 0.3% of respondents reporting consumption of caffeinated beverages in the previous 24-hour period. Non-caffeinated ‘New Age Drinks’ were far more frequently consumed. One respondent reported consuming three servings of a beverage (Burn, no longer on the market) in a 24-hour period. Given that most of the products listed in Table 2 were not reported as consumed, this consumption information is clearly dated and represents a data gap.

Risk Profile:Caffeine in energy drinks and energy shots 14
Consumption of caffeinated beverages overseas A 1994 German study of 1265 children aged between 10 and 19 years, indicated that 40% of children aged 10-13 years had tasted stimulant drinks (equivalent to an energy drink or energy shot in this report), with 23% drinking on average one 250 ml can of a stimulant drink per week (Stimulant Drinks Committee, 2002). An Austrian survey in 1999 reported that 45% of respondents 15-50 years had consumed one or more cans of Red Bull during the previous week (Stimulant Drinks Committee, 2002). In an Australian study of 381 children, 27% of males and 12% of females aged between 8 and 13 years old reported having tasted stimulant drinks (O'Dea and Rawstorne, 2000). A study of 1260 individuals, 11-35 year olds, undertaken in Ireland showed that 10% of respondents were regular consumers, with the highest prevalence among those aged 19-24 years (Stimulant Drinks Committee, 2002). The weekly consumption for this group was approximately three cans among consumers, rising to about eight cans among the highest consumers. Similar quantities were consumed in single sessions, suggesting that weekly consumption took place in a single session. This latter finding is important when modelling various consumption scenarios. For the Irish study group, stimulant drinks were frequently consumed with alcohol. 2.4.6 New Zealand baseline dietary exposure estimate for caffeine New Zealand dietary exposures were estimated for seven population groups using published techniques (Thomson, 2009). Concentration data of foods and beverages containing caffeine (including tea, coffee, chocolate and kola type soft drinks) (Appendix 1) were combined with 24 hour diet recall information from the 1997 NNS and the 2002 CNS using Microsoft Foxpro software. Details of the exposure assessment are provided in Appendix 3. Most respondents consumed caffeine containing products (Table 4).
Table 4: Respondent numbers and proportion (%) of caffeine consumers for exposure estimates
Children 5-12 yrs
Teenagers 13-19 yrs
Young males
19-24 yrs
Adults 20-64 yrs
*
Older people 65+ yrs
Females 16-44 yrs
*
Females 16-44 yrs pregnant
# respondents 2579 803 141 3282 774 1388 64 % respondents consuming caffeine 73 79 78 95 96 92 86
* excluding pregnant women
Exposure estimates for those respondents who consumed caffeine within seven population groups are shown in Table 5.

Risk Profile:Caffeine in energy drinks and energy shots 15
Table 5: Dietary baseline caffeine exposure estimates for various New Zealand population groups (mg/day).
Children 5-12 yrs
Teenagers 13-19 yrs
Young males
19-24 yrs
Adults 20-64 yrs*
Older people 65+ yrs
Females 16-44 yrs*
Females 16-44 yrs pregnant
Mean 20 82 277 236 156 226 125 Median 7 41 148 180 140 149 57 Min <1 <1 <1 <1 <1 <1 <1 Max 644 2664 2220 3785 1998 3256 795 P5 1 1 1 22 33 8 0 P95 74 294 1080 666 354 623 479
P5=5th percentile and P95 = 95th percentiles, representing low and high consumers respectively. * excluding pregnant women Since the adverse effect level is expressed in mg/kg bw/day, except for pregnant women, exposure was also calculated in mg/kg bw/day by dividing the exposure (mg/day) by the body weight for each individual (Table 6).
Table 6: Dietary baseline caffeine exposure estimates for caffeine consumers for various New Zealand population groups (mg/kg bw/day)
Children
5-12 yrs
Teenagers13-19 yrs
Young males
19-24 yrs
Adults 20-64 yrs
*
Older people 65+ yrs
Females 16-44 yrs*
Females 16-44 yrs pregnant
Mean 0.6 1.2 3.5 3.5 2.3 3.4 NA P95 2.0 4.5 14.4 9.1 5.3 9.6 NA
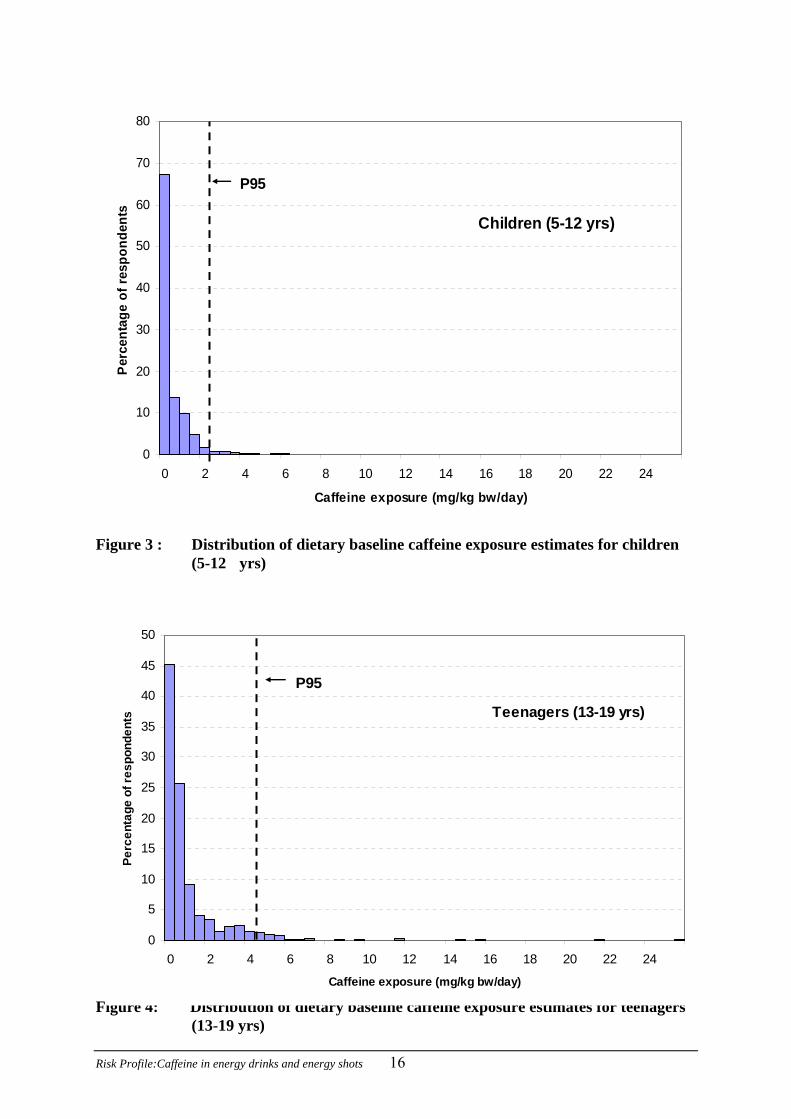
NA = not available because of changing weight during pregnancy. P95 = 95th percentile and represents a high consumer. * excluding pregnant women The distribution of exposure estimates for each population groups was skewed, with more people having exposures lower than the mean value. This is shown graphically for three population groups (Figures 3-5) with the 95th percentile exposure shown as a reference point.
0
10
20
30
40
50
60
70
80
0 2 4 6 8 10 12 14 16 18 20 22 24
Caffeine exposure (mg/kg bw/day)
Per
cent
age
of r
espo
nden
ts
P95
Children (5-12 yrs)
Figure 3 : Distribution of dietary baseline caffeine exposure estimates for children (5-12 yrs)
Risk Profile:Caffeine in energy drinks and energy shots 16
Figure 4: Distribution of dietary baseline caffeine exposure estimates for teenagers (13-19 yrs)
0
5
10
15
20
25
30
35
40
45
50
0 2 4 6 8 10 12 14 16 18 20 22 24
Caffeine exposure (mg/kg bw/day)
Perc
enta
ge o
f res
pond
ents
P95
Teenagers (13-19 yrs)

Risk Profile:Caffeine in energy drinks and energy shots 17
0
5
10
15
20
25
0 2 4 6 8 10 12 14 16 18 20 22 24 26
Caffeine exposure (mg/kg bw/day)
Perc
enta
ge o
f res
pond
ents
P95
Young Male (19-24 yrs)
Figure 5: Distribution of dietary baseline caffeine exposure estimates for young males (19-24 yrs)
2.4.7 Overseas estimates of caffeine exposure Details of estimated caffeine exposures reported in the scientific literature are given in Appendix 4. Average caffeine consumption in the United States and Canada varied from 0.4 to 1 mg/kg bw/day for children, and 1.8 to 3 mg/kg bw/day for adults (Babu et al., 2008; Frary et al., 2005). Average intakes in Argentina were around 1 mg/kg bw/day for children, 3 mg/kg bw/day for teenagers and up to 5 mg/kg bw/day for adults with high consumers estimated to consume up to 13 mg/kg bw/day (Olmos et al., 2009). The average consumption of caffeine in Brazil, across all population groups from 10 to over 60 years was 2.7 mg/kg bw/day (Rojo Carmargo, 1999). In Denmark, average consumption for children and older teenagers (15-19 yrs) was 0.6 and 2.1 mg/kg bw/day respectively. Danish adults consumed, on average about 8 mg/kg bw/day of caffeine with high consumers up to 18 mg/kg bw/day (Barone and Roberts, 1996). Estimates from the UK (1988) were 2 mg/kg bw/day for children and teenagers and about 4.5 mg/kg bw/day for adults, with high consumers exposed to around 8 mg/kg bw/day. 2.4.8 Comparison of New Zealand dietary caffeine exposures with overseas estimates The New Zealand estimates for average caffeine intake by children are similar to those from the USA (Frary et al., 2005) and Denmark (Barone and Roberts, 1996) but lower than those for Argentina (Olmos et al., 2009) and the UK where mate (a traditional South American drink made from infused dried mate leaves), coffee and tea account for major contributions to

Risk Profile:Caffeine in energy drinks and energy shots 18
caffeine exposure. For adults, the New Zealand estimates are higher than the more recent assessments from the USA (Frary et al., 2005), similar to those from the UK (Barone and Roberts, 1996), and lower than those for European and South American countries where a coffee culture is more traditional (Barone and Roberts, 1996, Olmos et al., 2009, Rojo Camargo, 1999). The estimate of average caffeine exposure for New Zealand pregnant women (125 mg/day) is in near agreement with the more recent estimate from the UK (159 mg/day) (CARE Study Group, 2008). 2.4.9 Major contributing foods The major contributing foods for each population group were calculated by summing the caffeine exposure from each food across all consumers in each population group (mg/day) and expressing that sum as a percentage of total caffeine exposure for that population group. The individual foods were grouped into nine broader groups. The relative contributions of these food groups are shown in Table 7. The 13-15 year and 15-19 year teenagers are presented as two different groups as their consumption information came from two different surveys. For children (5-12 yrs) and younger teenagers (13-15 yrs), caffeine exposure was mostly from tea and kola type soft drinks with a lesser contribution from coffee. For older teenagers (15-19 yrs) interviewed in the 1997 NNS, and all adults, coffee was the major contributor to caffeine exposure followed by tea. Older people had a greater contribution to caffeine exposure from tea than for other adult population groups but coffee was still the highest contributing food for older people.
Table 7: Percentage contributions of caffeine containing foods to caffeine dietary exposure for different population groups
Food Children
5-12 yrs Teenagers 13-15 yrs
Teenagers15-19 yrs
Young males
19-24 yrs
Adults 20-64 yrs
*
Older people 65+ yrs
Females 16-44 yrs
*
Females 16-44 yrspregnant
Biscuits, cakes, pastries
11 6 1 <1 <1 <1 <1 1
Cereal <1 <1 <1 <1 <1 <1 <1 <1 Choc desserts 1 <1 <1 <1 <1 <1 <1 <1 Chocolate confectionery
6 4 1 <1 <1 <1 <1 1
Cocoa & choc drinks 7 4 1 1
<1 <1 1 <1
Coffee 10 23 73 83 75 61 76 57 Energy drink 2 3 <1 1 <1 <1 <1 <1 Soft drinks 30 32 13 10 3 0 3 2 Tea 32 29 10 5 20 38 19 39 Those food groups contributing 10 or more percent to total caffeine exposure are bolded. * excluding pregnant women

2.4.10 Potential caffeine exposures from ingestion of energy drinks and energy shots, additional to a baseline dietary exposure for children, teenagers and young males
The exposure to additional caffeine from the consumption of energy drinks and energy shots was calculated for children (5-12 yrs), teenagers (13-19yrs) and young males (19-24 yrs). Scenarios were estimated for one, two, three or four retail units of any of the energy drinks and energy shots identified in Table 2 for which caffeine concentration data were available. Details of the exposure methodology are provided in Appendix 3. Caffeinated alcoholic beverages were not included since these are not legally available for purchase by young people aged less than 18 years. The distributions of exposures are illustrated in Figures 6-8, for scenarios of one, two, three or four energy drinks or energy shots in addition to baseline dietary caffeine exposure. An adverse effect level of 3 mg/kg bw/day was used as a basis for risk evaluation (see 4.1.1 for details). The area under each curve to the right of the adverse effect line represents the proportion of consumers potentially at risk from adverse effects of caffeine or the probability of a random consumer exceeding the adverse effect level. As expected, there is a much wider range of exposures when four retail units are consumed than for consumption of a single retail unit. An alternative representation of consumers that are potentially at risk is illustrated by cumulative probability curves (Appendix 5).
Children (5-12 yrs)
0
0.02
0.04
0.06
0.08
0.1
0.12
0.14
0.16
0 5 10 15 20 25 30 35 40 45
Caffeine exposure (mg/kg bw/day)
Rel
ativ
e fre
quen
cy
1 Retail unit2 Retail units3 Retail units4 Retail units
3 mg/kg bw/day
Figure 6: Estimated distribution of exposure for children (5-12 yrs) following the
consumption of 1-4 retail units of energy drinks or energy shots.
Risk Profile:Caffeine in energy drinks and energy shots 19

Teenagers (13-19 yrs)
0
0.05
0.1
0.15
0.2
0.25
0.3
0 5 10 15 20 25
Caffeine exposure (mg/kg bw/day)
Rel
ativ
e fre
quen
cy
1 Retail unit2 Retail units3 Retail units4 Retail units
3 mg/kg bw/day
Figure 7: Estimated distribution of exposure for teenagers (13-19 yrs) following the
consumption of 1-4 retail units of energy drinks or energy shots.
Young male (19-24 yrs)
0
0.05
0.1
0.15
0.2
0.25
0 2 4 6 8 10 12 14 16 18 20
Caffeine exposure (mg/kg bw/day)
Rel
ativ
e fre
quen
cy
1 Retail unit2 Retail units3 Retail units4 Retail units
3 mg/kg bw/day
Figure 8: Estimated distribution of exposure for young males (19-24 yrs) following
the consumption of 1-4 retail units of energy drinks or energy shots.
Risk Profile:Caffeine in energy drinks and energy shots 20

Risk Profile:Caffeine in energy drinks and energy shots 21
The impact of consumption of energy drinks and/or energy shots on mean and 95th percentile caffeine exposures is tabulated in Table 8.
Table 8: Mean and 95th percentile (P95) daily baseline caffeine exposures (mg/kg bw/day) of New Zealand children, teenagers and young males and potential additional exposures if 1-4 retail units of energy drinks or energy shots are consumed
Children
5-12 yrs Teenagers 13-19 yrs
Young males 19-24 yrs
Mean P95 Mean P95 Mean P95 Baseline 0.6 2.0 1.2 4.5 3.5 14.4 Baseline + 1 retail unit
4.4 9.1 3.2 6.9 5.1 16.9
Baseline + 2 retail units
8.3 17.2 5.2 10.3 6.8 18.1
Baseline + 3 retail units
12.2 25.3 7.2 14.0 8.4 19.7
Baseline + 4 retail units
16.0 33.6 9.2 17.8 10.0 22.1
The mean baseline dietary exposure of children and teenagers to caffeine is low compared with the contribution from the consumption of energy drinks or energy shots. An individual child (5-12 years), teenager (13-19 years) and young male (19-24 years) would all, on average, exceed the adverse effect level (3 mg/kg bw/day) from a single retail unit of energy drink or energy shot consumed over and above a baseline dietary caffeine exposure.

Risk Profile:Caffeine in energy drinks and energy shots 22
3 EVALUATION OF ADVERSE HEALTH EFFECTS 3.1 Absorption, Distribution and Pharmacokinetics Following ingestion, caffeine is rapidly absorbed from the gastrointestinal tract with 99% of ingested caffeine absorbed in humans within 45 minutes after ingestion. Absorption is less complete when caffeine is consumed as coffee (Fredholm et al., 1999). Ingestion of a single cup of coffee provides a dose of 0.4 to 2.5 mg/kg and peak plasma caffeine concentration is reached within 1-1.5 hours of ingestion. Absorbed caffeine is readily distributed throughout the entire body. It passes across the blood-brain barrier, through the placenta into amniotic fluid and the foetus, and into breast milk. Caffeine has also been detected in semen (Nawrot et al., 2003). Saliva concentrations of caffeine reach 65 to 85% of plasma concentrations (Fredholm et al., 1999). Caffeine is metabolised in the liver. In adults, virtually all caffeine is metabolized to 1-methylxanthine and 1-methyluric acid from a paraxanthine intermediate. Some metabolites, including paraxanthine are pharmacologically active (Nawrot et al., 2003). Caffeine half-lives range from 2.5 to 4.5 hours in humans with no differences in caffeine half-life with age except for newborns, due to their lower cytochrome P-450 activity and the immaturity of some metabolic pathways. In adult males, caffeine half-life is reduced by 30 to 50% (disappears more quickly) in smokers compared with non smokers, whereas it is approximately doubled in women taking oral contraceptives (Fredholm et al., 1999). 3.2 Adverse Effects Caffeine has a range of pharmacological and psychological effects both beneficial (increased energy, alertness, motivation and concentration) and potentially harmful. The prevalence of caffeine consumption has stimulated both public and scientific interest in potential adverse effects of caffeine and a number of extensive reviews have been published (Nawrot et al., 2003; Smith et al., 2000; Stimulant Drinks Committee, 2002). This section draws on the findings of these reviews with reference to more recent publications where appropriate. The most important mechanism of action of caffeine is the competitive binding to adenosine receptors, resulting in the release of norepinephrine, dopamine and serotonin in the brain and the increase of circulating catecholamines (Nawrot et al., 2003). 3.2.1 General adverse effects Ingested caffeine may also irritate the gastrointestinal tract resulting in diarrhoea, nausea and vomiting (Durrant, 2002; Nawrot et al., 2003). Caffeine may reduce bladder control for women (Nawrot et al., 2003). 3.2.2 Central nervous system effects The most significant effect of caffeine is its role as a potent stimulant of the central nervous system (CNS) although its effects are generally milder and of shorter duration than those of amphetamines (Durrant, 2002). Common adverse effects associated with excessive CNS stimulation from caffeine ingestion include dizziness, rapid heartbeat, irritability, anxiety, tremors and insomnia (Durrant, 2002; Nawrot et al., 2003).

Risk Profile:Caffeine in energy drinks and energy shots 23
3.2.3 Cardiovascular effects A single high dose of caffeine (4-6 mg/kg/day, equating to 300-400 mg for an average male) can cause tachycardia (abnormally rapid heartbeat) and increased blood pressure (Stimulant Drinks Committee, 2002). The evidence for an association between habitual caffeine intake and cardiovascular disease is less clear (Stimulant Drinks Committee, 2002). Nawrot et al. (2003) concluded that moderate caffeine intake (≤ 400 mg/day) does not adversely affect cardiovascular health but that there was insufficient evidence to draw conclusions about the risk of cardiovascular effects associated with high caffeine consumption (≥ 1000mg/day). In a recent review of experimental and epidemiological studies, Riksen et al., (2009) postulated that coffee drinking (as a major source of caffeine) may have an acute effect in triggering coronary events, rather than a chronic effect of promoting the development of atheroscelerosis in the general population. The risk of high blood pressure associated with coffee consumption varies according to genotype. Individuals with a slow CYP1A2 allele (the key enzyme in caffeine metabolism) are at increased risk of hypertension from coffee whereas individuals with a fast CYP1A2 allele are not (Palatini et al., 2009). Whilst the causal link between genotype and hypertension in this study was clinically based, the association with coffee or caffeine was based on a dietary questionnaire and warrants confirmation. Limited evidence of the prevalence of slow and fast CYP1A2 alleles in the general population was found. In a single study of 229 healthy Chinese, 5% of subjects were poor CYP1A2 metabolizers (Ou-Yang et al., 2000). Assuming “poor” equates to “slow” and a similar prevalence applies to the New Zealand population, 5% of individuals may be at increased risk of acute coronary effects from coffee consumption. 3.2.4 Mutagenicity, carcinogenicity Although caffeine was reported to induce mutations and inhibit DNA repair in a number of microorganisms and cell lines, it is considered unlikely that at normal levels of exposure, caffeine would result in mutagenic effects in humans (Nawrot et al., 2003). In 1991, the International Agency for Research on Cancer concluded that caffeine was not classifiable as to carcinogenicity of caffeine to humans (Group3) (IARC, 1991). Caffeine exposure, as measured by coffee consumption, has been associated with cancer development at some, but not all sites. Overall, the evidence indicates that caffeine, as present in coffee, does not cause bowel cancer. The evidence for caffeine as a carcinogen for bladder and pancreatic cancer is inconsistent and not conclusive. At other sites (ovary, stomach, liver) data are insufficient to conclude that caffeine consumption is related to carcinogenesis (Nawrot et al., 2003). More recently Tang et al. (2009) concluded a possible influence of high coffee consumption or increased coffee consumption, on the risk of breast cancer, although the meta analysis is not compelling. Overall, Nawrot et al. (2003) concluded that caffeine is not likely to be a human carcinogen when consumed at <500mg/day. 3.2.5 Pregnancy outcomes and reproductive effects Caffeine consumption above 200 mg/day was associated with an increased risk of fetal growth restriction (generally measured as low birth weight) with a significant trend for greater reduction in birth weight with higher caffeine intake. This finding held after accounting for maternal age, weight, height, ethnicity, parity, duration of gestation, sex, maternal smoking status and alcohol consumption (CARE Study Group, 2008). Based on the

Risk Profile:Caffeine in energy drinks and energy shots 24
CARE and other studies, the Committee on Toxicicity (COT) concluded that caffeine intake during pregnancy is associated with an increased risk of fetal growth restriction. COT concluded that although there is some uncertainty, it was prudent to assume this relationship was causal. Furthermore, COT concluded that based on current evidence, it is not possible to identify a threshold level of caffeine intake below which there is no elevation of risk, although it seems likely that risk is increased in association with intakes in the order of 200 mg/day and perhaps lower (COT, 2008). Nawrot et al. (2003) concluded, from epidemiological studies, that consumption of caffeine at doses >300 mg/day may reduce women’s fertility and increase the risk of miscarriage. The COT review also concluded a positive association of caffeine intake with miscarriage, but there are uncertainties relating to possible recall bias and confounding factors (COT, 2008). In addition, COT concluded that data on caffeine consumption during pregnancy and associations with other adverse effects such as pre-term birth and congenital malformations are inconclusive (COT, 2008). Based on limited data, caffeine consumption >400 mg/day may decrease sperm motility and/or increase the percentage of dead spermatozoa (in heavy smokers) but is unlikely to adversely affect male fertility in general (Nawrot et al., 2003). 3.2.6 Effects on bone and calcium balance Caffeine intake is associated with a slight deterioration in calcium balance (Nawrot et al., 2003). Caffeine may be a risk factor for bone fracture but results are inconsistent. The association between caffeine exposure and bone metabolism is complicated by other risk factors for osteoporosis (calcium intake, age, smoking and alcohol consumption). Overall, current evidence suggests that caffeine exposures of <400 mg/day do not have significant effects on bone status or calcium balance in individuals ingesting at least 800 mg calcium per day. Since more than 50% of New Zealand women do not achieve an adequate calcium intake (Russell et al., 1999), those women with a caffeine exposure >400 mg/day may be at risk of adverse calcium balance and impaired bone health. 3.2.7 Effects on children Only a few studies have considered the adverse effects of caffeine on children and these have mostly included only a small number of subjects. Results are variable. Caffeine has been reported to cause nervousness, jitters, stomach aches and nausea in children (Nawrot et al., 2003; Smith et al., 2000; Stimulant Drinks Committee, 2002). More recently, Luebbe and Bell (2009) reported depression, but not increased anxiety in both children (10-12 years) and teenagers (15-17 years) who consumed caffeine (Luebbe and Bell, 2009). No studies have been reported for potential chronic effects of caffeine consumption by children. Given that the human nervous system (including the brain) continues to develop and mature throughout childhood, it is possible that children may be more sensitive to any adverse effects of caffeine than other population groups (Nawrot et al., 2003). 3.2.8 Death Death due to excessive caffeine ingestion is not common but cases of death due to caffeine intoxication have been reported (Garriott et al., 1985; Kerrigan and Lindsey, 2005), including cases linked to consumption of caffeinated beverages (Cannon et al., 2001). Pre-existing medical conditions (Cannon et al., 2001), consumption after exercise (Kapner, 2008) or

Risk Profile:Caffeine in energy drinks and energy shots 25
consumption in combination with alcohol (Kapner, 2008) have been reported as contributory factors in caffeine-related fatalities. 3.2.9 Tolerance, dependence and sensitivity Tolerance, dependence and sensitivity to caffeine is widely assumed to occur but is poorly documented. Tolerance develops to some caffeine effects but not to others (Fredholm et al., 1999; Meltzer et al., 2008). Tolerance to effects on blood pressure and heart rate develop quickly and virtually completely. The CNS stimulant effects show partial tolerance while there is little tolerance to the effects on sleep. Although Meltzer et al. (2008) cite much variation in tolerances between individuals, it is not clear if this variability relates to the degree, or the time taken, to develop tolerance. Caffeine meets the criteria for substance dependence defined in the Diagnostic and Statistical Manual of Mental Disorders (DSM-IV) with some people compelled to continue caffeine use despite efforts to the contrary (Meltzer et al., 2008). However, dependence is not universally accepted (Satel, 2006). The mechanisms of caffeine dependence are not fully understood. A variety of withdrawal symptoms are described by most regular caffeine consumers who abruptly halt caffeine consumption, with the most frequent symptom being headaches. Other symptoms include drowsiness, depression, anxiety, fatigue, irritability and lack of concentration (Meltzer et al., 2008). The frequency of withdrawal symptoms is highly variable. Between 11 and 100% of caffeine consumers have claimed to experience withdrawal symptoms on stopping caffeine (Dews et al., 2002). Based on limited evidence, Meltzer et al. (2008) reported muscle ache as the predominant withdrawal symptom for 10-12 years olds and headaches to be more common in adolescents. Children consuming high amounts of caffeine were reported to be more angry and unfocused when deprived of caffeine compared with low consumers, implying a dose-response effect for withdrawal symptoms. Withdrawal effects in children can be induced at exposures of 50 mg caffeine (half a cup of coffee) (Dews et al., 2002). Individuals with compromised liver function, and some individuals who consume caffeine in combination with medications that inhibit caffeine metabolism, are sensitive to caffeine exposure (Smith et al., 2000). No other substantiated sensitivities were identified. 3.3 Dose Response Further to the description of adverse effects covered in the previous section, the doses at which effects from caffeine are observed are summarized as follows: Fatalities are usually associated with ingestion of caffeine in excess of 5 g, although recovery after ingestion of 30 g has been reported (Nawrot et al., 2003; Kerrigan and Lindsey, 2005). Caffeinism, or caffeine intoxication, may occur with doses greater than 250 mg and can result in symptoms of anxiety (restlessness, nervousness, facial flushing) and diuresis (increased urine production). In a comprehensive review Nawrot et al. (2003) concluded that for the healthy adult population, moderate daily caffeine intake at a dose up to 400 mg/day was not associated with adverse effects such as general toxicity, cardiovascular effects, effects on bone status and calcium balance (so long as enough calcium is consumed) behavioural changes, cancer and male fertility. The implication is that habitual daily use of more than

Risk Profile:Caffeine in energy drinks and energy shots 26
500-600 mg (four to seven cups of coffee or seven to nine cups of tea) is a health risk for healthy adults. However, clinical data concerning health effects of persistent, high caffeine intakes is lacking. Increased anxiety levels in children (8-12 years) at doses of 2.5 mg/kg bw/day and at 3 mg/kg bw/day in 70kg adults have been reported in a limited number of studies (Bernstein et al. 1994; Nickell and Uhde, 1994). Positive mood effects, such as feelings of increased energy, imagination, efficiency, self-confidence, alertness, motivation and concentration were associated with low doses of caffeine (20-200 mg/day) (Smith et al., 2000; Stimulant Drinks Committee, 2002). A reduced ability to sleep, for some people, at doses of 100mg (1.4 mg kg bw/day in 70kg adults) at bedtime has been reported (Smith et al., 2000). A recent longitudinal study of 2635 pregnant women, reported a statistically significant increased risk of foetal growth retardation with caffeine exposures of 200-299 mg/day and above (Care Study Group, 2008). This finding confirmed an earlier conclusion of Nawrot et al. (2003). 3.4 Establishment of Safe Limits There is currently no recognised reference health standard for caffeine exposure, such as an Acceptable Daily Intake (ADI). A number of assessments have been made overseas and exposure limits adopted for different population groups. 3.4.1 General population In their review, Nawrot et al. (2003) concluded that for the general population of healthy adults, moderate caffeine exposure of 400 mg/day (5.7 mg/kg bw/day for a 70 kg adult) is not associated with adverse effects such as general toxicity, cardiovascular effects, changes in adult behaviour, increased incidence of cancer and effects on male fertility. This level of exposure is higher than an adverse effect level of 3 mg/kg bw/day, (210 mg/day for a 70kg adult) based on observations of increased anxiety, suggested by Smith et al. (2000). 3.4.2 Children Based on limited evidence for altered behaviour, including anxiety (Bernstein et al., 1994), the fact that the nervous system in children is continually developing, and the lack of information on long term effects of caffeine, an upper exposure of 2.5 mg/kg bw/day has been suggested as a cautious toxicological limit on which to base risk assessments for children (Nawrot et al., 2003). Based on these findings, Health Canada recommends a maximum daily caffeine intake of no more than 2.5 mg/kg bw/day for children aged 12 and under (Health Canada, 2007). Smith et al. (2000) proposed a comparable effect level for children based on the same study as Nawrot et al. (2003), namely that by Bernstein et al. (1994), but rounded this number to 3 mg/kg bw/day.

Risk Profile:Caffeine in energy drinks and energy shots 27
In a risk assessment of caffeine among children and adolescents in Nordic countries (Meltzer et al., 2008), a no observed adverse effect level (NOAEL) of 0.3 mg/kg bw/day for caffeine tolerance development, and lowest adverse effect levels (LOAEL)s of 1.0-1.25 mg/kg bw/day, 2.5 mg/kg bw/day and 1.4 mg/kg bw/day were identified for tolerance development, anxiety and sleep disturbance respectively. 3.4.3 Reproductive aged women Reproductive-aged women are a group “at risk” of possible adverse reproductive effects (Nawrot et al., 2003). Health Canada recommends a maximum caffeine exposure of 300 mg, or a little more than two cups of coffee per day (Health Canada, 2010). In November 2008 the UK Food Standards Agency issued new advice on caffeine consumption during pregnancy, advising pregnant women to limit their daily caffeine intake to 200 mg/day (FSA, 2008). The New Zealand Ministry of Health in its “Food and Nutrition Guidelines for Healthy Pregnant and Breastfeeding Women” advises pregnant and breastfeeding women to limit caffeine consumption to 300mg per day which is roughly equivalent to one large long black, or three cappuccinos, or four cups of plunger coffee, or six cups of instant coffee, or six cups of tea, or 400g of plain chocolate. Breastfeeding women should consider their caffeine intake if the infant is irritable or wakeful. (Ministry of Health, 2006). 3.5 New Zealand reports of Caffeine Poisoning 3.5.1 National Poisons Centre In the five year period from February 2005 to December 2009, the New Zealand National Poisons Centre received 82 calls relating to caffeine containing substances (Lucy Shieffelbien, National Poisons Centre, University of Otago, personal communication, January 2010). Approximately a quarter (20/82) involved the consumption of energy drinks or energy shots. The remainder related to capsules or tablets, most notably No-Doz which accounted for 44/82 calls. The following summary of caffeine calls is based on self reported information Twenty calls related to the consumption of energy drinks (18 calls) or energy shots (2 calls). Of these, the most prevalent product was the energy drink V. Twelve of the individuals were referred for medical treatment on the basis of these calls. Symptoms presented included vomiting, nausea, abdominal pain, jitteriness, racing heart, and agitation. Four calls related to instant coffee, three of these by children less than two years old. Caffeine levels are not available for all 20 energy drink or energy shot calls. The minimum caffeine level available that elicited symptoms was 200 mg, or 4.0 mg/kg of caffeine consumed by a 13 year old patient who presented with jitteriness 15 minutes after consuming one Demon Energy Shot. The maximum volume consumed by any patient was 15 x 250 ml cans, equivalent to 11.5 mg/kg of caffeine for this patient, over a one-hour period. This patient reportedly did not sleep, had a steady slow (rather than the more common quickened) heart rate, minor abdominal discomfort and no chest palpitations. A maximum total intake of caffeine of 1622 mg or 35.5 mg/kg was estimated for a 14 year old (40 kg) who reportedly consumed 14 No-Doz, capsules (1400 mg) plus 600 ml of V energy drink (222 mg).

Risk Profile:Caffeine in energy drinks and energy shots 28
3.5.2 Additional report A 23-year-old Auckland mother claims to have lost 45 kg in eight months by drinking only Red Bull, 10-14 cans per day, with a handful of dry cereal. The woman who gained weight during pregnancy found Red Bull was an appetite suppressant and as she was losing weight, continued to drink it. The energy drink habit became an addiction and led to a minor heart attack and two weeks in hospital. The woman suffered severe withdrawal symptoms such as sweating, nausea and shaking and has been left with a residual heart murmur, severe pain and cramping in her stomach and bowel, and anxiety attacks (Medical-News, 2009). This was an extreme diet and the symptoms may not have been related to the energy drink per se.

Risk Profile:Caffeine in energy drinks and energy shots 29
4 EVALUATION OF RISK
4.1 Estimate of Risk for New Zealand 4.1.1 Adverse effect levels applied to New Zealand exposures In the absence of a recognised reference health standard for caffeine, the estimated exposures from caffeine-containing foods were compared with an adverse effect level of 3 mg/kg bw/day for all population groups except pregnant women for whom an adverse effect level of 200 mg/day was applied. An adverse effect level of 3 mg/kg bw/day for children is consistent with international reviews (Nawrot et al., 2003; Smith et al., 2000). An adverse effect level of 3 mg/kg bw/day for adults is a conservative reference dose based on acute anxiety effects (Nickell and Uhde, 1994) and adopted by Smith et al., (2000) but is less than recommendations by Health Canada (see 5.2.1). A reference dose of 200 mg/day for pregnant women is based on recent evidence of an association between caffeine exposure and foetal growth restriction (Care Study Group, 2008) and is a little more conservative than the earlier conclusions drawn by Nawrot et al., (2003). 4.1.2 Comparison of baseline dietary exposure to caffeine with adverse effect level The exposure of each individual assessed in the exposure assessment, as described in Section 2.4.6 and summarised in Tables 5 and 6, was ranked. The proportion of consumers exceeding an adverse effect level of 3 mg/kg bw/day, or 200 mg/day for pregnant women, from dietary sources excluding energy drinks or energy shots, was calculated as a percentage of all caffeine consumers and as a percentage of all respondents (including those who did not consume caffeine) (Table 9).
Table 9: Proportion (%) of caffeine consumers and respondents with estimated baseline dietary exposure to caffeine greater than caffeine adverse effect levels for different population groups
Children
5-12 yrs Teenagers 13-19 yrs
Young males
19-24 yrs
Adults 20-64 yrs
*
Older people 65+ yrs
Females 16-44 yrs
*
Females 16-44 yrs pregnant
% consumers >adverse effect level ** 2 11 35 37 27 38 25 % respondents >adverse effect level** 2 8 28 35 26 35 22
* excluding pregnant women **An adverse effect level of 3.0 mg/kg/day was applied (Smith et al., 2000) for all population groups except for pregnant females where an adverse effect level of 200 mg/day was applied. 4.1.3 Impact of caffeinated beverages on caffeine exposure relative to adverse effect level Further to Section 2.4.10, the proportion of children (5-12 yrs), teenagers (13-19 yrs) and young males (19-24 yrs) estimated to exceed an adverse effect level of 3 mg/kg bw/day, hence potentially be at risk from adverse caffeine effects, following the consumption of one, two, three or four retail units of either an energy drink or an energy shot is given in Table 10.

Risk Profile:Caffeine in energy drinks and energy shots 30
Table 10: Proportion (%) of New Zealand children, teenagers and young males with potential caffeine intakes above an adverse effect level of 3mg/kg bw/day if one - four retail units of energy drinks or energy shots are consumed
Children
5-12 yrs Teenagers 13-19 yrs
Young males 19-24 yrs
Baseline 2 11 35 Baseline + 1 retail unit
68 42 62
Baseline + 2 retail units
89 77 84
Baseline + 3 retail units
94 89 92
Baseline + 4 retail units
95 93 95
At a population level, approximately 70% of children and 40% of teenagers who consume caffeine are estimated to exceed an adverse effect level of 3 mg/kg bw/day after consumption of a single retail unit of an energy drink or energy shot in addition to a baseline dietary exposure. 4.2 Uncertainties and Data Gaps 4.2.1 Uncertainties There are uncertainties and limitations in the baseline exposure estimates relating to mapping and variability in concentration data that are common to any exposure assessment utilizing mean concentration data and 24 hr diet records (see Appendix 3.1.2). Of particular note, it is now 13 years since the 1997 NNS was undertaken. Consumption choices, amounts and available products are likely to have changed over this period, introducing a level of uncertainty in the baseline dietary exposure assessments. With respect to food concentration data used in this exposure assessment it was assumed that food concentrations of Australian foods purchased in 2002 are the same as for New Zealand foods. This is probably reasonable but the range of products now available will be different. Given that tea, coffee, kola type soft drinks and chocolate flavoured bakery goods are major contributing foods to baseline caffeine exposure, the concentration values used for these foods is particularly important. The energy drink and energy shot market is dynamic with online purchasing available. It is possible that additional products are currently available in New Zealand that were not captured in this report. Information on the relative market share for different energy drinks and energy shots was not factored into the exposure scenarios presented. However the assumption used in the scenarios that they are equally likely to be chosen for consumption may not be correct. The absence of information on current consumption practices necessitated assumptions of no product bias if multiple retail units were consumed, that a full retail unit was always

Risk Profile:Caffeine in energy drinks and energy shots 31
consumed and that baseline caffeine preferences did not influence consumption of energy drinks or energy shots. There is an element of uncertainty in these assumptions. Caffeine from alcoholic beverages and Ready to Drink (TD) products containing kola type soft drinks were not included in the exposure scenarios, since alcohol sales are illegal for persons under 18 and alcohol consumption is not encouraged in persons under 18. Neither is the frequency and prevalence of consumption of these products known. Thus the caffeine estimates for individuals consuming either caffeinated alcoholic drinks or RTDs containing kola type soft drinks are underestimated. Since three of the caffeinated alcoholic beverages claimed to have caffeine levels similar to energy drinks, these products are likely to be a significant source of caffeine to those who drink them. 4.2.2 Data Gaps The priority area of uncertainty in assessing the proportion of the New Zealand population at risk of adverse effects from the consumption of caffeinated beverages currently available in New Zealand is due to the lack of information on current consumption patterns of energy drinks and energy shots in New Zealand. Information on the frequency of consumption, the number of products that may be consumed at any one drinking event and whether energy drinks or energy shots are consumed with alcohol or not, is all lacking. Therefore it is not possible to determine with precision whether any sub-groups of the New Zealand population are at risk currently of adverse effects from caffeine. The scenario simulations indicate that the consumption of one energy drink or energy shot may exceed the adverse effect level of 3 mg/kg bw/day. Limited overseas evidence suggests that perhaps 20% of people under the age of 19 may consume one energy drink or energy shot per week and high consumers may drink up to 8 retail units in a session (Stimulant Drinks Committee, 2002). Limited, and uncorroborated, New Zealand reports indicate some individuals consume up to 15 retail units per session (see sections 3.5.1 and 3.5.2 above). The contribution of energy drinks and energy shots to caffeine exposure is based on claimed concentrations. There is no independent laboratory data on actual caffeine levels in these products and this represents a data gap. Current adverse effect levels for children are based on single studies of acute anxiety effects. There is a lack of data concerning health effects of frequent, high caffeine intakes. Further evidence of adverse effects, both acute and chronic, for children and adults would strengthen the evidence and confirm the appropriateness of the adverse effect levels.
Risk Profile:Caffeine in energy drinks and energy shots 32
5 AVAILABILITY OF CONTROL MEASURES 5.1 Existing Control Measures in New Zealand 5.1.1 Regulatory Levels of naturally occurring caffeine in coffee, tea and chocolate products are not regulated, and the level of caffeine from these sources is not required on nutrition information panels (NIPs). Caffeine added to food and beverages is regulated in Standard 1.3.1 ‘Food Additives’ and Standard 2.6.4 ‘Formulated Caffeinated Beverages’ of the Australia New Zealand Food Standards Code. The maximum amount of caffeine permitted in kola type soft drinks is 145 mg/L (mg/kg) (Standard 1.3.1, Schedule 1 of the Australia New Zealand Food Standards Code). A formulated caffeinated beverage must contain no less than 145 mg/L and no more than 320 mg/L total caffeine, regardless of the source of caffeine (Standard 2.6.4 of the Australia New Zealand Food Standards Code). Standard 2.6.4 also prescribes that the quantity of caffeine and advisory statements to the effect that the food contains caffeine and is not recommended for children, pregnant or lactating women, and individuals sensitive to caffeine be included on the label. Prior to 31 March 2010, energy shots marketed as Dietary Supplements had to include caffeine in the ingredient list, but did not need to specify the amount of caffeine, nor were advisory statements required (New Zealand Legislation, 2007). From 31 March 2010, food type dietary supplements such as energy shots are regulated by the New Zealand Food (Supplemented Food) Standard 2010 (NZFSA, 2010). This new standard requires caffeine to be listed in the ingredient list. If the supplemented food contains added caffeine greater than 145mg/L, the level of caffeine, and the advisory statements that apply to formulated caffeinated beverages regulated under Standard 2.6.4 of the Australia New Zealand Food Standards Code, must be included on the label. If Paullinia cupana or guarana is added as a food ingredient in New Zealand foods the label must include an advisory statement to the effect that the product contains caffeine (Standard 1.2.3 of the Australia New Zealand Food Standards Code). The label on the package of a supplemented food containing guarana must include an advisory statement to the effect that the supplemented food contains caffeine (NZFSA, 2010). Whilst the concentration of caffeine in kola type soft drinks and formulated caffeinated beverages is regulated, there are no regulations on the volume (pack size) of retail units (hence dose of caffeine consumed per retail unit). 5.1.2 Advisory The following advisory statement to pregnant women is published on the NZFSA website: “Drinks containing caffeine, including coffee, teas and colas, should be limited during pregnancy. You may want to consider giving up caffeine altogether. Have no more than six cups of tea or instant coffee, or three espresso-style coffees daily. Energy drinks and ‘smart drinks’ are not recommended as they may contain high levels of caffeine and other ingredients not recommended for pregnant and breastfeeding women” (NZFSA, 2009).

Risk Profile:Caffeine in energy drinks and energy shots 33
The following advisory to pregnant women is issued by the New Zealand Ministry of Health to pregnant women: “Limit drinks containing caffeine, such as coffee, tea and cola drinks. Have no more than six cups of tea or instant coffee (or three ‘single’ espresso-type coffees or one ‘double’ espresso-type coffee) each day” (Ministry of Health, 2008). 5.2 Existing Control Measures Overseas 5.2.1 Canada Health Canada recommends: “For children age 12 and under, Health Canada recommends a maximum daily caffeine intake of no more than 2.5 milligrams per kilogram of body weight. Based on average body weights of children, this means a daily caffeine intake of no more than:
45 mg for children aged 4 - 6; 62.5 mg for children aged 7 - 9; and 85 mg for children aged 10 - 12.
Those recommended maximums are equivalent to about one to two 12-oz (355 ml) cans of cola a day. Health Canada has not developed definitive advice for adolescents 13 and older because of insufficient data. Nonetheless, Health Canada suggests that daily caffeine intake for this age group is no more than 2.5 mg/kg body weight.” “For women of childbearing age, the recommendation is a maximum daily caffeine intake of no more than 300 mg, or a little over two 8-oz (237 ml) cups of coffee. For the rest of the general population of healthy adults, Health Canada advises a daily intake of no more than 400 mg” (Health Canada, 2010). 5.2.2 United Kingdom In November 2008, the UK FSA issued new advice to pregnant women to limit caffeine consumption to 200 mg/day. The Agency had previously recommended a maximum daily intake of 300 mg but reduced this limit on the basis of new evidence, including, but not only, the CARE Study (Care Study Group, 2008; FSA, 2008). 5.2.3 USA In a review of caffeine undertaken in 1978, the US Select Committee on GRAS Substances (SCOGS) concluded that “While no evidence in the available information on caffeine demonstrates a hazard to the public when it is used in cola type beverages at levels that are now current and in the manner now practiced, uncertainties exist requiring that additional studies be conducted. It is inappropriate to include caffeine among the substances generally recognized as safe (GRAS)” (FDA, 1978). Thus they conclude caffeine is GRAS for cola type beverages but not generally. The US Food and Drug Administration (FDA) has listed caffeine as GRAS as an ingredient in cola-type beverages in concentrations of no greater than 200 parts per million (mg/kg or 20 mg/100ml). In November, 2009, the FDA announced plans to look into the safety of caffeinated alcoholic beverages (FDA, 2009).

Risk Profile:Caffeine in energy drinks and energy shots 34
5.2.4 European Food Safety Authority (EFSA) The EU Directive 2002/67/EC on the labelling of foodstuffs containing quinine, and of food stuffs containing caffeine, requires that beverages, other than those based on coffee or tea, containing more than 150 mg/l (15 mg/100ml) caffeine should be labelled “high caffeine content” and the exact amount present indicated on the label. It also required that where caffeine is used as flavouring in a foodstuff it must be listed in the ingredient list. (EC, 2002). Caffeine was evaluated by the European Commission Scientific Committee for Food in relation to its presence in “energy” drinks in 1999 and 2003. The 1999 opinion was upheld in 2003, “For caffeine, it was concluded that the contribution of “energy” drinks to overall caffeine intake was not a matter of concern for non-pregnant adults. For children who do not normally consume much tea or coffee, and who might substitute “energy” drinks for cola or other soft drinks, consumption of “energy” drinks might represent an increase in daily caffeine exposure compared with their previous intake. The Committee considered that this could result in transient behavioural changes, such as increased arousal, irritability, nervousness or anxiety. For pregnant adults, the Committee concluded that while intakes of caffeine up to 300 mg/day appeared to be safe, the question of possible effects on pregnancy and the offspring at regular intakes above 300 mg/day remained open. This suggested that moderation of caffeine intake, from whatever source, was advisable during pregnancy” (SCF, 2003). 5.2.5 Finnish Food Safety Authority (Evira) The Finnish Food Safety Authority, Evira, considers the moderate consumption of caffeine is unlikely to present any health risks for most people but that the stimulatory effect of caffeine is very individual lasting from a few to many hours depending on the dose and the person’s metabolism. Evira considers that labelling according to Directive 2002/67/EC, that a drink that contains more than 150 mg/l (15 mg/100ml) of caffeine from any source must be labelled “high caffeine content”, is not sufficient to protect the most sensitive consumers. Evira requires that drinks, confectionery, chewing gums, chocolate bars and other similar products and food supplements containing added caffeine must also be labeled “Not recommended for children, pregnant women or people sensitive to caffeine”. The drinks and confectionery must also precisely declare the maximum amount to be used daily, for example, “a maximum of two cans per day” (Evira, 2010). 5.3 Control Options Caffeine exposure could be controlled further by regulation and/or risk communication. Options could include regulating the permissible volume of a caffeinated beverage, thus limiting the dose per retail unit consumed. No international precedent for this option was noted. The maximum permissible concentration of caffeine in caffeinated beverages could be lowered.
Risk Profile:Caffeine in energy drinks and energy shots 35
Advisory information with respect to an amount of caffeine or amounts of caffeine containing foods, for different population groups, represents an option for risk communication. Aside from product labelling requirements current advisory statements in New Zealand are limited to pregnant women.

Risk Profile:Caffeine in energy drinks and energy shots 36
6 REFERENCES Abourashed EA, Mossa JS. (2004) HPTLC determination of caffeine in stimulant herbal products and power drinks. Journal of Pharmaceutical and Biomedical Analysis; 36(3): 617-620. Babu KM, Church RJ, Lewander W. (2008) Energy drinks: The new eye-opener for adolescents. Clinical Pediatric Emergency Medicine; 9(1): 35-42. Barone JJ, Roberts HR. (1996) Caffeine consumption. Food and Chemical Toxicology; 34(1): 119-129. Bempong DK, Houghton PJ, Steadman K. (1993) The xanthine content of guarana and its preparations. Pharmaceutical Biology; 31(3): 175 - 181. Bernstein GA, Carroll ME, Crosby RD, Perwien AR, Go FS, Benowitz NL. (1994) Caffeine effects on learning, performance, and anxiety in normal school- age children. Journal of the American Academy of Child and Adolescent Psychiatry; 33(3): 407-415. Cannon ME, Cooke CT, McCarthy JS. (2001) Caffeine-induced cardiac arrhythmia: An unrecognised danger of healthfood products. Medical Journal of Australia; 174(10): 520-521. Cardozo Jr EL, Ferrarese-Filho O, Filho LC, Ferrarese ML, Donaduzzi CM, Sturion JA. (2007) Methylxanthines and phenolic compounds in mate (Ilex paraguariensis St. Hil.) progenies grown in Brazil. Journal of Food Composition and Analysis; 20(7): 553-558. CARE Study Group. (2008) Maternal caffeine intake during pregnancy and risk of fetal growth restriction: a large prospective observational study. British Medical Journal; 337(nov03_2): a2332. Caudle AG, Gu Y, Bell LN. (2001) Improved analysis of theobromine and caffeine in chocolate food products formulated with cocoa powder. Food Research International; 34(7): 599-603. Chou KH, Bell LN. (2007) Caffeine content of prepackaged national-brand and private-label carbonated beverages. Journal of Food Science; 72(6): C337-C342. COT (Committee on Toxicity) (2008) Committee on Toxicity of chemicals in food, consumer products and the environment. Statement on the reproductive effects of caffeine. Available at http://cot.food.gov.uk/pdfs/cotstatementcaffeine200804.pdf Accessed 16 December 2009. Desbrow B, Hughes R, Leveritt M, Scheelings P. (2007) An examination of consumer exposure to caffeine from retail coffee outlets. Food and Chemical Toxicology; 45(9): 1588-1592. Dews PB, O'Brien CP, Bergman J. (2002) Caffeine: behavioural effects of withdrawal and related issues. Food and Chemical Toxicology; 40: 1257-1261. Durrant KL. (2002) Known and hidden sources of caffeine in drug, food, and natural products. Journal of the American Pharmaceutical Association; 42(4): 625-37.

Risk Profile:Caffeine in energy drinks and energy shots 37
EC (European Commission) (2002) Commission Directive 2002/67/EC of 18 July 2002 on the labelling of foodstuffs containing quinine, and foodstuffs containing caffeine. Official Journal of the European Union 19.7.2002, L191, 20-21. Energy Fiend. (2009) Caffeine content of Australian and New Zealand drinks. Accessed at: http://www.energyfiend.com/caffeine-content-of-australia-and-new-zealand-drinks. Accessed: 13 October 2009. Evira. (2010) Instructions for use of foodstuffs containing caffeine. Accessed at: http://www.evira.fi/portal/en/food/control_and_entrepreneurs/labelling_of_foodstuffs/warning_labelling_and_instructions_for_use/instructions_for_use_of_foodstuffs_containing_caffeine/. Accessed: 14 January 2010. FDA. (1978) Database of Select Committee on GRAS Substances (SCOGS) Reviews, Caffeine. Accessed at: http://www.accessdata.fda.gov/scripts/fcn/fcnDetailNavigation.cfm?rpt=scogsListing&id=42. Accessed: 5 January 2010. FDA. (2009) FDA to look into safety of caffeinated alcoholic beverages. Accessed at: http://www.fda.gov/NewsEvents/Newsroom/PressAnnouncements/ucm190427.htm. Accessed: 5 January 2010. FOODfiles (2006) New Zealand Food Composition Database Available from Plant & Food Research, formerly Crop & Food. http://www.crop.cri.nz/home/products-services/nutrition/foodcompdata/fcd-products/fcd-foodfiles/index.php Frary CD, Johnson RK, Wang MQ. (2005) Food sources and intakes of caffeine in the diets of persons in the United States. Journal of the American Dietetic Association; 105(1): 110-113. Fredholm BB, Battig K, Holmen J, Nehlig A, Zvartau EE. (1999) Actions of caffeine in the brain with special reference to factors That contribute to its widespread use. Pharmacological Reviews; 51(1): 83-133. FSA. (2004) Survey of caffeine levels in hot beverages. London: Food Standards Agency. Accessed at:http://www.food.gov.uk/science/surveillance/fsis2004branch/fsis5304 Accessed 24 March 2010 FSA. (2008) Pregnant women advised to limit caffeine consumption. Accessed at: http://www.food.gov.uk/news/newsarchive/2008/nov/caffeinenov08. Accessed: 21 December 2009. FSANZ (2010) Food Standards Australia New Zealand. Food Standards Code. Accessed at: http://www.foodstandards.gov.au/foodstandards/foodstandardscode/ Accessed: 12 January 2010. Garriott JC, Simmons LM, Poklis A, Mackell MA. (1985) Five cases of fatal overdose from caffeine-containing 'look-alike' drugs. Journal of Analytical Toxicology; 9(3): 141-143. Health Canada. (2010) Caffeine. Accessed at: http://www.hc-sc.gc.ca/hl-vs/alt_formats/pdf/iyh-vsv/food-aliment/caffeine-eng.pdf Accessed: 8 April 2010.

Risk Profile:Caffeine in energy drinks and energy shots 38
IARC. (1991) Caffeine. In: IARC (eds). IARC Monographs on the Evaluation of Carcinogenic Risks to Humans. Volume 51. Coffee, Tea, Mate, Methylxanthines and Methylglyoxal. Lyon, France: IARC. Kapner DA. (2008) Ephedra and energy drinks on college campuses. Accessed at: http://www.higheredcenter.org/files/product/energy-drinks.pdf. Accessed: 10 October 2009. Kerrigan S, Lindsey T. (2005) Fatal caffeine overdose: Two case reports. Forensic Science International; 153(1): 67-69. Knight CA, Knight I, Mitchell DC. (2006) Beverage caffeine intakes in young children: In Canada and the US. Canadian Journal of Dietetic Practice and Research; 67(2): 96-99. Lesperance L. (2009) The concise New Zealand food composition tables. 8th Edition. Palmerston North: New Zealand Institute of Plant & Food Research/Ministry of Health. Luebbe AM, Bell DJ. (2009) Mountain Dew® or mountain don't?: A pilot investigation of caffeine use parameters and relations to depression and anxiety symptoms in 5th- and 10th-grade students. Journal of School Health; 79(8): 380-387. Mandel HG. (2002) Update on caffeine consumption, disposition and action. Food and Chemical Toxicology; 40(9): 1231-1234. McCusker RR, Fuehrlein B, Goldberger BA, Gold MS, Cone EJ. (2006) TECHNICAL NOTE: Caffeine content of decaffeinated coffee. Journal of Analytical Toxicology; 30: 611-613. McCusker RR, Goldberger BA, Cone EJ. (2003) TECHNICAL NOTE: Caffeine content of specialty coffees. Journal of Analytical Toxicology; 27: 520-522. Medical-News. (2009) Extreme caffeinated soft drink diet leaves woman with serious health issues. The Medical News, Women's Health News, 24 May 2009. Accessed at http://www.news-medical.net/news/2009/05/24/Extreme-caffeinated-soft-drink-diet-leaves-woman-with-serious-health-issues.aspx Accessed January 2010. Meltzer HM, Fotland TO, Alexander J, Elind E, Hallstrom H, Lam H R, Liukkonen K-H, Petersen M A, Solbergsdottir E J. (2008) Risk assessment of caffeine among children and adolescents in the Nordic countries. TemaNord 2008: 551. Copenhagen: Nordic Council of Ministers, Copenhagen. Ministry of Health. (2003) NZ Food NZ Children. Key results of the 2002 National Children's Nutrition Survey. Wellington: Ministry of Health. Ministry of Health (2006) Food and Nutrition Guidelines for Healthy and Pregnant Breastfeeding Women: A background paper. Wellington: Ministry of Health. Ministry of Health (2008) Eating for healthy pregnant women. Available at: http://www.healthed.govt.nz/resources/eatingforhealthypregnantwomenngaka.aspx Accessed December 2009.

Risk Profile:Caffeine in energy drinks and energy shots 39
Nathanson JA. (1984) Caffeine and related methylxanthines: possible naturally occurring pesticides. Science; 226(4671): 184-187. Nawrot P, Jordan S, Eastwood J, Rotstein J, Hugenholtz A, Feeley M. (2003) Effects of caffeine on human health. Food Additives and Contaminants; 20(1): 1-30. Nickell PV, Uhde TW. (1994) Dose-response effects of intravenous caffeine in normal volunteers. Anxiety; 1(4): 161-168. New Zealand Legislation (2007) Dietary Supplements Regulations 1985 (SR 1985/208) Reprint as at 03 September 2007. Accessed at: http://www.legislation.govt.nz/regulation/public/1985/0208/1.0/viewpdf.aspx Accessed: April 2010. Niemenak N, Onomo PE, Fotso, Lieberei R, Ndoumou DO. (2008) Purine alkaloids and phenolic compounds in three Cola species and Garcinia kola grown in Cameroon. South African Journal of Botany; 74(4): 629-638. NSW Food Authority. (2009) Government investigation reveals 77% of energy drinks contain illegal caffeine levels. Accessed at: http://www.foodauthority.nsw.gov.au/_Documents/media_releases/mr_6_Oct_09_government_investigation_energy_drinks.pdf. Accessed: 8 January 2010. NZFSA (New Zealand Food Safety Authority) (2009) Food safety in pregnancy. Available at: http://www.nzfsa.govt.nz/consumers/low-immunity-child-pregnancy/pregnancy-food-safety/#P176_22610 Accessed December 2009. NZFSA (New Zealand Food Safety Authority) (2010) New Zealand Food (Supplemented Food) Standard 2010. Accessed at:http://www.nzfsa.govt.nz/policy-law/legislation/food-standards/final-supplemented-food-standard-12-june-2009.pdf Accessed: 30 April 2010. O'Dea J, Rawstorne P. (2000) Consumption of dietary supplements and energy drinks by schoolchildren. Medical Journal of Australia; 173(7): 389. Olmos V, Bardoni N, Ridolfi AS, Villaamil Lepori EC. (2009) Caffeine levels in beverages from Argentina's market: application to caffeine dietary intake assessment. Food Additives & Contaminants: Part A; 26(3): 275 - 281. Ou-Yang D-S, Huang S-L, Wang W, Xie H-G, Xu Z-H, Shu Y, Zhou H-H, (2000) Phenotypic polymorphism and gender-related differences of CYP1A2 activity in a Chinese population. British Journal of Clinical Pharmacology; 49:145-151. Palatini P, Ceolotto G, Ragazzo F, Dorigatti F, Saladini F, Papparella I, Mos L, Zanata G, Santonastaso M. (2009) CYP1A2 genotype modifies the association between coffee intake and the risk of hypertension. Journal of Hypertension; 27(8): 1594-1601. Pena A, Lino C, Silveira MIN. (2005) Survey of caffeine levels in retail beverages in Portugal. Food Additives & Contaminants: Part A; 22(2): 91 - 96.

Risk Profile:Caffeine in energy drinks and energy shots 40
Riksen NP, Rongen GA, Smits P. (2009) Acute and long-term cardiovascular effects of coffee: Implications for coronary heart disease. Pharmacology & Therapeutics; 121(2): 185-191. Rojo Camargo MC. (1999) Caffeine daily intake from dietary sources in Brazil. Food Additives & Contaminants: Part A; 16(2): 79 - 87. Russell DG, Parnell WR, Wilson NC, Faed J, Ferguson E, Herbison P, Horwath C, Nye T, Reid P, Walker R, Wilson B, Tukuitonga C. (1999) NZ Food: NZ People. Wellington: Ministry of Health. Satel S. (2006) Is caffeine addictive?- A review of the literature. The American Journal of Drug and Alcohol Abuse; 32: 493-502. SCF. (2003) Opinion of the Scientific Committee on Food on Additional information on “energy” drinks. European Commission. Smith PF, Smith A, Miners J, McNeil J, Proudfoot A. (2000) Report of the Expert Working Group on the Safety Aspects of Dietary Caffeine. Canberra: Australia New Zealand Food Authority. Steffen DG. (2000) Chemistry and health benefits of caffeinated beverages: Symposium overview. In: (eds). Caffeinated Beverages. Washington, DC: American Chemical Society. Stimulant Drinks Committee JJ. (2002) A review of the health effects of stimulant drinks. Cork: Safefood. Tang N, Zhou B, Wang B, Yu R. (2009) Coffee consumption and risk of breast cancer: a metaanalysis. American Journal of Obstetrics and Gynecology; 200(3): 290.e1-290.e9. Thomson BM. (2009) Nutritional modelling: distributions of salt intake from processed foods in New Zealand. British Journal of Nutrition; 102: 757-765. Walker TH, Chaar JM, Mehr CB, Collins JL. (2000) The chemistry of Guarana: Guarana, Brazil's super-fruit for the caffeinated beverages industry. In: (eds). Caffeinated Beverages. Washington, DC: American Chemical Society. Yao L, Liu X, Jiang Y, Caffin N, D'Arcy B, Singanusong R, Datta N, Xu Y. (2006) Compositional analysis of teas from Australian supermarkets. Food Chemistry; 94(1): 115-122. Zen JM, Ting YS, Shih Y. (1998) Voltammetric determination of caffeine in beverages using a chemically modified electrode. Analyst; 123(5): 1145-1147. Zenith International. (2009) Global energy drinks. Available from http://www.zenithinternational.com/market_industry_reports/report_detail.asp?id=220&desc=Global+Energy+Drinks Accessed 3 March 2010. APPENDIX 1: Concentration of Caffeine In New Zealand Foods (NZ Food
Composition, 8th Edition, 2009)

Risk Profile:Caffeine in energy drinks and energy shots 41
Food
Caffeine concentration
(mg/100g)
Serve/ unit (g)
Caffeine concentration
mg/serve Bakery products Biscuit, `Afghan' 4 1 biscuit/ 17 1 Biscuit, chocolate base, `Digestive/Wheat'
8 1 biscuit/ 10.5 1
Biscuit, chocolate coated 8 1 biscuit/ 10.5 1 Biscuit, chocolate coated, `Mallowpuff' 8 1 biscuit/ 21.5 2 Biscuit, chocolate coated, `Toffee Pop' 8 1 biscuit/ 17 1 Biscuit, cookie, chocolate chip 8 1 biscuit/ 13 1 Biscuit, peanut brownie, commercial 4 1 biscuit/ 12 1 Cake, chocolate, standard 3 1/8 cake/ 79 3 Cake, chocolate, butter icing 3 1/8 cake/ 79 3 Cookies, `Cookie Time', original 12 1 biscuit/ 92 11 Lamington, chocolate 3 140 5 Muffin, chocolate 3 60 2 Eclairs w/ choc. icing & cream filling 2 1 éclair/ 42 1 Beverages, non alcoholic Lucozade 0 1 cup/ 264 0 Milo, made with trim milk T 1 cup/ 280 1 Milo, made with water T 1 cup/ 255 1 Milo, powder 10 1 tsp/ 2.5 T Nesquik, powder 10 1 tsp/ 2.5 T Chocolate, drinking, powder 51 1 tsp/ 2.5 1 Cocoa, powder 227 1 tsp 4 Coffee, cafe latte, caffeinated 99 1 cup/ 272 269 Coffee, espresso brewed 212 1 cup/ 272 577 Coffee, decaffeinated 160 1 tsp/ 1.8 3 Coffee, instant 3700 1 tsp/ 1.5 56 Fruit Drink, `V Drink' 28 1 can/ 250 l 72 Soft drink, `Cola-Diet’ 14 1 can/ 350 49 Soft drink, 'Coca-Cola' 9 1 can/ 355 33 1 bottle/ 500 46 Tea, Indian, infused 22 1 cup/ 251 55 Chocolate confectionery Bounty bar, Cadbury 16 1 bar 8 Crunchie bar, Cadbury 16 1 bar 8 Kit Kat, Nestle 16 1 finger/ 12 2 Mars bar 16 1 bar/ 60 10 Pinky bar, Cadbury 16 1 bar/ 45 7 Chocolate, Cadbury, `Moro',bar 16 1 bar/ 70 11 Chocolate, candy coated, `Pebbles' etc 16 10 pieces/ 9 1 Chocolate, dark 59 1 cup, grated/ 88 52 Chocolate, white 5 1 cup, grated/ 88 4 Chocolate bar, milk 20 1 large bar/ 120 24 1 small bar/ 50 10 Chocolate bar, with peanuts 16 1 slab/ 52 8

Risk Profile:Caffeine in energy drinks and energy shots 42
Food
Caffeine concentration
(mg/100g)
Serve/ unit (g)
Caffeine concentration
mg/serve Chocolates, fancy and filled 16 1 chocolate/ 5 1 Chocolate flavoured products Chocolate coated Ice cream, `Jelly Tip' 2 1 cup/ 200 4 Dessert, dairy food, chocolate flavour 2 1 cup/ 246 5 Muesli bar, chocolate chip 2 1 bar/ 32 1 Muesli bar, chocolate coated 2 1 bar/ 33 1 Nutella 11 1 tbsp/ 14 2 Pudding, self-saucing, chocolate, baked 6 100 6 Sauce, chocolate 10 1 tbsp/ 15 1 Sundae, chocolate, McDonald's 1 1 sundae/ 198 2 Coco Pops, Kellogg's 5 1 cup/ 40 2
T = trace

Risk Profile:Caffeine in energy drinks and energy shots 43
APPENDIX 2: Overseas concentration of caffeine in coffee, tea and chocolate and food products containing coffee or chocolate
Product Average (range)
caffeine concentration (mg/100ml or mg/100g)
Country Reference
Coffee Espresso 74.3 (58.1-92.5)
mg/shot 78 (46-159) mg/100ml 106 (25-214) 62 per serving
USA Argentina Australia Various
(McCusker et al., 2003) (Olmos et al., 2009) (Desbrow et al., 2007) (Mandel, 2002)
Brewed/Perhted 571 62 (43-83) 39.7 (31.2-54.8) 74-112 per serving 36 49 (7-118)
Various Brazil USA Various USA/Canada UK
(Barone and Roberts, 1996) (Rojo Camargo, 1999) (McCusker et al., 2003) (Mandel, 2002) (Knight et al., 2006) (FSA, 2004)
Instant 401
73 (62-82) 41 (21-44) 60-71 per serving 32 23 (9-51)
Various Brazil Argentina Various USA/Canada UK
(Barone and Roberts, 1996) (Rojo Camargo, 1999) (Olmos et al., 2009) (Mandel, 2002) (Knight et al., 2006) (FSA, 2004)
Decaffeinated 21
2.0 (0-2.9) 1-4 per serving 2 0.5-5
Various USA Various USA/Canada UK
(Barone and Roberts, 1996) (McCusker et al., 2006) (Mandel, 2002) (Knight et al., 2006) (FSA, 2004)
Tea Black (teabag, or not specified) Green Tea (leaves) Decaffeinated
23 (21-24) 47.3± 0.1 27-40 per serving 5-28 12 (8-17) 20 13 17 (0.4-39) 8-30 per serving 27(22-33) 1
Brazil Taiwan Various Portugal Argentina USA/Canada USA/Canada UK Various Argentina UK
(Rojo Camargo, 1999) (Zen et al., 1998) (Mandel, 2002) (Pena et al., 2005) (Olmos et al., 2009) (Knight et al., 2006) (Knight et al., 2006) (FSA, 2004) (Mandel, 2002) (Olmos et al., 2009) (FSA, 2004)
Chocolate Dark chocolate 125
43 (33-73) Various Brazil
(Mandel, 2002) (Rojo Camargo, 1999)
Milk chocolate 21 Various (Mandel, 2002) White chocolate 23 (13-40) Brazil (Rojo Camargo, 1999)

Risk Profile:Caffeine in energy drinks and energy shots 44
Product Average (range) caffeine concentration (mg/100ml or mg/100g)
Country Reference
Cocoa, hot chocolate
31,2 9 (4-15)3
2.1
Various Brazil USA/Canada
(Barone and Roberts, 1996) (Rojo Camargo, 1999) (Knight et al., 2006)
Chocolate milk 3 3.4 (3.0-4.2)
Various Argentina
(Barone and Roberts, 1996) (Olmos et al., 2009)
Chocolate candy 3-13 Various (Barone and Roberts, 1996) Caffeinated beverages
Energy drinks 14.5->42 32 26 (13-31) 42 (2-217) 21.5 (11-32) 28 (17-36) 15 32 15 15 32
Australia Various USA Portugal Saudi Arabia Argentina Denmark Finland Iceland Norway Sweden
(NSW Food Authority, 2009) (Mandel, 2002) (McCusker et al., 2006) (Pena et al., 2005) (Abourashed and Mossa, 2004) (Olmos et al., 2009) (Meltzer et al., 2008) (Meltzer et al., 2008) (Meltzer et al., 2008) (Meltzer et al., 2008) (Meltzer et al., 2008)
Carbonated sodas 11.6 (10.7-12.9) 9 (5-13) 8-17 10.4 (1.4-20.8) 11 (9-12) 11.5-15.3
Various USA Portugal USA Argentina USA/Canada
(Mandel, 2002) (McCusker et al., 2006) (Pena et al., 2005) (Chou and Bell, 2007) (Olmos et al., 2009) (Knight et al., 2006)
Water (caffeinated) 120 USA/Canada (Knight et al., 2006) Other Cocoa Puffs 7.7 USA (Caudle et al., 2001) Chocolate fudge poptarts
5.4 USA (Caudle et al., 2001)
Chocolate instant pudding
12.1 USA (Caudle et al., 2001)
Chocolate biscuits 12 USA (Caudle et al., 2001) 1 Standard values based on data 1975-1993 2 concentration in chocolate drink, 3 per 13g serving of powder

Risk Profile:Caffeine in energy drinks and energy shots 45
APPENDIX 3: New Zealand Exposure Estimate to Caffeine A3.1 Baseline Exposure from Caffeine Containing Foods and Beverages A3.1.1 Methodology Concentration data of foods containing naturally occurring caffeine (Appendix 1) were combined with 24 hour diet recall information from the 1997 NNS and the 2002 CNS using Microsoft FoxPro software. Concentration values for caffeine in 49 New Zealand foods were used (Appendix 1) with three changes to concentration values for coffee to better map to products as itemised in the 1997 NNS and 2002 CNS with reference to more recent overseas data (Appendix 2). Thus, coffee was mapped to: coffee, cafe latte, caffeinated (99 mg/100ml), (Appendix 1) coffee, instant (3700 mg/100g of dry powder) (Appendix 1) and coffee, decaffeinated (2mg/100ml) (Appendix 2). coffee, brewed (53 mg/100ml) (Appendix 2), coffee, espresso (80 mg/100ml),(Appendix 2) Chocolate milk was included at a concentration of 3 mg/100ml based on overseas data and a concentration value of 17 mg/100ml was included for Red Bull (Table 2). Where a trace was noted in Appendix 1 (milo products) this was assigned a concentration value of 0.5 mg/100ml to represent a low, but non zero level of caffeine. Exposures were estimated for seven population groups, namely, children (5-12 yrs), teenagers (13-19 yrs), young males (19-24 yrs), adults (20 to 64 yrs), older people (over 65 years old), non pregnant females of childbearing age (16 to 44 yrs) and pregnant females (16-44 yrs). The number of respondents for these population groups ranged from 64 to 3282 individuals (Table 4). Children (5-12 yrs) were assessed because of concern over the effects of caffeine on children and availability of consumption information. Teenagers (13-19 yrs) were assessed as the target group for energy drinks and energy shots. Young males (19-24 yrs) were included as a group representing high consumers and for consistency with the New Zealand Total Diet Survey population groups. An exposure assessment of women of childbearing age, both those who identified themselves as pregnant and not pregnant, was included because of concerns of caffeine exposure on pregnancy outcomes. Adults and older people were also included as separate groups due to a higher perceived level of consumption of coffee and tea by these population groups. Each food descriptor identified by each consumer in the previous 24 hour period (approximately 6000 in total) was mapped to one of 52 foods for which a caffeine concentration was available. All other foods were mapped to “other” and assigned a caffeine concentration of 0 mg/100g. The modelling software multiplies the specified concentration of caffeine by the amount of food that an individual consumed in any one serving in order to estimate the exposure from each food item. Once completed for all foods, the total amount of caffeine consumed from all foods is summed for each individual. All individual’s exposures were then ranked and population statistics (mean, median, high and low percentiles) were derived.

Risk Profile:Caffeine in energy drinks and energy shots 46
The exposure estimates were for individual respondents and were not statistically weighted to the New Zealand population. Exposure estimates were based on food consumption on a single day, given that effects are based on acute and not habitual exposures. A3.1.2 Limitations of the exposure assessment Whilst the methodology described provides a realistic estimate of the actual caffeine exposure for the selected sub populations, there are recognized limitations. Not all caffeine containing foods will have been included in the assessment. Whilst every effort was made to include the likely major contributors, for which caffeine concentration data are available, it was not practical to include the complete array of foods that exists and therefore exposures will be underestimated for some consumers. The 52 foods included in the study were mapped to a very much wider range of foods described in the 1997 NNS/2002 CNS (approximately 6000) requiring assumptions that mapped foods have similar caffeine concentrations to the analysed foods. There is a measure of uncertainty around these assumptions. The variability of caffeine in coffee and tea is problematic for an exposure and risk assessment as clearly, the method of preparation will influence the level of exposure. The 24-hour dietary recall records from the 1997 NNS and 2002 CNS are a snapshot of consumption on any one day and will not necessarily represent the typical diet for the individual respondent. The 1997 NNS data is now dated and will likely differ from current consumption practices. These arguments also apply to comparative studies from overseas. A3.2 Estimated exposure from Additional Caffeine from the Consumption of Energy Drinks or Energy Shots Given that energy drinks and energy shots are targeted to young people, and based on overseas consumption intelligence, exposure to additional caffeine from the consumption of these products was calculated for children (5-12 yrs), teenagers (13-19 yrs) and young males (19-24 yrs). Scenarios were defined for one, two, three or four servings of any of the 42 energy drinks or energy shots identified in Table 2 for which caffeine concentration values were available. Two products that listed caffeine as an ingredient but did not state a quantity were not included. Caffeinated alcoholic beverages were not included since these are not legally available for purchase by young people aged less than 18 years. A3.2.1 Methodology Exposure estimates were simulated using @Risk software and a Monte Carlo approach for the selected population groups. Each iteration of the simulation randomly selected a base caffeine exposure (mg/day), the body weight of the respondent with that exposure (kg), and a retail unit of any one caffeinated beverage (mg) and used this combination to calculate an overall caffeine exposure adjusted for body weight (mg/kg bw/day). Simulations were run for 20,000 iterations for each scenario (one, two, three or four caffeinated drinks). An advantage of a Monte Carlo approach over point estimates is that it allows inclusion of all respondents and all food products, reducing bias towards any particular product. In the absence of detail regarding market share and current consumption practices of caffeinated energy drinks or energy shots in New Zealand, the following assumptions were made:
• Only consumers with a background caffeine exposure were included since consumers who do not currently consume caffeine are assumed to be unlikely to seek caffeine from caffeinated beverages.

Risk Profile:Caffeine in energy drinks and energy shots 47
• There is no selection bias to particular products and all 42 products (energy drinks and energy shots) were equally weighted.
• Energy drinks and energy shots were assumed to be alternatives. That is, a consumer would choose either an energy drink, or an energy shot.
• If a person consumed more than one serving of caffeinated beverage, all servings were assumed to be of the same product. There is no data to inform this assumption, but is plausible if it is assumed that consumers are likely to display some brand loyalty.
• All individuals are equally likely to consume these products irrespective of base caffeine intake (i.e. those with high or low base caffeine exposures are equally likely to consume caffeinated beverages).
• A serving equalled a full retail unit.

APPENDIX 4: Overseas Estimates Of Caffeine Exposure Country Year Population group Caffeine exposure
(mg/kg/day) Major Contributors (In descending order of importance)
Reference
Argentina 20052-10 years 11-15 years 16-20 years 21-30 years 31-40 years 41-50 years 51-60 years 60+ years
Mean (95th percentile) 1.3 (3.2) 2.3 (6.6)
4.1 (12.7) 3.8 (7.7)
4.8 (10.5) 5.1 (9.6) 4.2 (9.6) 3.7 (8.4)
Soft drinks, chocolate milk Mate, coffee, soft drinks Mate, coffee, soft drinks Mate, coffee, soft drinks Mate, coffee Mate, coffee Mate, coffee Coffee, mate
(Olmos et al., 2009)
Brazil 1993 10-19 years 20-29 years 30-39 years 40-49 years 50-59 years 60+ years Overall
Mean mg/day 127 150 189 192 178 195
2.74 mg/kg/day
Coffee, tea, soft drinks Coffee, tea Coffee, tea Coffee, tea Coffee, tea, soft drinks chocolate,
(Rojo Camargo, 1999)
Denmark 1991 (7 day average) 1-5 years 6-9 years 10-14 years 15-19 years 20-24 years 25-34 years 35-49 years 50-64 years 65+ years Pregnant
Mean (90th percentile) 0.3 (0.7) 0.6 (2.5) 0.7 (1.5) 2.1 (5.5)
4.8 (12.3) 7.9 (15.7) 9.9 (17.6) 8.9 (17.1) 7.8 (15.0) 5.8 (12.1)
Tea Tea Coffee, tea Coffee, tea Coffee, tea Coffee, tea Coffee, tea Coffee, tea Coffee, tea Coffee, tea
(Barone and Roberts, 1996)
UK 1988 (7 day average) 1-5 years 6-9 years
Mean (90th percentile) 2.29 (6.86) 1.77 (4.23)
Instant coffee, tea Brewed coffee, tea
(Barone and Roberts, 1996)
Risk Profile:Caffeine in energy drinks and energy shots 48

Country Year Population group Caffeine exposure (mg/kg/day)
Major Contributors (In descending order of importance)
Reference
10-14 years 15-19 years 20-24 years 25-34 years 35-49 years 50-64 years 65+ years Pregnant
2.04 (5.19) 2.58 (6.81) 4.25 (8.16) 4.23 (8.34) 5.16 (8.80) 4.87 (7.70) 3.95 (6.33) 3.43 (6.51)
Instant coffee, brewed coffee, tea Brewed coffee, instant coffee, tea Brewed coffee, tea, instant coffee Instant coffee, tea, brewed coffee Brewed coffee, instant coffee, tea Tea, brewed coffee, instant coffee Tea, brewed coffee, instant coffee Tea, brewed coffee, instant coffee
UK 2003 Pregnant women Before pregnancy 5-12 weeks Third trimester Throughout pregnancy
Mean mg/day mg/kg/day*
238 3.5 139 2.1 153 2.3 159 2.4
Tea (62%), coffee (14%), cola drinks (12%), chocolate (8%), soft drinks (2%), energy drinks (1%)
(Care Study Group, 2008)
USA 1975 (14 day average) 0-11 months 1-5 years 6-11 years 12-17 years 18+ years
Mean (90th percentile) 0.47 (0.51) 1.21 (3.14) 0.86 (2.04) 0.75 (1.79) 2.64 (5.19)
Tea Tea, coffee, soft drinks Tea, coffee, soft drinks Tea, coffee, soft drinks Coffee, tea
(Barone and Roberts, 1996)
USA 1989 (14 day average) 0-11 months 1-5 years 6-11 years 12-17 years 18-24 years 25+ years Pregnant/nursing
Mean (90th percentile) 0.32 (0.68) 0.95 (2.10) 0.67 (1.40) 0.65 (1.40) 1.10 (2.80) 2.40 (5.20) 0.91 (2.50)
Coffee, tea Coffee, tea, soft drinks Tea, coffee, soft drinks Coffee, tea, soft drinks Coffee, tea, soft drinks Coffee, tea, soft drinks Coffee, tea, soft drinks
(Barone and Roberts, 1996)
USA 1987-1988 (3 dayaverage)
1-5 year 6-9 years 10-14 years 15-19 years 20-24 years
Mean (90th percentile) 1.33 (2.79) 1.10 (2.38) 1.08 (2.03) 0.98 (1.82) 1.79 (3.99)
Coffee, tea, soft drinks Coffee, tea, soft drinks Coffee, tea, soft drinks Coffee, tea, soft drinks Coffee, tea, soft drinks
(Barone and Roberts, 1996)
Risk Profile:Caffeine in energy drinks and energy shots 49

Risk Profile:Caffeine in energy drinks and energy shots 50
Year Population group Caffeine exposure (mg/kg/day)
Major Contributors (In descending order of importance)
Reference Country
25-34 years 35-49 years 50-64 years 65+ years Pregnant women Nursing women
3.13 (7.51) 3.69 (8.16) 3.81 (8.11) 3.05 (6.69) 1.47 (3.33) 2.63 (5.74)
Coffee, tea, soft drinks Coffee, tea, soft drinks Coffee, tea, soft drinks Coffee, tea, soft drinks Coffee, tea, soft drinks Coffee, tea, soft drinks
USA 1994-1996, 1998 (2 day average)
2-5 years 6-11 years 12-17 years Female 12-17 years Male 18-34 years Female 18-34 years Male 35-54 years Female 35-54 years Male 55-64 years Female 55-64 years Male 65+ years Female 65+ years Male Pregnant women
Mean 0.4 0.4 0.5 0.6 1.2 1.1 1.7 1.8 1.5 1.8 1.3 1.3 0.8
Soft drinks, tea Soft drinks, tea Soft drinks, tea Soft drinks, tea Coffee, soft drinks, tea Coffee, soft drinks, tea Coffee>>soft drinks, tea Coffee>>soft drinks, tea Coffee Coffee Coffee>>tea Coffee Coffee, soft drinks, tea
(Frary et al., 2005)
Assuming average 67 kg body weight

APPENDIX 5: Cumulative probability curves of total caffeine exposure for children, teenagers and young males consuming 1-4 energy drinks or energy shots in addition to baseline dietary exposure. An adverse effect level of 3 mg/kg bw/day is shown on each graph as a reference point. The portion of each curve to the right of the adverse effect level represents the proportion of the population group potentially at risk from adverse effects of caffeine. The exposure of any percentile may be read off the x- axis by extrapolating from the intersection of the selected percentile on the y-axis with the curve of one, two, three or four retail units consumed, where cumulative probability = 0.2 represents the 20th percentile, 0.4 = 40th percentile etc.
Children (5-12 yrs)
0
0.2
0.4
0.6
0.8
1
0 10 20 30 40 50 60
Caffeine exposure (mg/kg bw/day)
Cum
ulat
ive
prob
abili
ty
1 Retail unit2 Retail units3 Retail units4 Retail units
3 mg/kg bw/day
Figure 9: Cumulative probability curve of children (5-12 yrs) consuming 1-4 retail units of energy drinks or energy shots
Risk Profile:Caffeine in energy drinks and energy shots 51

Teenagers (13-19 yrs)
0
0.2
0.4
0.6
0.8
1
0 10 20 30
Caffeine exposure (mg/kg bw/day)
Cum
ulat
ive
prob
abili
ty
1 Retail unit2 Retail units3 Retail units4 Retail units
3 mg/kg bw/day
Figure 10: Cumulative probability curve of teenagers (13-19 yrs) consuming 1-4
retail units of energy drinks or energy shots
Young males (19-24 yrs)
0
0.2
0.4
0.6
0.8
1
0 5 10 15 20 25 30 35
Caffeine exposure (mg/kg bw/day)
Cum
ulat
ive
prob
abili
ty
1 Retail unit2 Retail units3 Retail units4 Retail units
3 mg/kg bw/day
Figure 11: Cumulative probability curve of young males (19-24 yrs) consuming 1-4 retail
units of energy drinks or energy shots
Risk Profile:Caffeine in energy drinks and energy shots 52