Embed Size (px)
Citation preview
133ECONOMIE ET STATISTIQUE / ECONOMICS AND STATISTICS N° 514‑515‑516, 2020
Risk of Social Exclusion and Resources of Young NEETs
Claire Bonnard, Jean‑François Giret and Yann Kossi*
Abstract – The category of young people not in employment, education or training, often known by the acronym NEET, has become a target of public policies to combat the integration difficulties faced by young adults in different countries. However, the category remains heavily criticised due to the heterogeneity of the sub‑populations that comprise it. Using the Enquête nationale sur les ressources des jeunes (National survey on the resources of young adults, ENRJ), this article addresses the diversity of NEET situations in relation to their risk of social exclusion. This risk is analysed through a multidimensional analysis taking into account their employment status, training, health and social relations. The results show that the risk factors are not exactly the same in each dimension, even though an absence of educational qualifications is very dama‑ging in all four dimensions. They also underline the difficulty of putting into perspective the monetary resources of young adults in NEET situations with the risks of social exclusion.
JEL Classification: I32, I24Keywords: NEET, social exclusion, fuzzy sets approach, resources
* Iredu EA7318, Université de Bourgogne‑Franche‑Comté, Centre associé Cereq (claire.bonnard@u‑bourgogne.fr ; jean‑francois.giret@u‑bourgogne.fr ; yann.kossi@univ‑tours.fr)We would like to thank the anonymous reviewers for their constructive comments that have enabled us to improve the first version of this article, as well as Mickaël Portela, Sébastien Grobon and all the participants of the ENRJ exploitation group. This research received funding from the ANR 15ORAR00501.Received on 29 January 2019, accepted after revisions on 7 December 2019.Translated from: Risque d’exclusion sociale et ressources des jeunes NEETCitation: Bonnard, C., Giret, J.‑F. & Kossi, Y. (2020). Risk of Social Exclusion and Resources of Young NEETs. Economie et Statistique / Economics and Statistics, 514‑515‑516, 133–154. https://doi.org/10.24187/ecostat.2020.514t.2010
Rem
inde
r: Th
e opin
ions a
nd an
alyse
s in t
his ar
ticle
are t
hose
of th
e auth
or(s)
and d
o not
nece
ssar
ily re
flect
their i
nstitu
tion’s
or In
see’s
view
s.
ECONOMIE ET STATISTIQUE / ECONOMICS AND STATISTICS N° 514-515-516, 2020134
The proportion of young who fall into the NEET category, i.e. those who are not
in education, employment or training, has in recent years become a key indicator for study‑ing the problems of young people’s integration and insecurity in respect of the labour market (Carcillo et al., 2015). This category is increas‑ingly highlighted in the speeches of political leaders within the European Union, includ‑ing in France. The NEET rate is an indicator used in various official publications to com‑pare the state of the youth labour market in different countries. In 2017, according to Eurostat, 17.2% of young people aged 20 to 34 in the European Union fall into the NEET1 category; this proportion varies from 7.8% in Sweden to 29.5% in Italy, with France in the middle with a NEET rate of 18.2%. This rate varies slightly depending on the age group considered. Thus, for France in 2015, Minni & Galtier (2017) demonstrate that the NEET rate ranges from 6.2% for 15‑19 year olds to 18.1% for 20‑24 year olds and 20% for 25‑29 year olds. In addition, this rate is not always directly linked to the development of the finan‑cial situation because it depends, due to its make‑up, on the enrolment rate of young adults at different ages, with the increase of the latter automatically leading to a decrease in the NEET rate. Accordingly, there may be a dis‑connect between the development of the NEET rate and the youth unemployment rate between countries.
In this article, we propose reviewing the make‑up of this category and the criticisms that can be made of it. For the European Union, NEETs are “hardest to reach out to” and in particular include “those facing poverty, social exclu‑sion, disability and discrimination” (European Commission, 2016, p. 1). The challenge is to discuss this definition by examining the links between NEETs, social exclusion and poverty. The first section presents the origin of the NEET category, then the debates it has generated since its creation in France and Europe. We focus on an important dimension that is partly overshadowed by the classification as NEETs, that of the social exclusion of young adults, even though it seems key to analysing their difficulties. In the second section, we propose operationalising this social exclusion dimension and applying it to young NEETs based on a fuzzy and multidimensional approach. To achieve this, we use data from the National Survey on the Resources of Young Adults (Enquête nationale sur les ressources des jeunes ‑ ENRJ) carried out by DREES and Insee, concerning young adults aged 18 to 24.
Using the same survey, the final section explores the link between the various dimensions of social exclusion and the resources of young adults.1
1. The Make‑Up of the NEET Category and its Limits
Developed in the United Kingdom in the 1980s, the NEET category was intended to replace the “status zero” category, people who were not well identified by the main labour market categories, and to broaden the category of unemployed people which was too dependent on international nomenclature (Furlong, 2006). This NEET category, which was initially intended to identify young adults in vulnerable situations, has nevertheless developed to cover much more heterogeneous situations when considering the employability of young people (Furlong, 2007). Having become an adminis‑trative category, particularly at the European level, and a target population for public poli‑cies, it is said to include all young people who do not accumulate human capital (Mascherini & Ledermaier, 2016). However, Gautié (2016) suggests an underlying problem: only employ‑ment, training or education would be designated “socially desirable (or even acceptable?), thus logically excluding not only unemployment but also voluntary inactivity”.
1.1. A Highly Heterogeneous Category
It is possible to frame the growing interest in this category within a more general question about the category of the unemployed as a historical and social construct (Baverez et al., 1986). The invention of unemployment in the context of the workforce makes it possible to group together different populations not in employment. Gautié (2002) is concerned about a “process symmet‑rical to that of the invention of unemployment” in which the specific characteristics of each population would become key: unemployment would lose its strength, both as a category to represent the reality of the labour market and as a category for action by public authorities. We note that the emergence of the NEET category not only makes it possible to produce an addi‑tional indicator for the labour market, but it also delineates a target population for young people as part of the Youth Guarantee. It is specified that
1. For the purpose of simplicity, the term NEET will be used to refer to young people who fall into this category.
ECONOMIE ET STATISTIQUE / ECONOMICS AND STATISTICS N° 514-515-516, 2020 135
Risk of Social Exclusion and Resources of Young NEETs
this scheme should target “vulnerable NEETs”2, with reference in particular to the young person’s level of financial resources, which may call into question its operational nature in public action. Furthermore, a report by Eurofound (2016) recommends the development of policies targeted at sub‑groups within the NEET category to meet their specific needs. This was the case for the Youth Contract, for example, which was offered to young British people who were theoretically NEETs, with additional criteria in terms of levels of educational qualifications with varying degrees of restrictiveness at national level or at the level of certain municipalities (Newton et al., 2014).3
Criticism of the NEET indicator and the desire to develop it, or even to go beyond it, are not unique to France (Furlong, 2006, 2007; Thompson, 2011; Maguire, 2015a). Thompson (2011) and Serracant (2014) point out that, in addition to covering a heterogeneity of young people’s situations, this category encourages the individualisation of the public policy measures put in place for these young people. The priority given to training or employment is likely to benefit the least vulnerable young NEETs first and foremost. In contrast, other NEETs, who are considered less employable, may be rele‑gated to second place in such policies, which increases their vulnerability. Hence Serracant’s interest in using a “restricted NEET” indicator, in particular, which takes into account young people who do not work or study and who do not wish to do so. These young people who reject the “functional role” of training and labour market participation are thought to be at the highest risk of social exclusion.
This criticism is in line with a more general examination of the coming together between unemployment and inactivity, due to a decon‑struction of the category of unemployed, which is not unique to France (Lefresne, 2005). For Coutrot & Exertier (2001), this coming together is the symptom of a decline in unemployment driven by British employment policy ‑ which is replicated in European employment policy. However, the boundaries are even more blurred among young people who less often have social security cover for the risk of unemployment.
In France, various studies that have examined the fuzziness between the categories of unem‑ployment and inactivity also show the difficulty of clearly classifying young people (Guillemot, 1996; Gonzales‑Demichel & Nauze‑Fichet, 2003). The period of transition from school to
the labour market is generally characterised by tangle of more or less well‑defined situations (Vincens, 1997; Giret, 2019). Some young people are able to find a job when studying, while others enter the labour market only intermittently after they leave the education system. First and foremost, drop‑outs will find themselves on the fringes of inactivity, educa‑tion and employment and sometimes they may even be difficult to identify by official statistics (Bernard, 2011). For young adults without the Baccalaureate, switches between unemployment and inactivity are sometimes linked to social and family characteristics, in particular for young women with a young child (Guergoat‑Larivière & Lemière, 2018). In higher education, this porosity of the boundaries between periods of job search, training and inactivity also affects students (Charles, 2016): gap years or partici‑pation in a humanitarian, cultural or charity project can take them away from a linear path between training and employment. All of these works indicate that isolation from employment or education and difficulties in accessing the labour market alone do not make it possible to characterise young NEETs, even though an absence of employment or training may be a dimension of it.23
1.2. An Approach Referencing the Risk of Social Exclusion
Among the criticisms of the NEET indicator, a recurring one is its difficulty in defining the degree of exclusion of young people. Numerous studies stress the need to mobilising a multi‑dimensional approach to social exclusion for the study of young people (Hargie et al., 2011). This would have the benefit of differing from other approaches in terms of the transition of young people to adulthood, which would tend to homogenise situations as part of a more or less rapid process of social integration for young people (Silver, 2007a).
1.2.1. Social Exclusion is Multidimensional
Nevertheless, there is no consensus regarding the definition of social exclusion and it is the
2. A condition tied to resources is required to claim the Youth Guarantee. The young person must not receive financial support from their parents and their resources must not exceed €492.58 (pursuant to Decree No 2016‑1855 of 23 December 2016, Ministry of Labour).3. However, in their assessment of this scheme, Newton et al. (2014) stress that the stated criterion of being a NEET, as a requirement for acces‑sing the programme, was not always respected.
ECONOMIE ET STATISTIQUE / ECONOMICS AND STATISTICS N° 514-515-516, 2020136
cause of much discussion.4 In the early 1990s in academic studies, particularly in Europe, Paugam (1998) underlines that social exclu‑sion refers to a “multidimensional process of accumulation of handicaps that can lead, in particular, to the breakdown of social ties”. To a certain extent, this definition is in line with the five aspects identified by Silver & Miller (2003) in the definition of social exclusion. Firstly, the authors underline that social exclusion refers to a dynamic, a process. It is not really possible to identify a threshold separating the “excluded” from the “included”, however social exclusion refers to a “continuum of positions” between inclusion and exclusion. Secondly, social exclusion is multidimensional. It impacts both individual and societal dimensions. However, there is no real consensus on the dimensions to be taken into account, the dimensions identified in the literature generally being linked with rela‑tional disadvantages both economic and social in nature (Silver, 2007b). Thirdly, social exclu‑sion is active in the sense that it results from the behaviour of other actors (those not excluded) or even institutions. The fourth aspect defining social exclusion is its relational dimension. This results in the social isolation of the individual through a lack of social networks, a lack of participation in social life or even situations of rejection. Finally, the authors stress that this notion is highly dependent on the context and on the reference made to inclusion. It therefore varies in time and space in different countries.
For Sen (2000), social exclusion can be anal‑ysed within the more general framework of a capability approach. It is then interpreted as “capability deprivation”. It can be broken down into different dimensions: participating in social life and community life, as well as appearing in public “without shame”, but the deprivation of these capabilities can also lead to other depriva‑tions and limit the individual’s opportunities to enjoy a decent life.5 He underlines the double intrinsic and instrumental dimension of social exclusion: being excluded from certain economic or social aspects may not be experienced as capa‑bility deprivation per se, but is highly likely to lead to further deprivation subsequently, limiting the prospects and opportunities for the individual to enjoy a decent life. While stressing the impor‑tance of the relational component of this type of deprivation, various economic events are likely to lead to social exclusion. Sen illustrates this with the consequences of long‑term unemploy‑ment on different aspects that may contribute to social exclusion. Long‑term unemployment may indeed lead to economic exclusion (loss
of income), exclusion from the labour market (devaluation and non‑accumulation of human capital) and social exclusion (loss of freedom to make decisions and participate in community life), and have repercussions on health (psycho‑logical difficulties, the development of illness) and family life. Long‑term unemployment may also lead to a certain degree of discourage‑ment about future prospects for employment and labour market integration, which may to the long‑term unemployed adopting a passive attitude towards the labour market. All of these dimensions are likely to interact and reinforce social exclusion.45
The consequences of social exclusion can be particularly high among young people, as Sen (2000) or Silver (2007a) point out. Various factors are likely to reinforce social exclusion for young people or, on the contrary, protect them from it. Kieselbach (2003) seeks to iden‑tify vulnerability factors that can contribute to the risk of social exclusion of young people in long‑term unemployment in the European Union. Based on a European survey, he identifies several vulnerability factors linked to low quali‑fication levels, a certain degree of passivity on the labour market, an insecure financial situation or even weak social and institutional support. He also shows that social support for young people can be important factors in preventing social exclusion.
1.2.2. Social Exclusion and Poverty
This multidimensional approach to exclusion can also be linked to that of income poverty. Thus, Carcillo et al. (2015) show that in France the rate of NEETs in situations of income poverty is about twice as high as that of young adults in other situations. In some countries, the search for independence through leaving the parental home can increase the risks of social exclusion and poverty if public policies do not target those young people (France, 2008). This is all the more the case when family resources are insufficient: Bynner & Parsons (2002) show that in England,
4. The first appearance of this term is attributed to Lenoir in his publication “Les exclus : un français sur dix” (1974); the author advocates the imple‑mentation of preventive policies for those he calls the excluded, referring to those with physical and mental disabilities and the socially maladjusted. Social exclusion has since been at the heart of numerous policies, in par‑ticular at European Union level. Nevertheless, it has been subject to seve‑ral interpretations, depending on the different countries and paradigms in question.5. Thus, Sen (2000, p. 4) states: “Being excluded from social relations can lead to other deprivation as well, thereby further limiting our living opportu‑nities. […] Social exclusion can, thus, be constitutively a part of capabilities deprivation as well as instrumentally a cause of diverse capability failures”.
ECONOMIE ET STATISTIQUE / ECONOMICS AND STATISTICS N° 514-515-516, 2020 137
Risk of Social Exclusion and Resources of Young NEETs
it is the main factor in unqualified young girls falling into the NEET category.
Nevertheless, while social exclusion and income poverty may be closely linked, these situations do not always overlap. Indeed, while poverty may contribute to social exclusion, people who feel excluded may not be considered poor and vice versa. Social exclusion has a dynamic aspect, in contrast to the income poverty indicator which generally measures an individual’s poverty status at a given point in time (Silver, 2007b). Therefore, the income poverty is not thought to really make it possible to identify the “social mechanisms and relations” (Silver, 2007a) that can explain the more or less transitory nature of the individual’s situation. Subjective poverty indicators that ask people directly about their perception of their situation may be considered a more relevant measurement of social exclu‑sion. In fact, as Duvoux & Papuchon (2018) point out, subjective poverty depends on the life trajectories of individuals; they analyse it as “an indicator of lasting social insecurity, associated with an increase in pessimism about the future”. In addition, the dynamic of social exclusion is not necessarily linear and linked to the process of moving out of the parental home. Living in the parental home is not a bulwark against the social exclusion of young adults who cannot find a job, even though it can protect them from a certain level of income poverty. Likewise, young people who return to the parental home, while employed or having lost their jobs, who face difficulties in accessing housing (Maunaye, 2016), are not necessarily affected by all the different dimen‑sions of social exclusion.
These different insights underline the strong heterogeneity of the NEET statistical category. While it includes situations of social exclusion and income poverty, it groups together young people experiencing an extremely wide variety of social and economic situations, some of whom appear to be far removed from public policy targets.
It therefore seems important to understand the difficulties in terms of degrees of social exclusion, making it possible to overcome some of the limitations of the NEET indicator. This approach has the advantage of taking into consideration the diversity of these young people’s situations with respect to social exclu‑sion by reasoning in terms of the continuum of positions noted by Silver (2007b). It transforms the individual conception of the NEET indicator by repositioning the individual within a set of
social relationships, and can also be analysed as proposed by Sen (2000) in a more general framework of capability deprivation. Another underlying dimension concerns the absence or scarcity of monetary resources assumed to be available to young NEETs, which would go hand in hand with their exclusion. The analysis of young people’s resources should lead to a better understanding of how poverty and social exclu‑sion combine for young NEETs. This issue of resources is also central to public policy concerns regarding NEETs, either because they target a maximum income threshold for beneficiaries or because they offer income to young people as part of a more general support programme. In France, the conditions for obtaining the Youth Guarantee impose a maximum level of resources of just under €500 in 2019. At the same time, the scheme offers an allocation of the same amount within the framework of a commitment contract. In different countries, policies specifically aimed at young NEETs also offer financial incentives aimed at re‑engaging young people in a return to employment or training (Mascherini, 2017), with the resources generally granted subject to a commitment by the young person.
2. Measuring Social Exclusion using A Fuzzy Set Approach
Empirical measurement of social exclusion is difficult due to its multidimensional and dynamic nature. The fuzzy set approach makes it possible to take these different aspects into account. This approach has been used to measure youth poverty (Vero & Werquin, 1998), health (Alperin, 2016) and even the downgrading of young graduates (Betti et al., 2011). The benefit of this approach is that it makes it possible to go beyond a dichotomous vision (NEET or not NEET) and to have a multidimensional and gradual measurement of the risk of social exclusion.
Formally, each item of the risk of social exclu‑sion �x is characterised by a membership function µ .( ) contained within a range [0, 1]. Where µ � x( ) = 1, the young person can be considered to be excluded. If µ � x( ) = 0, the young person can be considered not to be excluded. If � �0 1< ( ) <µ x , the function becomes a measurement of the risk of social exclusion with an intensity ranging from 0 to 1.
In the first stage, the membership functions of each item must be calculated. Various methods
ECONOMIE ET STATISTIQUE / ECONOMICS AND STATISTICS N° 514-515-516, 2020138
allow the construction of the membership func‑tion, depending on the type of variable. The approach developed by Cheli & Lemmi (1995) has been used here:
µ µx
x x k
xF x F x
kk k
( ) =
= =
( ) +( ) −
−
� � � � � � � � � � � � � � � � � � � � � � � � � ;0 11
1
si−−( )
− ( ) = >
=
1
111
1
F xx x k
x x k
k
K
� � ;
� � � � � � � � � � � � � � � � � � � � � � � � � ;
si
si ==
K
where k (k=1,...,K) are the modalities of item x and where the higher k is, the more intense the feeling of deprivation concerning this item.
� �F xk( ) corresponds to the distribution func‑tion of x for the modality k. The advantage of this method is that it does not rely on certain a priori assumptions because critical thresh‑olds of deprivation are not to be determined (Martinetti, 2000). It is also described as a totally fuzzy and relative approach (Cheli & Lemmi, 1995). Other methods have been developed in the literature, in particular that of Cerioli & Zani (1990), which is described as totally fuzzy. The selection of Cheli & Lemmi’s method is based on the type of items used and the fact that the modalities are not equally distributed (Martinetti, 2000).
In the second stage, the different items are grouped together within k dimensions. The number of dimensions selected and the make‑up of items in each dimension have been confirmed using factor analysis. Several weighting methods can be used to aggregate items by dimension. Their advantages and limitations have been discussed in the literature (Martinetti, 2000). Here we use the weighting method developed by Betti & Verma (1999). The advantage of this weighting method is that it takes into account the frequency of each item in the dimension, while limiting the influence of items that are highly correlated with each other (Alperin & van Kerm, 2009).
So, xij∈ 0 1,[ ] is the item for the risk of social exclusion j M∈ � , ,1 … of the individual i N∈1, ,… . The dimension of the risk of social exclusion k for the individual i, written as Dik is determined by:
D w xikj
M
j ij==
∑1
where wj corresponds to the weights from the weighting method of Betti & Verma (1999). These weights correspond to the product of two components (Alperin & van Kerm, 2009):
w w wj ja
jb= ( )*
where wja is the variation coefficient for xij:
w x x x Nja
i
N
ij j j= −( )
=
∑1
21 2
1 2/
//
where x j is the arithmetic mean of xij
and
w F Fjb
j
M
j j j j Hj
M
j j j j= + <
≥
=
−
=′ ′ ′ ′∑ ∑1
1
1
1', ,
', ,( � ) ( �ρ ρ ρ ρ ρ ρHH )
−1
where ρ j j, ′ is the coefficient for correlation between the social exclusion risk items j and j’, F() is an indicator function that takes the value 1 if the condition in brackets is completed, otherwise it takes 0. ρH is a predetermined corre‑lation threshold corresponding to the greatest difference between two ordered correlation coefficients (Alperin & van Kerm, 2009).
These dimensions can then be aggregated into a multidimensional social exclusion risk indicator. To achieve this, the same weighting method of Betti & Verma (1998) was applied. The social exclusion risk indicator vi for each individual i is therefore calculated in the following manner:
v Dik
M
k ikk
M
k== =
∑ ∑1 1
ϕ ϕ/
where ϕk is the weighting of dimension k, calcu‑lated based on Betti & Verma’s formula.
The indicator for the risk of social exclusion Vp for the whole population can then be written (Alperin & van Kerm, 2009):
VN
vpi
N
i==∑1
1
Since vi is a linear function of Dik, the social exclusion risk indicator in the population of dimension k, named vk can be determined by:
v D n nki
N
ik ii
N
i== =∑ ∑
1 1
/
The social exclusion risk indicator can then be re‑written:
V vpk
M
k kk
M
k== =
∑ ∑1 1
ϕ ϕ/
The relative contribution of dimension k to the social exclusion risk indicator is therefore given by:
C vpk
k kk
M
k==
∑ϕ ϕ/1
ECONOMIE ET STATISTIQUE / ECONOMICS AND STATISTICS N° 514-515-516, 2020 139
Risk of Social Exclusion and Resources of Young NEETs
2.1. The Dimensions of Social Exclusion
The data used are taken from the ENRJ carried out in 2014 by DREES and Insee; 5,800 young French people aged 18 to 24 were surveyed. The survey makes it possible to understand the young person’s situation at the time of the survey as well as his or her progress over the past year. It is also one of the first surveys in France to ask young people and their parents precise questions on the type of relationships they have, as well as the different resources received by the young person.
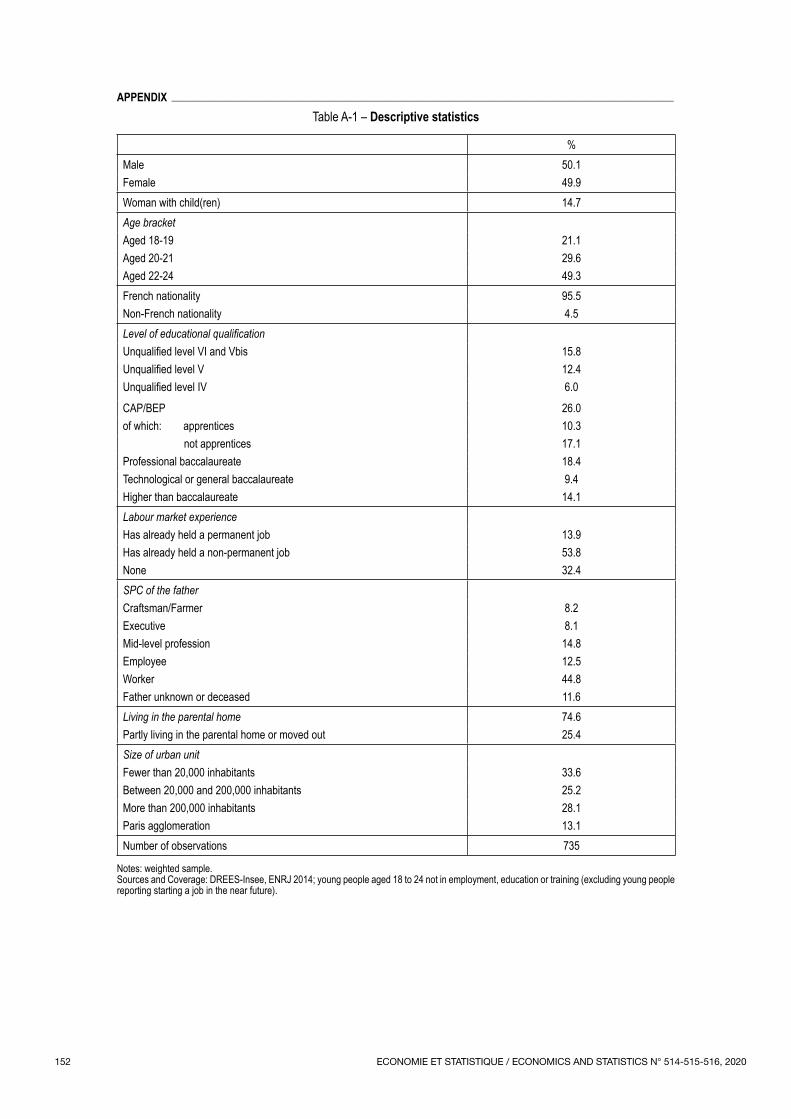
Among these young people, a sample of 907 observations meet the usual definition of NEETs (19.7% of young people aged 18 to 246). We exclude from the analysis those who report having found a job they are scheduled to start in the near future (19% of NEETs); in fact, the questionnaire does not ask them to answer a number of questions related to their job search. In total, we have a sample of 735 young people. To provide a quick overview of these young people (see Table A‑1 in the Appendix), it can be noted that they are equal parts male (50.1%) and female (49.9%), with an average age of 21.3 years. The majority of them still live with their parents (74.6% compared to 25.4% who partly live in the parental home7 or have moved out completely). They have a relatively low level of educational qualifications, although some of them (14.1%) have a qualification higher than a baccalaureate and 32.1% are school leavers without secondary school qualifications.8 Finally, they are mostly from the most disadvantaged categories: 44.8% of these young people have a father who is or was a blue‑collar worker.
In order to measure the risks of social exclusion, one of the most important stages is the selection of the relevant items. Several dimensions have been proposed in the literature, generally refer‑ring to both economic and social aspects. We have selected four dimensions that include the following items:
‑ isolation from the labour market, including i) the desire to work, ii) the job search process, and iii) the activity carried out during the year;
‑ isolation from education and training, described by i) having studied during the year, ii) having completed an internship during the year, and iii) the desire to resume studies in the future;
‑ social integration as measured by i) the type of relationship with the mother, ii) the type of relationship with the father, iii) membership in an association, and iv) leisure time expenditure;
‑ the state of health as determined by i) subjec‑tive assessment by the respondent of his or her state of health, ii) having a chronic disease, and iii) having been restricted in recent months due to a health problem.678
All of these dimensions make it possible to identify the extent of a young person’s social exclusion. The membership functions and the distribution of each item are presented in Table A‑2 in the Appendix. To determine the relevance of these dimensions, principal component factor analysis9 was carried out on these different indi‑cators. The results presented in the Appendix in Table A‑3 indicate that four‑factor structuring is consistent.
2.2. Risk of Social Exclusion of Young NEETs
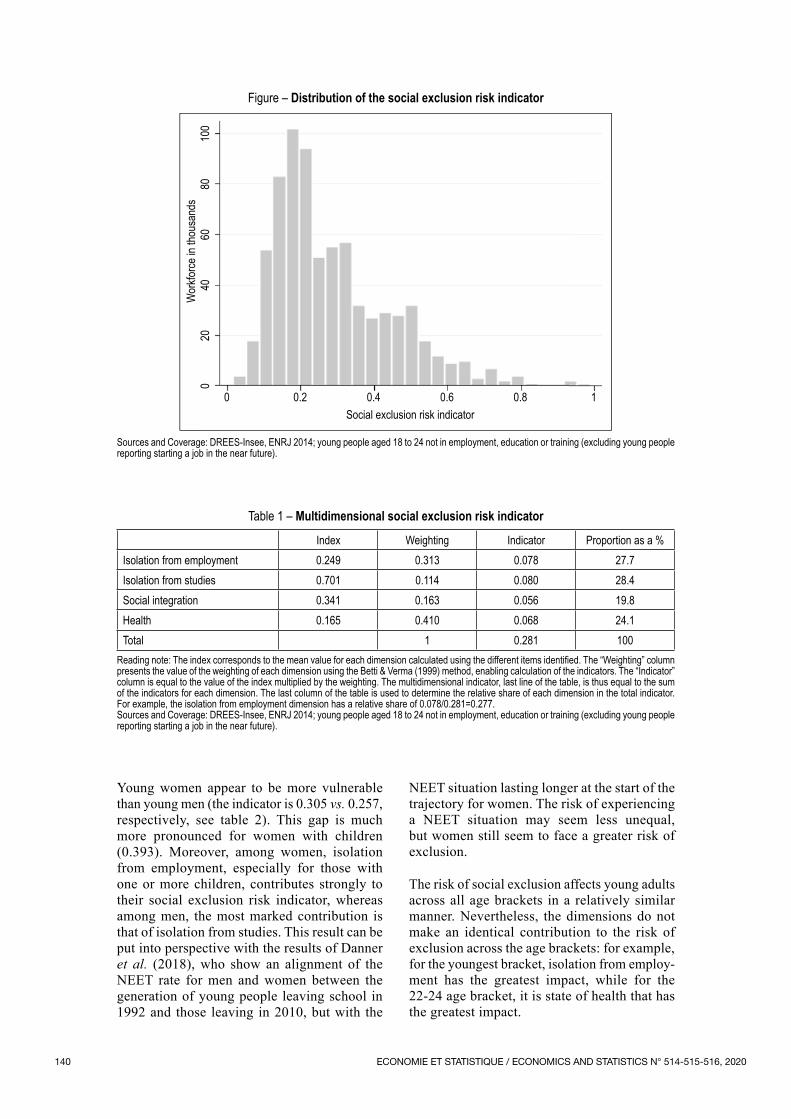
According to the fuzzy set approach, the social exclusion risk indicator of young NEETs is 0.281, with large disparities within the sample, with a standard deviation of 0.157 (see Figure). A proportion of young NEETs have a relatively low risk of social exclusion (close to 0): 25% of them have an exclusion indicator lower than 0.164. In addition, 50% of young NEETs have an exclusion indicator of between 0.164 and 0.359, while this indicator exceeds 0.5 for 10% of young people, those who can be considered extremely vulnerable in the four defined dimensions.
The two dimensions that contribute most to the social exclusion risk indicator are isolation from education (28.4%) and isolation from employ‑ment (27.7%). State of health contributes 24.1% and social integration contributes 19.8% (Table 1).
The social exclusion risk indicator can then be decomposed by sub‑group of socio‑economic characteristics (see Box). This decomposition makes it possible to determine, on the one hand, the factors of vulnerability to social exclusion and, on the other hand, the dimensions of exclu‑sion that are likely to be the most important according to the different profiles of young people.
6. The data have been weighted. 7. In this survey, young people are considered to be partly living in the parental home when they live there some of the time and live elsewhere the rest of the time.8. Young school leavers without secondary school qualifications have been distributed according to the highest level of education attained. A dis‑tinction is made between training levels VI/V bis, V and IV.9. As the variables are category specific, we performed the factor analysis on the polychoric correlation matrix.
ECONOMIE ET STATISTIQUE / ECONOMICS AND STATISTICS N° 514-515-516, 2020140
Young women appear to be more vulnerable than young men (the indicator is 0.305 vs. 0.257, respectively, see table 2). This gap is much more pronounced for women with children (0.393). Moreover, among women, isolation from employment, especially for those with one or more children, contributes strongly to their social exclusion risk indicator, whereas among men, the most marked contribution is that of isolation from studies. This result can be put into perspective with the results of Danner et al. (2018), who show an alignment of the NEET rate for men and women between the generation of young people leaving school in 1992 and those leaving in 2010, but with the
NEET situation lasting longer at the start of the trajectory for women. The risk of experiencing a NEET situation may seem less unequal, but women still seem to face a greater risk of exclusion.
The risk of social exclusion affects young adults across all age brackets in a relatively similar manner. Nevertheless, the dimensions do not make an identical contribution to the risk of exclusion across the age brackets: for example, for the youngest bracket, isolation from employ‑ment has the greatest impact, while for the 22‑24 age bracket, it is state of health that has the greatest impact.
Figure – Distribution of the social exclusion risk indicator
0 0.2 0.4 0.6 0.8 1
020
4060
8010
0W
orkfo
rce in
thou
sand
s
Social exclusion risk indicator
Sources and Coverage: DREES‑Insee, ENRJ 2014; young people aged 18 to 24 not in employment, education or training (excluding young people reporting starting a job in the near future).
Table 1 – Multidimensional social exclusion risk indicator
Index Weighting Indicator Proportion as a %Isolation from employment 0.249 0.313 0.078 27.7Isolation from studies 0.701 0.114 0.080 28.4Social integration 0.341 0.163 0.056 19.8Health 0.165 0.410 0.068 24.1Total 1 0.281 100
Reading note: The index corresponds to the mean value for each dimension calculated using the different items identified. The “Weighting” column presents the value of the weighting of each dimension using the Betti & Verma (1999) method, enabling calculation of the indicators. The “Indicator” column is equal to the value of the index multiplied by the weighting. The multidimensional indicator, last line of the table, is thus equal to the sum of the indicators for each dimension. The last column of the table is used to determine the relative share of each dimension in the total indicator. For example, the isolation from employment dimension has a relative share of 0.078/0.281=0.277. Sources and Coverage: DREES‑Insee, ENRJ 2014; young people aged 18 to 24 not in employment, education or training (excluding young people reporting starting a job in the near future).
ECONOMIE ET STATISTIQUE / ECONOMICS AND STATISTICS N° 514-515-516, 2020 141
Risk of Social Exclusion and Resources of Young NEETs
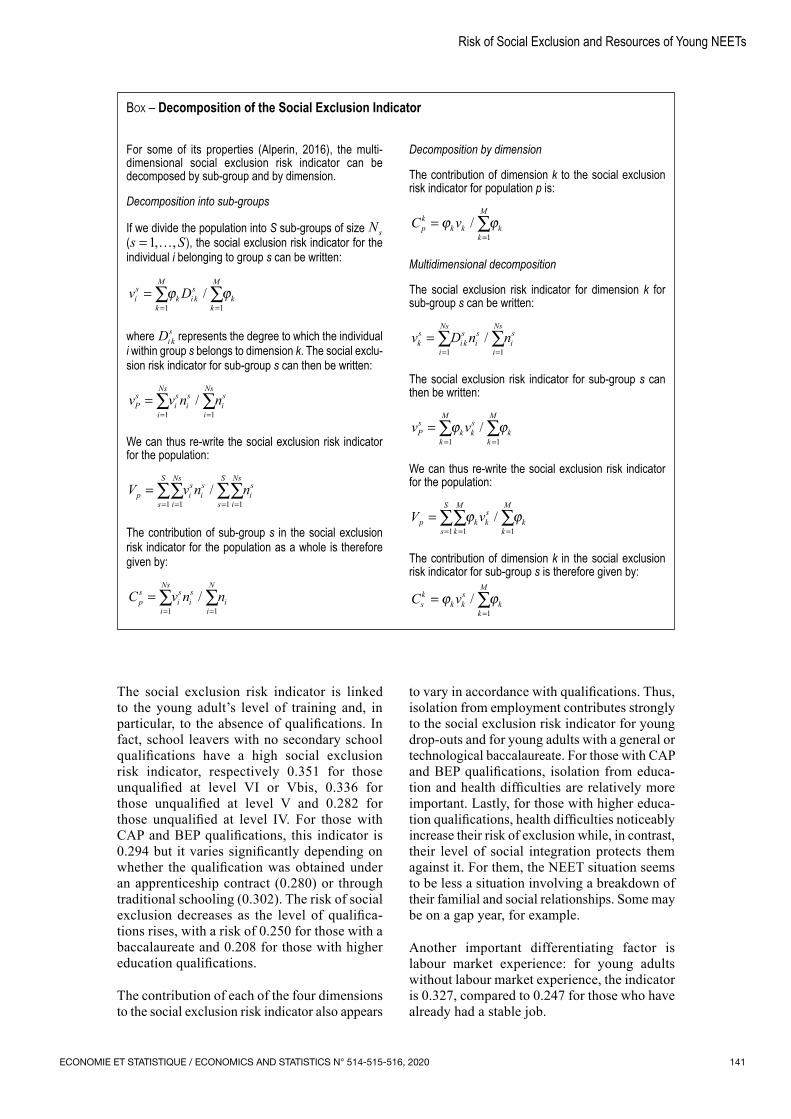
Box – Decomposition of the Social Exclusion Indicator
For some of its properties (Alperin, 2016), the multi‑dimensional social exclusion risk indicator can be decomposed by sub‑group and by dimension.
Decomposition into sub‑groups
If we divide the population into S sub‑groups of size Ns (s S= …1, , ), the social exclusion risk indicator for the individual i belonging to group s can be written:
v Dis
k
M
k i ks
k
M
k== =
∑ ∑1 1ϕ ϕ/
where Di ks represents the degree to which the individual
i within group s belongs to dimension k. The social exclu‑sion risk indicator for sub‑group s can then be written:
v v n nPs
i
Ns
is
is
i
Ns
is=
= =∑ ∑
1 1/
We can thus re‑write the social exclusion risk indicator for the population:
V v n nps
S
i
Ns
is
is
s
S
i
Ns
is=
= = = =∑∑ ∑∑
1 1 1 1/
The contribution of sub‑group s in the social exclusion risk indicator for the population as a whole is therefore given by:
C v n nps
i
Ns
is
is
i
N
i== =∑ ∑
1 1/
Decomposition by dimension
The contribution of dimension k to the social exclusion risk indicator for population p is:
C vpk
k kk
M
k==
∑ϕ ϕ/1
Multidimensional decomposition
The social exclusion risk indicator for dimension k for sub‑group s can be written:
v D n nks
i
Ns
i ks
is
i
Ns
is=
= =∑ ∑
1 1/
The social exclusion risk indicator for sub‑group s can then be written:
v vPs
k
M
k ks
k
M
k== =
∑ ∑1 1ϕ ϕ/
We can thus re‑write the social exclusion risk indicator for the population:
V vps
S
k
M
k ks
k
M
k== = =
∑∑ ∑1 1 1
ϕ ϕ/
The contribution of dimension k in the social exclusion risk indicator for sub‑group s is therefore given by:
C vsk
k ks
k
M
k==
∑ϕ ϕ/1
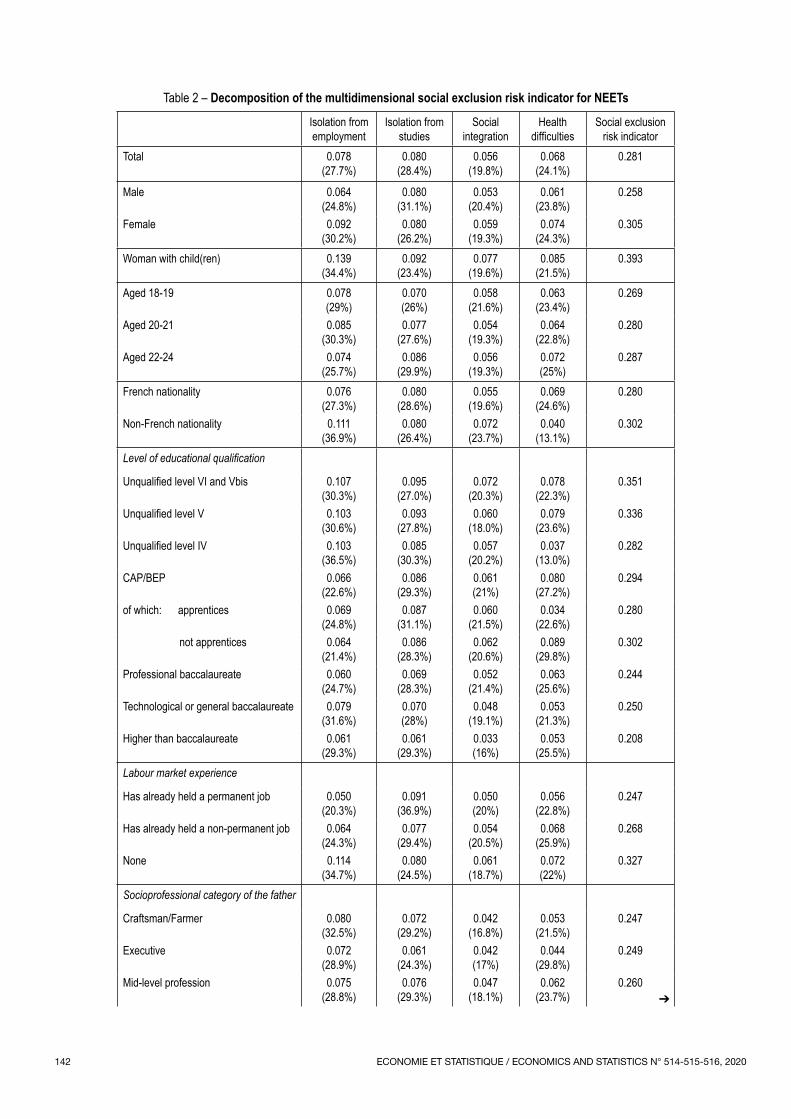
The social exclusion risk indicator is linked to the young adult’s level of training and, in particular, to the absence of qualifications. In fact, school leavers with no secondary school qualifications have a high social exclusion risk indicator, respectively 0.351 for those unqualified at level VI or Vbis, 0.336 for those unqualified at level V and 0.282 for those unqualified at level IV. For those with CAP and BEP qualifications, this indicator is 0.294 but it varies significantly depending on whether the qualification was obtained under an apprenticeship contract (0.280) or through traditional schooling (0.302). The risk of social exclusion decreases as the level of qualifica‑tions rises, with a risk of 0.250 for those with a baccalaureate and 0.208 for those with higher education qualifications.
The contribution of each of the four dimensions to the social exclusion risk indicator also appears
to vary in accordance with qualifications. Thus, isolation from employment contributes strongly to the social exclusion risk indicator for young drop‑outs and for young adults with a general or technological baccalaureate. For those with CAP and BEP qualifications, isolation from educa‑tion and health difficulties are relatively more important. Lastly, for those with higher educa‑tion qualifications, health difficulties noticeably increase their risk of exclusion while, in contrast, their level of social integration protects them against it. For them, the NEET situation seems to be less a situation involving a breakdown of their familial and social relationships. Some may be on a gap year, for example.
Another important differentiating factor is labour market experience: for young adults without labour market experience, the indicator is 0.327, compared to 0.247 for those who have already had a stable job.
ECONOMIE ET STATISTIQUE / ECONOMICS AND STATISTICS N° 514-515-516, 2020142
Table 2 – Decomposition of the multidimensional social exclusion risk indicator for NEETs
Isolation from employment
Isolation from studies
Social integration
Health difficulties
Social exclusion risk indicator
Total 0.078
(27.7%)0.080
(28.4%)0.056
(19.8%)0.068
(24.1%)0.281
Male 0.064
(24.8%)0.080
(31.1%)0.053
(20.4%)0.061
(23.8%)0.258
Female 0.092
(30.2%)0.080
(26.2%)0.059
(19.3%)0.074
(24.3%)0.305
Woman with child(ren) 0.139
(34.4%)0.092
(23.4%)0.077
(19.6%)0.085
(21.5%)0.393
Aged 18‑19 0.078
(29%)0.070
(26%)0.058
(21.6%)0.063
(23.4%)0.269
Aged 20‑21 0.085
(30.3%)0.077
(27.6%)0.054
(19.3%)0.064
(22.8%)0.280
Aged 22‑24 0.074
(25.7%)0.086
(29.9%)0.056
(19.3%)0.072
(25%)0.287
French nationality 0.076
(27.3%)0.080
(28.6%)0.055
(19.6%)0.069
(24.6%)0.280
Non‑French nationality 0.111
(36.9%)0.080
(26.4%)0.072
(23.7%)0.040
(13.1%)0.302
Level of educational qualification
Unqualified level VI and Vbis 0.107
(30.3%)0.095
(27.0%)0.072
(20.3%)0.078
(22.3%)0.351
Unqualified level V 0.103
(30.6%)0.093
(27.8%)0.060
(18.0%)0.079
(23.6%)0.336
Unqualified level IV 0.103
(36.5%)0.085
(30.3%)0.057
(20.2%)0.037
(13.0%)0.282
CAP/BEP 0.066
(22.6%)0.086
(29.3%)0.061
(21%)0.080
(27.2%)0.294
of which: apprentices 0.069
(24.8%)0.087
(31.1%)0.060
(21.5%)0.034
(22.6%)0.280
not apprentices 0.064
(21.4%)0.086
(28.3%)0.062
(20.6%)0.089
(29.8%)0.302
Professional baccalaureate 0.060
(24.7%)0.069
(28.3%)0.052
(21.4%)0.063
(25.6%)0.244
Technological or general baccalaureate 0.079
(31.6%)0.070
(28%)0.048
(19.1%)0.053
(21.3%)0.250
Higher than baccalaureate 0.061
(29.3%)0.061
(29.3%)0.033
(16%)0.053
(25.5%)0.208
Labour market experience
Has already held a permanent job 0.050
(20.3%)0.091
(36.9%)0.050
(20%)0.056
(22.8%)0.247
Has already held a non‑permanent job 0.064
(24.3%)0.077
(29.4%)0.054
(20.5%)0.068
(25.9%)0.268
None 0.114
(34.7%)0.080
(24.5%)0.061
(18.7%)0.072
(22%)0.327
Socioprofessional category of the father
Craftsman/Farmer 0.080
(32.5%)0.072
(29.2%)0.042
(16.8%)0.053
(21.5%)0.247
Executive 0.072
(28.9%)0.061
(24.3%)0.042
(17%)0.044
(29.8%)0.249
Mid‑level profession 0.075
(28.8%)0.076
(29.3%)0.047
(18.1%)0.062
(23.7%)0.260
➔
ECONOMIE ET STATISTIQUE / ECONOMICS AND STATISTICS N° 514-515-516, 2020 143
Risk of Social Exclusion and Resources of Young NEETs
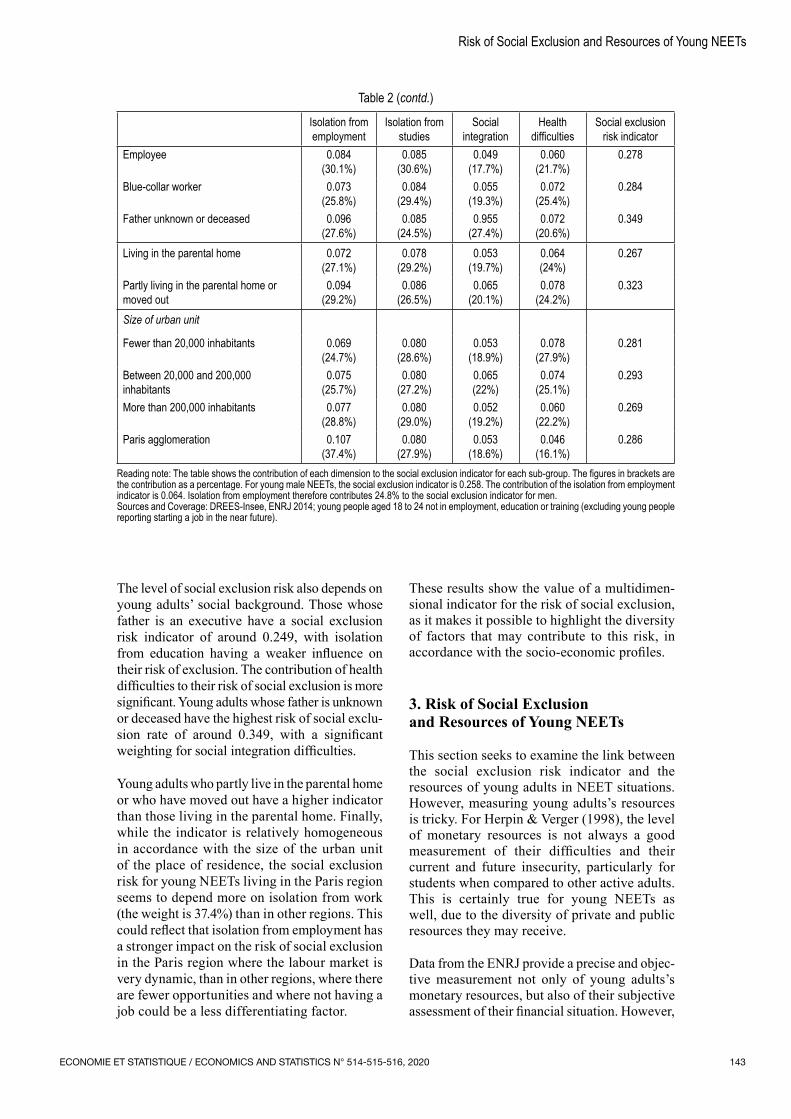
The level of social exclusion risk also depends on young adults’ social background. Those whose father is an executive have a social exclusion risk indicator of around 0.249, with isolation from education having a weaker influence on their risk of exclusion. The contribution of health difficulties to their risk of social exclusion is more significant. Young adults whose father is unknown or deceased have the highest risk of social exclu‑sion rate of around 0.349, with a significant weighting for social integration difficulties.
Young adults who partly live in the parental home or who have moved out have a higher indicator than those living in the parental home. Finally, while the indicator is relatively homogeneous in accordance with the size of the urban unit of the place of residence, the social exclusion risk for young NEETs living in the Paris region seems to depend more on isolation from work (the weight is 37.4%) than in other regions. This could reflect that isolation from employment has a stronger impact on the risk of social exclusion in the Paris region where the labour market is very dynamic, than in other regions, where there are fewer opportunities and where not having a job could be a less differentiating factor.
These results show the value of a multidimen‑sional indicator for the risk of social exclusion, as it makes it possible to highlight the diversity of factors that may contribute to this risk, in accordance with the socio‑economic profiles.
3. Risk of Social Exclusion and Resources of Young NEETs
This section seeks to examine the link between the social exclusion risk indicator and the resources of young adults in NEET situations. However, measuring young adults’s resources is tricky. For Herpin & Verger (1998), the level of monetary resources is not always a good measurement of their difficulties and their current and future insecurity, particularly for students when compared to other active adults. This is certainly true for young NEETs as well, due to the diversity of private and public resources they may receive.
Data from the ENRJ provide a precise and objec‑tive measurement not only of young adults’s monetary resources, but also of their subjective assessment of their financial situation. However,
Table 2 (contd.)
Isolation from employment
Isolation from studies
Social integration
Health difficulties
Social exclusion risk indicator
Employee 0.084
(30.1%)0.085
(30.6%)0.049
(17.7%)0.060
(21.7%)0.278
Blue‑collar worker 0.073
(25.8%)0.084
(29.4%)0.055
(19.3%)0.072
(25.4%)0.284
Father unknown or deceased 0.096
(27.6%)0.085
(24.5%)0.955
(27.4%)0.072
(20.6%)0.349
Living in the parental home 0.072
(27.1%)0.078
(29.2%)0.053
(19.7%)0.064
(24%)0.267
Partly living in the parental home or moved out
0.094
(29.2%)0.086
(26.5%)0.065
(20.1%)0.078
(24.2%)0.323
Size of urban unit
Fewer than 20,000 inhabitants 0.069
(24.7%)0.080
(28.6%)0.053
(18.9%)0.078
(27.9%)0.281
Between 20,000 and 200,000 inhabitants
0.075
(25.7%)0.080
(27.2%)0.065
(22%)0.074
(25.1%)0.293
More than 200,000 inhabitants 0.077
(28.8%)0.080
(29.0%)0.052
(19.2%)0.060
(22.2%)0.269
Paris agglomeration 0.107
(37.4%)0.080
(27.9%)0.053
(18.6%)0.046
(16.1%)0.286
Reading note: The table shows the contribution of each dimension to the social exclusion indicator for each sub‑group. The figures in brackets are the contribution as a percentage. For young male NEETs, the social exclusion indicator is 0.258. The contribution of the isolation from employment indicator is 0.064. Isolation from employment therefore contributes 24.8% to the social exclusion indicator for men.Sources and Coverage: DREES‑Insee, ENRJ 2014; young people aged 18 to 24 not in employment, education or training (excluding young people reporting starting a job in the near future).
ECONOMIE ET STATISTIQUE / ECONOMICS AND STATISTICS N° 514-515-516, 2020144
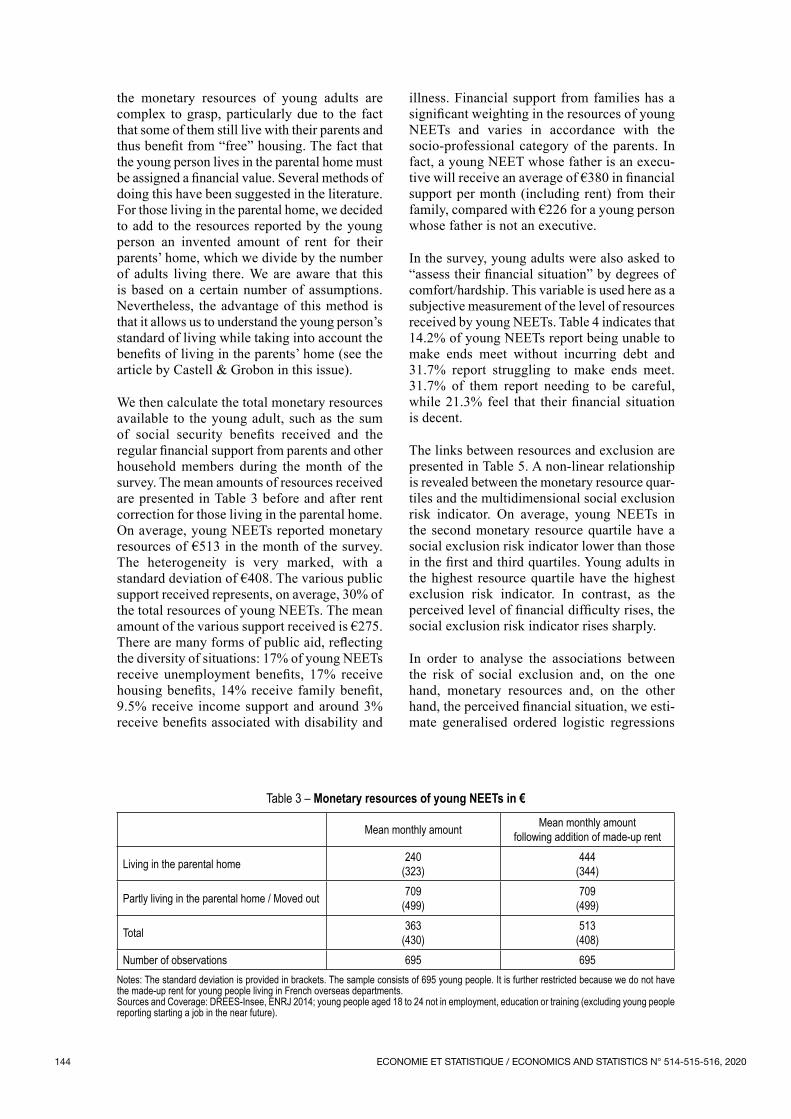
the monetary resources of young adults are complex to grasp, particularly due to the fact that some of them still live with their parents and thus benefit from “free” housing. The fact that the young person lives in the parental home must be assigned a financial value. Several methods of doing this have been suggested in the literature. For those living in the parental home, we decided to add to the resources reported by the young person an invented amount of rent for their parents’ home, which we divide by the number of adults living there. We are aware that this is based on a certain number of assumptions. Nevertheless, the advantage of this method is that it allows us to understand the young person’s standard of living while taking into account the benefits of living in the parents’ home (see the article by Castell & Grobon in this issue).
We then calculate the total monetary resources available to the young adult, such as the sum of social security benefits received and the regular financial support from parents and other household members during the month of the survey. The mean amounts of resources received are presented in Table 3 before and after rent correction for those living in the parental home. On average, young NEETs reported monetary resources of €513 in the month of the survey. The heterogeneity is very marked, with a standard deviation of €408. The various public support received represents, on average, 30% of the total resources of young NEETs. The mean amount of the various support received is €275. There are many forms of public aid, reflecting the diversity of situations: 17% of young NEETs receive unemployment benefits, 17% receive housing benefits, 14% receive family benefit, 9.5% receive income support and around 3% receive benefits associated with disability and
illness. Financial support from families has a significant weighting in the resources of young NEETs and varies in accordance with the socio‑professional category of the parents. In fact, a young NEET whose father is an execu‑tive will receive an average of €380 in financial support per month (including rent) from their family, compared with €226 for a young person whose father is not an executive.
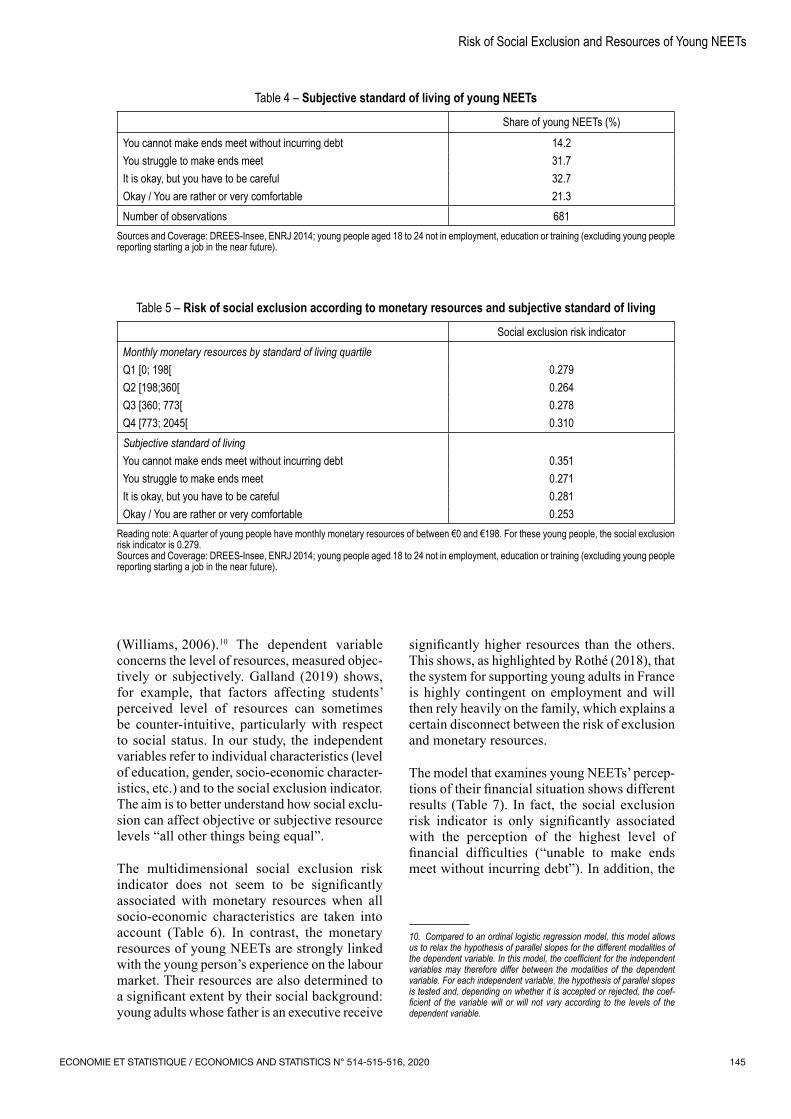
In the survey, young adults were also asked to “assess their financial situation” by degrees of comfort/hardship. This variable is used here as a subjective measurement of the level of resources received by young NEETs. Table 4 indicates that 14.2% of young NEETs report being unable to make ends meet without incurring debt and 31.7% report struggling to make ends meet. 31.7% of them report needing to be careful, while 21.3% feel that their financial situation is decent.
The links between resources and exclusion are presented in Table 5. A non‑linear relationship is revealed between the monetary resource quar‑tiles and the multidimensional social exclusion risk indicator. On average, young NEETs in the second monetary resource quartile have a social exclusion risk indicator lower than those in the first and third quartiles. Young adults in the highest resource quartile have the highest exclusion risk indicator. In contrast, as the perceived level of financial difficulty rises, the social exclusion risk indicator rises sharply.
In order to analyse the associations between the risk of social exclusion and, on the one hand, monetary resources and, on the other hand, the perceived financial situation, we esti‑mate generalised ordered logistic regressions
Table 3 – Monetary resources of young NEETs in €
Mean monthly amount Mean monthly amount following addition of made‑up rent
Living in the parental home 240
(323)444
(344)
Partly living in the parental home / Moved out 709
(499)709
(499)
Total 363
(430)513
(408)Number of observations 695 695
Notes: The standard deviation is provided in brackets. The sample consists of 695 young people. It is further restricted because we do not have the made‑up rent for young people living in French overseas departments.Sources and Coverage: DREES‑Insee, ENRJ 2014; young people aged 18 to 24 not in employment, education or training (excluding young people reporting starting a job in the near future).
ECONOMIE ET STATISTIQUE / ECONOMICS AND STATISTICS N° 514-515-516, 2020 145
Risk of Social Exclusion and Resources of Young NEETs
(Williams, 2006).10 The dependent variable concerns the level of resources, measured objec‑tively or subjectively. Galland (2019) shows, for example, that factors affecting students’ perceived level of resources can sometimes be counter‑intuitive, particularly with respect to social status. In our study, the independent variables refer to individual characteristics (level of education, gender, socio‑economic character‑istics, etc.) and to the social exclusion indicator. The aim is to better understand how social exclu‑sion can affect objective or subjective resource levels “all other things being equal”.
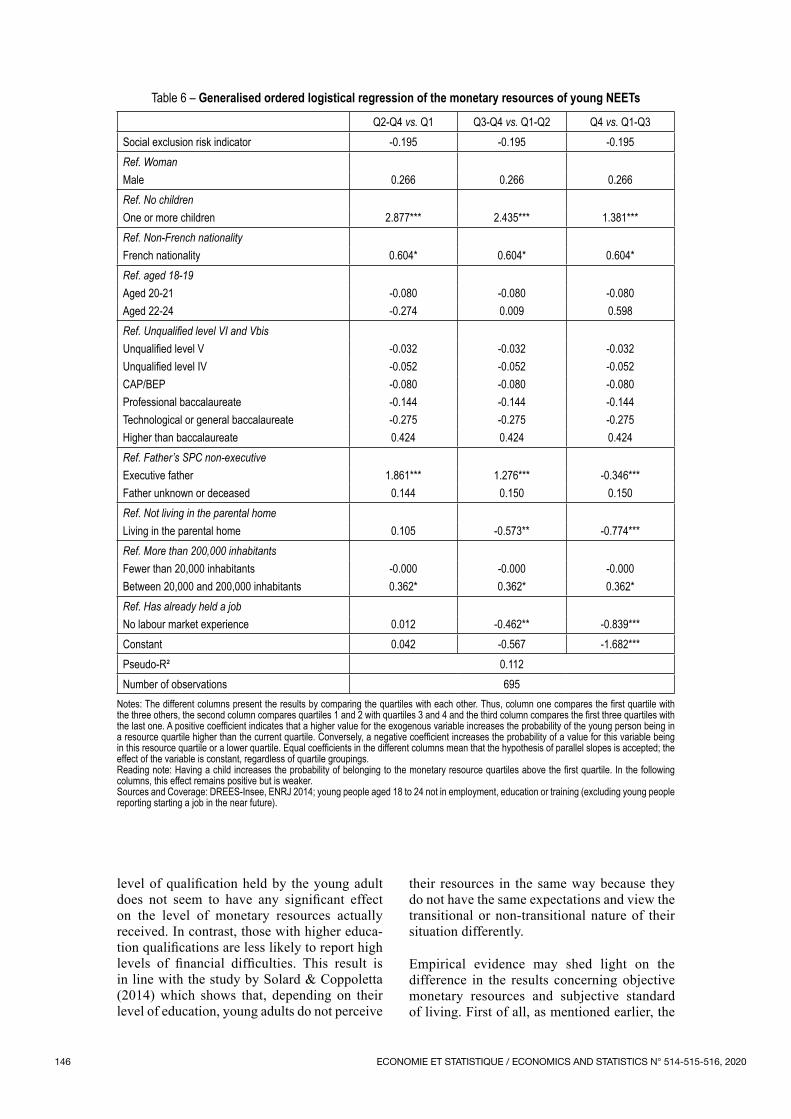
The multidimensional social exclusion risk indicator does not seem to be significantly associated with monetary resources when all socio‑economic characteristics are taken into account (Table 6). In contrast, the monetary resources of young NEETs are strongly linked with the young person’s experience on the labour market. Their resources are also determined to a significant extent by their social background: young adults whose father is an executive receive
significantly higher resources than the others. This shows, as highlighted by Rothé (2018), that the system for supporting young adults in France is highly contingent on employment and will then rely heavily on the family, which explains a certain disconnect between the risk of exclusion and monetary resources.10
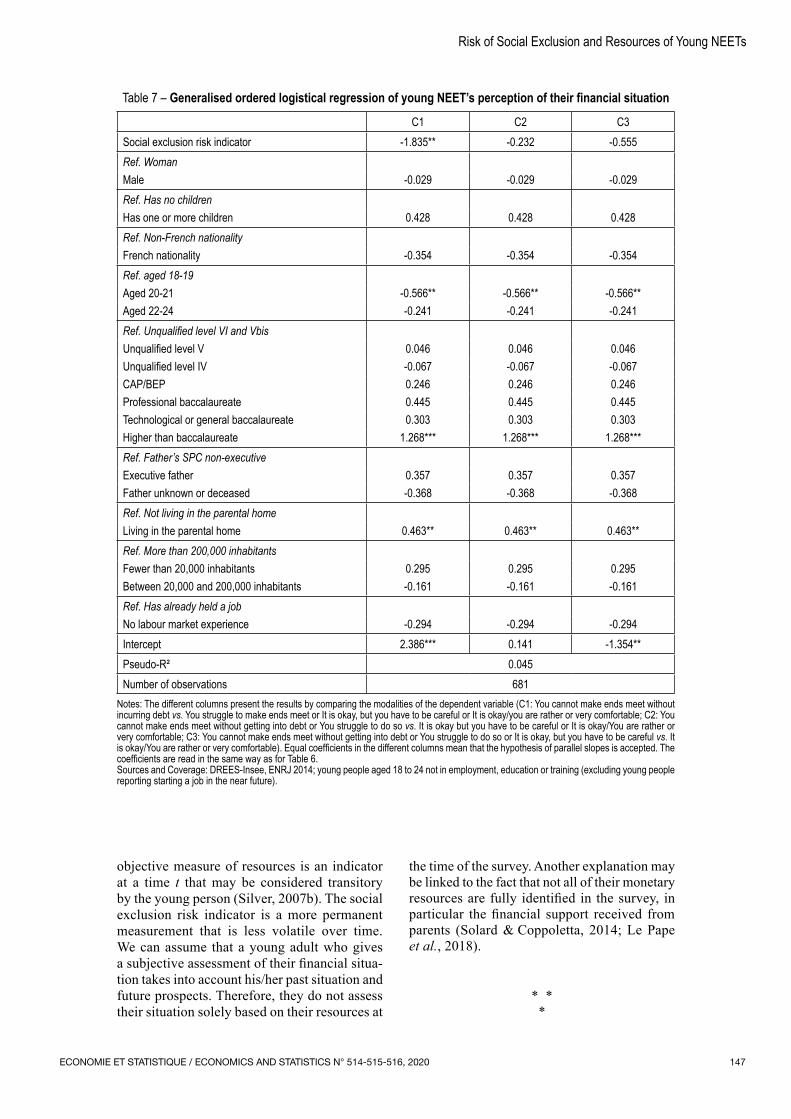
The model that examines young NEETs’ percep‑tions of their financial situation shows different results (Table 7). In fact, the social exclusion risk indicator is only significantly associated with the perception of the highest level of financial difficulties (“unable to make ends meet without incurring debt”). In addition, the
10. Compared to an ordinal logistic regression model, this model allows us to relax the hypothesis of parallel slopes for the different modalities of the dependent variable. In this model, the coefficient for the independent variables may therefore differ between the modalities of the dependent variable. For each independent variable, the hypothesis of parallel slopes is tested and, depending on whether it is accepted or rejected, the coef‑ficient of the variable will or will not vary according to the levels of the dependent variable.
Table 4 – Subjective standard of living of young NEETs
Share of young NEETs (%)
You cannot make ends meet without incurring debt 14.2You struggle to make ends meet 31.7It is okay, but you have to be careful 32.7Okay / You are rather or very comfortable 21.3Number of observations 681
Sources and Coverage: DREES‑Insee, ENRJ 2014; young people aged 18 to 24 not in employment, education or training (excluding young people reporting starting a job in the near future).
Table 5 – Risk of social exclusion according to monetary resources and subjective standard of living
Social exclusion risk indicatorMonthly monetary resources by standard of living quartileQ1 [0; 198[ 0.279Q2 [198;360[ 0.264Q3 [360; 773[ 0.278Q4 [773; 2045[ 0.310Subjective standard of livingYou cannot make ends meet without incurring debt 0.351You struggle to make ends meet 0.271It is okay, but you have to be careful 0.281Okay / You are rather or very comfortable 0.253
Reading note: A quarter of young people have monthly monetary resources of between €0 and €198. For these young people, the social exclusion risk indicator is 0.279.Sources and Coverage: DREES‑Insee, ENRJ 2014; young people aged 18 to 24 not in employment, education or training (excluding young people reporting starting a job in the near future).
ECONOMIE ET STATISTIQUE / ECONOMICS AND STATISTICS N° 514-515-516, 2020146
level of qualification held by the young adult does not seem to have any significant effect on the level of monetary resources actually received. In contrast, those with higher educa‑tion qualifications are less likely to report high levels of financial difficulties. This result is in line with the study by Solard & Coppoletta (2014) which shows that, depending on their level of education, young adults do not perceive
their resources in the same way because they do not have the same expectations and view the transitional or non‑transitional nature of their situation differently.
Empirical evidence may shed light on the difference in the results concerning objective monetary resources and subjective standard of living. First of all, as mentioned earlier, the
Table 6 – Generalised ordered logistical regression of the monetary resources of young NEETs
Q2‑Q4 vs. Q1 Q3‑Q4 vs. Q1‑Q2 Q4 vs. Q1‑Q3 Social exclusion risk indicator ‑0.195 ‑0.195 ‑0.195Ref. WomanMale 0.266 0.266 0.266Ref. No childrenOne or more children 2.877*** 2.435*** 1.381***Ref. Non‑French nationalityFrench nationality 0.604* 0.604* 0.604*Ref. aged 18‑19Aged 20‑21 ‑0.080 ‑0.080 ‑0.080Aged 22‑24 ‑0.274 0.009 0.598Ref. Unqualified level VI and VbisUnqualified level V ‑0.032 ‑0.032 ‑0.032Unqualified level IV ‑0.052 ‑0.052 ‑0.052CAP/BEP ‑0.080 ‑0.080 ‑0.080Professional baccalaureate ‑0.144 ‑0.144 ‑0.144Technological or general baccalaureate ‑0.275 ‑0.275 ‑0.275Higher than baccalaureate 0.424 0.424 0.424Ref. Father’s SPC non‑executiveExecutive father 1.861*** 1.276*** ‑0.346***Father unknown or deceased 0.144 0.150 0.150Ref. Not living in the parental homeLiving in the parental home 0.105 ‑0.573** ‑0.774***Ref. More than 200,000 inhabitantsFewer than 20,000 inhabitants ‑0.000 ‑0.000 ‑0.000Between 20,000 and 200,000 inhabitants 0.362* 0.362* 0.362*Ref. Has already held a jobNo labour market experience 0.012 ‑0.462** ‑0.839***Constant 0.042 ‑0.567 ‑1.682***Pseudo‑R² 0.112Number of observations 695
Notes: The different columns present the results by comparing the quartiles with each other. Thus, column one compares the first quartile with the three others, the second column compares quartiles 1 and 2 with quartiles 3 and 4 and the third column compares the first three quartiles with the last one. A positive coefficient indicates that a higher value for the exogenous variable increases the probability of the young person being in a resource quartile higher than the current quartile. Conversely, a negative coefficient increases the probability of a value for this variable being in this resource quartile or a lower quartile. Equal coefficients in the different columns mean that the hypothesis of parallel slopes is accepted; the effect of the variable is constant, regardless of quartile groupings.Reading note: Having a child increases the probability of belonging to the monetary resource quartiles above the first quartile. In the following columns, this effect remains positive but is weaker. Sources and Coverage: DREES‑Insee, ENRJ 2014; young people aged 18 to 24 not in employment, education or training (excluding young people reporting starting a job in the near future).
ECONOMIE ET STATISTIQUE / ECONOMICS AND STATISTICS N° 514-515-516, 2020 147
Risk of Social Exclusion and Resources of Young NEETs
Table 7 – Generalised ordered logistical regression of young NEET’s perception of their financial situation
C1 C2 C3Social exclusion risk indicator ‑1.835** ‑0.232 ‑0.555Ref. WomanMale ‑0.029 ‑0.029 ‑0.029Ref. Has no childrenHas one or more children 0.428 0.428 0.428Ref. Non‑French nationalityFrench nationality ‑0.354 ‑0.354 ‑0.354Ref. aged 18‑19Aged 20‑21 ‑0.566** ‑0.566** ‑0.566**Aged 22‑24 ‑0.241 ‑0.241 ‑0.241Ref. Unqualified level VI and VbisUnqualified level V 0.046 0.046 0.046Unqualified level IV ‑0.067 ‑0.067 ‑0.067CAP/BEP 0.246 0.246 0.246Professional baccalaureate 0.445 0.445 0.445Technological or general baccalaureate 0.303 0.303 0.303Higher than baccalaureate 1.268*** 1.268*** 1.268***Ref. Father’s SPC non‑executiveExecutive father 0.357 0.357 0.357Father unknown or deceased ‑0.368 ‑0.368 ‑0.368Ref. Not living in the parental homeLiving in the parental home 0.463** 0.463** 0.463**Ref. More than 200,000 inhabitantsFewer than 20,000 inhabitants 0.295 0.295 0.295Between 20,000 and 200,000 inhabitants ‑0.161 ‑0.161 ‑0.161Ref. Has already held a jobNo labour market experience ‑0.294 ‑0.294 ‑0.294Intercept 2.386*** 0.141 ‑1.354**Pseudo‑R² 0.045Number of observations 681
Notes: The different columns present the results by comparing the modalities of the dependent variable (C1: You cannot make ends meet without incurring debt vs. You struggle to make ends meet or It is okay, but you have to be careful or It is okay/you are rather or very comfortable; C2: You cannot make ends meet without getting into debt or You struggle to do so vs. It is okay but you have to be careful or It is okay/You are rather or very comfortable; C3: You cannot make ends meet without getting into debt or You struggle to do so or It is okay, but you have to be careful vs. It is okay/You are rather or very comfortable). Equal coefficients in the different columns mean that the hypothesis of parallel slopes is accepted. The coefficients are read in the same way as for Table 6.Sources and Coverage: DREES‑Insee, ENRJ 2014; young people aged 18 to 24 not in employment, education or training (excluding young people reporting starting a job in the near future).
objective measure of resources is an indicator at a time t that may be considered transitory by the young person (Silver, 2007b). The social exclusion risk indicator is a more permanent measurement that is less volatile over time. We can assume that a young adult who gives a subjective assessment of their financial situa‑tion takes into account his/her past situation and future prospects. Therefore, they do not assess their situation solely based on their resources at
the time of the survey. Another explanation may be linked to the fact that not all of their monetary resources are fully identified in the survey, in particular the financial support received from parents (Solard & Coppoletta, 2014; Le Pape et al., 2018).
* * *
ECONOMIE ET STATISTIQUE / ECONOMICS AND STATISTICS N° 514-515-516, 2020148
All of our results question the targeting and modalities of certain policies in favour of young NEETs. If we consider the level of their risk of social exclusion, their situation appears very heterogeneous. Some of them face a high risk of social exclusion, which may lead to what Van de Velde (2016) terms “an experience of social impasse”. Others, in contrast, in a process of “suspension”, seem less vulnerable, with a much less long‑term of sustained exclusion from the system.
The results also underline the plurality of vulnerability factors, even though those without qualifications are generally the most disadvan‑taged across all dimensions of social exclusion. The various disruptions related to the drop‑out stage and the resulting latency period (Bernard, 2017) make the situation of young adults more fragile and keep them isolated from employment on a long‑term basis (Guégnard et al., 2017). One answer could be to raise the age to which educa‑tion is compulsory. However, as Maguire (2013) points out in the context of a policy implemented in England, this type of measure, if it is to target young adults at high risk of becoming NEETs, requires innovative educational resources as well as significant financial resources.
Furthermore, the approach we have selected makes it possible to stress the multidimensional nature of social exclusion. Focusing on a single factor, such as employment or training, as is sometimes the case in certain public policies aimed at NEETs, leads to neglecting other risks of exclusion that are almost as important when looking at the contributions of the four
dimensions to the exclusion indicator. For Yates et al. (2006), the risk of a policy aimed solely at reducing the number of young adults in NEET situations is that it may only act on certain dimensions considered least burdensome, without intervening in respect of those most excluded. However, the specific needs of young NEETs are often multiple and evolving, creating specific trajectories that systems must take into account (Longo & Gallant, 2016). In France, Couronné & Sarfati (2018) point out that, for certain NEETs, being anchored in social and economic vulnerability constitutes an obstacle to the “work first” strategy under the Youth Guarantee11, as the local mission advisors have to deal with problems of different natures as a matter of urgency. Based on the disappointing evaluation of programmes targeting a return to work or training for NEETs in England, Maguire (2015b) also stresses the need for a plurality of programmes and stakeholders to meet the diverse needs of young adults in NEET situations.
Lastly, in this study, we focused only on the group of young NEETs, but these are not the only people affected by the risk of social exclu‑sion. For Atkinson (1998), employment is not a sufficient shield against social exclusion. In addition, young adults still in education with no real prospects of integration (Thompson, 2011) or in a precarious situation, even those at university (Cordazzo, 2016), can also find themselves on a trajectory towards exclusion.
11. In contrast to traditional support aimed at first removing the obstacles to employment, the “work first” strategy is based on a logic which consists of putting people into professional situations during the support.
BIBLIOGRAPHY
Alperin, M. N. P. (2016). A multidimensional approach to measure health. Economics Bulletin, 36(3), 1553–1568. http://www.accessecon.com/Pubs/EB/2016/Volume36/EB‑16‑V36‑I3‑P153.pdf
Alperin, M. N. P. & Van Kerm, P. (2009). Mdepriv Synthetic indicators of multiple deprivation. CEPS/INSTEAD, Esch/Alzette. https://a‑benini.github.io/mdepriv/reference/mdepriv.html
Atkinson, A. B. (1998). Social exclusion, poverty and unemployment. In: Atkinson, A. B. & Hills, J. (Eds.), Exclusion, employment and opportunity, pp. 1–24. London: London School of Economics. http://sticerd.lse.ac.uk/dps/case/cp/Paper4.pdf
Baverez, N., Salais, R. & Reynaud, B. (1986). L’Invention du chômage : Histoire et transformations d’une catégorie en France des années 1890 aux années 1980. Paris: Presses universitaires de France.
Bernard, P.‑Y. (2011). Le décrochage des élèves du second degré : Diversité des parcours, pluralité des expériences scolaires. Les Sciences de l’éducation ‑ Pour l’Ere nouvelle, 44(4), 75–97.
ECONOMIE ET STATISTIQUE / ECONOMICS AND STATISTICS N° 514-515-516, 2020 149
Risk of Social Exclusion and Resources of Young NEETs
Bernard, P.‑Y. (2017). Le décrochage scolaire. Paris: Presses universitaires de France. https://www.cairn.info/le‑decrochage‑scolaire‑‑9782130798484.htm
Betti, G. & Verma, V. (1999). Measuring the Degree Of Poverty in a Dynamic and Comparative Context: A Multi‑dimensional Approach Using Fuzzy Set Theory, In: Proceedings of the ICCS‑VI, 11, 289–301. Lahore, Pakistan, August, 27–31. http://repec.deps.unisi.it/quaderni/22DMQ.pdf
Betti, G., D’Agostino, A. & Neri, L. (2011). Educational Mismatch of Graduates: A Multidimensional and Fuzzy Indicator. Social Indicators Research, 103(3), 465–480. https://doi.org/10.1007/s11205‑010‑9712‑6
Bynner, J. & Parsons, S. (2002). Social Exclusion and the Transition from School to Work: The Case of Young People Not in Education, Employment, or Training (NEET). Journal of Vocational Behavior, 60(2), 289–309. https://doi.org/10.1006/jvbe.2001.1868
Castell, L. & Grobon, S. (2020). Inequality of Resources Among Young Adults: An Individualised Approach. Economie et Statistique / Economics and Statistics, this issue.
Carcillo, S., Fernández, R., Königs, S. & Minea, A. (2015). NEET Youth in the Aftermath of the Crisis: Challenges and Policies. https://doi.org/10.1787/5js6363503f6‑en
Cerioli, A. & Zani, S. (1990). A Fuzzy Approach To The Measurement Of Poverty in C. Dagum & M. Zenga (Éds.), Income and Wealth Distribution, Inequality and Poverty, 272–284. Springer.https://doi.org/10.1007/978‑3‑642‑84250‑4_18
Charles, N. (2016). Du public adulte à l’enjeu des parcours non traditionnels. In: Giret, J.‑F., Van de Velde, C. & Verley, E. (Eds.), Les vies étudiantes. Tendances et inégalités, 263–275. Paris: La Documentation française.
Cheli, B. & Lemmi, A. (1995). A « totally » fuzzy and relative approach to the multidimensional analysis of poverty. Economic Notes : Economic Review of Banca Monte Dei Paschi Di Siena, 24(1), 115–133.
Commission européenne (2016). La garantie pour la jeunesse et l’initiative pour l’emploi des jeunes, trois ans après. Communication de la Commission Européenne. https://eur‑lex.europa.eu/legal‑content/FR/TXT/HTML/?uri=CELEX:52016DC0646&from=EN
Cordazzo, P. (2016). Les étudiant‑e‑s vulnérables : Entre renoncements et travail contraint. In: Giret, J.‑F., Van de Velde, C. & Verley, E. (Eds.), Les vies étudiantes. Tendances et inégalités, 183–193. Paris: La Documentation française.
Couronné, J. & Sarfati, F. (2018). Une jeunesse (in)visible : Les « Neets vulnérables » de la Garantie jeunes. Travail et Emploi, 153, 41–66. https://doi.org/10.4000/travailemploi.7905
Coutrot, T. & Exertier, G. (2001). La loi des grands noms. Paris: Presses de Sciences Po.https://www.cairn.info/l‑annee‑de‑la‑regulation‑n‑5‑2001‑2002‑‑9782724608577‑page‑256.htm
Danner, M., Guégnard, C. & Joseph, O. (2018). Alice au Pays des NEET : La traversée du miroir sur 20 ans. In: Céreq, Jeunesse(s) et transitions vers l’âge adulte : Quelles permanences, quelles évolutions depuis 30 ans ? XXIVèmes journées du Longitudinal, Marseille, 7 et 8 juin 2018, 113–126.https://www.cereq.fr/sites/default/files/2019‑03/37b1790efcd6ca2c6f1b31d00ec127e5.pdf
Duvoux, N. & Papuchon, A. (2018). Qui se sent pauvre en France ? Revue francaise de sociologie, 59(4), 607–647. https://doi.org/10.3917/rfs.594.0607
Eurofound. (2016). Exploring the diversity of NEETs. Publications Office of the European Union.
France, A. (2008). From Being to Becoming: The Importance of Tackling Youth Poverty in Transitions To Adulthood. Social Policy and Society, 7(4), 495–505. https://doi.org/10.1017/S1474746408004454
Furlong, A. (2006). Not a very NEET solution: Representing problematic labour market transitions among early school‑leavers. Work, Employment and Society, 20(3), 553–569. https://doi.org/10.1177/0950017006067001
Furlong, A. (2007). The zone of precarity and discourses of vulnerability. Journal of Social Sciences and Humanities, 381, 101–121. https://eprints.gla.ac.uk/36831/
Galland, O. (2019). Les revenus étudiants : un poids toujours important de l’aide familiale mais une progres‑sion du travail salarié, In: Giret, J.‑F., Belghith, F. & Tenret, E., Regards croisés sur les expériences étudiantes. L’enquête conditions de vie 2016, pp. 275–291. Paris: La Documentation française.
ECONOMIE ET STATISTIQUE / ECONOMICS AND STATISTICS N° 514-515-516, 2020150
Gautié, J. (2002). De l’invention du chômage à sa déconstruction. Geneses, 46(1), 60–76.https://doi.org/10.3917/gen.046.0060
Gautié, J. (2016). Au‑delà des chiffres de l’emploi et du chômage. Problématiques, catégories et indicateurs. Idées économiques et sociales, 185(3), 8–18. https://doi.org/10.3917/idee.185.0008
Giret, J. F. (2019). Classer, quantifier et qualifier les parcours : quelques enseignements issus de 25 années de journées du longitudinal. In: Céreq, Qualifications et parcours‑Qualifications des parcours, XXVème Journées du longitudinal, 20 et 21 juin 2019, pp. 21–30.
Gonzalez‑Demichel, C. & Nauze‑Fichet, E. (2003). Les contours de la population active : Aux frontières de l’emploi, du chômage et de l’inactivité. Economie et Statistique, 362(1), 85–103.https://doi.org/10.3406/estat.2003.7346
Guégnard, C., Giret, J.‑F., Joseph, O. & Murdoch, J. (2017). Les situations de NEET dans les parcours d’insertion des jeunes en France. In: Céreq, Rendement éducatif, parcours et inégalités dans l’insertion des jeunes. Recueil d’études sur la Génération 2010, pp. 225–246.https://halshs.archives‑ouvertes.fr/halshs‑01533225
Guergoat‑Larivière, M. & Lemière, S. (2018). Convergence des taux de chômage et persistance des inégalités femmes‑hommes. Revue de l’OFCE, 160(6), 131–159. https://doi.org/10.3917/reof.160.0131
Guillemot, D. (1996). La population active : Une catégorie statistique difficile à cerner. Économie et Statistique, 300(1), 39–53. https://doi.org/10.3406/estat.1996.6173
Hargie, O., O’Donnell, A. & McMullan, C. (2011). Constructions of Social Exclusion Among Young People From Interface Areas of Northern Ireland. Youth & Society, 43(3), 873–899.https://doi.org/10.1177/0044118X10366950
Herpin, N. & Verger, D. (1998). Les étudiants, les autres jeunes, leur famille et la pauvreté. Économie et Statistique, 308(1), 211–227. https://doi.org/10.3406/estat.1998.2599
Kieselbach, T. (2003). Long‑Term Unemployment Among Young People: The Risk of Social Exclusion. American Journal of Community Psychology, 32(1), 69–76. https://doi.org/10.1023/A:1025694823396
Lefresne, F. (2005). Les politiques d’emploi et la transformation des normes : Une comparaison européenne. Sociologie du travail, 47(3), 405–420. https://doi.org/10.4000/sdt.26811
Lenoir, R. (1974). Les Exclus : Un français sur dix. Paris: Editions du Seuil.
Longo, M. E. & Gallant, N. (2016). Les jeunes ni en emploi, ni aux études, ni en formation (NEEF). Questions sur une catégorie de politiques publiques. Bulletin observatoire jeunes et société, 13(2).http://www.obsjeunes.qc.ca/sites/obsjeunes.qc.ca/files/BulletinNEEF.pdf
Maguire, S. (2013). Will raising the participation age in England solve the NEET problem? Research in Post‑Compulsory Education, 18(1‑2), 61–76. https://doi.org/10.1080/13596748.2013.755816
Maguire, S. (2015a). NEET, unemployed, inactive or unknown – why does it matter? Educational Research, 57(2), 121–132. https://doi.org/10.1080/00131881.2015.1030850
Maguire, S. (2015b). Young people not in education, employment or training (NEET): Recent policy initiatives in England and their effects. Research in Comparative and International Education, 10(4), 525–536.https://doi.org/10.1177/1745499915612186
Martinetti, E. C. (2000). A multidimensional assessment of well‑being based on Sen’s functioning approach. Rivista Internazionale di Scienze Sociali, 108(2), 207–239. https://doi.org/10.2307/41634742
Mascherini, M. (2017). Good practices in dealing with young people who are NEETs: policy responses at European level. Towards a Participatory Society: New Roads to Social and Cultural Integration, 424.http://www.pass.va/content/scienzesociali/en/publications/acta/participatorysociety/mascherini.html
Mascherini, M. & Ledermaier, S. (2016). Exploring the diversity of NEETs. Publications Office of the European Union. https://www.eurofound.europa.eu/fr/publications/report/2016/labour‑market‑social‑policies/exploring‑ the‑diversity‑of‑neets
ECONOMIE ET STATISTIQUE / ECONOMICS AND STATISTICS N° 514-515-516, 2020 151
Risk of Social Exclusion and Resources of Young NEETs
Maunaye, E. (2016). L’accès au logement autonome pour les jeunes, un chemin semé d’embûches. Informations sociales, 195(4), 39–47. https://doi.org/10.3917/inso.195.0039
Minni, C. & Galtier, B. (2017). Emploi et chômage des 15‑29 ans en 2015. Un jeune sur dix au chômage. Dares Résultats, N° 16. https://dares.travail‑emploi.gouv.fr/IMG/pdf/2017‑016.pdf
Newton, B., Speckesser, S., Nafilyan, V., Maguire, S., Devins, D., Bickerstaffe, T. & Marvell, R. (2014). The Youth Contract for 16‑17 year olds not in education, employment or training evaluation. Department for Education, Research report. https://assets.publishing.service.gov.uk/government/uploads/system/uploads/attachment_data/file/354706/RR318A_‑_The_youth_contract_for_16‑_to_17‑year‑olds_not_in_education__employment_or_training_evaluation.pdf
Le Pape, M.‑C., Portela, M. & Tenret, É. (2018). « Ça n’a pas de sens de compter comme ça ». Difficultés et limites d’une approche comptable des aides financières et matérielles apportées aux jeunes adultes dans la famille. Sociologie, 9(4), 417–436. http://journals.openedition.org/sociologie/3721
Paugam, S. (1998). Les formes contemporaines de la pauvreté et de l’exclusion. Le point de vue sociologique. Genèses. Sciences sociales et histoire, 31(1), 138–159. https://doi.org/10.3406/genes.1998.1516
Rothé, C. (2018). Accompagner les « jeunes en errance » ou adapter les normes de l’insertion. Formation emploi, 143(3), 161–182. https://www.cairn.info/revue‑formation‑emploi‑2018‑3‑page‑161.htm
Sen, A. (2000). Social Exclusion : Concept, Application, and Scrutiny. Asian Development Bank.https://www.adb.org/sites/default/files/publication/29778/social‑exclusion.pdf
Serracant, P. (2014). A Brute Indicator for a NEET Case: Genesis and Evolution of a Problematic Concept and Results from an Alternative Indicator. Social Indicators Research, 117(2), 401–419.https://doi.org/10.1007/s11205‑013‑0352‑5
Silver, H. (2007a). Social exclusion: Comparative analysis of Europe and Middle East youth. Dubai School of Government. https://www.meyi.org/uploads/3/2/0/1/32012989/silver_‑_social_exclusion‑comparative_analysis_of_europe_and_middle_east_youth.pdf
Silver, H. (2007b). The Process of Social Exclusion : The Dynamics of an Evolving Concept. University of Manchester. http://www.chronicpoverty.org/pubfiles/95Silver.pdf
Silver, H. & Miller, S. M. (2003). Social Exclusion. Indicators, 2(2), 5–21.https://doi.org/10.1080/15357449.2003.11069166
Solard, J. & Coppoletta, R. (2014). La décohabitation, privilège des jeunes qui réussissent ? Économie et Statistique, 469‑470, 61–84. https://www.insee.fr/fr/statistiques/fichier/2122592/ES469D.pdf
Thompson, R. (2011). Individualisation and social exclusion: The case of young people not in education, employment or training. Oxford Review of Education, 37(6), 785–802.https://doi.org/10.1080/03054985.2011.636507
Van de Velde, C. (2016). Les NEET : une déconstruction sociologique. Bulletin de l’Observatoire Jeunes et Sociétés, 13(2), 18–20. http://inegalitessociales.com/wp‑content/uploads/2018/03/2016‑Les‑NEET‑une‑de%CC%81construction‑sociologique‑.pdf
Vero, J. & Werquin, P. (1998). Un réexamen de la mesure de la pauvreté. Économie et Statistique, 308(1), 143–158. https://doi.org/10.3406/estat.1998.2595
Vincens, J. (1997). L’insertion professionnelle des jeunes. À la recherche d’une définition conventionnelle. Formation Emploi, 21–36. https://doi.org/10.3406/forem.1997.2252
Williams, R. (2006). Generalized Ordered Logit/Partial Proportional Odds Models for Ordinal Dependent Variables. The Stata Journal: Promoting Communications on Statistics and Stata, 6(1), 58–82.https://doi.org/10.1177/1536867X0600600104
Yates, S. & Payne, M. (2006). Not so NEET? A Critique of the Use of ‘NEET’ in Setting Targets for Interventions with Young People. Journal of Youth Studies, 9(3), 329–344. https://doi.org/10.1080/13676260600805671
ECONOMIE ET STATISTIQUE / ECONOMICS AND STATISTICS N° 514-515-516, 2020152
APPENDIX ____________________________________________________________________________________________
Table A‑1 – Descriptive statistics
%Male 50.1Female 49.9 Woman with child(ren) 14.7 Age bracketAged 18‑19 21.1 Aged 20‑21 29.6 Aged 22‑24 49.3 French nationality 95.5 Non‑French nationality 4.5 Level of educational qualificationUnqualified level VI and Vbis 15.8 Unqualified level V 12.4 Unqualified level IV 6.0
CAP/BEP 26.0 of which: apprentices 10.3
not apprentices 17.1 Professional baccalaureate 18.4 Technological or general baccalaureate 9.4 Higher than baccalaureate 14.1 Labour market experienceHas already held a permanent job 13.9 Has already held a non‑permanent job 53.8 None 32.4 SPC of the fatherCraftsman/Farmer 8.2 Executive 8.1 Mid‑level profession 14.8 Employee 12.5 Worker 44.8 Father unknown or deceased 11.6 Living in the parental home 74.6 Partly living in the parental home or moved out 25.4 Size of urban unitFewer than 20,000 inhabitants 33.6 Between 20,000 and 200,000 inhabitants 25.2 More than 200,000 inhabitants 28.1 Paris agglomeration 13.1 Number of observations 735
Notes: weighted sample.Sources and Coverage: DREES‑Insee, ENRJ 2014; young people aged 18 to 24 not in employment, education or training (excluding young people reporting starting a job in the near future).
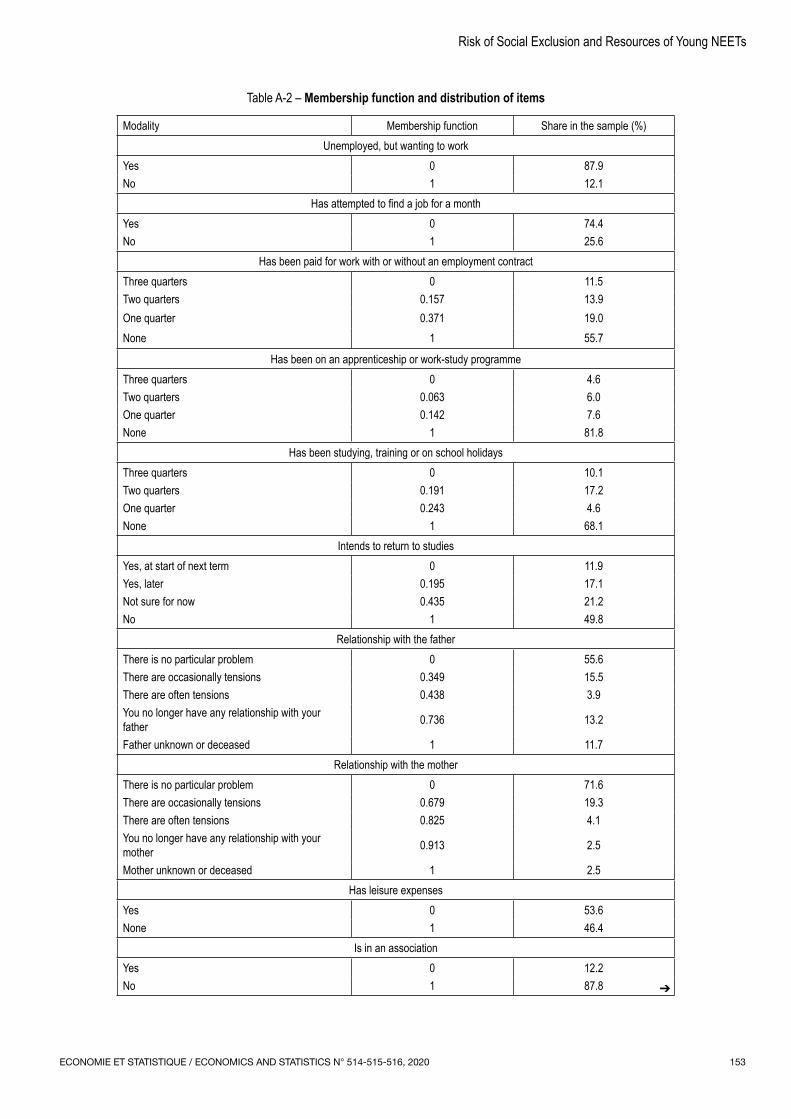
ECONOMIE ET STATISTIQUE / ECONOMICS AND STATISTICS N° 514-515-516, 2020 153
Risk of Social Exclusion and Resources of Young NEETs
Table A‑2 – Membership function and distribution of items
Modality Membership function Share in the sample (%)Unemployed, but wanting to work
Yes 0 87.9No 1 12.1
Has attempted to find a job for a monthYes 0 74.4No 1 25.6
Has been paid for work with or without an employment contractThree quarters 0 11.5Two quarters 0.157 13.9One quarter 0.371 19.0None 1 55.7
Has been on an apprenticeship or work‑study programmeThree quarters 0 4.6Two quarters 0.063 6.0One quarter 0.142 7.6None 1 81.8
Has been studying, training or on school holidaysThree quarters 0 10.1Two quarters 0.191 17.2One quarter 0.243 4.6None 1 68.1
Intends to return to studiesYes, at start of next term 0 11.9Yes, later 0.195 17.1Not sure for now 0.435 21.2No 1 49.8
Relationship with the fatherThere is no particular problem 0 55.6There are occasionally tensions 0.349 15.5There are often tensions 0.438 3.9You no longer have any relationship with your father 0.736 13.2
Father unknown or deceased 1 11.7Relationship with the mother
There is no particular problem 0 71.6There are occasionally tensions 0.679 19.3There are often tensions 0.825 4.1You no longer have any relationship with your mother 0.913 2.5
Mother unknown or deceased 1 2.5Has leisure expenses
Yes 0 53.6None 1 46.4
Is in an associationYes 0 12.2No 1 87.8 ➔
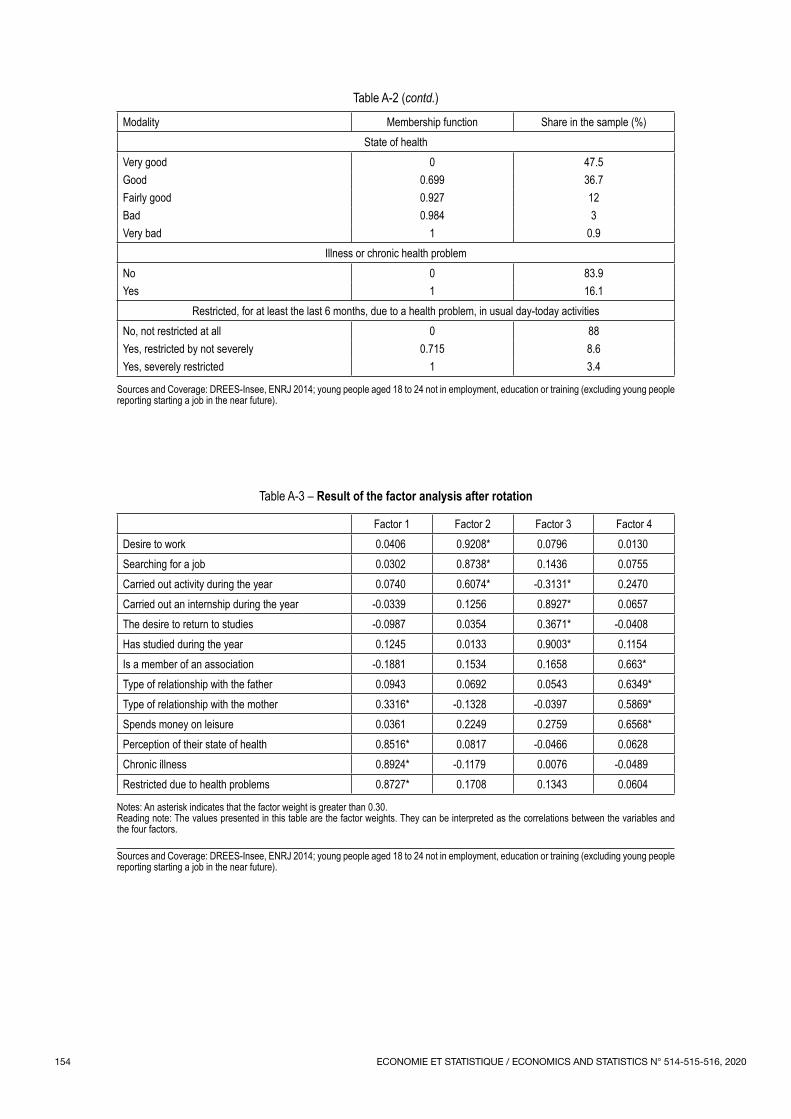
ECONOMIE ET STATISTIQUE / ECONOMICS AND STATISTICS N° 514-515-516, 2020154
Modality Membership function Share in the sample (%)State of health
Very good 0 47.5Good 0.699 36.7Fairly good 0.927 12Bad 0.984 3Very bad 1 0.9
Illness or chronic health problemNo 0 83.9Yes 1 16.1
Restricted, for at least the last 6 months, due to a health problem, in usual day‑today activitiesNo, not restricted at all 0 88Yes, restricted by not severely 0.715 8.6Yes, severely restricted 1 3.4
Sources and Coverage: DREES‑Insee, ENRJ 2014; young people aged 18 to 24 not in employment, education or training (excluding young people reporting starting a job in the near future).
Table A‑3 – Result of the factor analysis after rotation
Factor 1 Factor 2 Factor 3 Factor 4Desire to work 0.0406 0.9208* 0.0796 0.0130Searching for a job 0.0302 0.8738* 0.1436 0.0755Carried out activity during the year 0.0740 0.6074* ‑0.3131* 0.2470Carried out an internship during the year ‑0.0339 0.1256 0.8927* 0.0657The desire to return to studies ‑0.0987 0.0354 0.3671* ‑0.0408Has studied during the year 0.1245 0.0133 0.9003* 0.1154Is a member of an association ‑0.1881 0.1534 0.1658 0.663*Type of relationship with the father 0.0943 0.0692 0.0543 0.6349*Type of relationship with the mother 0.3316* ‑0.1328 ‑0.0397 0.5869*Spends money on leisure 0.0361 0.2249 0.2759 0.6568*Perception of their state of health 0.8516* 0.0817 ‑0.0466 0.0628Chronic illness 0.8924* ‑0.1179 0.0076 ‑0.0489Restricted due to health problems 0.8727* 0.1708 0.1343 0.0604
Notes: An asterisk indicates that the factor weight is greater than 0.30.Reading note: The values presented in this table are the factor weights. They can be interpreted as the correlations between the variables and the four factors.
Sources and Coverage: DREES‑Insee, ENRJ 2014; young people aged 18 to 24 not in employment, education or training (excluding young people reporting starting a job in the near future).
Table A‑2 (contd.)