Embed Size (px)
Citation preview
Dan Bakal, Ceres Sept 24, 2013 • Nashville, TN
Risk Mitigation Benefits of Energy Efficiency
2013 ACEEE Conference on Energy Efficiency as a Resource
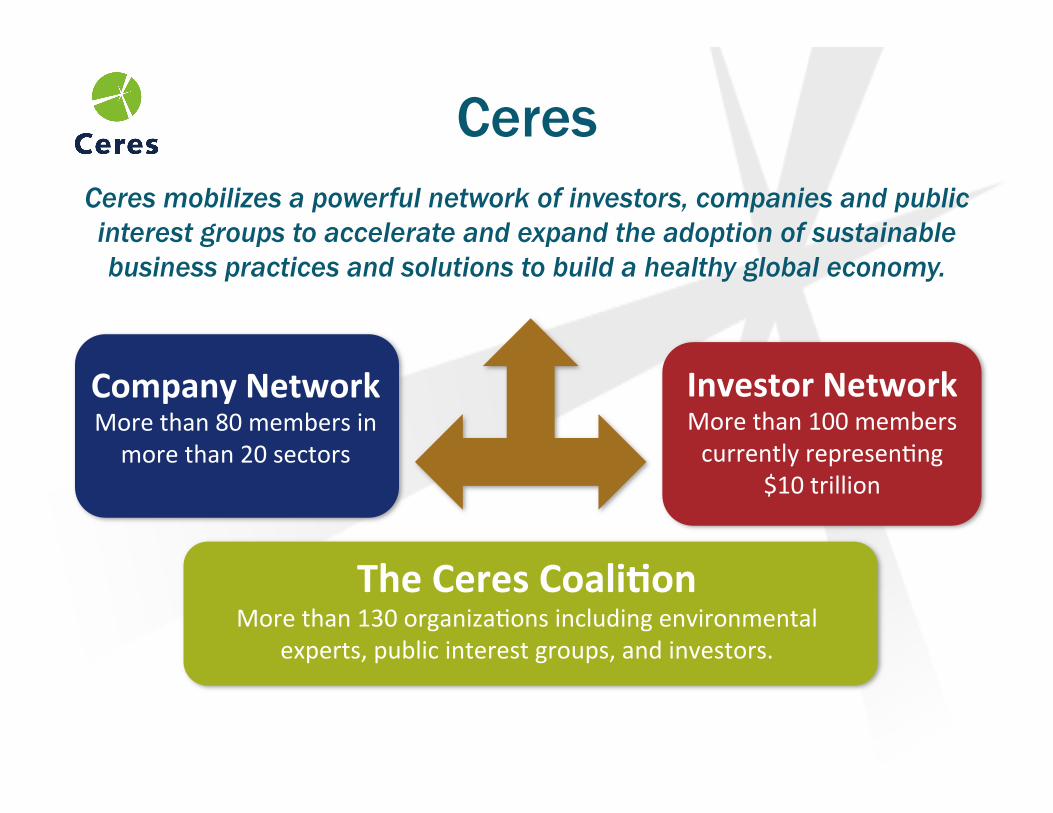
The Ceres Coali,on More than 130 organiza0ons including environmental
experts, public interest groups, and investors.
Company Network More than 80 members in more than 20 sectors
Investor Network More than 100 members currently represen0ng
$10 trillion
Ceres mobilizes a powerful network of investors, companies and public interest groups to accelerate and expand the adoption of sustainable business practices and solutions to build a healthy global economy.
"
Ceres
3
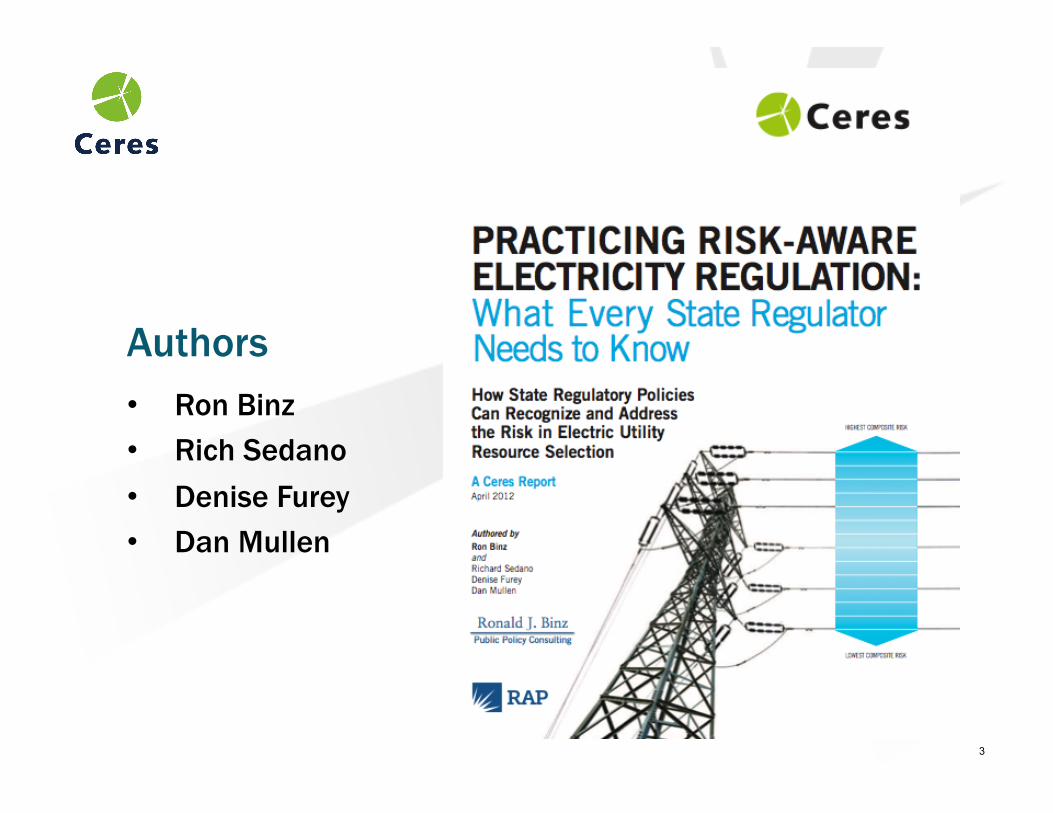
• Ron Binz • Rich Sedano • Denise Furey • Dan Mullen
Authors

4
Context: High Stakes • U.S. power industry is entering a “build cycle”
with much higher investment levels • Brattle: $2T by 2030 (~2x recent levels)
• Causes • Aging infrastructure • New transmission requirements • Demand side and smart grid • Air and water regulation much stronger • Fuel economics
• Challenges to utilities • Flat load growth • Distributed generation • Uncertain economy • Financial metrics less forgiving than 1980s

5
Brattle’s Investment Projection


Notes • Unadjusted 2010 cost estimates were used for
consistency
• Costs for wind and photovoltaics have fallen sharply in last two years (faster than these 2010 estimates)
• Cost of nuclear power has risen post-Fukushima (more than these 2010 estimates)

New Power Generation Risks
• Initial Cost Risk: includes unplanned cost increases, delays and imprudent utility actions
• Fuel and Operating Cost Risk: includes fuel cost and availability, as well as O&M cost risks
• New Regulation Risk: includes air and water quality rules, waste disposal, land use, and zoning
• Carbon Price Risk: includes state or federal limits on greenhouse gas emissions
• Water Constraint Risk: includes the availability and cost of cooling and process water
• Capital Shock Risk: includes availability and cost of capital, and risk to firm due to project size
• Planning Risk: includes risk of inaccurate load forecasts, competitive pressure

10
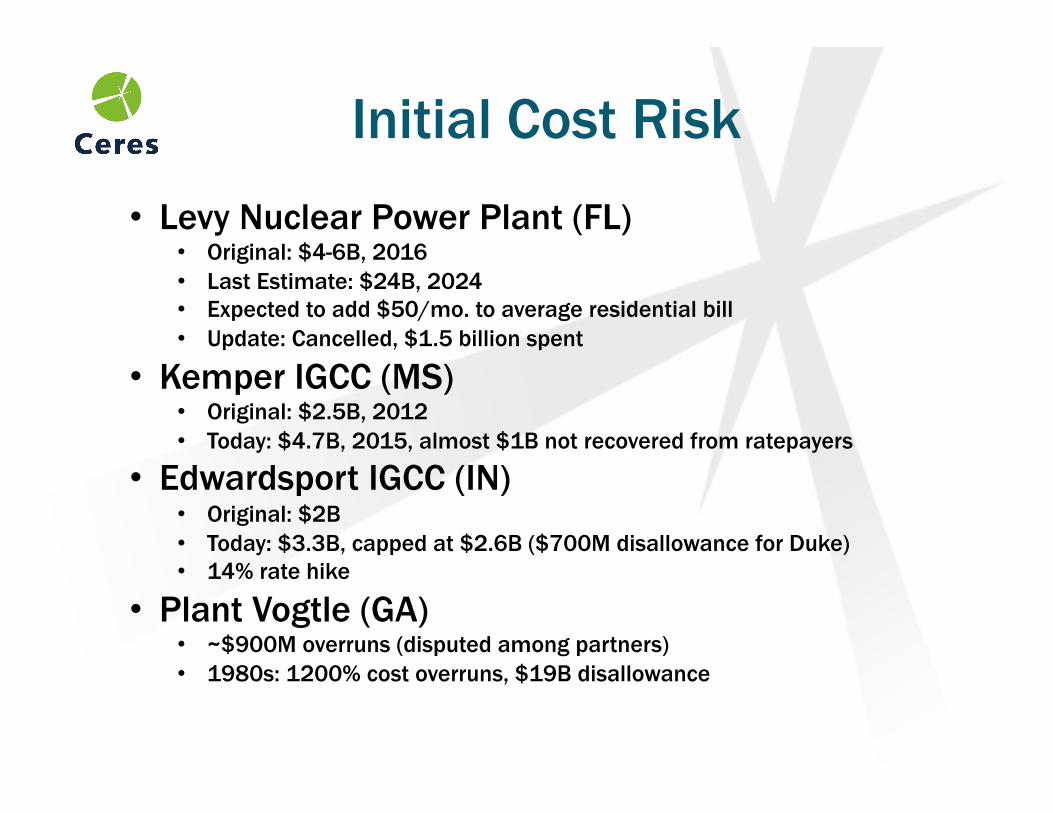
Initial Cost Risk • Levy Nuclear Power Plant (FL)
• Original: $4-6B, 2016 • Last Estimate: $24B, 2024 • Expected to add $50/mo. to average residential bill • Update: Cancelled, $1.5 billion spent
• Kemper IGCC (MS) • Original: $2.5B, 2012 • Today: $4.7B, 2015, almost $1B not recovered from ratepayers
• Edwardsport IGCC (IN) • Original: $2B • Today: $3.3B, capped at $2.6B ($700M disallowance for Duke) • 14% rate hike
• Plant Vogtle (GA) • ~$900M overruns (disputed among partners) • 1980s: 1200% cost overruns, $19B disallowance

Water Constraint Risk • Black & Veatch survey (2011): Water
mgmt is #1 business issue facing sector
• Risks • Drought (France ’03,
Southern Co. ‘08, India ‘10)
• High intake temps (Connecticut ’12, ‘13)
• Water rights (TX: 10% installed capacity at risk)

Cost Risk


Risk Aware Planning at the Tennessee Valley Authority
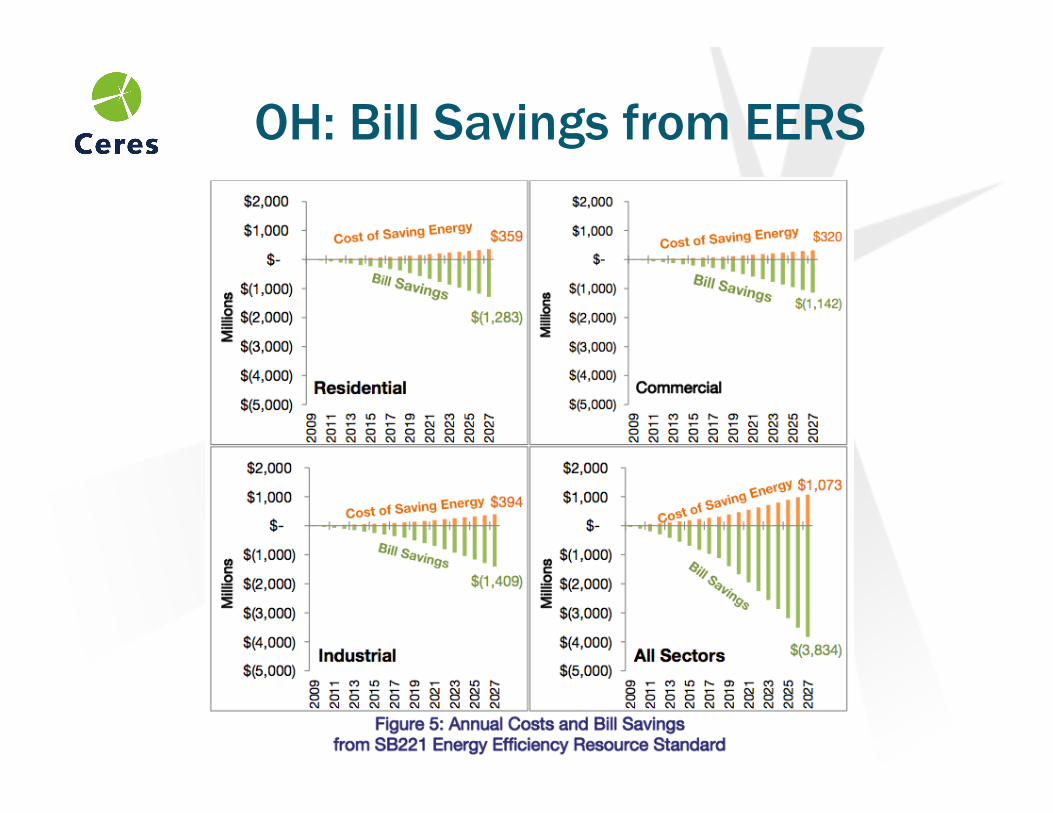
OH: Bill Savings from EERS
0.00
2.00
4.00
6.00
8.00
10.00
12.00
14.00
16.00
18.00
20.00
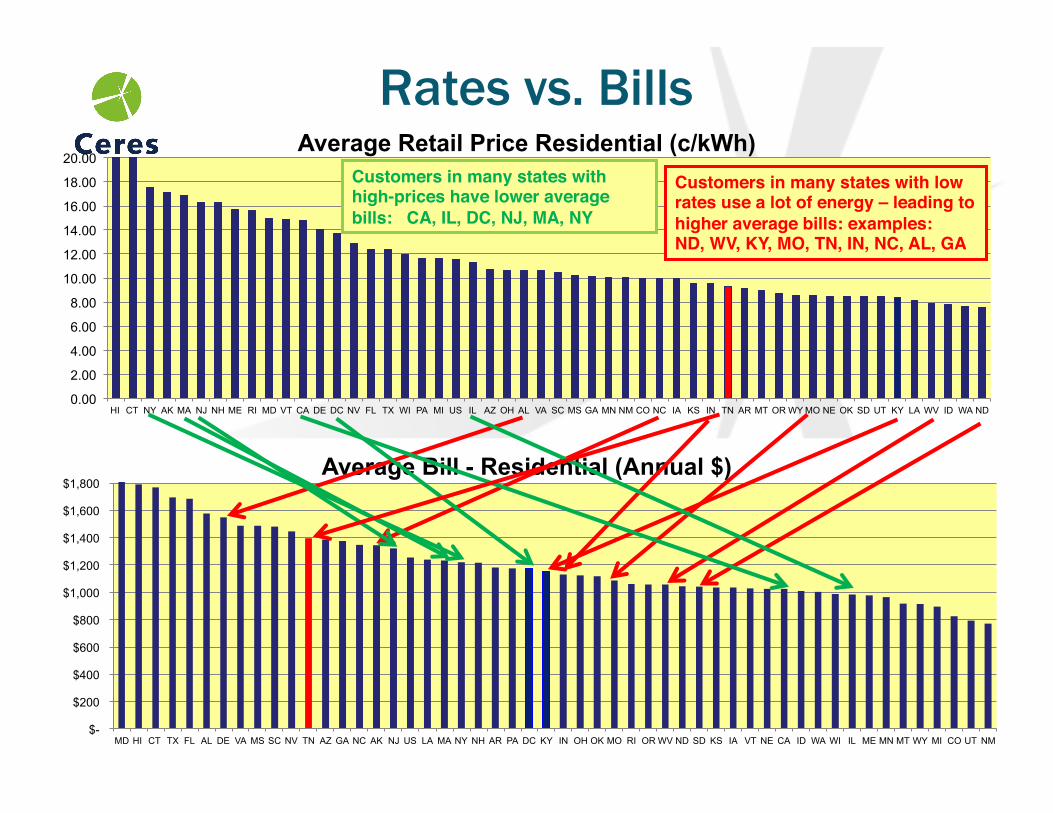
HI CT NY AK MA NJ NH ME RI MD VT CA DE DC NV FL TX WI PA MI US IL AZ OH AL VA SC MS GA MN NM CO NC IA KS IN TN AR MT OR WY MO NE OK SD UT KY LA WV ID WA ND
Average Retail Price Residential (c/kWh)
$-
$200
$400
$600
$800
$1,000
$1,200
$1,400
$1,600
$1,800
MD HI CT TX FL AL DE VA MS SC NV TN AZ GA NC AK NJ US LA MA NY NH AR PA DC KY IN OH OK MO RI OR WV ND SD KS IA VT NE CA ID WA WI IL ME MN MT WY MI CO UT NM
Average Bill - Residential (Annual $)
Customers in many states with low rates use a lot of energy – leading to higher average bills: examples: !ND, WV, KY, MO, TN, IN, NC, AL, GA!
Customers in many states with high-prices have lower average bills: CA, IL, DC, NJ, MA, NY!
Rates vs. Bills
18
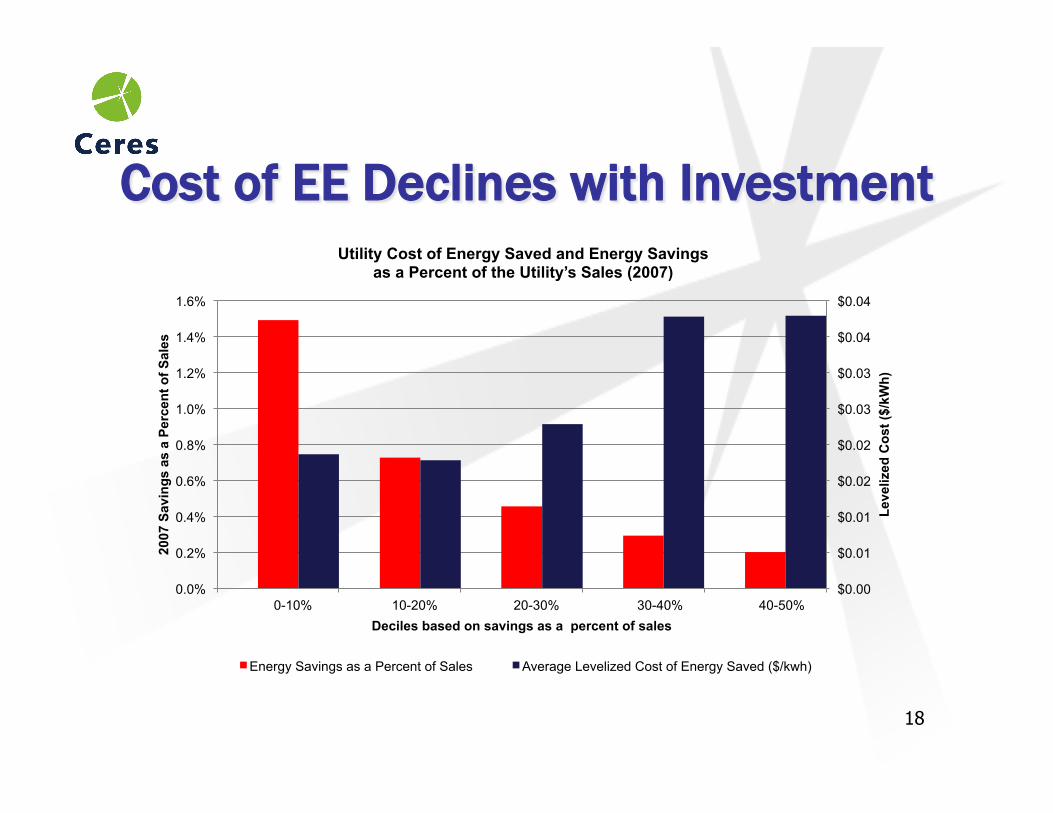
Cost of EE Declines with Investment
$0.00
$0.01
$0.01
$0.02
$0.02
$0.03
$0.03
$0.04
$0.04
0.0%
0.2%
0.4%
0.6%
0.8%
1.0%
1.2%
1.4%
1.6%
0-10% 10-20% 20-30% 30-40% 40-50%
Leve
lized
Cos
t ($/
kWh)
2007
Sav
ings
as
a Pe
rcen
t of S
ales
Deciles based on savings as a percent of sales
Utility Cost of Energy Saved and Energy Savings as a Percent of the Utility’s Sales (2007)
Energy Savings as a Percent of Sales Average Levelized Cost of Energy Saved ($/kwh)
19 19
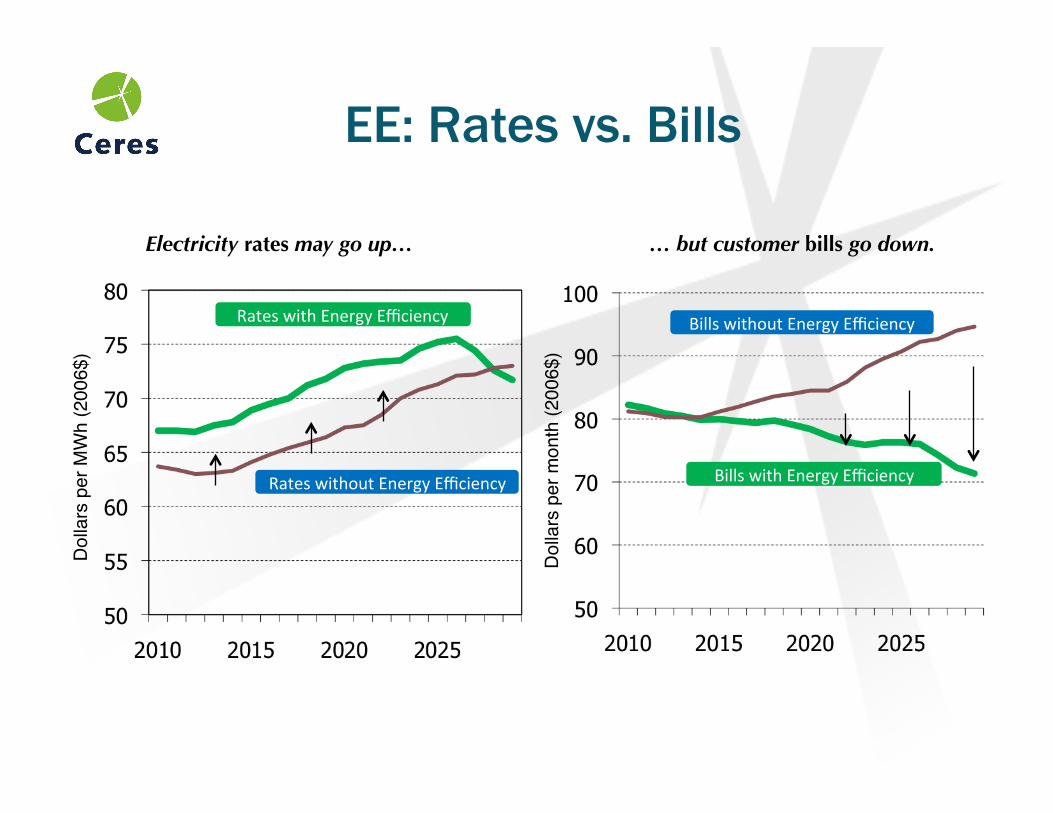
Electricity rates may go up…
Rates with Energy Efficiency
Rates without Energy Efficiency
Dol
lars
per
MW
h (2
006$
)"
Bills with Energy Efficiency
Bills without Energy Efficiency
… but customer bills go down.
Dol
lars
per
mon
th (2
006$
)"
EE: Rates vs. Bills
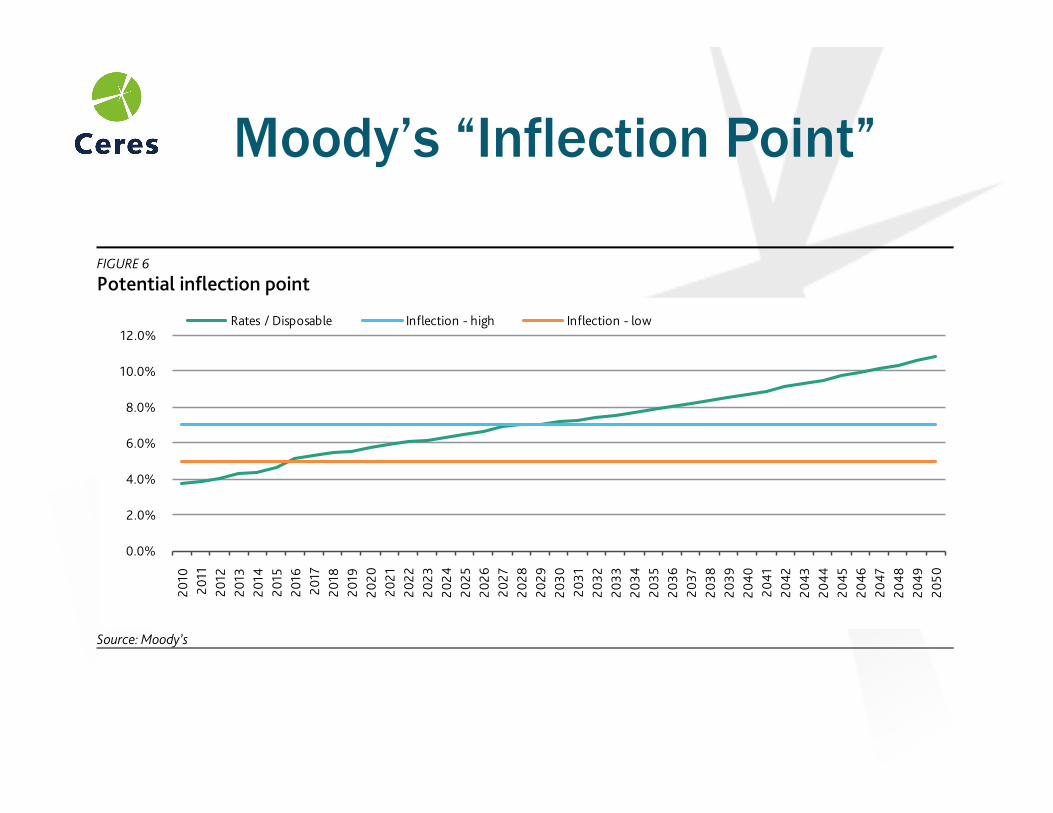
Moody’s “Inflection Point”
GLOBAL INFRASTRUCTURE FINANCE
12 MAY 2010
SPECIAL COMMENT: THE 21ST CENTURY ELECTRIC UTILITY
disposable income. Once this level is reached, we assume no volume growth for residential consumers, as any potential growth is offset by conservation efforts.
In the followingchart, we show how this relationship of estimated average annual electric bills as a percentage of estimated disposable household income looks over the forecast horizon. As evidenced in the graph, the lower 5% threshold is breeched in the 2016 timeframe, when carbon dioxide emission costs are implemented.
Nevertheless, should consumers reach this inflection point – when they will no longer tolerate rate increases – we would expect the initial course of action to be a vocal objections to their elected officials. This would conceivably increase political intervention risk and increase regulatory recovery risks. A highly contentious atmosphere is likely to result. Should this scenario develop, TECUSA’s ratings could be pressured.
FIGURE 6 Potential inflection point
0.0%
2.0%
4.0%
6.0%
8.0%
10.0%
12.0%
2010
2011
2012
2013
2014
2015
2016
2017
2018
2019
2020
2021
2022
2023
2024
2025
2026
2027
2028
2029
2030
2031
2032
2033
2034
2035
2036
2037
2038
2039
2040
2041
2042
2043
2044
2045
2046
2047
2048
2049
2050
Rates / Disposable Inflection - high Inflection - low
Source: Moody’s
Eventually, we believe consumers will commence a more focused and concerted effort at energy conservation. This could begin to materialize in 2027, as the electric bill as a percentage of disposable household income breeches the 7% range.
If we assume political intervention materializes, and rate increases are limited to maintaining some relationship to average disposable household income, it is conceivable that, all else being equal, TECUSA could experience some financial distress in the later years of our forecast horizon.
However, as the regulatory / political environment becomes more contentious, TECUSA would most likely embark on some significant changes to its overall strategic, investment and corporate financing policies. In our model scenarios, we incorporate some revisions, such as a dividend elimination (100% dividend cut) in 2028 and a material ramp-down of capital investment. We forecast a decline in capital expenditures to 200% of prior year’s D&A in from the years 2028 through 2031, and an additional reduction to 150% of prior year’s D&A from 2032 – 2050. These actions are likely to result in cash flow to debt related credit ratios that could defend investment grade ratings.

Energy Efficiency – Comparing Utilities

[INSERT COMPELLING PERSONAL ANECDOTE
HERE]