Embed Size (px)
Citation preview
Vol.:(0123456789)
Annals of Operations Researchhttps://doi.org/10.1007/s10479-021-04220-y
1 3
S.I. : RISK MANAGEMENT DECISIONS AND VALUE UNDER UNCERTAINTY
Risk management methodology in the supply chain: a case study applied
M. J. Hermoso‑Orzáez1 · J. Garzón‑Moreno1
Accepted: 28 July 2021 © The Author(s) 2021
AbstractThis work provides a general risk management procedure applied to synchronized sup-ply chains. After conducting a literature review and taking the international standard ISO 28000 and ISO 31000 as a reference. The most important steps that enable organizations to carry out supply chain risk management are described. Steps such as defining the context, identifying and analyzing risks or avoiding them, controlling them and mitigating them are some of the main points of this work. On the other hand, we carried out a practical case in which the execution of this procedure is carried out in a real supply chain located in the city of Jaén. In this specific case study, the most important risks and those that require early treatment will be discussed. In addition, a series of suggestions and ideas will be established, by way of conclusions, that allow said organization to improve the results that we have obtained in risk management.
Keywords Risk · AHP · Supply chain · Multi-criterion analysis · decision analysis · Product quality · Consistency
1 Introduction
Most of the companies there are frequently alterations in their operation that cause disrup-tions in their daily operations (Artikis, 2016). These types of alterations are a consequence of potential risks that exist in the environment in which the business activity takes place (Prakash et al., 2020). Identifying and analyzing the risks of supply chain disruption is essential to prevent disaster scenarios (Shareef et al., 2020). Recent studies analyze the impact of supply risks on the company’s optimal purchasing decisions (Zhang et al., 2020) and the importance of correctly identifying the source of supply risks (Guo et al., 2016).
* M. J. Hermoso-Orzáez [email protected]
J. Garzón-Moreno [email protected]
1 Department of Graphic Engineering Design and Projects, University of Jaén, Jaén, Spain
Annals of Operations Research
1 3
In a globalized world, where the flow of products and / or services of many organiza-tions have an international reach, it is essential to be able to manage the risk or at least (Xue et al., 2020), to have plans that mitigate (He & Yang, 2018) to a greater or lesser extent the potential risks to which one can Face any organization (Schauer et al., 2019). The con-figuration and coordination analyzes can be used as a foundation for further research in the context of integrating manufacturing network and supply chain theory (Rudberg & Olhager, 2003). On the other hand, Risk management using decision methods (AHP) (ana-lytical hierarchy process) to face solutions with a value under uncertainty (Álvarez-lópez, 2016) is presented as a practical and innovative tool (Choi et al., 2017). There are some recently published review papers on risk management in the supply chain operations pro-cesses under uncertain environments. For example (Colicchia, 2012) use a rigorous litera-ture review methodology, called systematic literature network analysis, to identify future research directions of supply chain risk management and to recognize streams of research that appear to be most promising. Heckmann et al. (2015) systematically define supply chain risk concepts, terminologies, and risk measuring and modeling methods from related fields. Fahimnia et al. (2015) use bibliometric and network analysis tools to identify key research clusters/topics, interrelationships, and generative research areas on quantitative models for managing supply chain risks. Chiu and Choi (2016) review the use of mean-risk models for analytical supply chain risk analysis. Govindan and Jepsen (2017) review the risks related to suppliers in service supply chains. Snyder et al. (2016) examine operations management literature on supply chain disruptions and provide an overview of the research within six supply chain processes (Snyder et al., 2016).
The result of this work is the elaboration of an applied methodology that allows com-panies to carry out a risk management of their supply chain in a useful and logical way (Senna et al., 2020) In parallel to the explanation of the procedure, we will carry out a practical case of risk management for a real supply chain located in the city of Jaén (Spain).
One of the objectives of this document is to demonstrate the importance of the risk management of a supply chain to guarantee the success of the organization (Fernando et al., 2018) Supply chains need great care to function properly and, risk analysis is the most powerful tool to minimize problems in the near future (da Silva et al., 2020).
At all times, the international standard related to the management of supply chain risks, ISO 28000, will be used as a reference and other standards that have been considered con-venient, such as ISO 31000 (Leitch, 2010) (project risk management) or (UNE-EN- IS0 9001, 2015) (quality management). Both ISO 31000 (UNE-EN-31000 AENOR, 2018) and ISO 28000 (UNE-EN-ISO 2800 AENOR, 2008) reflect the need for risk management not only in the supply chain, but in all parts of an organization (Blos et al., 2016) Both require more reflection than many organizations do on the subject (Hermoso-Orzáez et al., 2020).
2 Methodology and objectives
There are studies that used the integrated approach consisting of AHP to solve multi-cri-teria decision-making problems (MCDM) with criteria weights (Sarkar & Biswas, 2021) for risk treatment. Este documento tiene como objetivo identificar, clasificar y priorizar los riesgos de la cadena de suministro que enfrentan las pequeñas y medianas empresas de fabricación de pan y derivados para desarrollar una metodología de gestión de riesgos de la cadena de suministro (Alora & Barua, 2020). With this study we intend a triple objective:
Annals of Operations Research
1 3
Risk detection, risk mitigation, and risk recovery, Reduce risk management in supply chains to a single procedure through the study and collection of numerous methods and documents related to the subject (DuHadway et al., 2019)
Apply this procedure to a practical case in a current supply chain, measuring the results and assessing them for possible measures that can reduce the probability of occurrence of each one or reduce or mitigation its impact on the chain.
To make the reader aware of the importance of risk management in supply chains and the corresponding role they must acquire within organizations.
The methodology that is summarized in this document, we find stages that are more qualitative, such as definition of links or description of phases, and stages where it will be necessary to use numerical techniques that allow us to quantify, evaluate and prioritize the risks that are going trying during the early stages (Machado Nardi et al., 2020) The methodology for proper risk management consists of six steps characterized by a descrip-tive content in most of them and a logical chronology that helps and complements the beginning of its next phase. (Felfel et al., 2018) There are high impact research works that include and measure qualitative elements with methodologies designed to be qualitative, inductive and exploratory, thus involving multiple data collection methods and tools. More specifically, during the first stage of empirical analysis, these studies map and analyze pref-erences and perceptions of product quality at both the consumer and supply chain level.These qualitative insights may not be given adequate value initially. But it is precisely in the following stages or steps of risk monitoring and control that we are going to adjust its real impact on the supply chain (Tenorio et al., 2021).
2.1 Define the general process and establish the context of the supply chain to analyse
Correct risk management requires a detailed knowledge of the company, the market in which it operates and the legal, social, political and cultural environment that surrounds it.
In order for a company to initiate an analysis to make an improvement, it must know at what point it is to, from there, perform an assessment or diagnosis. These states of maturity include information, talent, workers, their objectives, values, their policy, the activities of each process, etc. Organizations must know what their position is within the chain to which they belong. Within this aspect we have two options: that the organization occupies most of the supply chain to which it belongs (the same company is responsible for most of the activities) or that the organization occupies a link within the chain supply (vertical integra-tion is less).
Our case study will focus on "PanJaén", a family business located in the city of Jaén (Spain). This company in the services sector offers its customers a wide variety of breads, coming to work with more than 10 types of flour (some organic) for its preparation. Other of its products are savory, whether snacks or puff pastry, and cakes. In addition, during all seasons they merge the most avant-garde and innovative styles of the market to offer prod-ucts of all kinds, such as mantecados or roscones de Reyes at Christmas time.
It is defined as a company experienced by a family totally related to the bakery sector and known for the quality of its artisan products. They presume to use quality raw materi-als, ecological ingredients and be in continuous training and qualification, integrating any technological advance for their productive development. In addition, these bakeries are in
Annals of Operations Research
1 3
an expansion process, that is, they increasingly incorporate new products in their stores to serve the citizens of Jaén.
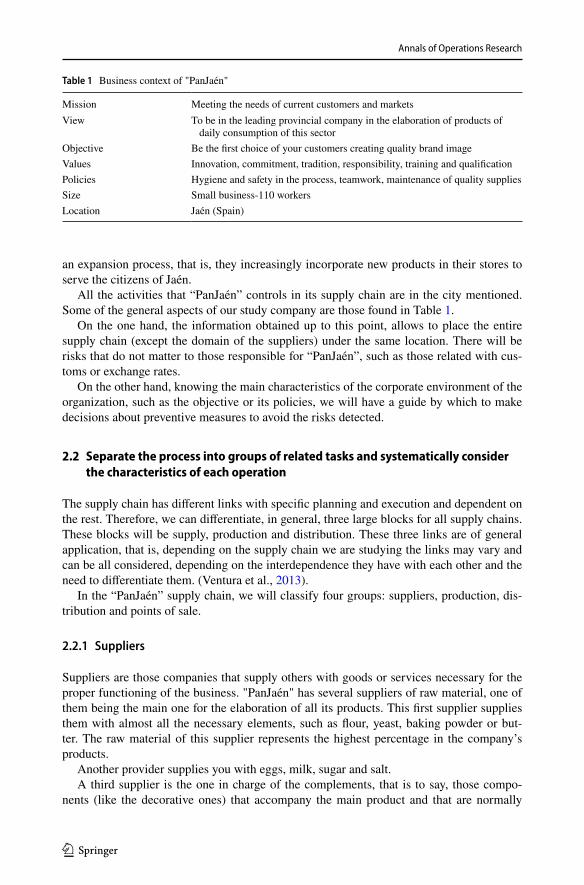
All the activities that “PanJaén” controls in its supply chain are in the city mentioned. Some of the general aspects of our study company are those found in Table 1.
On the one hand, the information obtained up to this point, allows to place the entire supply chain (except the domain of the suppliers) under the same location. There will be risks that do not matter to those responsible for “PanJaén”, such as those related with cus-toms or exchange rates.
On the other hand, knowing the main characteristics of the corporate environment of the organization, such as the objective or its policies, we will have a guide by which to make decisions about preventive measures to avoid the risks detected.
2.2 Separate the process into groups of related tasks and systematically consider the characteristics of each operation
The supply chain has different links with specific planning and execution and dependent on the rest. Therefore, we can differentiate, in general, three large blocks for all supply chains. These blocks will be supply, production and distribution. These three links are of general application, that is, depending on the supply chain we are studying the links may vary and can be all considered, depending on the interdependence they have with each other and the need to differentiate them. (Ventura et al., 2013).
In the “PanJaén” supply chain, we will classify four groups: suppliers, production, dis-tribution and points of sale.
2.2.1 Suppliers
Suppliers are those companies that supply others with goods or services necessary for the proper functioning of the business. "PanJaén" has several suppliers of raw material, one of them being the main one for the elaboration of all its products. This first supplier supplies them with almost all the necessary elements, such as flour, yeast, baking powder or but-ter. The raw material of this supplier represents the highest percentage in the company’s products.
Another provider supplies you with eggs, milk, sugar and salt.A third supplier is the one in charge of the complements, that is to say, those compo-
nents (like the decorative ones) that accompany the main product and that are normally
Table 1 Business context of "PanJaén"
Mission Meeting the needs of current customers and marketsView To be in the leading provincial company in the elaboration of products of
daily consumption of this sectorObjective Be the first choice of your customers creating quality brand imageValues Innovation, commitment, tradition, responsibility, training and qualificationPolicies Hygiene and safety in the process, teamwork, maintenance of quality suppliesSize Small business-110 workersLocation Jaén (Spain)
Annals of Operations Research
1 3
edible. There are many products sold accompanied by edible flowers, chocolate chips or colored balls that are purchased and applied directly to the target piece.
And finally, a fourth supplier is the one that supplies the assembly, that is, the materials that the company needs to be able to transport its products, such as covers, bags or boxes for the cakes. These, unlike the previous ones, are not edible and most of them have the company logo, as well as contact information, since they have a direct relationship with the customer.
2.2.2 Production
It corresponds to the internal processes that comprise the activities and manufacturing tasks that occur within the company. In other words, a production process is a system of actions that are related to each other and whose objective is none other than to transform elements, systems or processes. For this, some input factors are needed that, throughout the process, will increase in value thanks to the transformation.
In our case study, all production processes are carried out in the same physical place established in the industrial polygon of the capital Polígino de los Olivares s/n Jaén (Spain), except for a final baking that occurs at the point of sale. According to "PanJaén", the key to its products is in slow fermentation. This process is done since the water is mixed with the flour and goes until the first minutes of baking. First, a pre-fermentation is done slowly that will favor the final fermentation in order to be precise in the furnace jump. This is the key to improving the quality of bread, since it manages to respect and take care of the benefits that each of its stages generates.
This company has tunnel ovens with independent temperature controls throughout the oven. These ovens help to easily adjust the different temperatures during the baking cycle and optimize the first bake. Once the final result is achieved, they are packaged and go to the destination physical stores, giving way to the next link in the chain. Subsequently, at the point of sale, a second baking is carried out, which lasts approximately 15 min.
2.2.3 Distribution
It is made up of the different delivery processes until reaching the customer. The first thing that comes to mind when talking about distribution is the section from when the product is ready to be delivered to the final customer until this happens, but this is not always the case. A company that belongs to an intermediate link in its supply chain is a customer and at the same time a provider of other links in the same chain, but it is not the end customer (Ocampo & Ospina, 2016). “PanJaén” uses a subcontracted fleet that carries out this work. Logically it is done on a daily basis due to the products with which it works. This link is, without a doubt, the one with the least dominance of the company “PanJaén” (together with the suppliers) since it does not dominate it in its entirety. Road maps, vehicle mainte-nance, packaging and management of entrances and exits of the means of distribution are planned and coordinated by “PanJaén” and by the transport company.
2.2.4 Points of sale
They are the places where customers directly access products, that is, physical stores. Here, the customer can observe all the products that the company offers and buy them at the
Annals of Operations Research
1 3
same time. There are almost 20 points that "PanJaén" has in the city, so they are accessible to virtually the entire population.
Its opening hours are from 7:00 a.m. to 9:30 p.m., seven days a week. These establish-ments, as I have mentioned before, have ovens where the second baking of the bread is produced to achieve greater splendor for the customer.
2.3 Risk identification
No matter how much a company strives to control its processes, a crisis may arise from the weakest link. Even this link can be several levels away from the company that is directly affected (such as a supplier that provides a transport service for the distribution of food in a vehicle that does not meet the necessary quality requirements).
In general, supply chains are made up of similar agents. However, the risks for two simi-lar chains may vary depending on various factors such as the activity to which they belong, the agents participating in it, the place where they are developed or the number of custom-ers they satisfy. It is therefore difficult to assume that a particular risk for a supply chain has the same importance and value as that same risk in another supply chain.The biggest drawback of the risk is based on its great diversity, its multitude of origins, its variable con-sequences and the complex interrelation with the rest. The identification of risks involves naming the risk without explaining or quantifying it. Logically, people who work in a part of the supply chain have a greater facility to identify the risks of that part. That is why the definition and functional separation of parts of the supply chain is really important to carry out a successful risk identification.
Knowledge is an important resource in the supply chain and a critical determinant of the competitiveness of the supply chain (Jayaram & Pathak, 2013). This is developed both at the organizational level and at the individual level. While some authors focus on knowl-edge as a firm attribute, others point to the individual as the place of knowledge creation. When using the individual-level perspective of the knowledge-based vision, the company’s ability to manage supply chain risk will depend on the risk mitigation competence of its supply chain managers. Therefore, we seek to better understand the factors that affect the risk mitigation competence of the manager (Ambulkar et al., 2015).
The risks of the supply chain can also encapsulate, for example, the risk of suppliers (delays in receiving raw material or poor quality material). Within an organization, internal risk factors, such as those related to forecast errors, failures, capacity problems and inven-tory problems, should also not be overlooked. Another example would be operational risks, related to the internal activity of the organization (Rogers et al., 2016).
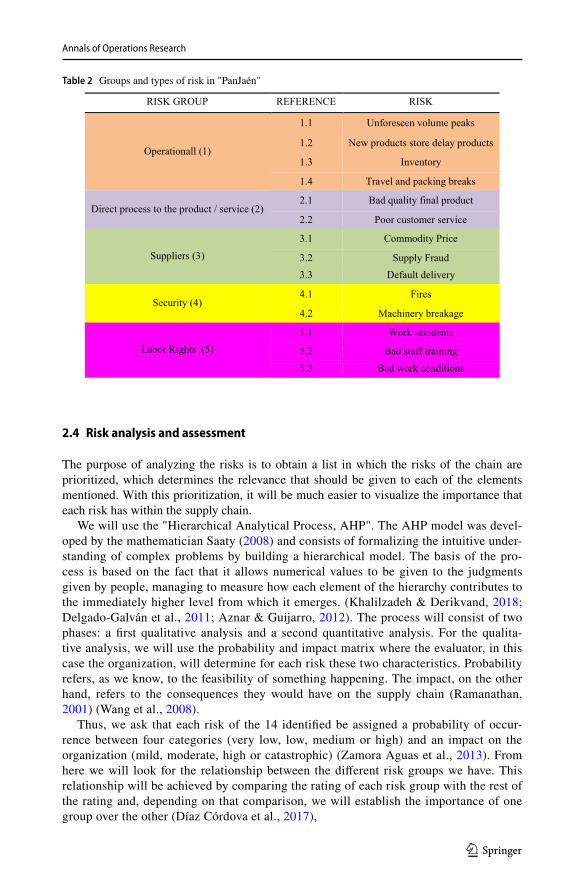
Through the use of the qualitative methods “What if…?” And “Brainstorm”, the main risks that exist in the supply chain we are studying are collected (ITM Platform, 2016) (UNE-EN 31,010 2011). The risks identified in the “PanJaén” supply chain have been obtained from a list of their own elaboration for the first assessment of their impact using sources such as the Iowa State University College (Amling & Daugherty, 2020), the Inter-national Journal of Logistics and Applications Research (Rogers et al., 2016) and the Inter-national Journal of Production Research (Blos et al., 2016). The identified risks appear in Table 2. These have been ordered according to their meaning and we have obtained a total of five risk groups: operational, direct process to the product/service, suppliers, safety and labor rights.
Annals of Operations Research
1 3
2.4 Risk analysis and assessment
The purpose of analyzing the risks is to obtain a list in which the risks of the chain are prioritized, which determines the relevance that should be given to each of the elements mentioned. With this prioritization, it will be much easier to visualize the importance that each risk has within the supply chain.
We will use the "Hierarchical Analytical Process, AHP". The AHP model was devel-oped by the mathematician Saaty (2008) and consists of formalizing the intuitive under-standing of complex problems by building a hierarchical model. The basis of the pro-cess is based on the fact that it allows numerical values to be given to the judgments given by people, managing to measure how each element of the hierarchy contributes to the immediately higher level from which it emerges. (Khalilzadeh & Derikvand, 2018; Delgado-Galván et al., 2011; Aznar & Guijarro, 2012). The process will consist of two phases: a first qualitative analysis and a second quantitative analysis. For the qualita-tive analysis, we will use the probability and impact matrix where the evaluator, in this case the organization, will determine for each risk these two characteristics. Probability refers, as we know, to the feasibility of something happening. The impact, on the other hand, refers to the consequences they would have on the supply chain (Ramanathan, 2001) (Wang et al., 2008).
Thus, we ask that each risk of the 14 identified be assigned a probability of occur-rence between four categories (very low, low, medium or high) and an impact on the organization (mild, moderate, high or catastrophic) (Zamora Aguas et al., 2013). From here we will look for the relationship between the different risk groups we have. This relationship will be achieved by comparing the rating of each risk group with the rest of the rating and, depending on that comparison, we will establish the importance of one group over the other (Díaz Córdova et al., 2017),
Table 2 Groups and types of risk in "PanJaén"
RISK GROUP REFERENCE RISK
Operationall (1)
1.1 Unforeseen volume peaks
1.2 New products store delay products
1.3 Inventory
1.4 Travel and packing breaks
Direct process to the product / service (2)2.1 Bad quality final product
2.2 Poor customer service
Suppliers (3)
3.1 Commodity Price
3.2 Supply Fraud3.3 Default delivery
Security (4)4.1 Fires
4.2 Machinery breakage
Labor Rights (5)5.1 Work accidents
5.2 Bad staff training5.3 Bad work conditions
Annals of Operations Research
1 3
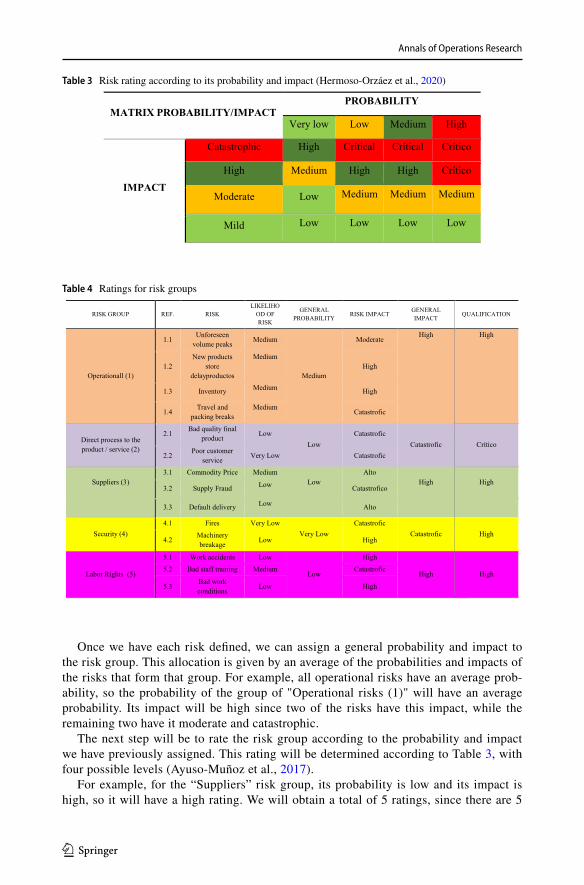
Once we have each risk defined, we can assign a general probability and impact to the risk group. This allocation is given by an average of the probabilities and impacts of the risks that form that group. For example, all operational risks have an average prob-ability, so the probability of the group of "Operational risks (1)" will have an average probability. Its impact will be high since two of the risks have this impact, while the remaining two have it moderate and catastrophic.
The next step will be to rate the risk group according to the probability and impact we have previously assigned. This rating will be determined according to Table 3, with four possible levels (Ayuso-Muñoz et al., 2017).
For example, for the “Suppliers” risk group, its probability is low and its impact is high, so it will have a high rating. We will obtain a total of 5 ratings, since there are 5
Table 3 Risk rating according to its probability and impact (Hermoso-Orzáez et al., 2020)
MATRIX PROBABILITY/IMPACTPROBABILITY
Very low Low Medium High
IMPACT
Catastrophic High Crítical Crítical Crítico
High Medium High High Crítico
Moderate Low Medium Medium Medium
Mild Low Low Low Low
Table 4 Ratings for risk groups
RISK GROUP REF. RISKLIKELIHO
OD OF RISK
GENERAL PROBABILITY RISK IMPACT
GENERAL IMPACT QUALIFICATION
Operationall (1)
1.1 Unforeseen volume peaks Medium
Medium
ModerateHigh High
1.2New products
store delayproductos
MediumHigh
1.3 Inventory Medium High
1.4 Travel and packing breaks
MediumCatastrofic
Direct process to the product / service (2)
2.1 Bad quality final product Low
LowCatastrofic
Catastrofic Crítico2.2 Poor customer
service Very Low Catastrofic
Suppliers (3)3.1 Commodity Price Medium
LowAlto
High High3.2 Supply Fraud Low Catastrofico
3.3 Default delivery Low Alto
Security (4)4.1 Fires Very Low
Very LowCatastrofic
Catastrofic High4.2 Machinery
breakage Low High
Labor Rights (5)
5.1 Work accidents Low
Low
High
High High5.2 Bad staff training Medium Catastrofic
5.3 Bad work conditions Low High
Annals of Operations Research
1 3
types of risks we have. Once we perform this procedure for all groups, we will have as a result Table 4, which we show below (He & Yang, 2018).
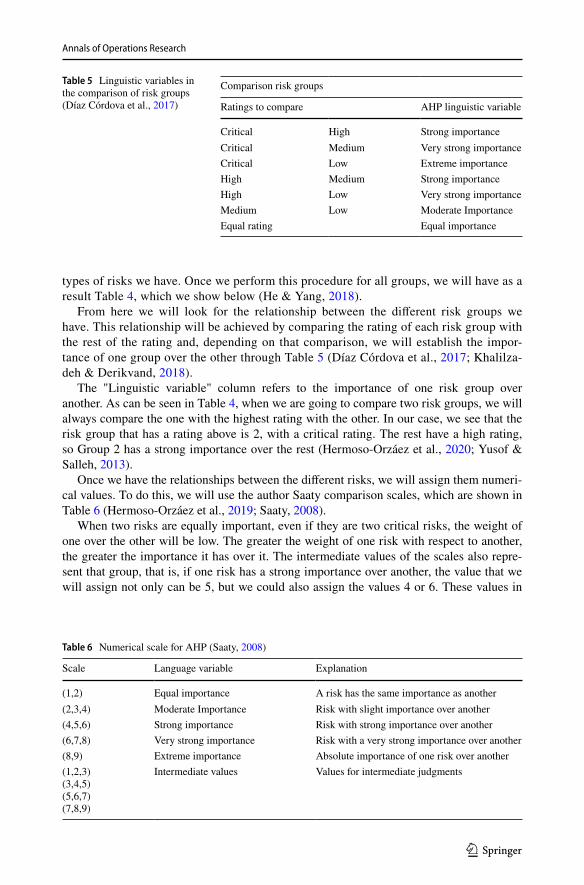
From here we will look for the relationship between the different risk groups we have. This relationship will be achieved by comparing the rating of each risk group with the rest of the rating and, depending on that comparison, we will establish the impor-tance of one group over the other through Table 5 (Díaz Córdova et al., 2017; Khalilza-deh & Derikvand, 2018).
The "Linguistic variable" column refers to the importance of one risk group over another. As can be seen in Table 4, when we are going to compare two risk groups, we will always compare the one with the highest rating with the other. In our case, we see that the risk group that has a rating above is 2, with a critical rating. The rest have a high rating, so Group 2 has a strong importance over the rest (Hermoso-Orzáez et al., 2020; Yusof & Salleh, 2013).
Once we have the relationships between the different risks, we will assign them numeri-cal values. To do this, we will use the author Saaty comparison scales, which are shown in Table 6 (Hermoso-Orzáez et al., 2019; Saaty, 2008).
When two risks are equally important, even if they are two critical risks, the weight of one over the other will be low. The greater the weight of one risk with respect to another, the greater the importance it has over it. The intermediate values of the scales also repre-sent that group, that is, if one risk has a strong importance over another, the value that we will assign not only can be 5, but we could also assign the values 4 or 6. These values in
Table 5 Linguistic variables in the comparison of risk groups (Díaz Córdova et al., 2017)
Comparison risk groups
Ratings to compare AHP linguistic variable
Critical High Strong importanceCritical Medium Very strong importanceCritical Low Extreme importanceHigh Medium Strong importanceHigh Low Very strong importanceMedium Low Moderate ImportanceEqual rating Equal importance
Table 6 Numerical scale for AHP (Saaty, 2008)
Scale Language variable Explanation
(1,2) Equal importance A risk has the same importance as another(2,3,4) Moderate Importance Risk with slight importance over another(4,5,6) Strong importance Risk with strong importance over another(6,7,8) Very strong importance Risk with a very strong importance over another(8,9) Extreme importance Absolute importance of one risk over another(1,2,3)(3,4,5)(5,6,7)(7,8,9)
Intermediate values Values for intermediate judgments
Annals of Operations Research
1 3
this Scales can be used as margins when the risks are of very similar importance, as is our case.
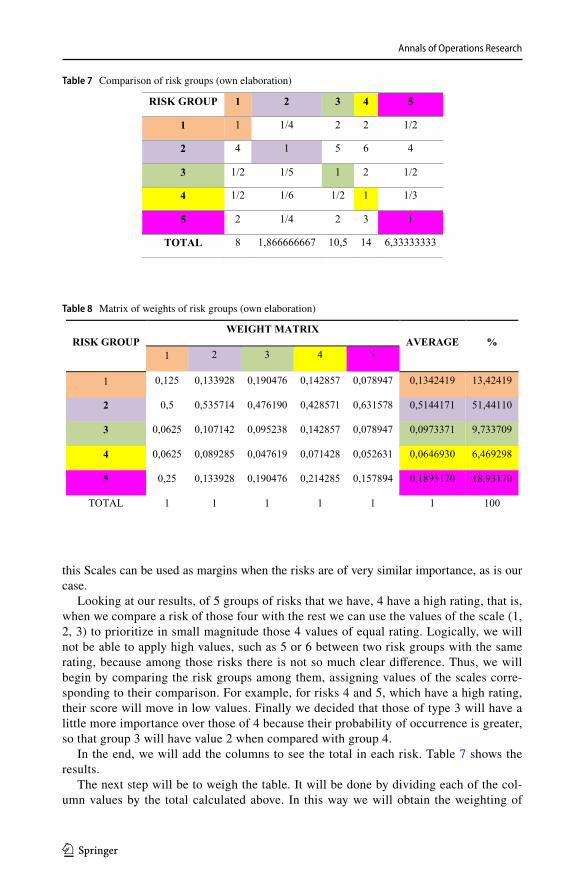
Looking at our results, of 5 groups of risks that we have, 4 have a high rating, that is, when we compare a risk of those four with the rest we can use the values of the scale (1, 2, 3) to prioritize in small magnitude those 4 values of equal rating. Logically, we will not be able to apply high values, such as 5 or 6 between two risk groups with the same rating, because among those risks there is not so much clear difference. Thus, we will begin by comparing the risk groups among them, assigning values of the scales corre-sponding to their comparison. For example, for risks 4 and 5, which have a high rating, their score will move in low values. Finally we decided that those of type 3 will have a little more importance over those of 4 because their probability of occurrence is greater, so that group 3 will have value 2 when compared with group 4.
In the end, we will add the columns to see the total in each risk. Table 7 shows the results.
The next step will be to weigh the table. It will be done by dividing each of the col-umn values by the total calculated above. In this way we will obtain the weighting of
Table 7 Comparison of risk groups (own elaboration)
RISK GROUP 1 2 3 4 5
1 1 1/4 2 2 1/2
2 4 1 5 6 4
3 1/2 1/5 1 2 1/2
4 1/2 1/6 1/2 1 1/3
5 2 1/4 2 3 1
TOTAL 8 1,866666667 10,5 14 6,33333333
Table 8 Matrix of weights of risk groups (own elaboration)
RISK GROUPWEIGHT MATRIX
AVERAGE %1 2 3 4 5
1 0,125 0,133928 0,190476 0,142857 0,078947 0,1342419 13,42419
2 0,5 0,535714 0,476190 0,428571 0,631578 0,5144171 51,44110
3 0,0625 0,107142 0,095238 0,142857 0,078947 0,0973371 9,733709
4 0,0625 0,089285 0,047619 0,071428 0,052631 0,0646930 6,469298
5 0,25 0,133928 0,190476 0,214285 0,157894 0,1893170 18,93170
TOTAL 1 1 1 1 1 1 100
Annals of Operations Research
1 3
each risk when compared to another, so we will need to average the weights in a new column.
That result will be the weighting of our risk group, which if multiplied by 100 will result in a percentage. The calculations of this step are reflected in Table 8 (Aznar & Guijarro, 2012; Ramanathan, 2001).
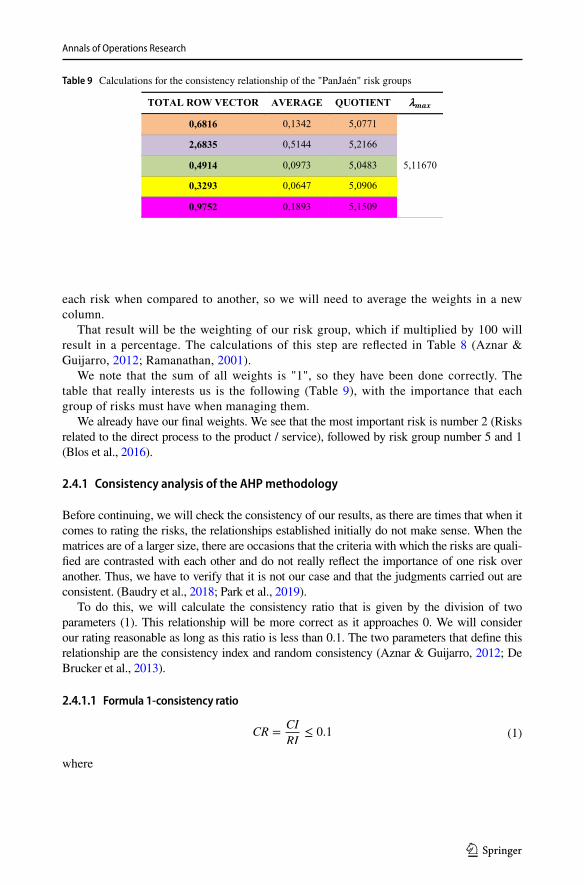
We note that the sum of all weights is "1", so they have been done correctly. The table that really interests us is the following (Table 9), with the importance that each group of risks must have when managing them.
We already have our final weights. We see that the most important risk is number 2 (Risks related to the direct process to the product / service), followed by risk group number 5 and 1 (Blos et al., 2016).
2.4.1 Consistency analysis of the AHP methodology
Before continuing, we will check the consistency of our results, as there are times that when it comes to rating the risks, the relationships established initially do not make sense. When the matrices are of a larger size, there are occasions that the criteria with which the risks are quali-fied are contrasted with each other and do not really reflect the importance of one risk over another. Thus, we have to verify that it is not our case and that the judgments carried out are consistent. (Baudry et al., 2018; Park et al., 2019).
To do this, we will calculate the consistency ratio that is given by the division of two parameters (1). This relationship will be more correct as it approaches 0. We will consider our rating reasonable as long as this ratio is less than 0.1. The two parameters that define this relationship are the consistency index and random consistency (Aznar & Guijarro, 2012; De Brucker et al., 2013).
2.4.1.1 Formula 1‑consistency ratio
where
(1)CR =CI
RI≤ 0.1
Table 9 Calculations for the consistency relationship of the "PanJaén" risk groups
TOTAL ROW VECTOR AVERAGE QUOTIENT λλ
0,6816 0,1342 5,0771
5,11670
2,6835 0,5144 5,2166
0,4914 0,0973 5,0483
0,3293 0,0647 5,0906
0,9752 0,1893 5,1509
Annals of Operations Research
1 3
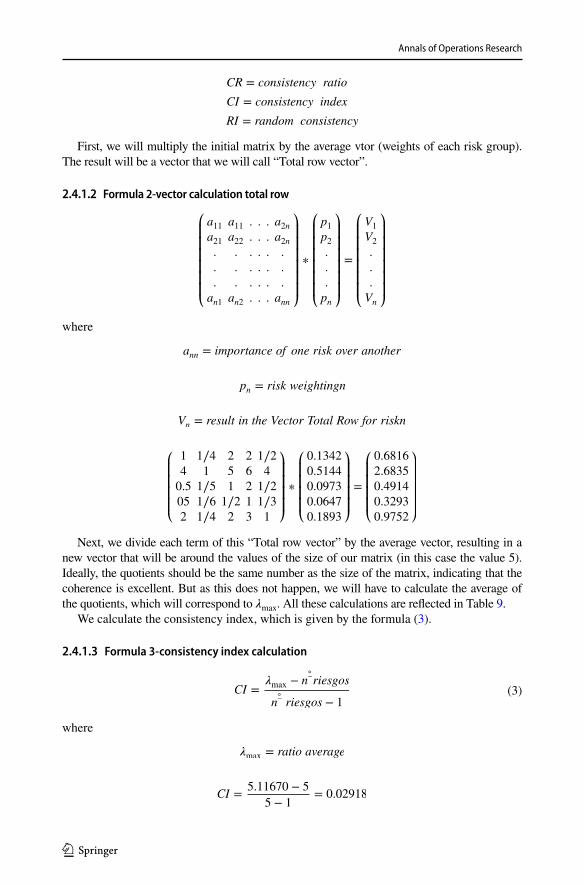
First, we will multiply the initial matrix by the average vtor (weights of each risk group). The result will be a vector that we will call “Total row vector”.
2.4.1.2 Formula 2‑vector calculation total row
where
Next, we divide each term of this “Total row vector” by the average vector, resulting in a new vector that will be around the values of the size of our matrix (in this case the value 5). Ideally, the quotients should be the same number as the size of the matrix, indicating that the coherence is excellent. But as this does not happen, we will have to calculate the average of the quotients, which will correspond to �max . All these calculations are reflected in Table 9.
We calculate the consistency index, which is given by the formula (3).
2.4.1.3 Formula 3‑consistency index calculation
where
CR = consistency ratio
CI = consistency index
RI = random consistency
⎛⎜⎜⎜⎜⎜⎜⎝
a11 a11 . . . a2na21 a22 . . . a2n. . . . . .
. . . . . .
. . . . . .
an1 an2 . . . ann
⎞⎟⎟⎟⎟⎟⎟⎠
∗
⎛⎜⎜⎜⎜⎜⎜⎝
p1p2.
.
.
pn
⎞⎟⎟⎟⎟⎟⎟⎠
=
⎛⎜⎜⎜⎜⎜⎜⎝
V1
V2
.
.
.
Vn
⎞⎟⎟⎟⎟⎟⎟⎠
ann = importance of one risk over another
pn = risk weightingn
Vn = result in the Vector Total Row for riskn
⎛⎜⎜⎜⎜⎝
1 1∕4 2 2 1∕2
4 1 5 6 4
0.5 1∕5 1 2 1∕2
05 1∕6 1∕2 1 1∕3
2 1∕4 2 3 1
⎞⎟⎟⎟⎟⎠
∗
⎛⎜⎜⎜⎜⎝
0.1342
0.5144
0.0973
0.0647
0.1893
⎞⎟⎟⎟⎟⎠
=
⎛⎜⎜⎜⎜⎝
0.6816
2.6835
0.4914
0.3293
0.9752
⎞⎟⎟⎟⎟⎠
(3)CI =�max − n
◦
−riesgos
n◦
−riesgos − 1
�max = ratio average
CI =5.11670 − 5
5 − 1= 0.02918
Annals of Operations Research
1 3
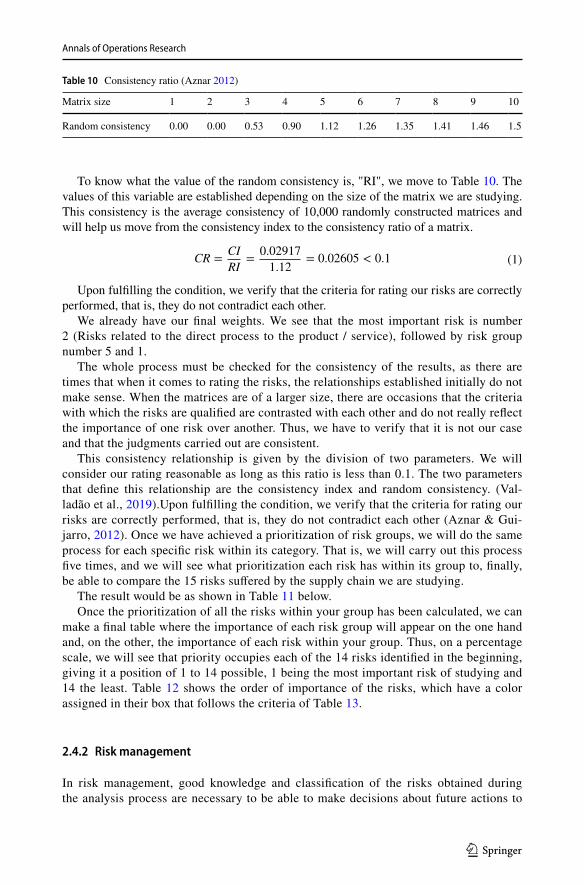
To know what the value of the random consistency is, "RI", we move to Table 10. The values of this variable are established depending on the size of the matrix we are studying. This consistency is the average consistency of 10,000 randomly constructed matrices and will help us move from the consistency index to the consistency ratio of a matrix.
Upon fulfilling the condition, we verify that the criteria for rating our risks are correctly performed, that is, they do not contradict each other.
We already have our final weights. We see that the most important risk is number 2 (Risks related to the direct process to the product / service), followed by risk group number 5 and 1.
The whole process must be checked for the consistency of the results, as there are times that when it comes to rating the risks, the relationships established initially do not make sense. When the matrices are of a larger size, there are occasions that the criteria with which the risks are qualified are contrasted with each other and do not really reflect the importance of one risk over another. Thus, we have to verify that it is not our case and that the judgments carried out are consistent.
This consistency relationship is given by the division of two parameters. We will consider our rating reasonable as long as this ratio is less than 0.1. The two parameters that define this relationship are the consistency index and random consistency. (Val-ladão et al., 2019).Upon fulfilling the condition, we verify that the criteria for rating our risks are correctly performed, that is, they do not contradict each other (Aznar & Gui-jarro, 2012). Once we have achieved a prioritization of risk groups, we will do the same process for each specific risk within its category. That is, we will carry out this process five times, and we will see what prioritization each risk has within its group to, finally, be able to compare the 15 risks suffered by the supply chain we are studying.
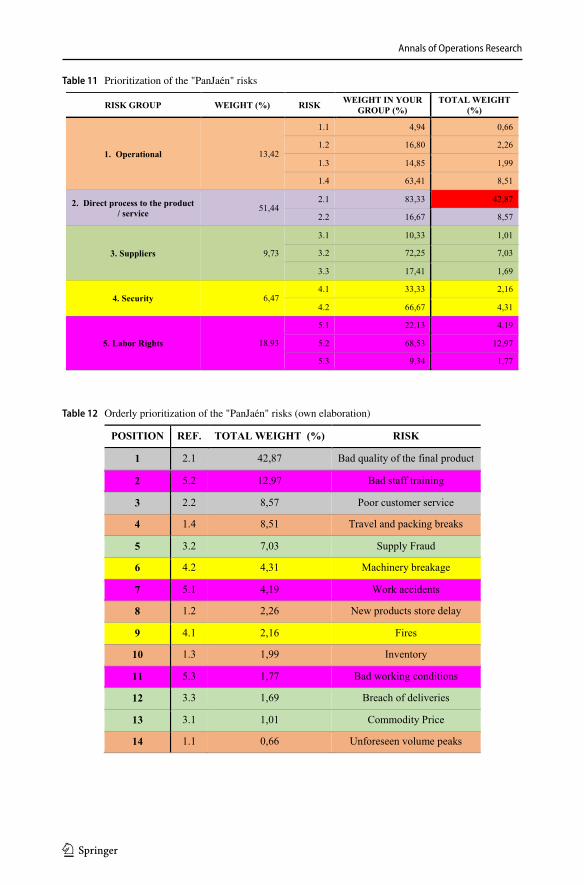
The result would be as shown in Table 11 below.Once the prioritization of all the risks within your group has been calculated, we can
make a final table where the importance of each risk group will appear on the one hand and, on the other, the importance of each risk within your group. Thus, on a percentage scale, we will see that priority occupies each of the 14 risks identified in the beginning, giving it a position of 1 to 14 possible, 1 being the most important risk of studying and 14 the least. Table 12 shows the order of importance of the risks, which have a color assigned in their box that follows the criteria of Table 13.
2.4.2 Risk management
In risk management, good knowledge and classification of the risks obtained during the analysis process are necessary to be able to make decisions about future actions to
(1)CR =CI
RI=
0.02917
1.12= 0.02605 < 0.1
Table 10 Consistency ratio (Aznar 2012)
Matrix size 1 2 3 4 5 6 7 8 9 10
Random consistency 0.00 0.00 0.53 0.90 1.12 1.26 1.35 1.41 1.46 1.5
Annals of Operations Research
1 3
Table 11 Prioritization of the "PanJaén" risks
RISK GROUP WEIGHT (%) RISK WEIGHT IN YOUR GROUP (%)
TOTAL WEIGHT (%)
1. Operational 13,42
1.1 4,94 0,66
1.2 16,80 2,26
1.3 14,85 1,99
1.4 63,41 8,51
2. Direct process to the product / service 51,44
2.1 83,33 42,87
2.2 16,67 8,57
3. Suppliers 9,73
3.1 10,33 1,01
3.2 72,25 7,03
3.3 17,41 1,69
4. Security 6,474.1 33,33 2,16
4.2 66,67 4,31
5. Labor Rights 18,93
5.1 22,13 4,19
5.2 68,53 12,97
5.3 9,34 1,77
Table 12 Orderly prioritization of the "PanJaén" risks (own elaboration)
POSITION REF. TOTAL WEIGHT (%) RISK
1 2.1 42,87 Bad quality of the final product
2 5.2 12,97 Bad staff training
3 2.2 8,57 Poor customer service
4 1.4 8,51 Travel and packing breaks
5 3.2 7,03 Supply Fraud
6 4.2 4,31 Machinery breakage
7 5.1 4,19 Work accidents
8 1.2 2,26 New products store delay
9 4.1 2,16 Fires
10 1.3 1,99 Inventory
11 5.3 1,77 Bad working conditions
12 3.3 1,69 Breach of deliveries
13 3.1 1,01 Commodity Price
14 1.1 0,66 Unforeseen volume peaks
Annals of Operations Research
1 3
reduce, mitigate or avoid them. Decision-making to deal with risks is often conditioned by ethical, legal, financial or strategic considerations.
It is very important to identify the risks that need treatment and those that do not. This decision of whether or not to treat risk, and how to do it, may depend on the costs and benefits of accepting the risk and/or implementing controls to mitigate, reduce or eliminate it.
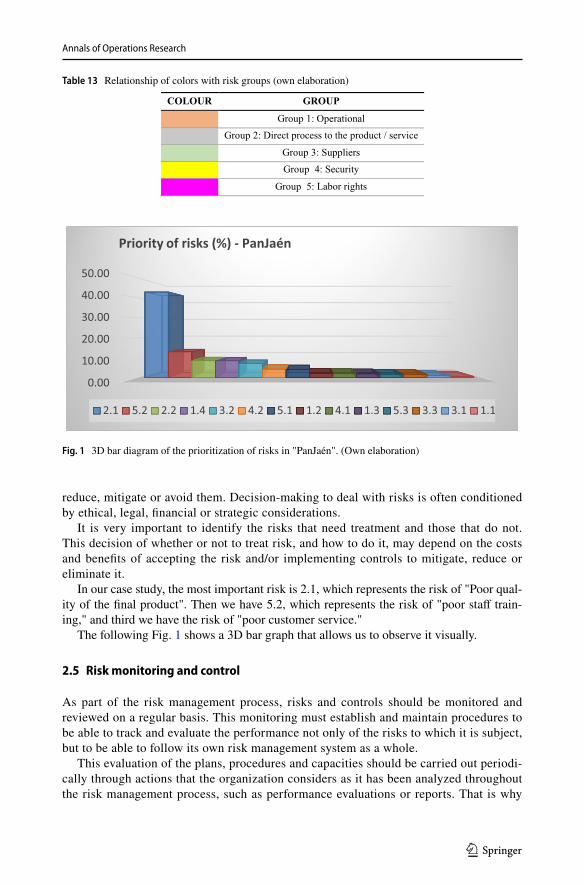
In our case study, the most important risk is 2.1, which represents the risk of "Poor qual-ity of the final product". Then we have 5.2, which represents the risk of "poor staff train-ing," and third we have the risk of "poor customer service."
The following Fig. 1 shows a 3D bar graph that allows us to observe it visually.
2.5 Risk monitoring and control
As part of the risk management process, risks and controls should be monitored and reviewed on a regular basis. This monitoring must establish and maintain procedures to be able to track and evaluate the performance not only of the risks to which it is subject, but to be able to follow its own risk management system as a whole.
This evaluation of the plans, procedures and capacities should be carried out periodi-cally through actions that the organization considers as it has been analyzed throughout the risk management process, such as performance evaluations or reports. That is why
Table 13 Relationship of colors with risk groups (own elaboration)
COLOUR GROUP
Group 1: Operational
Group 2: Direct process to the product / service
Group 3: Suppliers
Group 4: Security
Group 5: Labor rights
0.00
10.00
20.00
30.00
40.00
50.00
Priority of risks (%) - PanJaén
2.1 5.2 2.2 1.4 3.2 4.2 5.1 1.2 4.1 1.3 5.3 3.3 3.1 1.1
Fig. 1 3D bar diagram of the prioritization of risks in "PanJaén". (Own elaboration)
Annals of Operations Research
1 3
monitoring and review should take place at all stages of the process (UNE-EN 31,010 2011).
This monitoring and control process can be carried out by two agents: management or independent staff through audits.
The objective of this step will be to verify that:
• The hypotheses established in relation to risks continue to be valid.• The assumptions on which risk assessment has been based, including external and
internal contexts, continue to be valid.• The degree of compliance with the risk management policy, objectives and goals is
monitored.• Risk assessment techniques have been properly applied.• The recording of data and the results of the follow-up that facilitates subsequent analy-
sis actions.
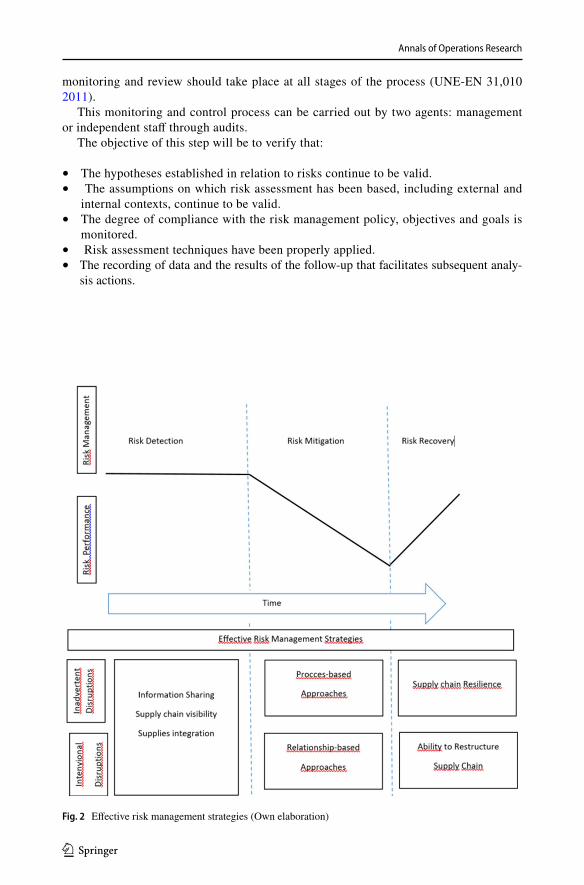
Fig. 2 Effective risk management strategies (Own elaboration)
Annals of Operations Research
1 3
2.6 Risk mitigation
The risks can be reduced o mitigated through supply chain redesign such as diversifica-tion or modularity in processes and design (Kleindorfer & Saad, 2005), strategic inventory stockpiling (Chopra & Sodhi, 2004)), risk pooling (Sheffi, 2003), principles from TQM Total Quality Management (Lee & Whang, 2005), or reducing supply chain complexity (Manuj & Mentzer, 2008). Using the traditional classification of risk frequency and impact (Norrman & Jansson, 2004), appropriate risk levels can be determined. Identifying general risk levels for Force Majeure disruptions and designing appropriate procedural safeguards and prevention mechanisms such as earthquake-proofing or fire facilities, backup inventory or suppliers, and contingency plans can effectively reduce the impact of a disruption.
Reducing the risk of Inside Jobs and other opportunistic behavior within the supply chain is more reliant on relationships than processes put in place.
These approaches are presented in Fig. 2 and connected to the different phases of risk management (DuHadway et al., 2019).
Reducing the risk of poor customer services, or bad quality of final products within a supply chain is manageable through setting up appropriate processes with a supply chain such as carrying safety stock and using reliable supplies (Tomlin, 2006), using a list of approved or preferred suppliers who have been pre-certified to some degree of reliability (Gosling et al., 2010), or using a risk management process to identify and manage risk levels for inadvertent disruptions which occur within the supply chain. Cer-tain safeguards might be taken such as securing against theft (Sullivan, 2010)(Sullivan, 2010), but in general, there are limited actions that a firm can take to prevent a targeted disruption. Recognizing that the entire supply chain might be exposed in the case of a disruption and strategically developing a balanced supply chain that is not extremely dependent on the contribution from a single firm can alleviate some of the risk, but there is no simple solution to eliminate targeted.
3 Results
For our study case, the risk that most concerns those responsible for the supply chain is related to the final quality of the product. This may be due to several reasons:
• The product has direct contact with the buyer, who is the one who finally makes sense of the supply chain. The customer expects a quality of the product they buy and this quality may not be what the customer expected, both better and worse.
• The organization is not really aware of the quality of its products, that is, it does not know the real thinking of the client exactly. For this reason, when assigning a value to the probability and impact of this risk, those responsible for the chain are worried about something they cannot control, a fact that is logical because it is beyond their reach.
• The good or bad quality of the final product has part of many risks that we have been analyzing before, such as raw material, poor staff knowledge or breakage through packaging. That is why quality represents, with this percentage so something, the consequences of many actions along the supply chain.
Annals of Operations Research
1 3
On the one hand, we know that the organization defines its products of a high quality, both in its elaboration, result and customer service. In fact, the objective of this com-pany is “Create a quality brand image”. So, when customers go to their points of sale or buy on demand, they expect excellent quality, which is the quality that the organization claims to offer. So, could we lessen the impact of this risk in case it occurs? The answer would rather be no. If a customer is disappointed with one of their products, the impact would be catastrophic. So we will try to treat and mitigate the risk by playing with the probability of its occurrence.
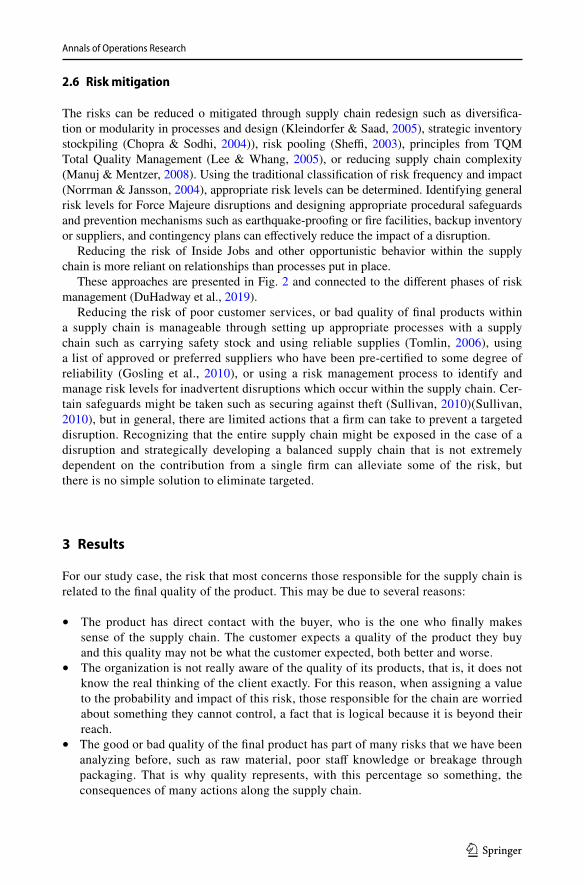
There are many factors that influence the quality of "PanJaén" products. In fact, they are found along the supply chain. To analyze the causes of this risk, we will use one of the methods explained in the “Risk analysis and assessment” step, as we will analyze a risk. The method that we will use will be "Analysis of cause and effect (fish bone)", as can be seen in Fig. 3. We will try to explain this Fig. 3, cause and effect analysis for the risk "Poor quality of the final product". We have different causes from different points in the supply chain and a negative final effect or risk that we want to eliminate, treat or mitigate.
3.1 Raw material
The poor conservation that the raw material presents with respect to time, either in the places of production, due to the inventory, or at the same point of sale, makes the prod-uct quality worse.On the other hand, the complements are pieces that accompany the final product, such as nuggets or edible wrappings. These, normally, are added directly to the product to be sold, so you have to be careful with their taste since they are not treated throughout the process.Finally in this group, the components of the raw material are essen-tial, as many of the clients look for certain properties in the bread and ours may not comply
Fig. 3 Cause and effect analysis for the risk "Bad quality of the final product." (Own elaboration)
Annals of Operations Research
1 3
with them. Thus, we must be clear about each of the properties of each component for treatment.
3.2 Manufacturing
It can be greatly affected by ignorance of the processes. The ignorance is not only of the personnel, but that a process in general is wrong and, although the personnel carry it out correctly, the result is not the ideal one. This may occur, for example, in the stages of com-ponent blends.On the other hand, product burns are crucial, as they give an undesirable appearance and taste. Because our bread has a double baking, you have to plan well the conditions of each of them and constantly monitor them.
3.3 Point of sale
The physical conditions of the establishment, such as cleanliness or smell, cause the cli-ent’s expectations to decline. In the same way, the treatment of the shopkeeper influences the clients and the way of attending or taking the products.On the other hand, the products must have a strategic distribution not only intended for consumption, but also for the mix-ture of odors that may arise.
3.4 Physical appearance
This is one of the most direct aspects with the client, because it includes the attractiveness of the product that can be given by its touch or its shape. On many occasions, the customer has an opinion about a cake or a loaf of bread simply by looking at it, regardless of its taste.
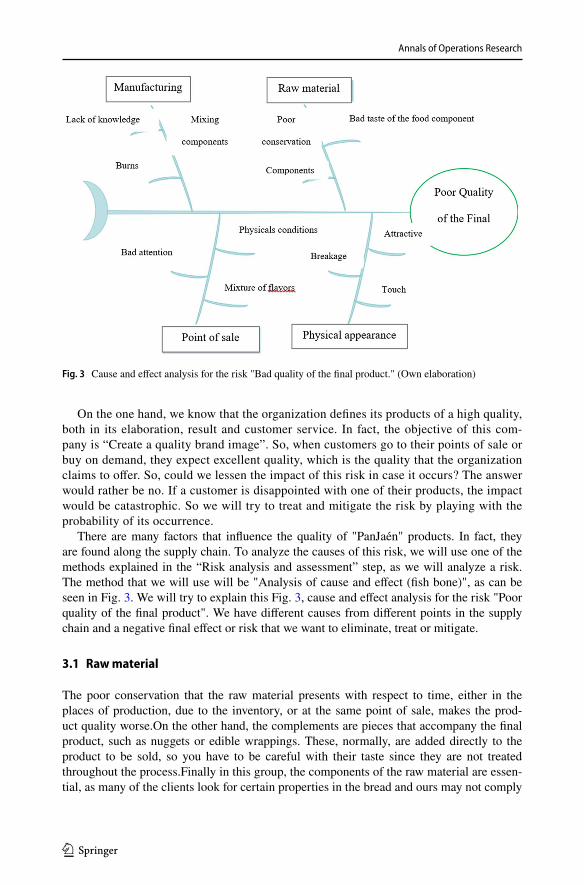
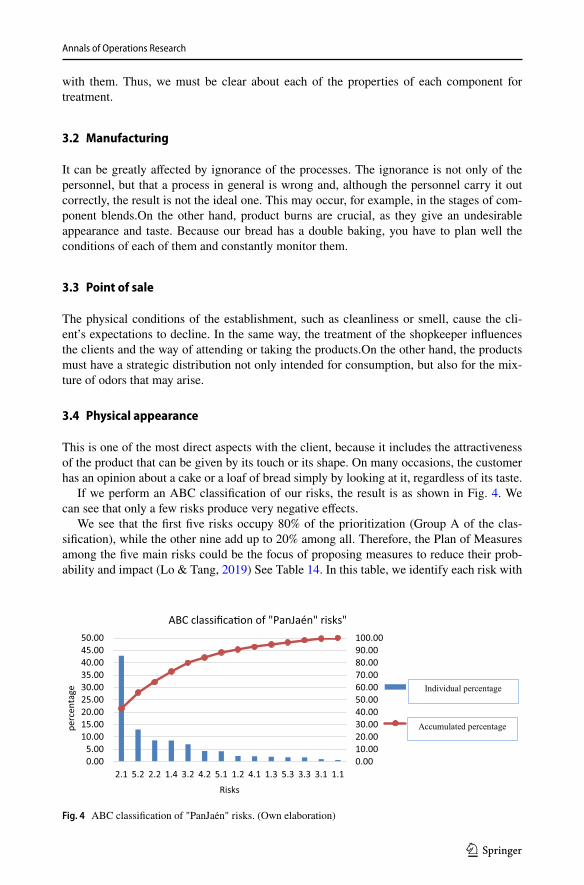
If we perform an ABC classification of our risks, the result is as shown in Fig. 4. We can see that only a few risks produce very negative effects.
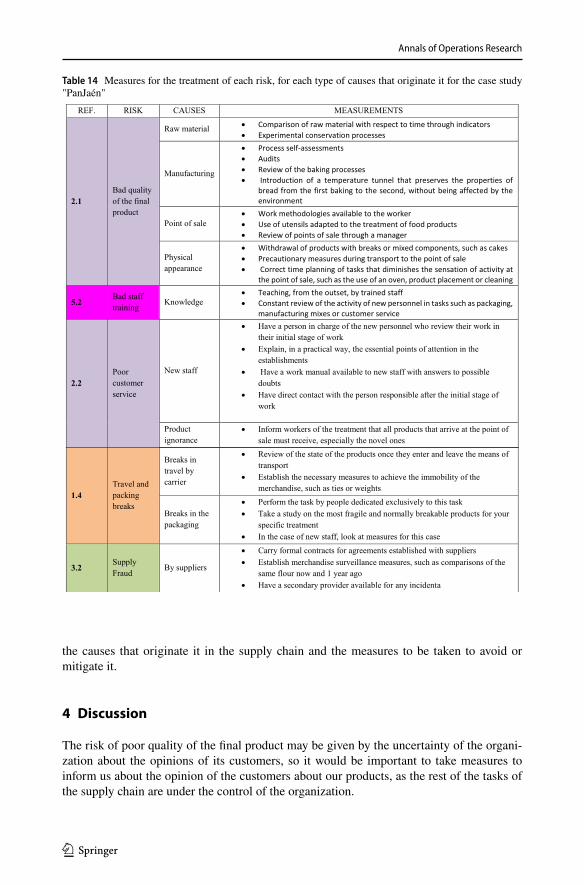
We see that the first five risks occupy 80% of the prioritization (Group A of the clas-sification), while the other nine add up to 20% among all. Therefore, the Plan of Measures among the five main risks could be the focus of proposing measures to reduce their prob-ability and impact (Lo & Tang, 2019) See Table 14. In this table, we identify each risk with
0.0010.0020.0030.0040.0050.0060.0070.0080.0090.00100.00
0.005.00
10.0015.0020.0025.0030.0035.0040.0045.0050.00
2.1 5.2 2.2 1.4 3.2 4.2 5.1 1.2 4.1 1.3 5.3 3.3 3.1 1.1
perc
enta
ge
Risks
ABC classifica�on of "PanJaén" risks"
Porcentajeindividual
Porcentajeacumulado
Individual percentage
Accumulated percentage
Fig. 4 ABC classification of "PanJaén" risks. (Own elaboration)
Annals of Operations Research
1 3
the causes that originate it in the supply chain and the measures to be taken to avoid or mitigate it.
4 Discussion
The risk of poor quality of the final product may be given by the uncertainty of the organi-zation about the opinions of its customers, so it would be important to take measures to inform us about the opinion of the customers about our products, as the rest of the tasks of the supply chain are under the control of the organization.
Table 14 Measures for the treatment of each risk, for each type of causes that originate it for the case study "PanJaén"
Annals of Operations Research
1 3
One possible measure would be for the supply chain to conform to some global stand-ard that accredits the quality objective, such as ISO 9001(UNE-EN- IS0 9001 2015). This international standard takes into account the activities of the organization, focusing on all the elements of quality management. with which a company must have to have an effective system that allows it to manage and improve the quality of its products or services. (Khal-ilzadeh & Derikvand, 2018).
Another possible measure would be the creation of an application App movil aplica-tions phone, for the mobile phone that rewards customer loyalty. Through this applica-tion, created by the company, consumers would have the possibility to value all products without having to do so in front of the workers. In addition, each time customers make a purchase, they can pass their identification code (on the phone screen) through a reader who is at the point of sale, transmitting the purchase data to the application. Thus, both clients and the organization would win:
• The application, knowing the products that each customer purchases, can customize the suggestions and offer discounts and offers for their next purchases.
• On the other hand, the organization will add more value to its chain and attract a greater number of customers. You can instantly report all your products without the need for a customer to enter the point of sale to learn about a new product.
5 Conclusion
This work allows us to conclude that the supply chain is valued by two key strategic con-cepts: its vulnerability and its resilience. Risk management is a fundamental tool for its control and future of the company.
Organizations will always be exposed to different types of risks that arise as an organi-zation progresses in its activity. These risks will be characterized by their probability of occurrence and their impact on the organization. These variables can initially be assessed subjectively or qualitatively by the risk manager. Being able to seem not dependent on or outside the organization. That is, the risk exists and due to the circumstances of the moment, it will have a certain probability and impact. This is where risk management itself begins, which allows organizations to identify, analyze and quantitatively assess risks through techniques such as the use of "Hierarchical Analytical Process, AHP", presented in this study. That allows hierarchical ordering of risks, to later be able to treat and manage them appropriately, avoid them, mitigate them or eliminate them.
When an incident occurs and it is acted upon after its occurrence, the organization must be aware that early risk management allows a less demanding and faster reaction to that emergency, so risk management is an improvement process The flexibility between chain actors continues to increase.
Another of the great conclusions that we obtain from this study is the following: a sup-ply chain can effectively challenge its vulnerabilities when all the actors that comprise it frequently share information. This will build trust, increase visibility, and decrease uncer-tainty in the network. Collaboration is related to visibility, as it includes the organization’s willingness to share risk. Therefore, an organization regardless of its location or operating environment is part of a complex supply chain and has political, economic, competitive, logistical or infrastructure concerns. Therefore, up-to-date information flows are required regarding the products and services produced, which are highly coordinated within and
Annals of Operations Research
1 3
outside the limits of the organization itself. All this leads us to affirm that information and its transfer are key in the processes of identification and treatment of risks.
Risk management in supply chains is increasingly important not only for the activities carried out in them but also for managers. Logically, organizations are not born with risk management in place but are created as events occur and according to the perspectives that managers acquire with their knowledge and experience.
Finally, it should be noted that the risk management process should never be an arbi-trary process, but rather carefully crafted and prepared. The key tool to carry out this entire process is the creation of a department dedicated to risk management that analyzes and determines the scope of each situation and the measures to be taken, being aware that a crucial element is a strong communication. between all the members of this department and the different links in the chain. All this will give us the ability to face, avoid mitigating or eliminating the risks that affect us, whatever their nature. In this way, we will start the path towards a strong, flexible and competitive chain.
Looking at our case study, it can be seen that many of those factors that influence quality are risks that we have already identified, so the measures we take will be directed towards these risks that affect quality. In this way, we will reduce the probability and impact of these risks and we will also reduce the probability of occurrence of our main risk.
The risk of poor quality of the final product is observed as the main risk to be treated due to its impact on the supply chain of food production companies, on the final customer. It does not always have to occur in its entirety due to the combination of factors throughout the supply chain, but can be given by the uncertainty of the organization about the opinions of its customers. Therefore, it would be important to take measures to inform us about the opinion of customers about the final products placed in the hands of the consumer, since the rest of the tasks of the supply chain are under the direct control of the organization. In this process, the transmission of information along the supply chain is essential for risk management. In this sense, the use of new technologies such as Mobile Apps, which allow the customer to assess quality directly and interactively, is shown to be a powerful tool for the future for interactive risk management.
Funding Open Access funding provided thanks to the CRUE-CSIC agreement with Springer Nature.
Open Access This article is licensed under a Creative Commons Attribution 4.0 International License, which permits use, sharing, adaptation, distribution and reproduction in any medium or format, as long as you give appropriate credit to the original author(s) and the source, provide a link to the Creative Com-mons licence, and indicate if changes were made. The images or other third party material in this article are included in the article’s Creative Commons licence, unless indicated otherwise in a credit line to the material. If material is not included in the article’s Creative Commons licence and your intended use is not permitted by statutory regulation or exceeds the permitted use, you will need to obtain permission directly from the copyright holder. To view a copy of this licence, visit http:// creat iveco mmons. org/ licen ses/ by/4. 0/.
References
Alora, A., & Barua, M. K. (2020). Development of a supply chain risk index for manufacturing supply chains. International Journal of Productivity and Performance Management. https:// doi. org/ 10. 1108/ IJPPM- 11- 2018- 0422
Álvarez-lópez, I. R. A. A. (2016). Optimal allocation of a fixed production under price uncertainty. Annals of Operations Research. https:// doi. org/ 10. 1007/ s10479- 014- 1702-7
Annals of Operations Research
1 3
Ambulkar, S., Blackhurst, J. V., & Cantor, D. E. (2015). Supply chain risk mitigation competency: An individual-level knowledge-based perspective. International Journal of Production Research, 54(5), 1398–1411. https:// doi. org/ 10. 1080/ 00207 543. 2015. 10709 72
Amling, A., & Daugherty, P. J. (2020). Logistics and distribution innovation in China. IJPDLM, 50(3), 323–332. https:// doi. org/ 10. 1108/ IJPDLM- 07- 2018- 0273
Artikis, P. T. (2016). Deriving advantage over a crisis by incorporating a new class of stochastic models for risk control operations. Annals of Operations Research, 247(2), 823–831. https:// doi. org/ 10. 1007/ s10479- 015- 1896-3
Ayuso-Muñoz, J. L., Yagüe-Blanco, J. L., & Capuz-Rizo, S. F. (2017). Lecture Notes in Management and Industrial Engineering Project Management and Engineering Research (Vol. 49). http:// www. sprin ger. com/ series/ 11786
Aznar, J., & Guijarro, F. (2012). New Valuation Methods: Multicriteria Models. (Universitat Politécnica de Valencia, Ed.) ((2a Ed.). Valencia (Spain). https:// riunet. upv. es/ bitst ream/ handle/ 10251/ 19181/ TOC_ 6083_ 02_ 01. pdf? seque nce=3
Baudry, G., Macharis, C., & Vallée, T. (2018). Range-based multi-actor multi-criteria analysis: A combined method of multi-actor multi-criteria analysis and monte carlo simulation to support participatory deci-sion making under uncertainty. European Journal of Operational Research, 264(1), 257–269. https:// doi. org/ 10. 1016/j. ejor. 2017. 06. 036
Blos, M. F., Hoeflich, S. L., Dias, E. M., & Wee, H.-M. (2016). A note on supply chain risk classification: Discussion and proposal. International Journal of Production Research, 54(5), 1568–1569. https:// doi. org/ 10. 1080/ 00207 543. 2015. 10673 75
Chiu, C. H., & Choi, T. M. (2016). Supply chain risk analysis with mean-variance models: A technical review. Annals of Operations Research, 240(2), 489–507. https:// doi. org/ 10. 1007/ s10479- 013- 1386-4
Choi, T. M., Govindan, K., Li, X., & Li, Y. (2017). Innovative supply chain optimization models with mul-tiple uncertainty factors. Annals of Operations Research, 257(1–2), 1–14. https:// doi. org/ 10. 1007/ s10479- 017- 2582-4
Chopra, S., & Sodhi, M. M. S. (2004). Managing risk to avoid: Supply-chain breakdown. MIT Sloan Man-agement Review, 46(1).
Colicchia, F. S. (2012). Supply chain risk management: A new methodology for a systematic literature review. Supply Chain Management: An International Journal, 17(4), 403–418.
da Silva, E. M., Ramos, M. O., Alexander, A., & Jabbour, C. J. C. (2020). A systematic review of empirical and normative decision analysis of sustainability-related supplier risk management. Journal of Cleaner Production, 244, 118808. https:// doi. org/ 10. 1016/j. jclep ro. 2019. 118808
De Brucker, K., MacHaris, C., & Verbeke, A. (2013). Multi-criteria analysis and the resolution of sustain-able development dilemmas: A stakeholder management approach. European Journal of Operational Research, 224(1), 122–131. https:// doi. org/ 10. 1016/j. ejor. 2012. 02. 021
Delgado-Galván, X., Herrera, M., Izquierdo, J., & Pérez-García, R. (2011). Applications of AHP Methodol-ogy for decision making in the management of the supply network. In: Conference: XI SEREA, Semi-nario Iberoamericano de planificación, proyecto y operación de abastecimiento de aguaAt: Morelia, Mexico (p. 11).
Díaz Córdova, J. F., Coba Molina, E., & Navarrete López, P. (2017). Fuzzy logic and financial risk. A pro-posed classification of financial risk to the cooperative sector. Contaduria y Administracion, 62(5), 1687–1703. https:// doi. org/ 10. 1016/j. cya. 2017. 10. 001
DuHadway, S., Carnovale, S., & Hazen, B. (2019). Understanding risk management for intentional supply chain disruptions: Risk detection, risk mitigation, and risk recovery. Annals of Operations Research, 283(1–2), 179–198. https:// doi. org/ 10. 1007/ s10479- 017- 2452-0
Fahimnia, B., Tang, C. S., Davarzani, H., & Sarkis, J. (2015). Quantitative models for managing supply chain risks: A review. European Journal of Operational Research, 247(1), 1–15. https:// doi. org/ 10. 1016/j. ejor. 2015. 04. 034
Felfel, H., Ben, W., Omar, Y., & Faouzi, A. (2018). Stochastic multi-site supply chain planning in textile and apparel industry under demand and price uncertainties with risk aversion. Annals of Operations Research, 271(2), 551–574. https:// doi. org/ 10. 1007/ s10479- 018- 2980-2
Fernando, Y., Walters, T., Ismail, M. N., Seo, Y. W., & Kaimasu, M. (2018). Managing project success using project risk and green supply chain management: A survey of automotive industry. International Jour-nal of Managing Projects in Business, 11(2), 332–365. https:// doi. org/ 10. 1108/ IJMPB- 01- 2017- 0007
Gosling, J., Purvis, L., & Naim, M. M. (2010). Supply chain flexibility as a determinant of supplier selec-tion. International Journal of Production Economics, 128(1), 11–21. https:// doi. org/ 10. 1016/j. ijpe. 2009. 08. 029
Annals of Operations Research
1 3
Govindan, K., & Jepsen; M. B. . (2017). Supplier risk assessment based on trapezoidal intuitionistic fuzzy numbers and ELECTRE TRI-C: A case illustration involving service suppliers. Journal of the Opera-tional Research Society. https:// doi. org/ 10. 1057/ jors. 2015. 51
Guo, S., Zhao, L., & Xu, X. (2016). Impact of supply risks on procurement decisions. Annals of Operations Research. https:// doi. org/ 10. 1007/ s10479- 013- 1422-4
He, B., & Yang, Y. (2018). Mitigating supply risk: An approach with quantity flexibility procurement. Annals of Operations Research, 271(2), 599–617. https:// doi. org/ 10. 1007/ s10479- 018- 2840-0
Heckmann, I., Comes, T., & Nickel, S. (2015). A critical review on supply chain risk - Definition, measure and modeling. Omega (united Kingdom), 52, 119–132. https:// doi. org/ 10. 1016/j. omega. 2014. 10. 004
Hermoso-Orzáez, M. J., Orejón-Sánchez, R. D, Gago-Calderón, A. (2020). Analysis and Risk Management in Projects of Change to Led in Street Lighting According to ISO-21500 and UNE-EN-62198. In: C.-R. S. F. (eds) Ayuso Muñoz J.L., Yagüe Blanco J.L. (Ed.), Project Management and Engineering Research (1aed., pp. 405–424). Adolfo López-Paredes, INSISOC, University of Valladolid, Valladolid, Spain: Springer, Cham. https:// doi. org/ 10. 1007/ 978-3- 030- 54410-2_ 29
Hermoso-Orzáez, M. J., Cámara-Martínez, J., Rojas-Sola, J. I., & Gago-Calderon, A. (2019). Analytical and economic methodology for storage of large heavyweight equipment in industrial processes. Economic Research-Ekonomska Istrazivanja. https:// doi. org/ 10. 1080/ 13316 77X. 2019. 16966 92
Jayaram, J., & Pathak, S. (2013). A holistic view of knowledge integration in collaborative supply chains. International Journal of Production Research, 51(7), 1958–1972. https:// doi. org/ 10. 1080/ 00207 543. 2012. 700130
Khalilzadeh, M., & Derikvand, H. (2018). A multi-objective supplier selection model for green supply chain network under uncertainty. Journal of Modelling in Management, 13(3), 605–625. https:// doi. org/ 10. 1108/ JM2- 06- 2017- 0062
Kleindorfer, P. R., & Saad, G. H. (2005). Managing disruption risks in supply chains. Production and Oper-ations Management, 14(1), 53–68.
Lee, H. L., & Whang, S. (2005). Higher supply chain security with lower cost: Lessons from total qual-ity management. International Journal of Production Economics, 96(3), 289–300. https:// doi. org/ 10. 1016/j. ijpe. 2003. 06. 003
Leitch, M. (2010). ISO 31000:2009-The new international standard on risk management. Risk Analysis, 30(6), 887–892. https:// doi. org/ 10. 1111/j. 1539- 6924. 2010. 01397.x
Lo, A., & Tang, Z. (2019). Pareto-optimal reinsurance policies in the presence of individual risk constraints. Annals of Operations Research, 274(1–2), 395–423. https:// doi. org/ 10. 1007/ s10479- 018- 2820-4
Machado Nardi, V. A., Auler, D. P., & Teixeira, R. (2020). Food safety in global supply chains: A literature review. Journal of Food Science, 85(4), 883–891. https:// doi. org/ 10. 1111/ 1750- 3841. 14999
Manuj, I., & Mentzer, J. T. (2008). Global supply chain risk management strategies. International Journal of Physical Distribution and Logistics Management, 38(3), 192–223. https:// doi. org/ 10. 1108/ 09600 03081 08669 86
Norrman, A., & Jansson, U. (2004). Ericsson’s proactive supply chain risk management approach after a serious sub-supplier accident. International Journal of Physical Distribution and Logistics Manage-ment, 34, 434–456.
Ocampo, P. C., & Ospina, R. P. (2016). Marketing and supply chain in relation to the auto parts sector in Colombia. Sinapsis, 8, 21–41.
Park, B., Nam, T., & Yeo, G. (2019). Study on location selection of integrated depot of warehouse stores utilizing AHP method. Journal of Digital Convergence, 17(2), 135–144. https:// doi. org/ 10. 14400/ JDC. 2019. 17.2. 135
ITM Platform. (2016). Don’t let the vase break: a dozen techniques to identify risks. .Projects, Program,Portfoilo. https:// www. itmpl atform. com/ es/ blog/ que- no- se- te- rompa- el- jarron- una- docena- de- tecni cas- para- ident ificar- riesg os/
Prakash, S., Kumar, S., Soni, G., Jain, V., & Rathore, A. P. S. (2020). Closed-loop supply chain net-work design and modelling under risks and demand uncertainty: An integrated robust optimiza-tion approach. Annals of Operations Research, 290(1–2), 837–864. https:// doi. org/ 10. 1007/ s10479- 018- 2902-3
Ramanathan, R. (2001). A note on the use of the analytic hierarchy process for environmental impact assessment. Journal of Environmental Management, 63(1), 27–35. https:// doi. org/ 10. 1006/ jema. 2001. 0455
Rogers, H., Srivastava, M., Pawar, K. S., & Shah, J. (2016). Supply chain risk management in India – practical insights. International Journal of Logistics Research and Applications, 19(4), 278–299. https:// doi. org/ 10. 1080/ 13675 567. 2015. 10754 76
Rudberg, M., & Olhager, J. (2003). Manufacturing networks and supply chains: An operations strategy perspective. Omega, 31(1), 29–39. https:// doi. org/ 10. 1016/ S0305- 0483(02) 00063-4
Annals of Operations Research
1 3
Saaty, T. L. (2008). Decision making with the analytic hierarchy process (AHP). International Journal of Services Sciences, 1(1), 83–98. https:// doi. org/ 10. 1504/ IJSSCI. 2008. 017590
Sarkar, B., & Biswas, A. (2021). Pythagorean fuzzy AHP-TOPSIS integrated approach for transpor-tation management through a new distance measure. Soft Computing. https:// doi. org/ 10. 1007/ s00500- 020- 05433-2
Schauer, S., Polemi, N., & Mouratidis, H. (2019). Correction to MITIGATE: A dynamic supply chain cyber risk assessment methodology. Journal of Transportation Security. https:// doi. org/ 10. 1007/ s12198- 018- 0197-x
Senna, P., Reis, A., Santos, I. L., Dias, A. C., & Coelho, O. (2020). A systematic literature review on supply chain risk management: Is healthcare management a forsaken research field? Benchmarking. https:// doi. org/ 10. 1108/ BIJ- 05- 2020- 0266
Shareef, M. A., Dwivedi, Y. K., Kumar, V., Hughes, D. L., & Raman, R. (2020). Sustainable supply chain for disaster management: structural dynamics and disruptive risks. Annals of Operations Research. https:// doi. org/ 10. 1007/ s10479- 020- 03708-3
Sheffi, Y. (2003). Supply chain management under the threat of international terrorism. The Interna-tional Journal of Logistics Management, 12(2), 1–11.
Snyder, L. V., Atan, Z., Peng, P., Rong, Y., Schmitt, A. J., & Sinsoysal, B. (2016). OR/MS models for supply chain disruptions: a review. IIE Transactions. https:// doi. org/ 10. 1080/ 07408 17X. 2015. 10677 35
Sullivan, A. K. (2010). Piracy in the Horn of Africa and its effects on the global supply chain. Journal of Transportation Security, 3(4), 231–243. https:// doi. org/ 10. 1007/ s12198- 010- 0049-9
Tenorio, M., Pascucci, S., Verkerk, R., & Dekker, M. (2021). What does it take to go global? The role of quality alignment and complexity in designing international food supply chains. Supply Chain Management-an International Journal. https:// doi. org/ 10. 1108/ SCM- 05- 2020- 0222
Tomlin, B. (2006). On the value of mitigation and contingency strategies for managing supply chain dis-ruption risks. Management Science, 52(5), 639–657. https:// doi. org/ 10. 1287/ mnsc. 1060. 0515
UNE-EN 31010. .Risk management. Risk appreciation techniques (2011). :AENOR (Spain). https:// www. une. org/ encue ntra- tu- norma/ busca- tu- norma/ norma?c= N0047 287
UNE-EN- IS0 9001. ISO 9001. (2015). Normas9000. Obtenido de http:// www. norma s9000. com/ conte nt/ que- es- iso. aspx (2015). file:///C:/Users/UJA/Downloads/009001NEIS106_ES.pdf
UNE-EN-31000 AENOR. UNE-EN-ISO 31000-Risk Management (2018). Spain. https:// www. aenor. com/ normas- y- libros/ busca dor- de- normas/ UNE?c= N0059 900
UNE-EN-ISO 2800 AENOR. UNE-EN-ISO 2800.Specifications for security management systems for the supply chain (2008). Spain.
Valladão, D., Silva, T., & Poggi, M. (2019). Time-consistent risk-constrained dynamic portfolio optimi-zation with transactional costs and time-dependent returns. Annals of Operations Research, 282(1–2), 379–405. https:// doi. org/ 10. 1007/ s10479- 018- 2991-z
Ventura, J. A., Valdebenito, V. A., & Golany, B. (2013). A dynamic inventory model with supplier selec-tion in a serial supply chain structure. European Journal of Operational Research, 230(2), 258–271. https:// doi. org/ 10. 1016/j. ejor. 2013. 03. 012
Wang, Y. M., Luo, Y., & Hua, Z. (2008). On the extent analysis method for fuzzy AHP and its applica-tions. European Journal of Operational Research, 186(2), 735–747. https:// doi. org/ 10. 1016/j. ejor. 2007. 01. 050
Xue, K., Li, Y., Zhen, X., & Wang, W. (2020). Managing the supply disruption risk: Option contract or order commitment contract? Annals of Operations Research, 291(1–2), 985–1026. https:// doi. org/ 10. 1007/ s10479- 018- 3007-8
Yusof, N. A. M., & Salleh, S. H. (2013). Analytical Hierarchy Process in Multiple Decisions Making for Higher Education in Malaysia. Procedia - Social and Behavioral Sciences, 81, 389–394. https:// doi. org/ 10. 1016/j. sbspro. 2013. 06. 448
Zamora Aguas, J. P., Adarme, W. A., & Arango Serna, M. D. (2013). Supply risk analysis: Applying system dynamics to the Colombian healthcare sector. Ingenieria e Investigacion, 33(3), 76–81.
Zhang, J., Chan, F. T. S., & Xu, X. (2020). The optimal order decisions of a risk-averse newsvendor under backlogging. Annals of Operations Research. https:// doi. org/ 10. 1007/ s10479- 020- 03636-2
Publisher’s Note Springer Nature remains neutral with regard to jurisdictional claims in published maps and institutional affiliations.