Embed Size (px)
DESCRIPTION
Risk management in banks Leoš Souček, Komerční banka. Introduction / Czech economic specifics … 1/ 2. Private sector indebtedness at the lower end of EU levels Indebtedness of corporate sector at 22% of GDP Indebtedness of households 30% of GDP - PowerPoint PPT Presentation
Citation preview
page 1MFF UK – March 9, 2012
Risk management in banks
Leoš Souček, Komerční banka
page 2MFF UK – March 9, 2012
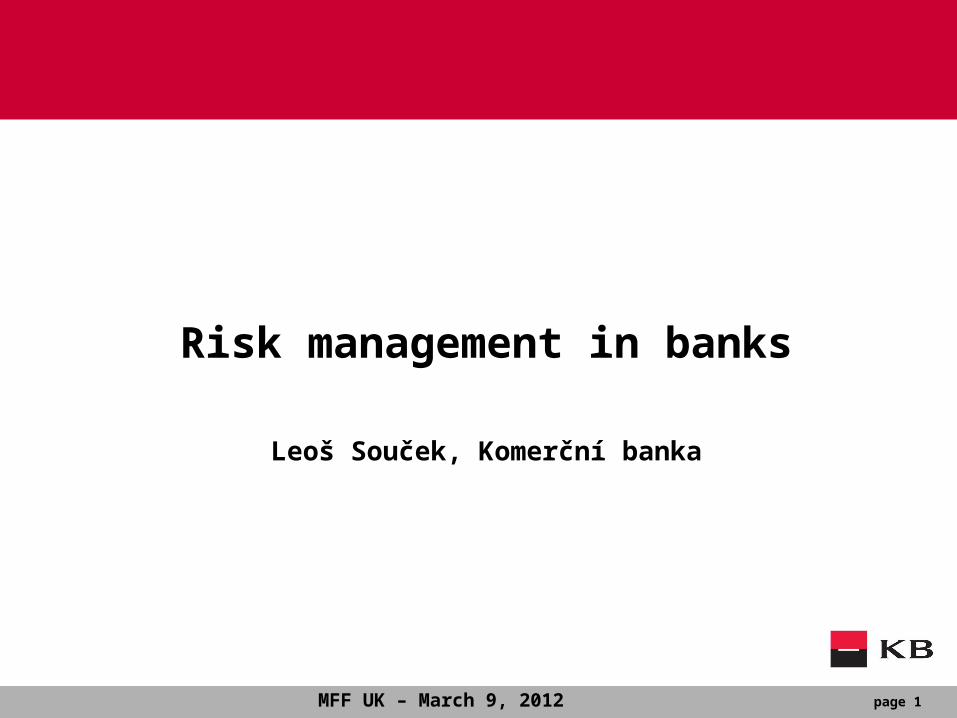
Introduction / Czech economic specifics… 1/2
Private sector indebtedness at the lower end of EU levels Indebtedness of corporate sector at 22% of GDP Indebtedness of households 30% of GDP Dynamic growth of mass retail exposure (above 30% yoy in 2003-
2008) slow-downed in 2010/2011 (6.6% yoy in 07/2011)
Also public sector indebtedness lower than EU peers CZ at 38.5% end of 2010 (FR: 82%, DE: 83%, HU: 80%, PL: 55%, SK:
41%, IT: 119%, GR: 143%) Budget deficit narrowed to 4.7% GDP in 2010 (SK: 7.9%, HU: ‑ ‑
4.3%, GR: 10.5%, FR: 7.0%, DE: 3.3%, AT: 4.8%)‑ ‑ ‑ ‑ ‑
Despite fragile political stability some progress in reforms, which help to secure fiscal sustainability
Health care and pension reforms under progress S&P raised the LTFC Czech Republic rating to 'AA-'
No concrete plans on EUR adoption
Limited dependence on external financing Relative low level of external debt in terms of GDP External financing needs covered by FDI and EU funds
Private debt to GDP - 2011Q1
0%
50%
100%
150%
200%
250%
300%
Cyp
rus
Luxe
mbo
urD
enm
ark
Spa
inIr
elan
dP
ortu
gal
Mal
taS
wed
enN
ethe
rland
sU
KG
reec
eA
ustr
iaIta
lyF
ranc
eE
ston
iaG
erm
any
Latv
iaF
inla
ndS
love
nia
Bul
garia
Bel
gium
Lith
uani
aH
unga
ryC
zech
Rep
.P
olan
dS
lova
kia
Rom
ania
Non-financial corporation debt to GDP
Household debt to GDP
0%
50%
100%
150%
200%
250%
CzechRepublic
Hungary Poland U.S. Germany France Austria
Public sector Private sector
Total external debt in % of GDP (Q4 2010)
page 3MFF UK – March 9, 2012
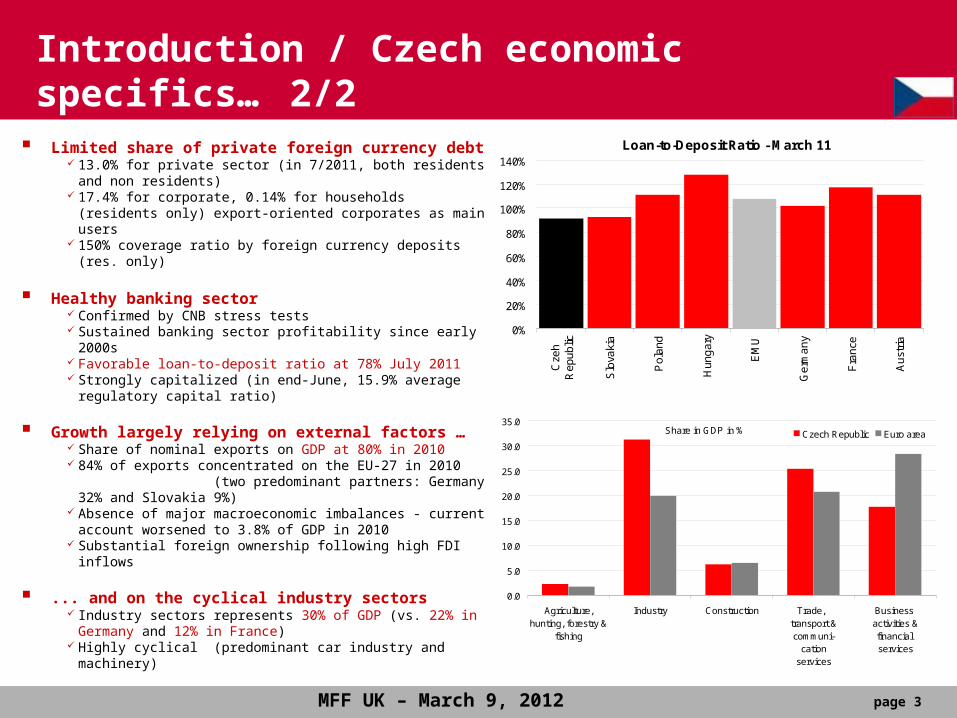
Introduction / Czech economic specifics… 2/2
Loan-to-Deposit Ratio - March 11
0%
20%
40%
60%
80%
100%
120%
140%
Cze
hR
ep
ub
lic
Slo
vaki
a
Po
lan
d
Hu
ng
ary
EM
U
Ge
rma
ny
Fra
nce
Au
stri
a
Limited share of private foreign currency debt 13.0% for private sector (in 7/2011, both residents and non
residents) 17.4% for corporate, 0.14% for households (residents only)
export-oriented corporates as main users 150% coverage ratio by foreign currency deposits (res. only)
Healthy banking sector Confirmed by CNB stress tests Sustained banking sector profitability since early 2000s Favorable loan-to-deposit ratio at 78% July 2011 Strongly capitalized (in end-June, 15.9% average regulatory
capital ratio)
Growth largely relying on external factors … Share of nominal exports on GDP at 80% in 2010 84% of exports concentrated on the EU-27 in 2010
(two predominant partners: Germany 32% and Slovakia 9%) Absence of major macroeconomic imbalances - current
account worsened to 3.8% of GDP in 2010 Substantial foreign ownership following high FDI inflows
... and on the cyclical industry sectors Industry sectors represents 30% of GDP (vs. 22% in Germany
and 12% in France) Highly cyclical (predominant car industry and machinery)
Share in GDP in %
0.0
5.0
10.0
15.0
20.0
25.0
30.0
35.0
Agriculture,hunting, forestry &
fishing
Industry Construction Trade, transport &communi-
cationservices
Business activities &financial services
Czech Republic Euro area
page 4MFF UK – March 9, 2012
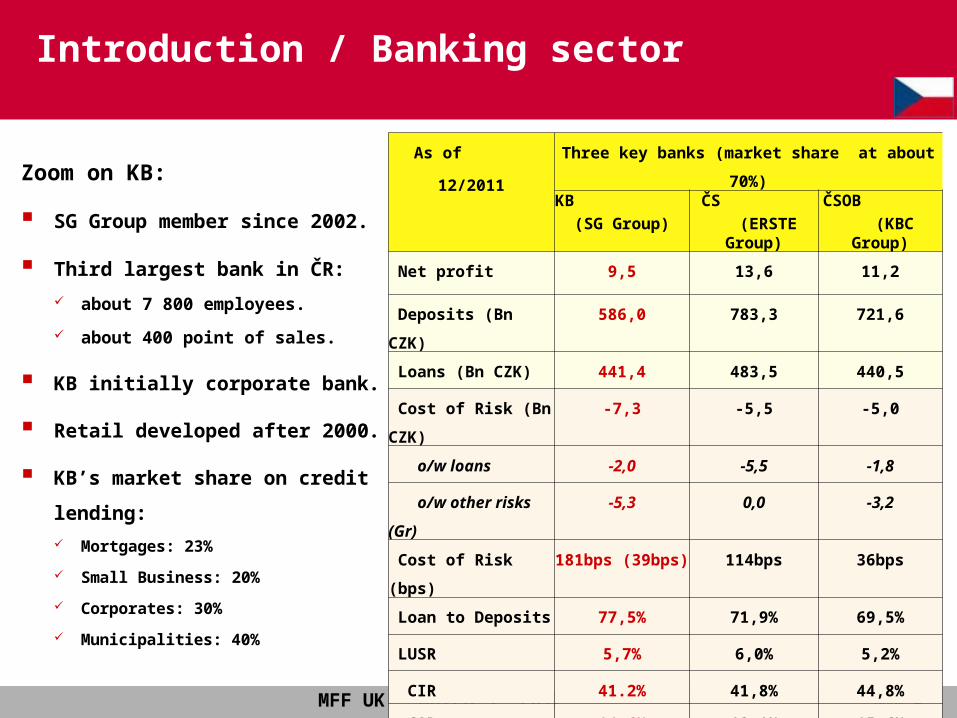
Zoom on KB:
SG Group member since 2002.
Third largest bank in ČR:
about 7 800 employees.
about 400 point of sales.
KB initially corporate bank.
Retail developed after 2000.
KB’s market share on credit lending: Mortgages: 23%
Small Business: 20%
Corporates: 30%
Municipalities: 40%
Introduction / Banking sector
As of
12/2011
Three key banks (market share at about 70%)
KB (SG Group)
ČS (ERSTE Group)
ČSOB (KBC Group)
Net profit 9,5 13,6 11,2
Deposits (Bn CZK) 586,0 783,3 721,6
Loans (Bn CZK) 441,4 483,5 440,5
Cost of Risk (Bn CZK) -7,3 -5,5 -5,0
o/w loans -2,0 -5,5 -1,8
o/w other risks (Gr) -5,3 0,0 -3,2
Cost of Risk (bps) 181bps (39bps) 114bps 36bps
Loan to Deposits 77,5% 71,9% 69,5%
LUSR 5,7% 6,0% 5,2%
CIR 41.2% 41,8% 44,8%
CAR 14,6% 13,1% 15,6%
ROE 12,3% 18,2% 17,3%
page 5MFF UK – March 9, 2012
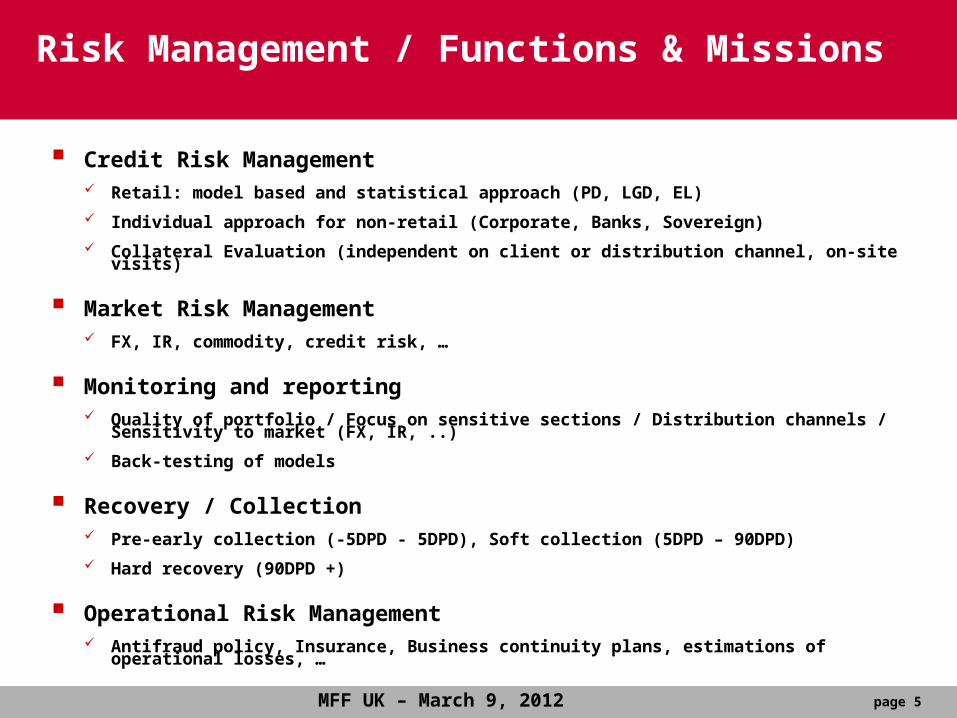
Risk Management / Functions & Missions
Credit Risk Management Retail: model based and statistical approach (PD, LGD, EL) Individual approach for non-retail (Corporate, Banks, Sovereign) Collateral Evaluation (independent on client or distribution channel, on-site visits)
Market Risk Management FX, IR, commodity, credit risk, …
Monitoring and reporting Quality of portfolio / Focus on sensitive sections / Distribution channels / Sensitivity to market (FX, IR, ..) Back-testing of models
Recovery / Collection Pre-early collection (-5DPD - 5DPD), Soft collection (5DPD – 90DPD) Hard recovery (90DPD +)
Operational Risk Management Antifraud policy, Insurance, Business continuity plans, estimations of operational losses, …
page 6MFF UK – March 9, 2012
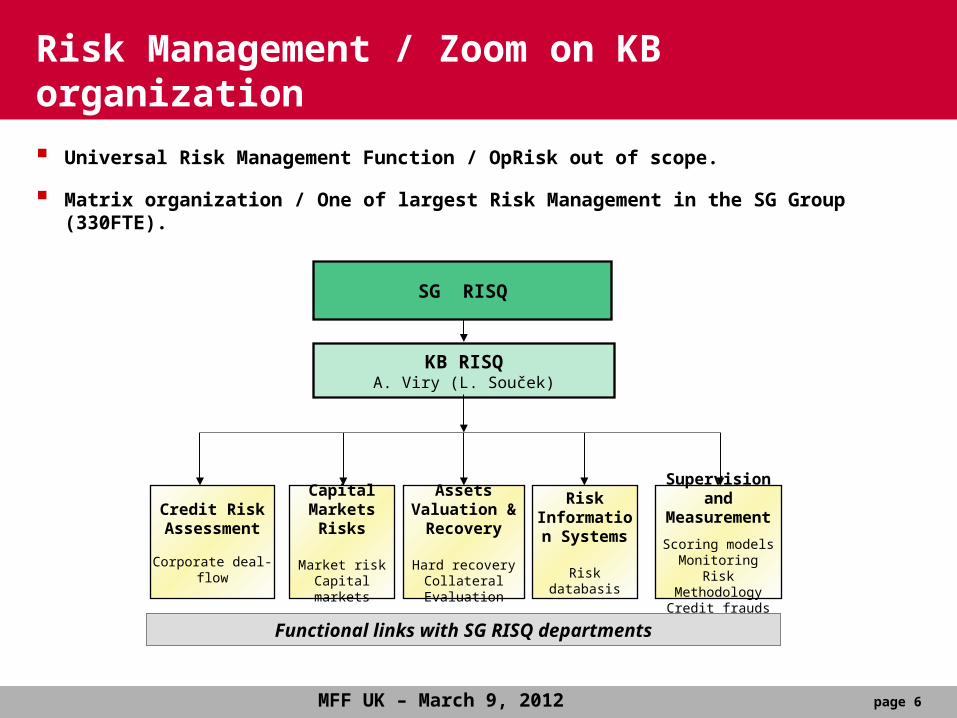
Supervision and Measurement
Scoring modelsMonitoring
Risk MethodologyCredit frauds
Credit Risk Assessment
Corporate deal-flow
Capital Markets
Risks
Market riskCapital markets
Assets Valuation & Recovery
Hard recoveryCollateral Evaluation
Risk Information
Systems
Risk databasis
SG RISQ
Functional links with SG RISQ departments
KB RISQA. Viry (L. Souček)
Risk Management / Zoom on KB organization
Universal Risk Management Function / OpRisk out of scope.
Matrix organization / One of largest Risk Management in the SG Group (330FTE).
page 7MFF UK – March 9, 2012
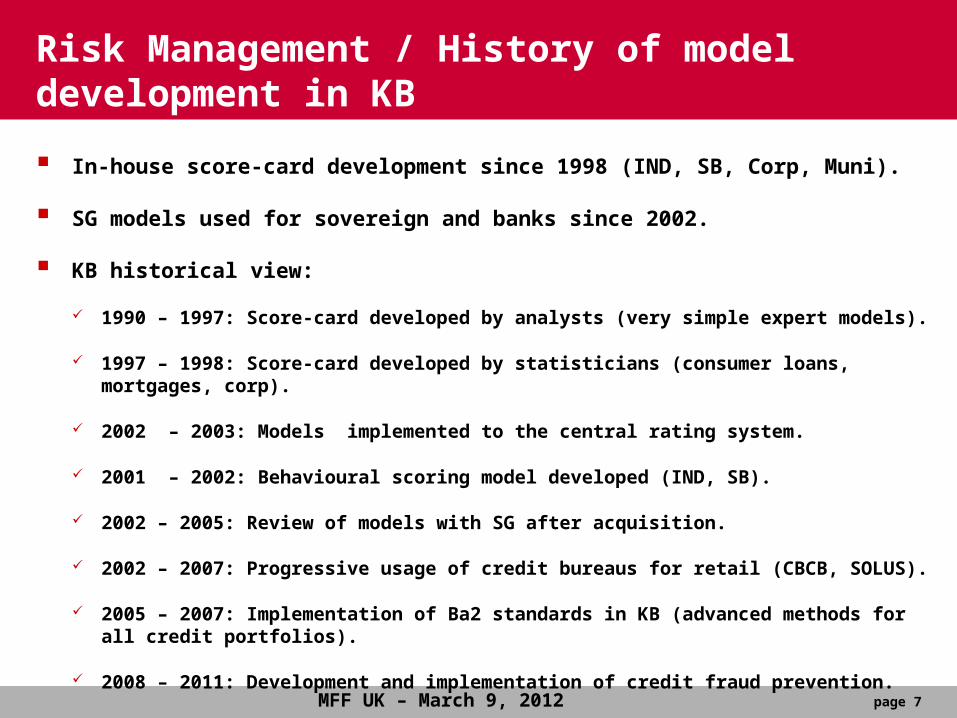
In-house score-card development since 1998 (IND, SB, Corp, Muni).
SG models used for sovereign and banks since 2002.
KB historical view:
1990 – 1997: Score-card developed by analysts (very simple expert models).
1997 – 1998: Score-card developed by statisticians (consumer loans, mortgages, corp).
2002 – 2003: Models implemented to the central rating system.
2001 – 2002: Behavioural scoring model developed (IND, SB).
2002 – 2005: Review of models with SG after acquisition.
2002 – 2007: Progressive usage of credit bureaus for retail (CBCB, SOLUS).
2005 – 2007: Implementation of Ba2 standards in KB (advanced methods for all credit portfolios).
2008 – 2011: Development and implementation of credit fraud prevention.
Risk Management / History of model development in KB
page 8MFF UK – March 9, 2012
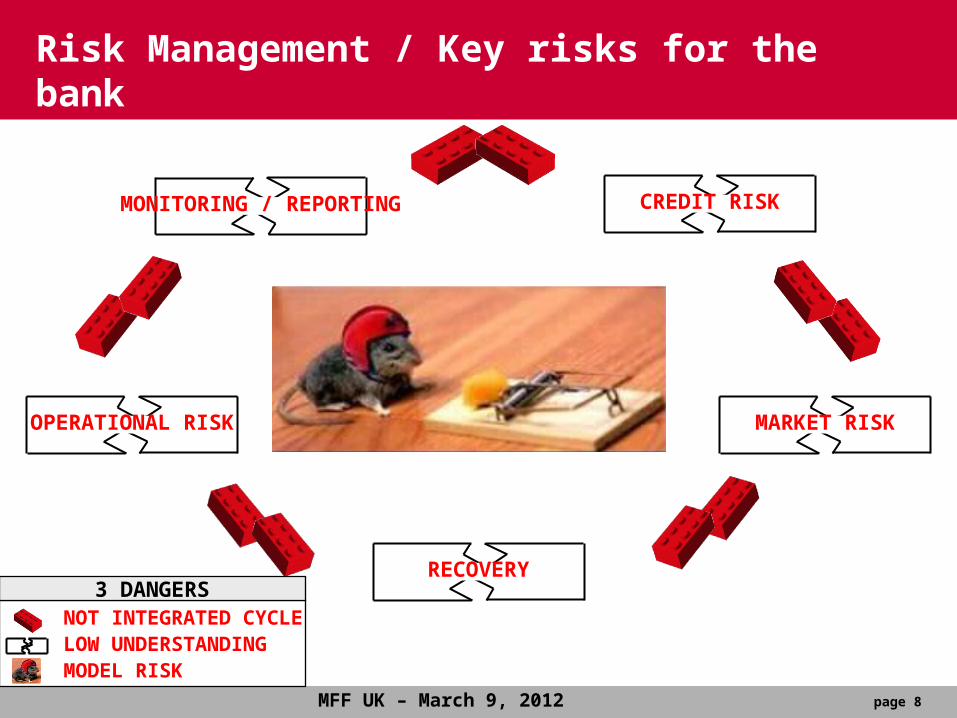
MONITORING / REPORTING CREDIT RISK
MARKET RISKOPERATIONAL RISK
RECOVERY
NOT INTEGRATED CYCLE LOW UNDERSTANDINGMODEL RISK
3 DANGERS
Risk Management / Key risks for the bank
page 9MFF UK – March 9, 2012
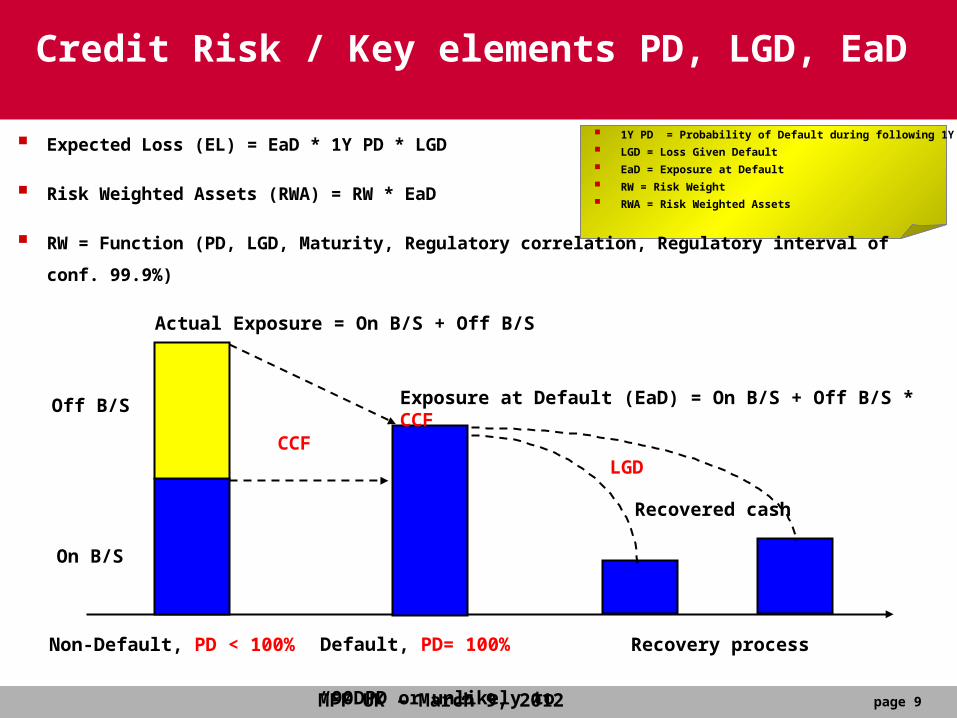
CCFLGD
Default, PD= 100% “90DPD or unlikely to pay”
Off B/S
On B/S
Recovered cash
Actual Exposure = On B/S + Off B/S
Exposure at Default (EaD) = On B/S + Off B/S * CCF
Recovery processNon-Default, PD < 100%
Credit Risk / Key elements PD, LGD, EaD
Expected Loss (EL) = EaD * 1Y PD * LGD
Risk Weighted Assets (RWA) = RW * EaD
RW = Function (PD, LGD, Maturity, Regulatory correlation, Regulatory interval of conf. 99.9%)
1Y PD = Probability of Default during following 1Y
LGD = Loss Given Default
EaD = Exposure at Default
RW = Risk Weight
RWA = Risk Weighted Assets
page 10MFF UK – March 9, 2012
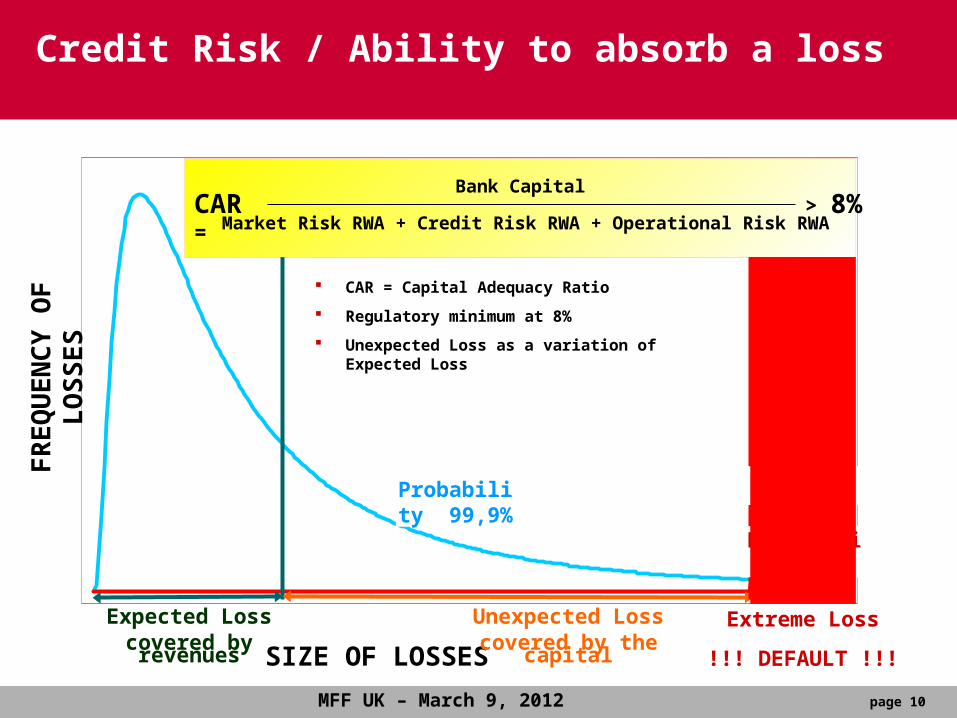
Probability 99,9%
Probability 0,1%
Stress Testing
SIZE OF LOSSES
FREQ
UEN
CY O
F LO
SSES
Expected Losscovered by revenues
Unexpected Losscovered by the capital
Extreme Loss
!!! DEFAULT !!!
Bank Capital
Market Risk RWA + Credit Risk RWA + Operational Risk RWA> 8%CAR =
CAR = Capital Adequacy Ratio
Regulatory minimum at 8%
Unexpected Loss as a variation of Expected Loss
Credit Risk / Ability to absorb a loss
page 11MFF UK – March 9, 2012
10%
15%
20%
25%
30%
35%
40%
45%
50%
55%
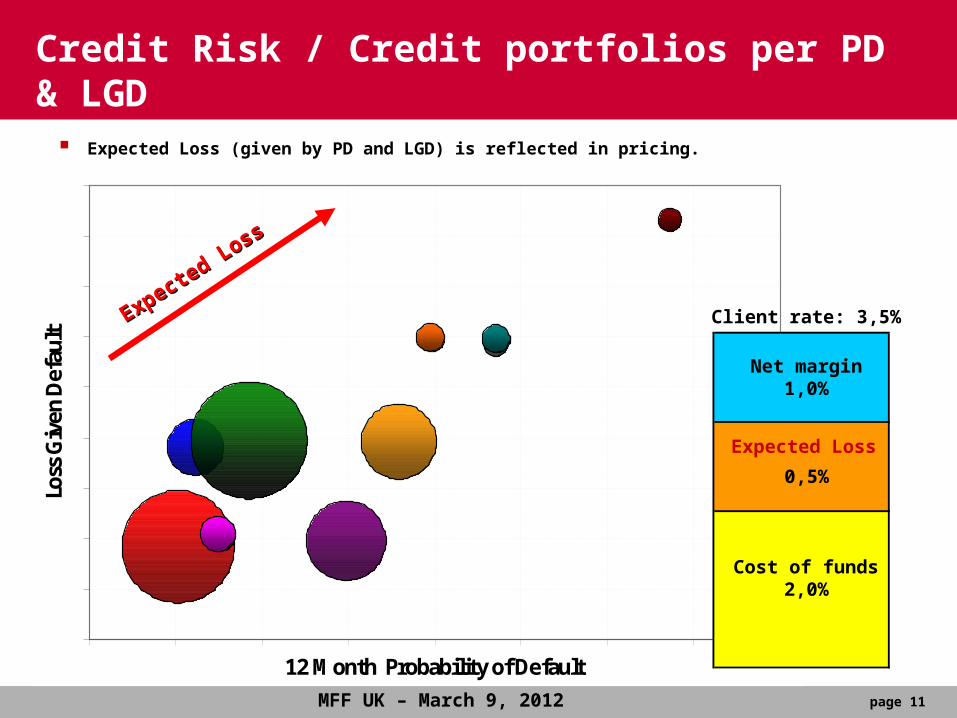
-1% 0% 1% 2% 3% 4% 5% 6% 7%12 Month Probability of Default
Loss
Giv
en D
efau
lt
Sovereigns
Large corporates
Banks
RE Developers
SME
PSE
Small Business
Project finance
Residential mortgages
Consumer loansCredit Cards
Credit Risk / Credit portfolios per PD & LGD
Expected Loss
Expected Loss
Client rate: 3,5%
Net margin1,0%
Expected Loss
0,5%
Cost of funds2,0%
Expected Loss (given by PD and LGD) is reflected in pricing.
page 12MFF UK – March 9, 2012
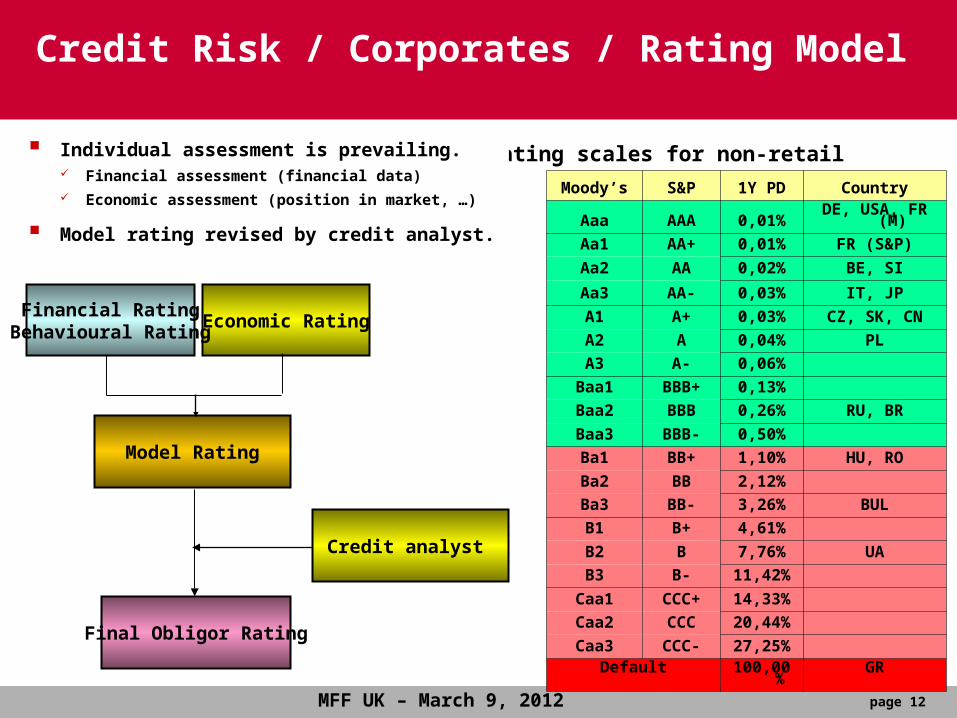
Economic RatingFinancial RatingBehavioural Rating
Model Rating
Final Obligor Rating
Credit analyst
Credit Risk / Corporates / Rating Model
Moody’s S&P 1Y PD CountryAaa AAA 0,01% DE, USA, FR (M)Aa1 AA+ 0,01% FR (S&P)Aa2 AA 0,02% BE, SIAa3 AA- 0,03% IT, JPA1 A+ 0,03% CZ, SK, CNA2 A 0,04% PL
A3 A- 0,06%
Baa1 BBB+ 0,13%Baa2 BBB 0,26% RU, BR
Baa3 BBB- 0,50%Ba1 BB+ 1,10% HU, RO
Ba2 BB 2,12%Ba3 BB- 3,26% BUL
B1 B+ 4,61%B2 B 7,76% UA
B3 B- 11,42%
Caa1 CCC+ 14,33%
Caa2 CCC 20,44%
Caa3 CCC- 27,25%Default 100,00% GR
Rating scales for non-retail Individual assessment is prevailing. Financial assessment (financial data) Economic assessment (position in market, …)
Model rating revised by credit analyst.
page 13MFF UK – March 9, 2012
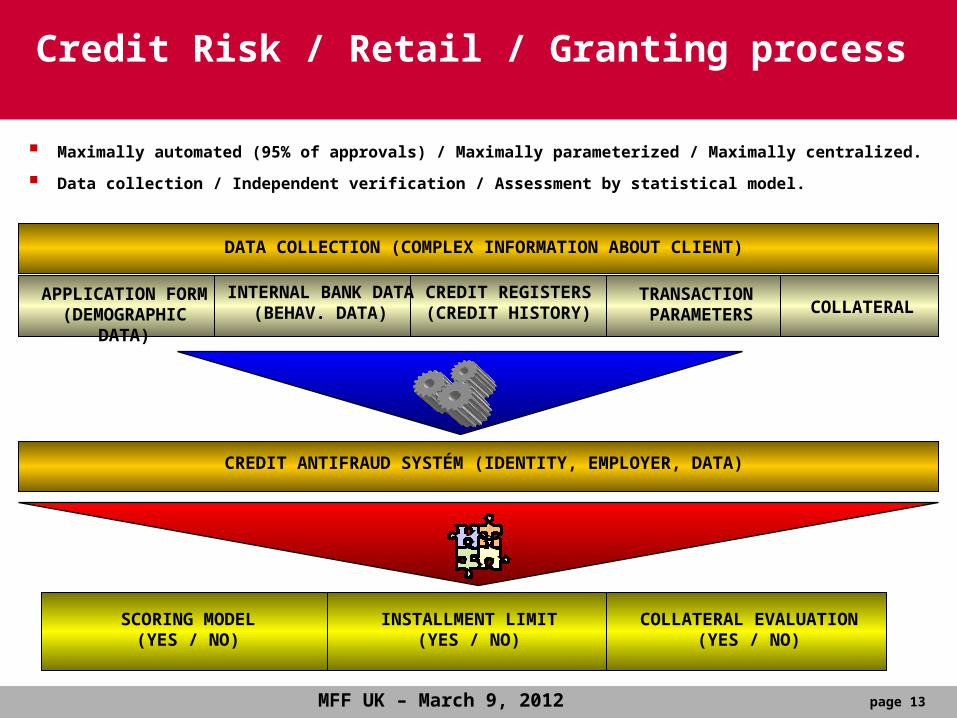
SCORING MODEL(YES / NO)
DATA COLLECTION (COMPLEX INFORMATION ABOUT CLIENT)
APPLICATION FORM(DEMOGRAPHIC DATA)
CREDIT REGISTERS(CREDIT HISTORY)
INTERNAL BANK DATA(BEHAV. DATA)
TRANSACTION PARAMETERS
INSTALLMENT LIMIT(YES / NO)
COLLATERAL EVALUATION(YES / NO)
CREDIT ANTIFRAUD SYSTÉM (IDENTITY, EMPLOYER, DATA)
COLLATERAL
Credit Risk / Retail / Granting process
Maximally automated (95% of approvals) / Maximally parameterized / Maximally centralized.
Data collection / Independent verification / Assessment by statistical model.
page 14MFF UK – March 9, 2012
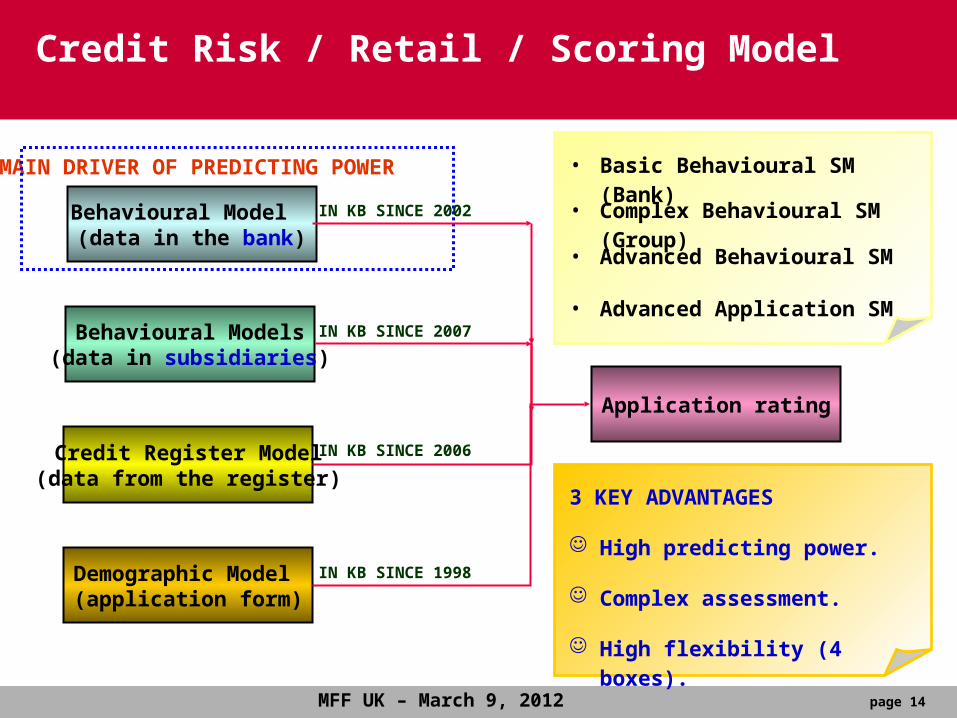
Demographic Model (application form)
Credit Register Model(data from the register)
Behavioural Model (data in the bank)
Application rating
Behavioural Models(data in subsidiaries)
MAIN DRIVER OF PREDICTING POWER • Basic Behavioural SM (Bank)
• Complex Behavioural SM (Group)
• Advanced Application SM
• Advanced Behavioural SM
3 KEY ADVANTAGES
High predicting power.
Complex assessment.
High flexibility (4 boxes).
IN KB SINCE 2002
IN KB SINCE 2007
IN KB SINCE 2006
IN KB SINCE 1998
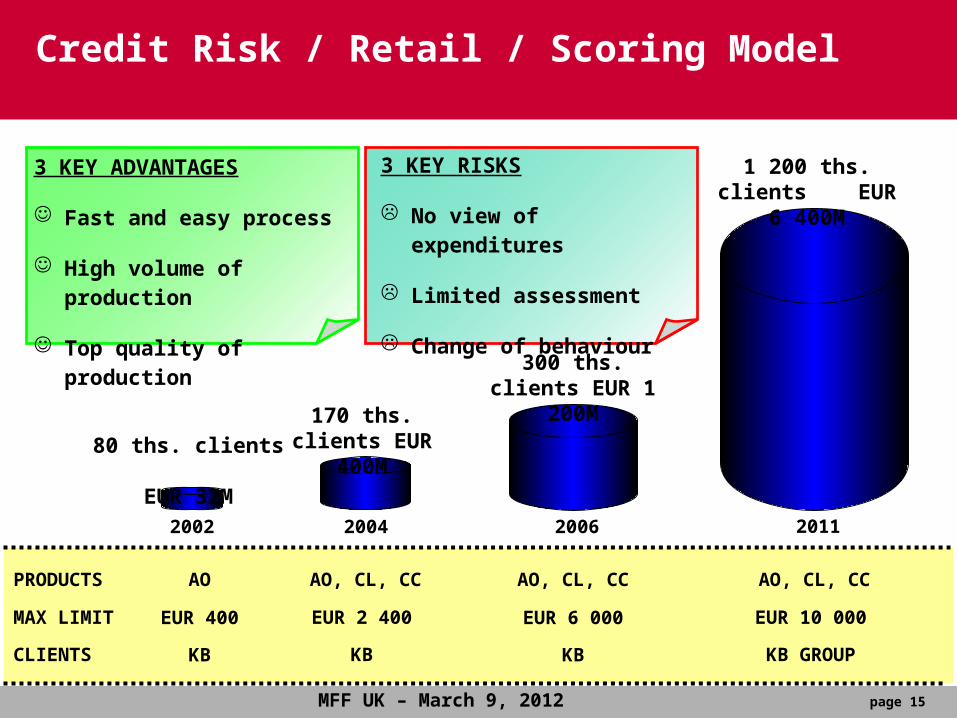
Credit Risk / Retail / Scoring Model
page 15MFF UK – March 9, 2012
1 200 ths. clients EUR 6 400M
300 ths. clients EUR 1 200M
80 ths. clients EUR 32M
170 ths. clients EUR 400M
2002 201120062004
AO AO, CL, CCAO, CL, CCAO, CL, CCPRODUCTS
MAX LIMIT EUR 400 EUR 10 000EUR 6 000EUR 2 400
CLIENTS KB KB GROUPKBKB
3 KEY ADVANTAGES
Fast and easy process
High volume of production
Top quality of production
3 KEY RISKS
No view of expenditures
Limited assessment
Change of behaviour
Credit Risk / Retail / Scoring Model
page 16MFF UK – March 9, 2012
CONTACT
RNDr. Ing. Leoš Souček
Deputy Head of Risk Management
Komerční banka, a.s.
Tel: +420 222 435 141
Email: [email protected]