Embed Size (px)
Citation preview
N E W T H I N K I N G
Risk Managed EquityA Dynamic Approach to Capturing Asymmetric Returns
In the long run, equities have proven to be one of the most effective investment instruments to grow capital.
From 1988 to 2018, the S&P 500 delivered a 10.6% annualized return. However, equities experience higher return volatility and greater risk of loss compared to less risky assets like bonds. For the S&P 500’s annualized 10.6% return over the past 30 years, investors experienced an annualized volatility (standard deviation of returns) of 17.3%. At one stage, during the Great Financial Crisis of 2008, the S&P 500 lost 55% from its previous peak level.
TDAM New Thinking | Risk Managed Equity: A Dynamic Approach to Capturing Asymmetric Returns PAGE 2
Investors have recently enjoyed strong equity returns paired with modest volatility for a length of time that has few historical precedents. The economic expansion of developed economies has been robust and current conditions remain favorable. Yet, if history offers any guidance, market complacency is rarely an advisable approach. From 1928 to date, there have been 13 bull markets, lasting an average of 5.6 years1. Market corrections that followed such bull runs averaged roughly 1.5 years and averaged a cumulative loss of close to 40%. At the time of writing, the current bull market is challenging records for the longest in history. It is approaching 10 years in length, and has
thus far been resilient to rising rates, geopolitical concerns and a brewing trade war.
Risks tend to increase during the late market cycle phase, or when geopolitical events become contagious. Equity prices and macro-economic conditions cannot improve forever. They need a periodic correction that may be substantial and could last several years. When market cycles finally turn, significant corrections can leave investors nursing substantial losses and capital-constrained; meaning they are unable to shift their portfolios to swing at the proverbial ‘fat pitch’ when it comes. Investors need a strategy or tool that can limit the drawdowns associated with corrections and position portfolios for a rapid rebound.
TD Asset Management Inc. (TDAM) has devoted significant research to the development of such a tool. These efforts led to the September 2015 launch of the Risk Managed Equities (RME) suite of investment solutions. Our RME strategy invests in equities and uses a dynamic approach to equity options to reduce return volatility and mitigate downside risk. The option structure allows RME to deliver an asymmetric return profile; the strategy participates during market rallies and is designed to provide strong downside resistance during weaker market environments.
The U.S. RME fund is implemented using the S&P 500 Index and its options, while the Global RME fund uses both the S&P500 and EAFE indices, taking the approximate regional weight distribution in the MSCI
World Index. TDAM employs a dynamic currency hedging method to limit currency-related volatility. Both funds have exhibited upside participation in the mostly bullish market from their inception (September 2015) to date. The two funds’ performance and realized volatility figures are provided in the appendix.
This paper describes how the RME strategy works. We discuss why RME could be a timely solution for investors concerned about late-market cycle corrections. We further aim to demonstrate that due to the strategy’s dynamic portfolio construction and asymmetric return focus, it could deliver attractive long-term outcomes compared to other equity approaches. Therefore it warrants considering whether RME deserves a long-term allocation in investors’ strategic asset mix.
1 Source: Bloomberg Finance L.P. and TDAM. S&P 500 Index data from December 31, 1927 onwards. Bull markets defined as the period from the previous cycle low to the following market high, while a bear market occurrence is defined by the S&P 500 index closing at least 20% down from the previous high close.
Risk Managed Equity Highlights Target 2/3rds Upside Capture Over Long Term
• Long equity exposure
• Tactical call writing to exploit volatility spikes and avoid selling “bargain priced” volatility
• Dynamic currency hedging
Target Downside Capture < 50% Over Long Term
• Put protection
• Premium earned from calls and put writing
• Laddered maturities smooth return experience
TDAM New Thinking | Risk Managed Equity: A Dynamic Approach to Capturing Asymmetric Returns PAGE 3
TDAM’s Risk Managed Equities (RME) Strategy
Strategy Overview: Options ApproachRME is designed around the following four principals related to equity and equity options markets:
1. Markets tends to rise most of the time
2. The market rise are typically more gradual, but the drops are often much sharper
3. Equity volatility (especially in the short expiry options) rises during periods of market weakness
4. Large market corrections (defined here as yearly losses of 10% or more) are less frequent than the popular perception. The option market pays much more dearly for ‘crash protection’ than historical evidence suggests it should.
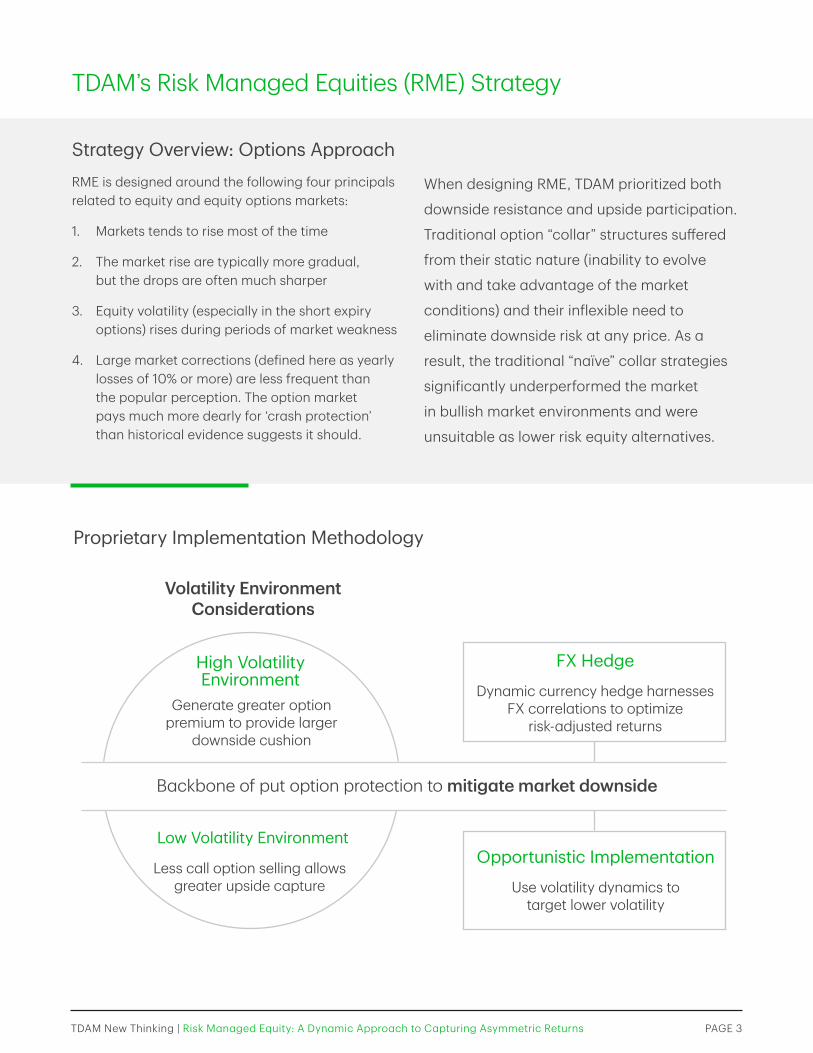
Proprietary Implementation Methodology
Volatility Environment Considerations
Generate greater option premium to provide larger
downside cushion
Backbone of put option protection to mitigate market downside
Less call option selling allows greater upside capture
High Volatility Environment
FX Hedge
Dynamic currency hedge harnesses FX correlations to optimize
risk-adjusted returns
Opportunistic Implementation
Use volatility dynamics to target lower volatility
Low Volatility Environment
When designing RME, TDAM prioritized both
downside resistance and upside participation.
Traditional option “collar” structures suffered
from their static nature (inability to evolve
with and take advantage of the market
conditions) and their inflexible need to
eliminate downside risk at any price. As a
result, the traditional “naïve” collar strategies
significantly underperformed the market
in bullish market environments and were
unsuitable as lower risk equity alternatives.
TDAM New Thinking | Risk Managed Equity: A Dynamic Approach to Capturing Asymmetric Returns PAGE 4
TDAM’s RME Strategy is a dynamic version of a collar strategy. It consists of buying equities (principle #1), selling shorter expiry call options (principle #3) and buying longer expiry put spreads to protect against downside risk (principles #2 and 4). Writing call options generates premium while their out-of-the-moneyness allows for upside participation. Put spreads provide substantial downside resistance. A put spread consists of a long position in the put option and a short position of the deeper out-of-the-money put option. The second put is sold to generate premium utilizing the expensive crash protection price arising from the systematic crash
fears. The put spread is laddered evenly to expiries of up to 18 months at any given time.
This results in a strategy that participates in market rallies. In strong bull market environments, RME, by its very design, will participate but typically underperforms the market as short call positions may offset the market rally beyond their strike levels. In the case of a weaker market environment, RME is expected to post downside resistance from the put spreads, as well as harvesting the short call option premiums. Call premiums are richer in volatile, weaker markets like 2001 - 2003 and 2008/2009, thereby reducing the strategy’s losses in down markets.
Strategy Overview: Currency Risk ManagementTDAM offers a currency hedging overlay for its Canadian clients. This is not a passive 100% hedge of US currency. USD/CAD has exhibited a long-term negative correlation to the US equity market, implying that a degree of unhedged USD has historically reduced risk for CAD-denominated investors. As an illustration, you may anecdotally recall that, as equity markets fell precipitously in the fall of 2008, the Canadian dollar dramatically devalued versus the US dollar. Canadian investors with a 100%
USDCAD hedge were doubly hit by both negative equity returns on their USD-denominated holdings as well as a missed opportunity to capitalize on the flight to quality that saw rapid USD appreciation against CAD during this period. TDAM’s analysis suggests 50% as an optimal target currency hedge ratio. Both RME funds have a 50% target currency hedge ratio, with an allowance to take advantage of extreme currency moves and pricing by adjusting this ratio in a band around the target.
1 Source: TDAM. Data as of June 30, 2018. Please see important Disclosures in Disclosures section.
Core Requirements for a Risk Managed Equity Manager
Dynamic Process with a disciplined risk focus
Deep, experienced team for continuous research and execution success.
Risk Management Oversight – over 25 people dedicated to ongoing, in-depth monitoring of TDAM’s investment products
Long-Term Commitment – With a derivatives book of over $38 billion,1 TDAM is committed to investing in the people and technology required to grow our leading market position
TDAM New Thinking | Risk Managed Equity: A Dynamic Approach to Capturing Asymmetric Returns PAGE 5
In the case of a weaker market environment, RME is expected to post downside resistance from the put spreads, as well as harvesting the short call option premiums.
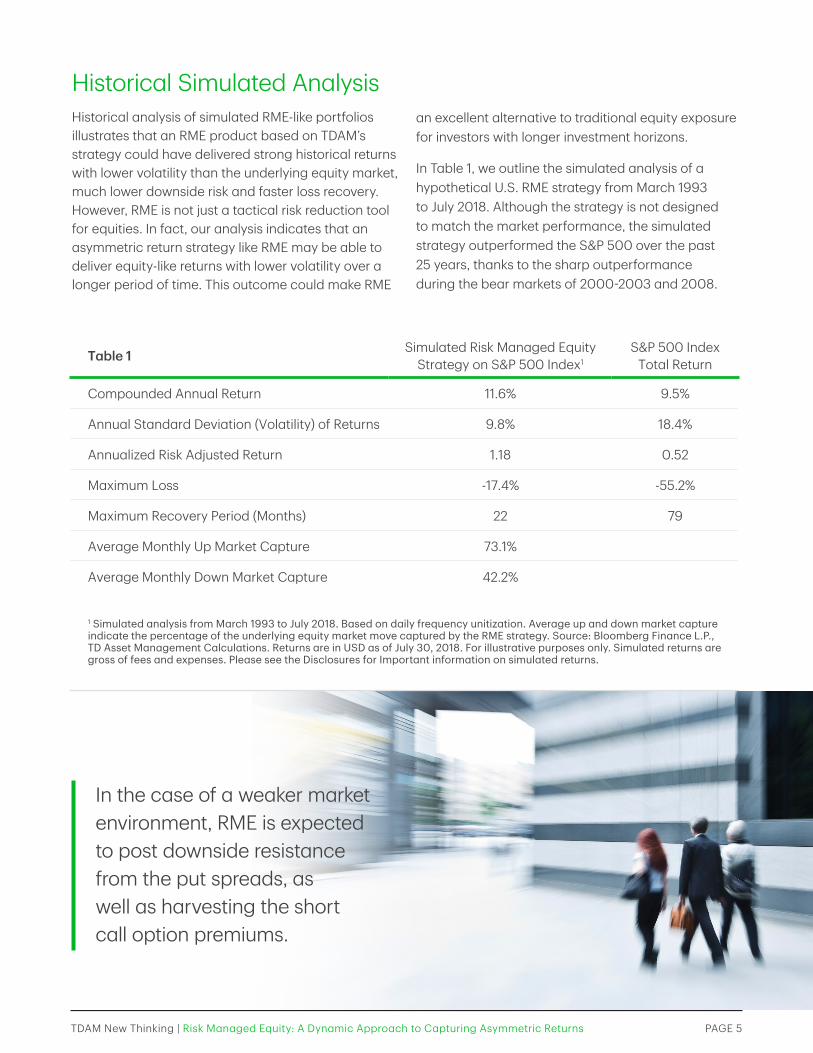
Historical Simulated AnalysisHistorical analysis of simulated RME-like portfolios illustrates that an RME product based on TDAM’s strategy could have delivered strong historical returns with lower volatility than the underlying equity market, much lower downside risk and faster loss recovery. However, RME is not just a tactical risk reduction tool for equities. In fact, our analysis indicates that an asymmetric return strategy like RME may be able to deliver equity-like returns with lower volatility over a longer period of time. This outcome could make RME
an excellent alternative to traditional equity exposure for investors with longer investment horizons.
In Table 1, we outline the simulated analysis of a hypothetical U.S. RME strategy from March 1993 to July 2018. Although the strategy is not designed to match the market performance, the simulated strategy outperformed the S&P 500 over the past 25 years, thanks to the sharp outperformance during the bear markets of 2000-2003 and 2008.
Table 1 Simulated Risk Managed Equity Strategy on S&P 500 Index1
S&P 500 Index Total Return
Compounded Annual Return 11.6% 9.5%
Annual Standard Deviation (Volatility) of Returns 9.8% 18.4%
Annualized Risk Adjusted Return 1.18 0.52
Maximum Loss -17.4% -55.2%
Maximum Recovery Period (Months) 22 79
Average Monthly Up Market Capture 73.1%
Average Monthly Down Market Capture 42.2%
1 Simulated analysis from March 1993 to July 2018. Based on daily frequency unitization. Average up and down market capture indicate the percentage of the underlying equity market move captured by the RME strategy. Source: Bloomberg Finance L.P., TD Asset Management Calculations. Returns are in USD as of July 30, 2018. For illustrative purposes only. Simulated returns are gross of fees and expenses. Please see the Disclosures for Important information on simulated returns.
TDAM New Thinking | Risk Managed Equity: A Dynamic Approach to Capturing Asymmetric Returns PAGE 6
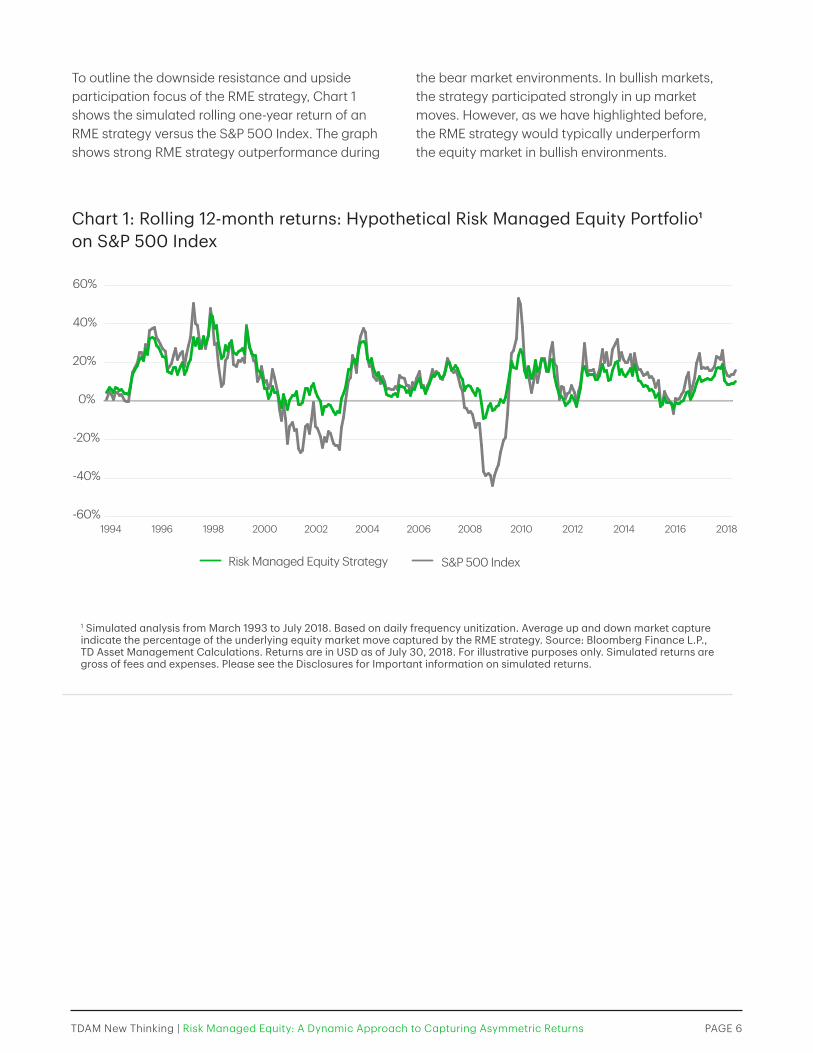
To outline the downside resistance and upside participation focus of the RME strategy, Chart 1 shows the simulated rolling one-year return of an RME strategy versus the S&P 500 Index. The graph shows strong RME strategy outperformance during
the bear market environments. In bullish markets, the strategy participated strongly in up market moves. However, as we have highlighted before, the RME strategy would typically underperform the equity market in bullish environments.
1 Simulated analysis from March 1993 to July 2018. Based on daily frequency unitization. Average up and down market capture indicate the percentage of the underlying equity market move captured by the RME strategy. Source: Bloomberg Finance L.P., TD Asset Management Calculations. Returns are in USD as of July 30, 2018. For illustrative purposes only. Simulated returns are gross of fees and expenses. Please see the Disclosures for Important information on simulated returns.
Chart 1: Rolling 12-month returns: Hypothetical Risk Managed Equity Portfolio1 on S&P 500 Index
Risk Managed Equity Strategy S&P 500 Index
-60%
-40%
-20%
0%
20%
40%
60%
1994 1996 1998 2000 2002 2004 2006 2008 2010 2012 2014 2016 2018
TDAM New Thinking | Risk Managed Equity: A Dynamic Approach to Capturing Asymmetric Returns PAGE 7
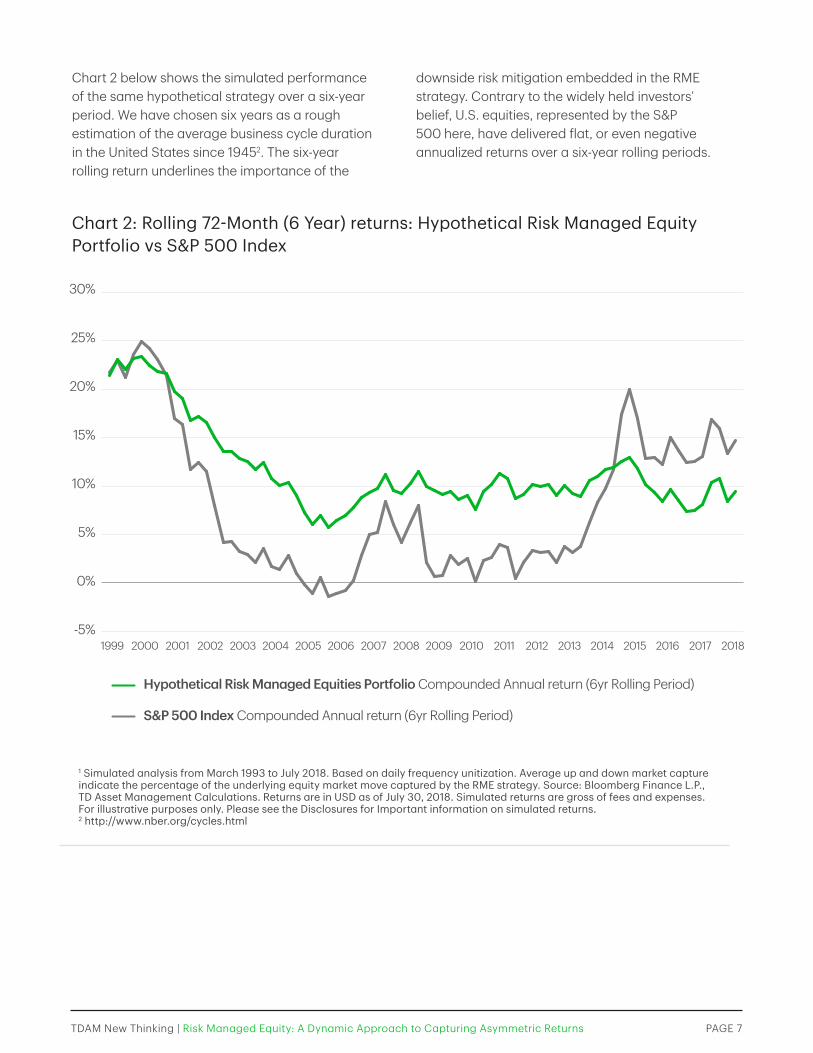
Chart 2 below shows the simulated performance of the same hypothetical strategy over a six-year period. We have chosen six years as a rough estimation of the average business cycle duration in the United States since 19452. The six-year rolling return underlines the importance of the
downside risk mitigation embedded in the RME strategy. Contrary to the widely held investors’ belief, U.S. equities, represented by the S&P 500 here, have delivered flat, or even negative annualized returns over a six-year rolling periods.
Chart 2: Rolling 72-Month (6 Year) returns: Hypothetical Risk Managed Equity Portfolio vs S&P 500 Index
1 Simulated analysis from March 1993 to July 2018. Based on daily frequency unitization. Average up and down market capture indicate the percentage of the underlying equity market move captured by the RME strategy. Source: Bloomberg Finance L.P., TD Asset Management Calculations. Returns are in USD as of July 30, 2018. Simulated returns are gross of fees and expenses. For illustrative purposes only. Please see the Disclosures for Important information on simulated returns.2 http://www.nber.org/cycles.html
0%
5%
-5%
15%
20%
25%
30%
10%
1999 2006 2007 2008 20092000 20022001 2003 2004 2005 2010 2011 20132012 2014 2015 2016 20182017
Hypothetical Risk Managed Equities Portfolio Compounded Annual return (6yr Rolling Period)
S&P 500 Index Compounded Annual return (6yr Rolling Period)
TDAM New Thinking | Risk Managed Equity: A Dynamic Approach to Capturing Asymmetric Returns PAGE 8
Table 2: S&P 500 Index vs Simulated Asymmetric Return Portfolios from 1998 to 2018
S&P 500 Index Simulated 70% Up / 40% Down Portfolio
Simulated 70% Up / 50% Down Portfolio
Average Annual Return 7.60% 10.20% 8.60%
Annual Standard Deviation (Volatility) of Returns 14.80% 8.10% 8.90%
Annualized Risk Adjusted Return 0.52 1.25 0.97
Source: TDAM, Bloomberg Finance L.P. Data from January 1, 1998 to July 30, 2018. Returns are in USD. Gross of any fees and expenses. For illustrative purposes only. Please see the Disclosures for Important information on simulated returns.
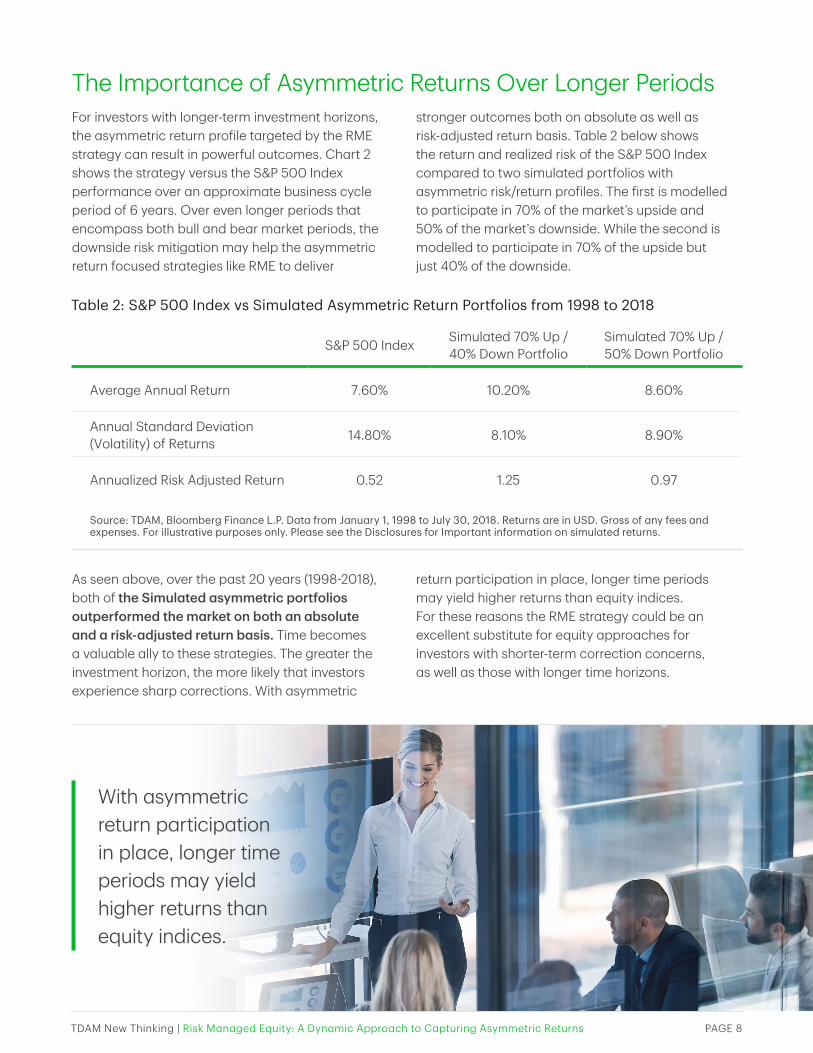
As seen above, over the past 20 years (1998-2018), both of the Simulated asymmetric portfolios outperformed the market on both an absolute and a risk-adjusted return basis. Time becomes a valuable ally to these strategies. The greater the investment horizon, the more likely that investors experience sharp corrections. With asymmetric
return participation in place, longer time periods may yield higher returns than equity indices. For these reasons the RME strategy could be an excellent substitute for equity approaches for investors with shorter-term correction concerns, as well as those with longer time horizons.
The Importance of Asymmetric Returns Over Longer PeriodsFor investors with longer-term investment horizons, the asymmetric return profile targeted by the RME strategy can result in powerful outcomes. Chart 2 shows the strategy versus the S&P 500 Index performance over an approximate business cycle period of 6 years. Over even longer periods that encompass both bull and bear market periods, the downside risk mitigation may help the asymmetric return focused strategies like RME to deliver
stronger outcomes both on absolute as well as risk-adjusted return basis. Table 2 below shows the return and realized risk of the S&P 500 Index compared to two simulated portfolios with asymmetric risk/return profiles. The first is modelled to participate in 70% of the market’s upside and 50% of the market’s downside. While the second is modelled to participate in 70% of the upside but just 40% of the downside.
With asymmetric return participation in place, longer time periods may yield higher returns than equity indices.
TDAM New Thinking | Risk Managed Equity: A Dynamic Approach to Capturing Asymmetric Returns PAGE 9
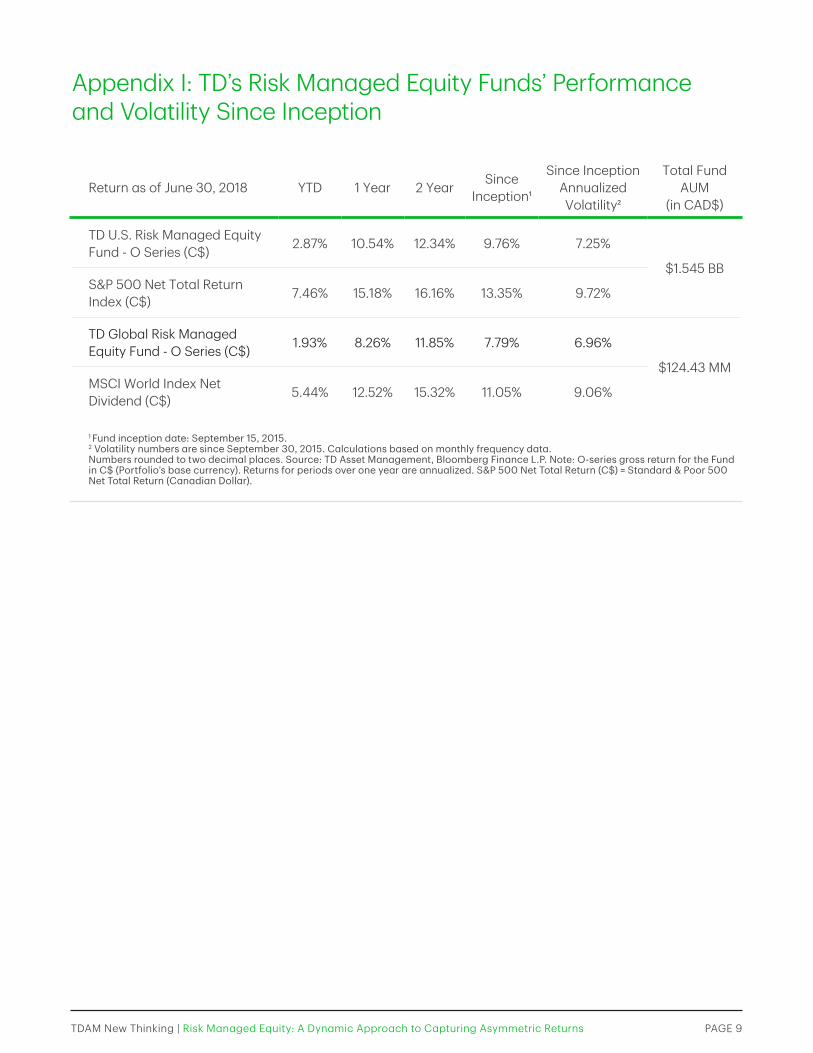
Return as of June 30, 2018 YTD 1 Year 2 Year Since Inception1
Since Inception Annualized Volatility2
Total Fund AUM
(in CAD$)
TD U.S. Risk Managed Equity Fund - O Series (C$) 2.87% 10.54% 12.34% 9.76% 7.25%
$1.545 BBS&P 500 Net Total Return Index (C$) 7.46% 15.18% 16.16% 13.35% 9.72%
TD Global Risk Managed Equity Fund - O Series (C$) 1.93% 8.26% 11.85% 7.79% 6.96%
$124.43 MMMSCI World Index Net Dividend (C$) 5.44% 12.52% 15.32% 11.05% 9.06%
1 Fund inception date: September 15, 2015.2 Volatility numbers are since September 30, 2015. Calculations based on monthly frequency data. Numbers rounded to two decimal places. Source: TD Asset Management, Bloomberg Finance L.P. Note: O-series gross return for the Fund in C$ (Portfolio’s base currency). Returns for periods over one year are annualized. S&P 500 Net Total Return (C$) = Standard & Poor 500 Net Total Return (Canadian Dollar).
Appendix I: TD’s Risk Managed Equity Funds’ Performance and Volatility Since Inception
The information contained herein has been provided by TD Asset Management Inc. and is for information purposes only. The information has been drawn from sources believed to be reliable. Graphs and charts are used for illustrative purposes only and do not reflect future values or future performance of any investment. The information does not provide financial, legal, tax or investment advice. Particular investment, tax, or trading strategies should be evaluated relative to each individual’s objectives and risk tolerance. Commissions, trailing commissions, management fees and expenses all may be associated with mutual fund investments. Please read the fund facts and prospectus, which contain detailed investment information, before investing. The indicated rates of return are the historical annual compounded total returns for the period indicated including changes in unit value and reinvestment of all distributions and do not take into account sales, redemption, distribution or optional charges or income taxes payable by any unitholder that would have reduced returns. Mutual funds are not guaranteed or insured, their values change frequently and past performance may not be repeated. Certain statements in this document may contain forward-looking statements (“FLS”) that are predictive in nature and may include words such as “expects”, “anticipates”, “intends”, “believes”, “estimates” and similar forward-looking expressions or negative versions thereof. FLS are based on current expectations and projections about future general economic, political and relevant market factors, such as interest and foreign exchange rates, equity and capital markets, the general business environment, assuming no changes to tax or other laws or government regulation or catastrophic events. Expectations and projections about future events are inherently subject to risks and uncertainties, which may be unforeseeable. Such expectations and projections may be incorrect in the future. FLS are not guarantees of future performance. Actual events could differ materially from those expressed or implied in any FLS. A number of important factors including those factors set out above can contribute to these digressions. You should avoid placing any reliance on FLS. The hypothetical performance information is shown for illustration purposes only and is not based on actual results, which may vary. Hypothetical performance information is subject to inherent risks and limitations, and is shown (gross of fees and expenses) and is calculated in US dollars. No representations are being made that any proposal will achieve returns similar to the hypothetical information shown. Investors should not take this example or the data included as an indication, assurance, estimate or forecast of future or actual results. The actual performance returns may differ materially from the information shown for reasons including, but not limited to investment restrictions and guidelines, fees, timing of trade execution, investment/reinvestment of cash flows, treatment of dividends, interest fees charged including performance fees, portfolio rebalancing, borrowing fees on shorts, swap fees, the extent of leverage used, any use of derivatives, and fluctuations in the market. TD Asset Management Inc., The Toronto-Dominion Bank and its affiliates and related entities are not liable for any errors or omissions in the information or for any loss or damage suffered. Simulated Risk Managed Equity Strategy returns are back-tested results based on a disciplined investment thesis that was rigorously implemented using data from Bloomberg beginning in March 1993. All historical performance was calculated using actual end of day securities prices and implied volatility at the time, incorporating conservative transactions costs, and did not involve any forward looking bias or data mining. The Black Scholes options pricing model was used to derive the price of the options that were used in the performance calculations. The analysis assumed no cash inflows or outflows during the period. Rebalancing occurred regularly to keep the portfolio fully invested. The synthetic performance information is shown for illustration purposes only and is not based on actual results, which may vary. Synthetic performance information is hypothetical and subject to inherent risks and limitations, and is shown gross of fees and are calculated in US dollars. No representations are being made that any proposal will achieve returns similar to the hypothetical information shown. Investors should not take this example or the data included as an indication, assurance, estimate or forecast of future or actual results. TD Mutual Funds and the TD Managed Assets Program Portfolios are managed by TD Asset Management Inc., a wholly-owned subsidiary of The Toronto-Dominion Bank, and are available through authorized dealers. Bloomberg and Bloomberg.com are trademarks and service marks of Bloomberg Finance L.P., a Delaware limited partnership, or its subsidiaries. All rights reserved. All trademarks are the property of their respective owners. ® The TD logo and other trade-marks are the property of The Toronto-Dominion Bank.
(1018) TDAM New Thinking | Risk Managed Equity: A Dynamic Approach to Capturing Asymmetric Returns