Embed Size (px)
Citation preview
Available online at www.sciencedirect.com
Acta de Investigación PsicológicaPsychological Research Records
Acta de Investigación Psicológica 7 (2017) 2606–2617www.psicologia.unam.mx/acta-de-investigacion-psicologica/
Original
Risk low math performance PISA 2012: Impact of assistance toEarly Childhood Education and other possible cognitive variables
Rendimiento bajo en matemáticas PISA 2012: impacto de la asistencia en educacióninfantil temprana y otras posibles variables cognitivas
Esperanza Bausela HerrerasUniversidad Pública de Navarra (UPNA), Área de Psicología Evolutiva y de la Educación, Campus de Arrosadia, C.P. 31006 Pamplona (Iruna),
Spain
Received 9 November 2016; accepted 14 February 2017Available online 28 March 2017
Abstract
Mathematics competencies are critical in the development of the individual. There are several variables that can predict poorperformance in this competition. These variables may be related to self-learner and teacher who instructs.Objective: Analyse the risk of poor performance depending on several variables: attending early childhood education, learningstrategies and strategies used by the teacher uses.Method: No experimental or ex post facto.Data: We used the database PISA 2012 for Spain provided by the Ministry of Education, Culture and Sport. The generated datasample consists of 25,313 young Spaniards of both sexes, aged 15 years, belonging to 902 schools that are distributed throughoutthe national territory of Spain.Dependent or endogenous variable: Performance in mathematics.Independent or exogenous variables: Different variables were considered: attendance and duration of Early Childhood Education,student learning strategies and teaching strategies.Analysis of data: Binary logistic regression.Results: It shows that the factor that has greater predictive capability of risk of underperformance is attending Early ChildhoodEducation [β = −.595; ρ < .001]. It is the variable that has more predictive capability of risk of all analysed.Discussion: There are variables that increase the risk and others that reduce this risk. It is possible to prevent low performancein Mathematics competencies, for example, we need to pursue a teaching of quality Early Childhood Education knowing theirlong-term benefits and not only ensure access to it for all children.© 2016 Universidad Nacional Autónoma de México, Facultad de Psicología. This is an open access article under the CC BY-NC-NDlicense (http://creativecommons.org/licenses/by-nc-nd/4.0/).
Keywords: PISA 2012; Early Childhood Education; Low performance in mathematics competencies; Student learning strategies; Teaching strategies
del individuo. Existen diversas variables que pueden predecir el bajoueden estar relacionadas con el auto-aprendiz o con el maestro que
Resumen
Las competencias matemáticas son críticas en el desarrollo
rendimiento en este tipo de competencias. Dichas variables p
imparte instrucción.E-mail address: [email protected]: http://www.unavarra.es/.Peer Review under the responsibility of Universidad Nacional Autónoma de México.
http://dx.doi.org/10.1016/j.aipprr.2017.02.0012007-4719/© 2016 Universidad Nacional Autónoma de México, Facultad de Psicología. This is an open access article under the CC BY-NC-NDlicense (http://creativecommons.org/licenses/by-nc-nd/4.0/).
OaMDdaVVeARtDtt©B
PE
I
IOobmCb
iwels
rdHL2pCcof2
E. Bausela Herreras / Acta de Investigación Psicológica 7 (2017) 2606–2617 2607
bjetivo: Analizar el riesgo de rendimiento bajo según diferentes variables: educación formal desde edad temprana, estrategias deprendizaje y estrategias que utiliza el maestro.étodo: No experimental o ex post facto.atos: Se utilizó la base de datos PISA 2012 para Espana, otorgada por el Ministerio de Educación, Cultura y Deporte. La muestrae datos generada consiste en 25313 jóvenes espanoles de ambos sexos, de 15 anos, pertenecientes a las 902 escuelas distribuidas
lo largo del territorio nacional de Espana.ariable dependiente: Rendimiento en matemáticas.ariable independiente: Diferentes variables fueron consideradas: asistencia y duración de la educación en edades tempranas,strategias de aprendizaje del estudiante y estrategias de ensenanza.nálisis de datos: Regresión binaria logística.esultados: Estos indican que el factor con mayor capacidad predictiva de rendimiento bajo es la educación formal en edades
empranas (B=–.595; p<.001). Es la variable que tiene mayor capacidad predictiva de todas las que se analizaron.iscusión: Existen variables que aumentan el riesgo y otras que lo disminuyen. Es posible prevenir el bajo rendimiento en compe-
encias asociadas a las matemáticas; por ejemplo, se necesita hacer énfasis en la ensenanza de calidad en la educación en edadesempranas sabiendo los beneficios de esto a largo plazo y no solo garantizar el acceso a esta para todos los ninos.
2016 Universidad Nacional Autónoma de México, Facultad de Psicología. Este es un artículo Open Access bajo la licencia CCY-NC-ND (http://creativecommons.org/licenses/by-nc-nd/4.0/).
alabras clave: PISA 2012; Educación a edad temprana; Bajo rendimiento en competencias matemáticas; Estrategias de aprendizaje del estudiante;strategias de ensenanza
ntroduction
The present paper will discuss the Programme fornternational Student Assessment (PISA) 2012 of therganisation for Economic Co-operation and Devel-pment (OECD) with respect to which factor has theest predictive capacity of low student performance inathematics in PISA 2012, either attendance in Earlyhildhood Education or strategies for using strategiesy the students themselves and by the teachers.
The focus of interest within the PISA frameworkn 2012 was based on mathematical competencies, forhich two thirds of that framework was dedicated to their
valuation, as was the case for the evaluation of readingiteracy skills in 2009 and, also, for the evaluation ofcientific skills in 2015.
There are various sources that have analysed theelationship between Early Childhood Education atten-ance and performance in later stages (see Arteaga,umpage, Reynolds, & Temple, 2014; Hindman, 2013;ehrl, Klucznioka, & Rossbachba, 2016; Sylva et al.,013; Temple & Reynolds, 2015). Particularly, for exam-le, the National Association for the Education of Younghildren (NAEYC) considers the Early Childhood Edu-
Further, with a focus on mathematical competences,studies indicate that difficulties in mathematics which aredetected in Secondary Education cannot be explained bya single factor, but are acquired in a cumulative processthat begins at a stage prior to formal education (Geary,Hamson, & Hoard, 2000). Several authors attribute dif-ficulties with mathematical competences pre-academicnumeracy skills acquired in early years (see Jordan,Glutting, & Ramineni, 2010). For example, Heckman(2006) analyses the effect of educational stimulationon the three stages of the evolutionary/educationalcycle, which are compulsory education, adolescence,and adulthood. That study concludes that early stimula-tion has greater predictive ability of non-cognitive skillsand cognitive stimulation that occur in later developmen-tal stages. Arteaga et al. (2014) and Lehrl et al. (2016)also provide evidence of long-term benefits that entailenrolment in Early Childhood Education. These benefitshave been observed in compulsory education after com-pletion of Early Childhood Education and also help toreduce any observed gap between this stage and furtherstages (Karoly, Kilburn, & Cannon, 2005).
Particularly, mathematical competencies have tradi-tionally been considered as basic skills, and the keys toacademic success (Bryant, Bryant, Gersten, Scammacca,
ation stage to be essential in supporting the developmentf mathematical competencies at an early age, especiallyor pupils who are at risk (see Cebolla Boado, 2011,012; Garrido & Cebolla Boado, 2010; Hindman, 2013).
& Chavez, 2008). Their success has been linked to sev-eral variables (Ahmed, Minnaert, Kuyper, & Van derWerf, 2012; Callejo & Vila, 2009; Chionh & Fraser,
tigació
2608 E. Bausela Herreras / Acta de Inves2009; Rosario et al., 2012; Sánchez, 2014). Particu-larly, early performance in mathematical competency isalso considered a highly predictive factor of subsequentperformance in mathematics (Grissmer et al., 2013;Jordan et al., 2010; Mazzocco & Thompson, 2005;Taskin & Tugrul, 2014).
The pre-primary education stage, under current reg-ulations in Spain (which establishes the minimumteaching requirements in the second cycle of Early Child-hood Education), serves children from birth to six yearsof age in order to contribute to their physical, emotional,social and intellectual development. It is organised intwo cycles of three years each: up to three years (whichis not free of charge but not compulsory) and from 3 to6 years (which is free of charge and not compulsory).
“Assistance with children’s education is associatedwith better academic performance later”, as noted bythe OECD in its report “Does Early Childhood Edu-cation arrive to those most in need?” (OECD, 2013a,2013b). The impact of early schooling on the later agesof children has been analysed in several publicationswithin the body of literature (see Lehrl et al., 2016).Thus, Lehrl et al. (2016) associate the high quality oftraining in Early Childhood Education with the devel-opment of children during the later school years, andsimply with mere attendance at this educational level.Attendance in Early Childhood Education is also modu-lated by other variables such as, for example, the familybackground of a child and their socioeconomic statuswithin the school (see Touron, Hernández, Morera, &Asencio, 2012), which is beyond the scope of this study.
According to the data itself MEC and OCDE (2013a),Spain obtained an average score of 484 points in math-ematics, which is 10 points below the OECD averageof 494 and 5 points below the European Union averageof 489, the difference with the former being statisticallysignificant, but not with the latter. The performance ofstudents in Spain is in the range of 481–488 points, witha confidence level of 95%.
The results for Spanish schools in mathematical com-petences in PISA 2012 indicate that 19.5% of studentshave a level of performance in this competition Level1 in PISA 2012 (MEC & OECD, 2013a,b). Level 1represents the lowest level of competence or “lowestperformers”, with scores in the range of 357.7–420.1.Pupils (or students) who are at this level know how torespond to questions that are related to familiar contexts,within which all relevant information is present and the
questions are clearly defined. More precisely, the pupilsare able to identify information and to perform rou-tine procedures following direct instruction in explicitsituations. Furthermore, they can perform actions thatn Psicológica 7 (2017) 2606–2617
are obvious and follow immediately from the presentedstimulus.
With regard to attendance in Early Childhood Edu-cation in Spain, the percentage of pupils who attend is94% (the take up rate of this scheme), which is very closeto the international average (93%) in PISA. 85% of stu-dents reported that they had attended for a duration ofmore than one year in Early Childhood Education, while8% reported that they had attended for a duration of lessthan one year.
Most of the available empirical evidence on this issuefocuses on analysing only the impact of early interven-tion on performance, without analysing the variablesof a cognitive nature that affect both the teaching andthe learning, and may be associated with performancein mathematical competences. In the present study, wefocus on analysing and comparing the risks that studentshave in poor performance regarding mathematical lit-eracy in PISA 2012, based on the attendance in EarlyChildhood Education and their use of strategies by thestudents themselves and by the teachers.
Identifying risk factors can assist in designing propo-sals that would reduce those risks and therefore wouldreduce the number of schoolchildren with low perfor-mance. The aim of this study is identify the factor thathas the best predictive ability of low performance inmathematical competencies.
Method
A quasi-experimental or an ex post facto descriptivedesign, based on a questionnaire, was developed by theOECD. In PISA 2012, there are three basic skills in Sec-ondary Education (Reading, Mathematics and Science)that are evaluated.
Data
In this research, the PISA 2012 database for Spainwas used, which is available on the Website of theMinistry of Education, Culture and Sport (2012, URL– http://www.mecd.gob.es/inee/Bases-de-datos.html,Date accessed: 28th August 2016). This questionnaireis applied in the final (fourth) year of SecondaryEducation.
The generated data sample consists of 25,313 youngSpaniards of both sexes, aged 15 years, belonging to902 schools that are distributed throughout the national
territory of Spain.As well as providing competency testing in Read-ing, Mathematics and Science, PISA 2012 also providesa very extensive set of information on the context of
E. Bausela Herreras / Acta de Investigación Psicológica 7 (2017) 2606–2617 2609
Attendancepreschooleducation
Underperforming (Level 1) inmathematical competencies
in PISA 2012
Learningstrategies
Student
Teachingstrategies
Teacher
Activecognition
Teacher directinstruction
Student orientFormative
assessment
Highere
Preschool
atical c
spWaeb
iLpopsoc
tta
V
gpbIc(it
education
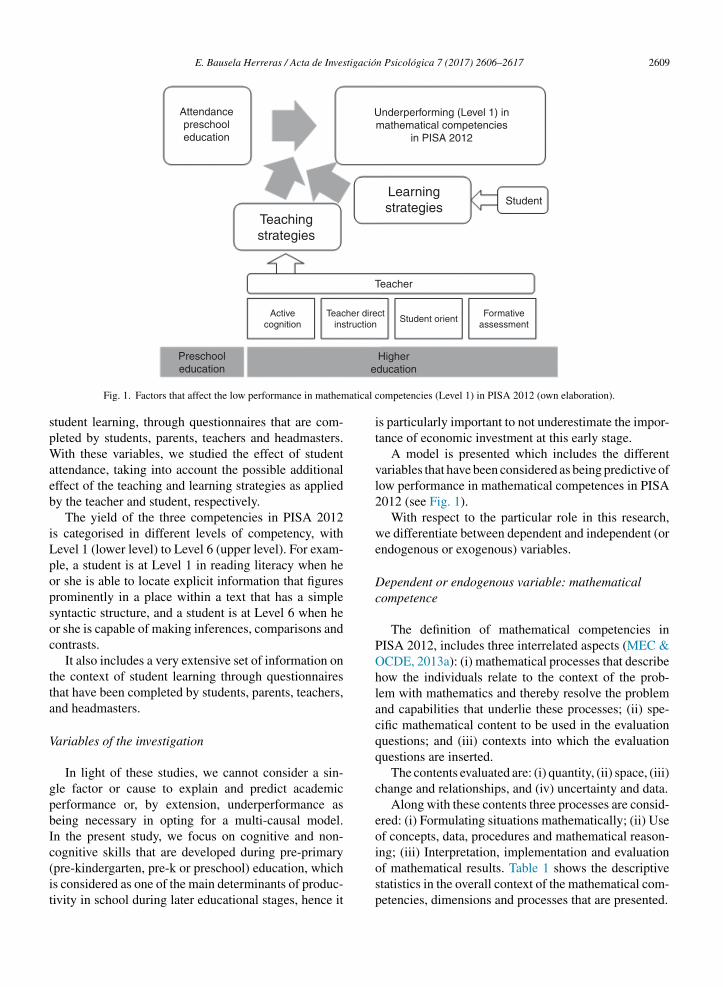
Fig. 1. Factors that affect the low performance in mathem
tudent learning, through questionnaires that are com-leted by students, parents, teachers and headmasters.ith these variables, we studied the effect of student
ttendance, taking into account the possible additionalffect of the teaching and learning strategies as appliedy the teacher and student, respectively.
The yield of the three competencies in PISA 2012s categorised in different levels of competency, withevel 1 (lower level) to Level 6 (upper level). For exam-le, a student is at Level 1 in reading literacy when her she is able to locate explicit information that figuresrominently in a place within a text that has a simpleyntactic structure, and a student is at Level 6 when her she is capable of making inferences, comparisons andontrasts.
It also includes a very extensive set of information onhe context of student learning through questionnaireshat have been completed by students, parents, teachers,nd headmasters.
ariables of the investigation
In light of these studies, we cannot consider a sin-le factor or cause to explain and predict academicerformance or, by extension, underperformance aseing necessary in opting for a multi-causal model.n the present study, we focus on cognitive and non-
ognitive skills that are developed during pre-primarypre-kindergarten, pre-k or preschool) education, whichs considered as one of the main determinants of produc-ivity in school during later educational stages, hence itducation
ompetencies (Level 1) in PISA 2012 (own elaboration).
is particularly important to not underestimate the impor-tance of economic investment at this early stage.
A model is presented which includes the differentvariables that have been considered as being predictive oflow performance in mathematical competences in PISA2012 (see Fig. 1).
With respect to the particular role in this research,we differentiate between dependent and independent (orendogenous or exogenous) variables.
Dependent or endogenous variable: mathematicalcompetence
The definition of mathematical competencies inPISA 2012, includes three interrelated aspects (MEC &OCDE, 2013a): (i) mathematical processes that describehow the individuals relate to the context of the prob-lem with mathematics and thereby resolve the problemand capabilities that underlie these processes; (ii) spe-cific mathematical content to be used in the evaluationquestions; and (iii) contexts into which the evaluationquestions are inserted.
The contents evaluated are: (i) quantity, (ii) space, (iii)change and relationships, and (iv) uncertainty and data.
Along with these contents three processes are consid-ered: (i) Formulating situations mathematically; (ii) Useof concepts, data, procedures and mathematical reason-
ing; (iii) Interpretation, implementation and evaluationof mathematical results. Table 1 shows the descriptivestatistics in the overall context of the mathematical com-petencies, dimensions and processes that are presented.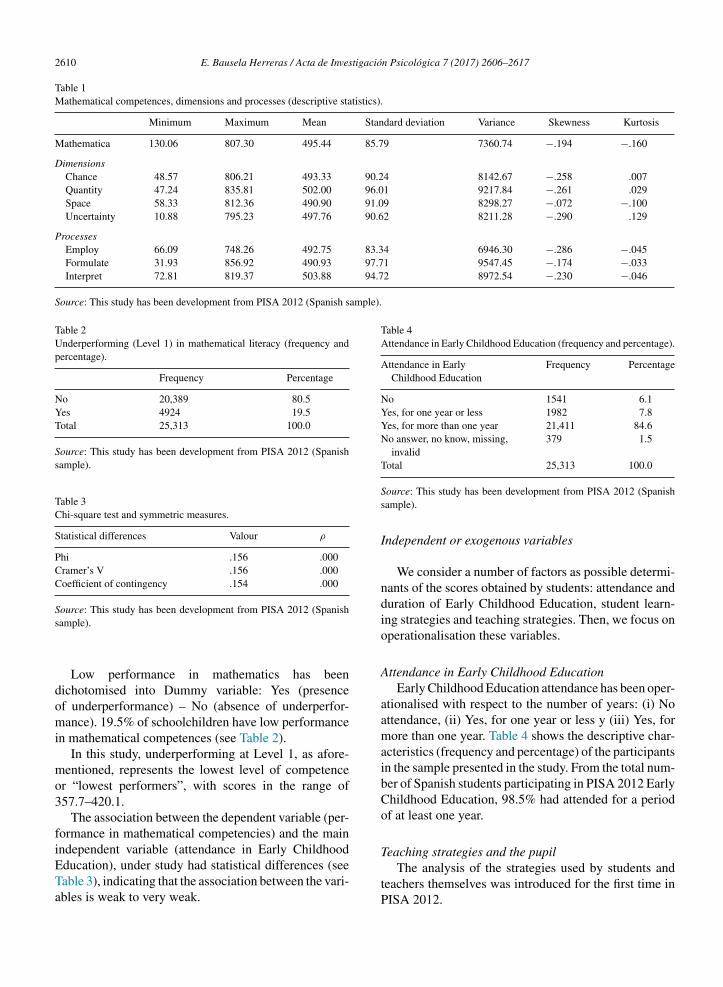
2610 E. Bausela Herreras / Acta de Investigación Psicológica 7 (2017) 2606–2617
Table 1Mathematical competences, dimensions and processes (descriptive statistics).
Minimum Maximum Mean Standard deviation Variance Skewness Kurtosis
Mathematica 130.06 807.30 495.44 85.79 7360.74 −.194 −.160
DimensionsChance 48.57 806.21 493.33 90.24 8142.67 −.258 .007Quantity 47.24 835.81 502.00 96.01 9217.84 −.261 .029Space 58.33 812.36 490.90 91.09 8298.27 −.072 −.100Uncertainty 10.88 795.23 497.76 90.62 8211.28 −.290 .129
ProcessesEmploy 66.09 748.26 492.75 83.34 6946.30 −.286 −.045Formulate 31.93 856.92 490.93 97.71 9547.45 −.174 −.033Interpret 72.81 819.37 503.88 94.72 8972.54 −.230 −.046
Source: This study has been development from PISA 2012 (Spanish sample).
Table 2Underperforming (Level 1) in mathematical literacy (frequency andpercentage).
Frequency Percentage
No 20,389 80.5Yes 4924 19.5Total 25,313 100.0
Source: This study has been development from PISA 2012 (Spanishsample).
Table 3Chi-square test and symmetric measures.
Statistical differences Valour ρ
Phi .156 .000Cramer’s V .156 .000Coefficient of contingency .154 .000
Source: This study has been development from PISA 2012 (Spanish
Table 4Attendance in Early Childhood Education (frequency and percentage).
Attendance in EarlyChildhood Education
Frequency Percentage
No 1541 6.1Yes, for one year or less 1982 7.8Yes, for more than one year 21,411 84.6No answer, no know, missing,
invalid379 1.5
Total 25,313 100.0
The analysis of the strategies used by students and
sample).
Low performance in mathematics has beendichotomised into Dummy variable: Yes (presenceof underperformance) – No (absence of underperfor-mance). 19.5% of schoolchildren have low performancein mathematical competences (see Table 2).
In this study, underperforming at Level 1, as afore-mentioned, represents the lowest level of competenceor “lowest performers”, with scores in the range of357.7–420.1.
The association between the dependent variable (per-formance in mathematical competencies) and the mainindependent variable (attendance in Early ChildhoodEducation), under study had statistical differences (seeTable 3), indicating that the association between the vari-
ables is weak to very weak.Source: This study has been development from PISA 2012 (Spanishsample).
Independent or exogenous variables
We consider a number of factors as possible determi-nants of the scores obtained by students: attendance andduration of Early Childhood Education, student learn-ing strategies and teaching strategies. Then, we focus onoperationalisation these variables.
Attendance in Early Childhood EducationEarly Childhood Education attendance has been oper-
ationalised with respect to the number of years: (i) Noattendance, (ii) Yes, for one year or less y (iii) Yes, formore than one year. Table 4 shows the descriptive char-acteristics (frequency and percentage) of the participantsin the sample presented in the study. From the total num-ber of Spanish students participating in PISA 2012 EarlyChildhood Education, 98.5% had attended for a periodof at least one year.
Teaching strategies and the pupil
teachers themselves was introduced for the first time inPISA 2012.
tigación Psicológica 7 (2017) 2606–2617 2611
ai
isTtanpr(ce
tfioaTm
ci“NiRpM
b
t&pa
c
b
sqtitpo
Table 5Questions included in the questionnaire on learning strategies forstudent-centred learning in mathematics.
For each group of three items, please choose the item that bestdescribes your approach to mathematics.
Learning strategies – important parts vs. existing knowledge vs.learn by heart:- When I study for a mathematics test, I try to work out what themost important parts to learn are.- When I study for a mathematics test, I try to understand newconcepts by relating them to things I already know.- When I study for a mathematics test, I learn as much as I can offby heart.
Learning strategies – improve understanding vs. new ways vs.memory:- When I study mathematics, I try to figure out which concepts Istill have not understood properly.- When I study mathematics, I think of new ways to get theanswer.- When I study mathematics, I make myself check to see if Iremember the work I have already done.
Learning strategies – other subjects vs. learning goals vs. rehearseproblems:- When I study mathematics, I try to relate the work to things Ihave learnt in other subjects.- When I study mathematics, I start by working out exactly what Ineed to learn.- When I study mathematics, I go over some problems so oftenthat I feel as if I could solve them in my sleep.
Learning strategies – repeat examples vs. everyday applications vs.more information:- In order to remember the method for solving a mathematicsproblem, I go through examples again and again.- I think about how the mathematics I have learnt can be usedin everyday life.- When I cannot understand something in mathematics, I alwayssearch for more information to clarify the problem.
E. Bausela Herreras / Acta de Inves
) Strategies for student-centred learningn mathematics
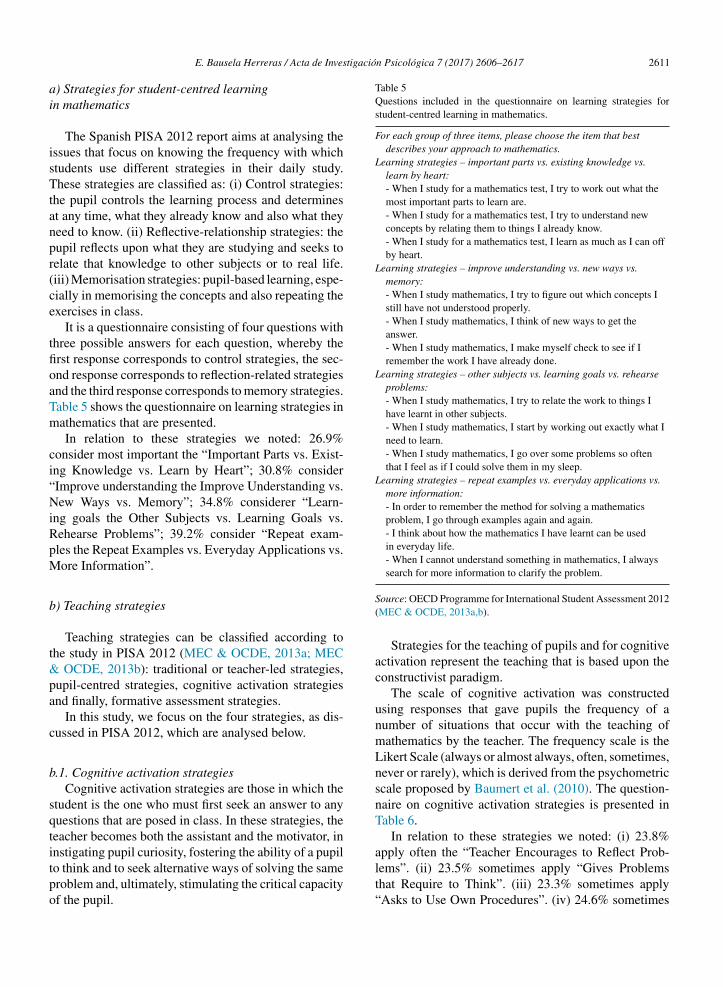
The Spanish PISA 2012 report aims at analysing thessues that focus on knowing the frequency with whichtudents use different strategies in their daily study.hese strategies are classified as: (i) Control strategies:
he pupil controls the learning process and determinest any time, what they already know and also what theyeed to know. (ii) Reflective-relationship strategies: theupil reflects upon what they are studying and seeks toelate that knowledge to other subjects or to real life.iii) Memorisation strategies: pupil-based learning, espe-ially in memorising the concepts and also repeating thexercises in class.
It is a questionnaire consisting of four questions withhree possible answers for each question, whereby therst response corresponds to control strategies, the sec-nd response corresponds to reflection-related strategiesnd the third response corresponds to memory strategies.able 5 shows the questionnaire on learning strategies inathematics that are presented.In relation to these strategies we noted: 26.9%
onsider most important the “Important Parts vs. Exist-ng Knowledge vs. Learn by Heart”; 30.8% considerImprove understanding the Improve Understanding vs.ew Ways vs. Memory”; 34.8% considerer “Learn-
ng goals the Other Subjects vs. Learning Goals vs.ehearse Problems”; 39.2% consider “Repeat exam-les the Repeat Examples vs. Everyday Applications vs.ore Information”.
) Teaching strategies
Teaching strategies can be classified according tohe study in PISA 2012 (MEC & OCDE, 2013a; MEC
OCDE, 2013b): traditional or teacher-led strategies,upil-centred strategies, cognitive activation strategiesnd finally, formative assessment strategies.
In this study, we focus on the four strategies, as dis-ussed in PISA 2012, which are analysed below.
.1. Cognitive activation strategiesCognitive activation strategies are those in which the
tudent is the one who must first seek an answer to anyuestions that are posed in class. In these strategies, theeacher becomes both the assistant and the motivator, in
nstigating pupil curiosity, fostering the ability of a pupilo think and to seek alternative ways of solving the sameroblem and, ultimately, stimulating the critical capacityf the pupil.Source: OECD Programme for International Student Assessment 2012(MEC & OCDE, 2013a,b).
Strategies for the teaching of pupils and for cognitiveactivation represent the teaching that is based upon theconstructivist paradigm.
The scale of cognitive activation was constructedusing responses that gave pupils the frequency of anumber of situations that occur with the teaching ofmathematics by the teacher. The frequency scale is theLikert Scale (always or almost always, often, sometimes,never or rarely), which is derived from the psychometricscale proposed by Baumert et al. (2010). The question-naire on cognitive activation strategies is presented inTable 6.
In relation to these strategies we noted: (i) 23.8%apply often the “Teacher Encourages to Reflect Prob-
lems”. (ii) 23.5% sometimes apply “Gives Problemsthat Require to Think”. (iii) 23.3% sometimes apply“Asks to Use Own Procedures”. (iv) 24.6% sometimes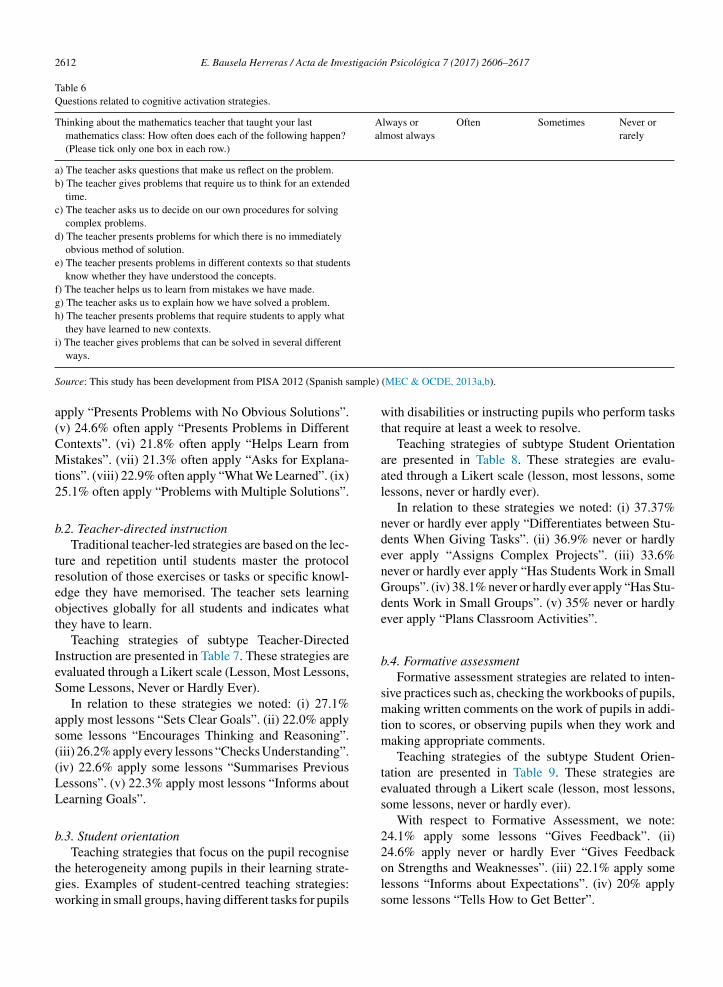
2612 E. Bausela Herreras / Acta de Investigación Psicológica 7 (2017) 2606–2617
Table 6Questions related to cognitive activation strategies.
Thinking about the mathematics teacher that taught your lastmathematics class: How often does each of the following happen?(Please tick only one box in each row.)
Always oralmost always
Often Sometimes Never orrarely
a) The teacher asks questions that make us reflect on the problem.b) The teacher gives problems that require us to think for an extended
time.c) The teacher asks us to decide on our own procedures for solving
complex problems.d) The teacher presents problems for which there is no immediately
obvious method of solution.e) The teacher presents problems in different contexts so that students
know whether they have understood the concepts.f) The teacher helps us to learn from mistakes we have made.g) The teacher asks us to explain how we have solved a problem.h) The teacher presents problems that require students to apply what
they have learned to new contexts.i) The teacher gives problems that can be solved in several different
ample)
ways.
Source: This study has been development from PISA 2012 (Spanish s
apply “Presents Problems with No Obvious Solutions”.(v) 24.6% often apply “Presents Problems in DifferentContexts”. (vi) 21.8% often apply “Helps Learn fromMistakes”. (vii) 21.3% often apply “Asks for Explana-tions”. (viii) 22.9% often apply “What We Learned”. (ix)25.1% often apply “Problems with Multiple Solutions”.
b.2. Teacher-directed instructionTraditional teacher-led strategies are based on the lec-
ture and repetition until students master the protocolresolution of those exercises or tasks or specific knowl-edge they have memorised. The teacher sets learningobjectives globally for all students and indicates whatthey have to learn.
Teaching strategies of subtype Teacher-DirectedInstruction are presented in Table 7. These strategies areevaluated through a Likert scale (Lesson, Most Lessons,Some Lessons, Never or Hardly Ever).
In relation to these strategies we noted: (i) 27.1%apply most lessons “Sets Clear Goals”. (ii) 22.0% applysome lessons “Encourages Thinking and Reasoning”.(iii) 26.2% apply every lessons “Checks Understanding”.(iv) 22.6% apply some lessons “Summarises PreviousLessons”. (v) 22.3% apply most lessons “Informs aboutLearning Goals”.
b.3. Student orientation
Teaching strategies that focus on the pupil recognisethe heterogeneity among pupils in their learning strate-gies. Examples of student-centred teaching strategies:working in small groups, having different tasks for pupils
(MEC & OCDE, 2013a,b).
with disabilities or instructing pupils who perform tasksthat require at least a week to resolve.
Teaching strategies of subtype Student Orientationare presented in Table 8. These strategies are evalu-ated through a Likert scale (lesson, most lessons, somelessons, never or hardly ever).
In relation to these strategies we noted: (i) 37.37%never or hardly ever apply “Differentiates between Stu-dents When Giving Tasks”. (ii) 36.9% never or hardlyever apply “Assigns Complex Projects”. (iii) 33.6%never or hardly ever apply “Has Students Work in SmallGroups”. (iv) 38.1% never or hardly ever apply “Has Stu-dents Work in Small Groups”. (v) 35% never or hardlyever apply “Plans Classroom Activities”.
b.4. Formative assessmentFormative assessment strategies are related to inten-
sive practices such as, checking the workbooks of pupils,making written comments on the work of pupils in addi-tion to scores, or observing pupils when they work andmaking appropriate comments.
Teaching strategies of the subtype Student Orien-tation are presented in Table 9. These strategies areevaluated through a Likert scale (lesson, most lessons,some lessons, never or hardly ever).
With respect to Formative Assessment, we note:24.1% apply some lessons “Gives Feedback”. (ii)
24.6% apply never or hardly Ever “Gives Feedbackon Strengths and Weaknesses”. (iii) 22.1% apply somelessons “Informs about Expectations”. (iv) 20% applysome lessons “Tells How to Get Better”.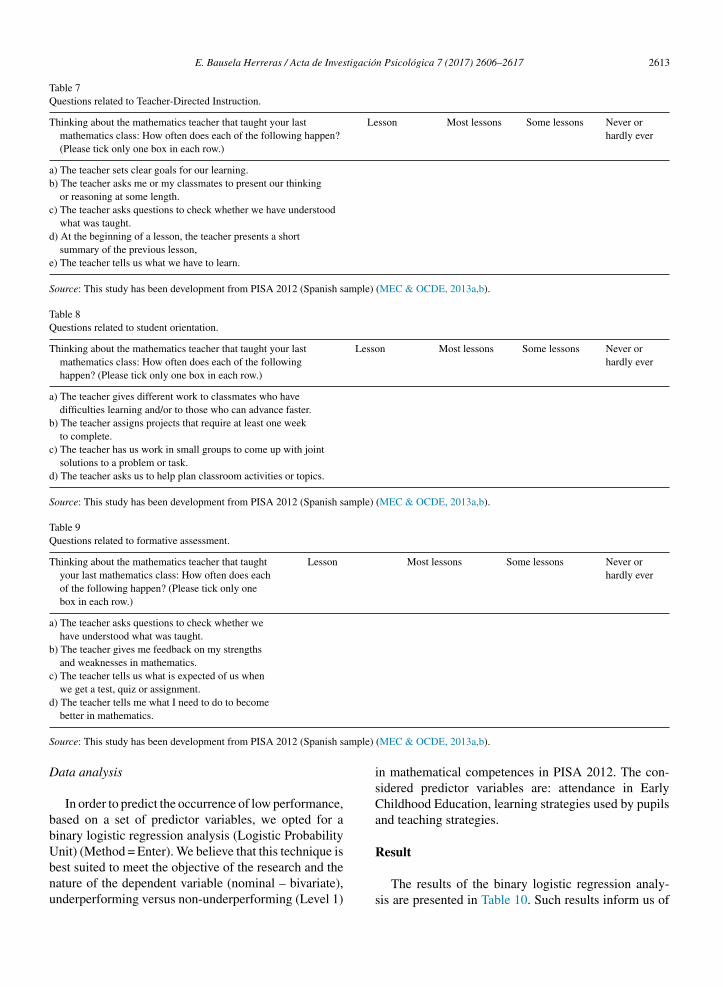
E. Bausela Herreras / Acta de Investigación Psicológica 7 (2017) 2606–2617 2613
Table 7Questions related to Teacher-Directed Instruction.
Thinking about the mathematics teacher that taught your lastmathematics class: How often does each of the following happen?(Please tick only one box in each row.)
Lesson Most lessons Some lessons Never orhardly ever
a) The teacher sets clear goals for our learning.b) The teacher asks me or my classmates to present our thinking
or reasoning at some length.c) The teacher asks questions to check whether we have understood
what was taught.d) At the beginning of a lesson, the teacher presents a short
summary of the previous lesson,e) The teacher tells us what we have to learn.
Source: This study has been development from PISA 2012 (Spanish sample) (MEC & OCDE, 2013a,b).
Table 8Questions related to student orientation.
Thinking about the mathematics teacher that taught your lastmathematics class: How often does each of the followinghappen? (Please tick only one box in each row.)
Lesson Most lessons Some lessons Never orhardly ever
a) The teacher gives different work to classmates who havedifficulties learning and/or to those who can advance faster.
b) The teacher assigns projects that require at least one weekto complete.
c) The teacher has us work in small groups to come up with jointsolutions to a problem or task.
d) The teacher asks us to help plan classroom activities or topics.
Source: This study has been development from PISA 2012 (Spanish sample) (MEC & OCDE, 2013a,b).
Table 9Questions related to formative assessment.
Thinking about the mathematics teacher that taughtyour last mathematics class: How often does eachof the following happen? (Please tick only onebox in each row.)
Lesson Most lessons Some lessons Never orhardly ever
a) The teacher asks questions to check whether wehave understood what was taught.
b) The teacher gives me feedback on my strengthsand weaknesses in mathematics.
c) The teacher tells us what is expected of us whenwe get a test, quiz or assignment.
d) The teacher tells me what I need to do to become
S ample)
D
bbUbnu
better in mathematics.
ource: This study has been development from PISA 2012 (Spanish s
ata analysis
In order to predict the occurrence of low performance,ased on a set of predictor variables, we opted for ainary logistic regression analysis (Logistic Probability
nit) (Method = Enter). We believe that this technique isest suited to meet the objective of the research and theature of the dependent variable (nominal – bivariate),nderperforming versus non-underperforming (Level 1)(MEC & OCDE, 2013a,b).
in mathematical competences in PISA 2012. The con-sidered predictor variables are: attendance in EarlyChildhood Education, learning strategies used by pupilsand teaching strategies.
Result
The results of the binary logistic regression analy-sis are presented in Table 10. Such results inform us of
2614 E. Bausela Herreras / Acta de Investigació
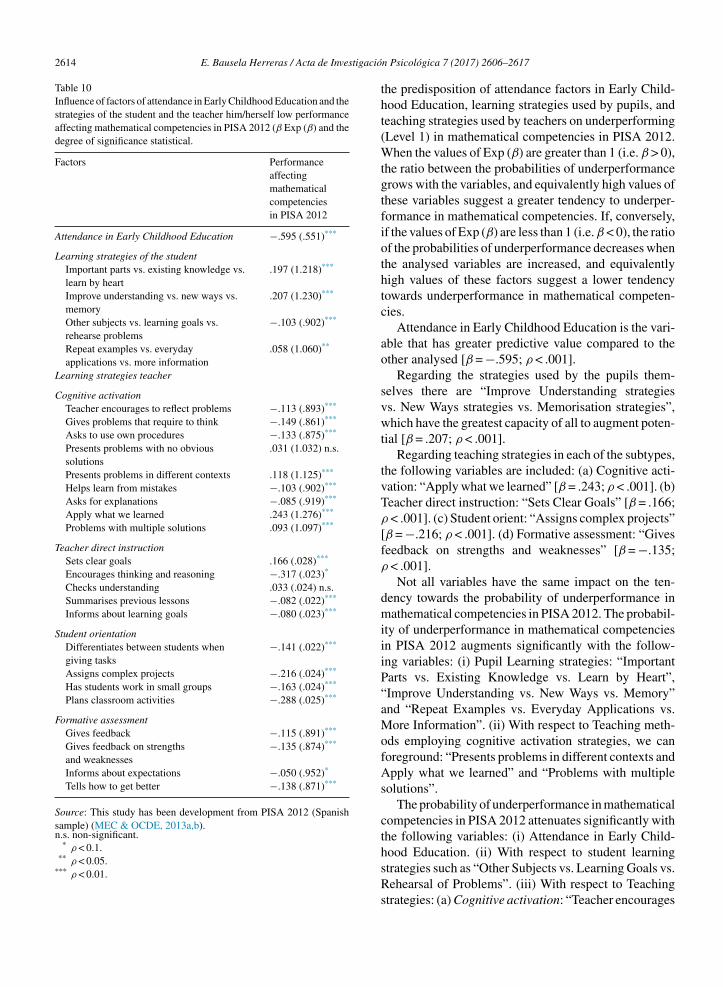
Table 10Influence of factors of attendance in Early Childhood Education and thestrategies of the student and the teacher him/herself low performanceaffecting mathematical competencies in PISA 2012 (β Exp (β) and thedegree of significance statistical.
Factors Performanceaffectingmathematicalcompetenciesin PISA 2012
Attendance in Early Childhood Education −.595 (.551)***
Learning strategies of the studentImportant parts vs. existing knowledge vs.learn by heart
.197 (1.218)***
Improve understanding vs. new ways vs.memory
.207 (1.230)***
Other subjects vs. learning goals vs.rehearse problems
−.103 (.902)***
Repeat examples vs. everydayapplications vs. more information
.058 (1.060)**
Learning strategies teacher
Cognitive activationTeacher encourages to reflect problems −.113 (.893)***
Gives problems that require to think −.149 (.861)***
Asks to use own procedures −.133 (.875)***
Presents problems with no obvioussolutions
.031 (1.032) n.s.
Presents problems in different contexts .118 (1.125)***
Helps learn from mistakes −.103 (.902)***
Asks for explanations −.085 (.919)***
Apply what we learned .243 (1.276)***
Problems with multiple solutions .093 (1.097)***
Teacher direct instructionSets clear goals .166 (.028)***
Encourages thinking and reasoning −.317 (.023)*
Checks understanding .033 (.024) n.s.Summarises previous lessons −.082 (.022)***
Informs about learning goals −.080 (.023)***
Student orientationDifferentiates between students whengiving tasks
−.141 (.022)***
Assigns complex projects −.216 (.024)***
Has students work in small groups −.163 (.024)***
Plans classroom activities −.288 (.025)***
Formative assessmentGives feedback −.115 (.891)***
Gives feedback on strengthsand weaknesses
−.135 (.874)***
Informs about expectations −.050 (.952)*
Tells how to get better −.138 (.871)***
Source: This study has been development from PISA 2012 (Spanishsample) (MEC & OCDE, 2013a,b).n.s. non-significant.
* ρ < 0.1.** ρ < 0.05.
*** ρ < 0.01.
n Psicológica 7 (2017) 2606–2617
the predisposition of attendance factors in Early Child-hood Education, learning strategies used by pupils, andteaching strategies used by teachers on underperforming(Level 1) in mathematical competencies in PISA 2012.When the values of Exp (β) are greater than 1 (i.e. β > 0),the ratio between the probabilities of underperformancegrows with the variables, and equivalently high values ofthese variables suggest a greater tendency to underper-formance in mathematical competencies. If, conversely,if the values of Exp (β) are less than 1 (i.e. β < 0), the ratioof the probabilities of underperformance decreases whenthe analysed variables are increased, and equivalentlyhigh values of these factors suggest a lower tendencytowards underperformance in mathematical competen-cies.
Attendance in Early Childhood Education is the vari-able that has greater predictive value compared to theother analysed [β = −.595; ρ < .001].
Regarding the strategies used by the pupils them-selves there are “Improve Understanding strategiesvs. New Ways strategies vs. Memorisation strategies”,which have the greatest capacity of all to augment poten-tial [β = .207; ρ < .001].
Regarding teaching strategies in each of the subtypes,the following variables are included: (a) Cognitive acti-vation: “Apply what we learned” [β = .243; ρ < .001]. (b)Teacher direct instruction: “Sets Clear Goals” [β = .166;ρ < .001]. (c) Student orient: “Assigns complex projects”[β = −.216; ρ < .001]. (d) Formative assessment: “Givesfeedback on strengths and weaknesses” [β = −.135;ρ < .001].
Not all variables have the same impact on the ten-dency towards the probability of underperformance inmathematical competencies in PISA 2012. The probabil-ity of underperformance in mathematical competenciesin PISA 2012 augments significantly with the follow-ing variables: (i) Pupil Learning strategies: “ImportantParts vs. Existing Knowledge vs. Learn by Heart”,“Improve Understanding vs. New Ways vs. Memory”and “Repeat Examples vs. Everyday Applications vs.More Information”. (ii) With respect to Teaching meth-ods employing cognitive activation strategies, we canforeground: “Presents problems in different contexts andApply what we learned” and “Problems with multiplesolutions”.
The probability of underperformance in mathematicalcompetencies in PISA 2012 attenuates significantly withthe following variables: (i) Attendance in Early Child-
hood Education. (ii) With respect to student learningstrategies such as “Other Subjects vs. Learning Goals vs.Rehearsal of Problems”. (iii) With respect to Teachingstrategies: (a) Cognitive activation: “Teacher encourages
tigació
ttfdilbpp“wh
apwcE8gTe8
D
hmtoisrao
ctisw
bbtH2
rc&
E. Bausela Herreras / Acta de Inves
o reflect problems”, “Gives problems that require tohink”, “Asks to use own procedures”, “Helps learnrom mistakes” and “Asks for explanations”. (b) Teacherirect instruction: “Encourages thinking and reason-ng”, “Summarises previous lessons and Informs aboutearning goals”. (c) Student orientation: “Differentiatesetween students when giving tasks”, “Assigns com-lex projects” and “Has students work in small groups ylans classroom activities”. (d) Formative assessment:Gives feedback”, “Gives feedback on strengths andeaknesses”, “Informs about expectations” and “Tellsow to get better”.
The analysis of binary logistic regression permits correct classification of pupils who show under-erformance in mathematical competencies and thoseithout underperformance in mathematical competen-
ies, particularly in relation to: (i) Attendance in Primaryducation at 81.2%; (ii) Pupil learning strategies at1.4%; (iii) Well-defined with respect to teaching strate-ies: (a) Cognitive activation strategies at 81.6%, (b)eacher Directed Instruction at 81.4%, (c) Student Ori-ntation at 81.5% and (d) Formative assessment at1.3%.
iscussion and conclusions
The aim of this study was to identify which factoras more predictive ability with respect to underperfor-ance in mathematical competencies. For this purpose,
wo factors were selected whose occurrence in the lifef the pupil occurs at two different stages. The first stages attendance in Early Childhood Education (the initialtage of the Education System). The second stage iselated to the use of strategies by the pupils themselvesnd by teaching strategies linked to the secondary stagef education.
The results of the analysis of binary logistic regressionlearly show that the factor with the greater predic-ive capability of the probability of underperformances attendance in Early Childhood Education, having aignificantly greater probability than the other variableshich were analysed in this study.These results link with the results that were obtained
y other researchers that impinge upon the associationetween underperformance in mathematical compe-ences and attendance in Early Childhood Education (seeindman, 2013; Lehrl et al., 2016; Temple & Reynolds,015).
Furthermore, predictive variables do exist that areelated to the use of learning strategies and mathematicalompetencies (see Ramirez, Chang, Maloney, Levine,
Beilock, 2016). Ramirez et al. (2016) condition the
n Psicológica 7 (2017) 2606–2617 2615
use of strategies for the pupil with respect to othervariables, such as anxiety, which escapes from theobject of this study. In particular, the results of theSpanish National Institute of Educational Evaluation(INEE) itself, suggest that teaching strategies contributenegatively to performance in mathematics, while thelearning strategies of pupils have a positive impact.
Notwithstanding, we completed this research, butnote that we have found that, to the best of our knowl-edge, there are no studies that analyse and compare thepredictive ability of the three factors in an interrelatedmanner (attending Early Childhood Education, learn-ing strategies of pupils and teaching strategies). Hence,the obtained results cannot be compared with other evi-dence. However, the originality and novelty of the dataand the contribution of this study to this field of knowl-edge are all noteworthy.
This study confirms that attendance in Early Child-hood Education is the variable that has greater predictivecapacity of underperforming in mathematical compe-tencies in PISA 2012. These data complement theaforementioned data in considering that Early Child-hood Education provides the prerequisite skills uponwhich will be established a good foundation for fur-ther learning. But, with respect to the acquisition (ordeficiency thereof) of the prerequisite skills, they can-not be exclusively associated with underperformance inmathematical competencies in Secondary Education.
Programmes in Primary School can be designed toprovide special attention for children who did not attendprogrammes of Early Childhood Education, in order toprevent social inequalities in academic performance thatare noted in several studies within the body of literature,see, for example: Cebolla Boado (2012), Garrido andCebolla Boado (2010) or Segretin et al. (2014).
At the same time, it is necessary to aim at a goodquality of Early Childhood Education, that shall provideevidence of whether it is solely the attendance, or of itis solely the quality of the education that permits theprediction of performance in later stages.
Furthermore, bet on a stage of quality EarlyChildhood Education is important to employ apsycho-educational design for Secondary Educationprogrammes that focus on the use of learning strategiesby the pupil. Teachers also decide what strategies to use,what role these strategies they will play in the class, andespecially that which strategy is to be used, as needed.Thus, cognitive activation strategies, for example,
represent just one facet of the recommended strategiesfor the development of mathematical competencies(OECD, 2013c). The effectiveness of strategies is linkedto numerous variables, such as the structuring of the
tigació
2616 E. Bausela Herreras / Acta de Invescontents, classroom climate or level of anxiety thatmotivates the student towards mathematics.
In this study, we have not considered variables thatare intrinsic to the pupils themselves (for example, self-efficacy, anxiety, motivation, etc.) that can explain theuse of strategies by the pupils. That is why, in futurestudies, structural equation modelling techniques can bedeveloped and include these variables. The results, forexample, of the study by Kriegbaum, Jansen, and Spinath(2015) confirm that motivation plays a very importantrole in predicting academic performance.
It is also important, as a potential future line ofresearch, to compare the results obtained in this studyusing the Spanish sample, with those results that havebeen obtained in other cultures. Zhang, Khan, andTahirsylaj (2015) suggest that culture is an important pre-dictor when comparing and contrasting different schoolsystems.
Funding
This study was completed during the research stay,conducted in July 2016 at the Spanish National Institutefor Educational Evaluation (INEE), under the auspicesof the Spanish Ministry of Education, Culture and Sport(MECD).
Conflict of interest
The authors have no conflicts of interest to declare.
References
Ahmed, W., Minnaert, A., Kuyper, H., & Van der Werf, G. (2012).Reciprocal relationships between math self-concept and math anx-iety. Learning and Individual Differences, 22(3), 385–389.
Arteaga, I., Humpage, S., Reynolds, A. J., & Temple, J. A. (2014).One year of preschool or two – Is it important for adult outcomes?Results from the Chicago longitudinal study of the child-parentcenters. Economics of Education Review, 40, 221–237.
Baumert, J., Kunter, M., Blum, W., Brunner, M., Voss, T., Jordan, A.,et al. (2010). Teachers’ mathematical knowledge, cognitive activa-tion in the classroom, and student progress. American EducationalResearch Journal, 47(X), 133–180.
Bryant, D. P., Bryant, B. R., Gersten, R., Scammacca, N., & Chavez,M. M. (2008). Mathematics intervention with first- and second-grade students with mathematics difficulties: The effects of tierintervention delivered as booster lessons. Remedial and SpecialEducation, 29, 20–32.
Callejo, M., & Vila, A. (2009). Approach to mathematical problemsolving and students’ belief systems: Two case studies. Educational
Studies in Mathematics, 72(1), 111–126.Cebolla Boado, H. (2011). Primary and secondary effects in the expla-nation of immigrants’ educational disadvantage. British Journal ofSociology, 32, 407–430.
n Psicológica 7 (2017) 2606–2617
Cebolla Boado, H. (2012). La incorporación escolar de la población deorigen inmigrante y el impacto de la concentración de inmigrantesen las escuelas navarras. Navarra: Departamento de PolíticasSociales, Sección de Atención a la Inmigración, Gobierno deNavarra.
Chionh, Y. H., & Fraser, B. J. (2009). Classroom environment, achieve-ment, attitudes and self-esteem in geography and mathematics inSingapore. International Research in Geographical and Environ-mental Education, 18, 29–44.
Garrido, L., & Cebolla Boado, H. (2010). Rendimiento académicoy concentración de inmigrantes en las escuelas espanolas: PISA2006. Presupuesto y Gasto Público, 61, 159–176.
Geary, D. C., Hamson, C. O., & Hoard, M. K. (2000). Numericaland arithmetical cognition: A longitudinal study of process andconcept deficits in children with learning disability. Journal ofExperimental Child Psychology, 77(3), 236–263.
Grissmer, D. W., Mashburn, A. J., Cottone, E., Chen, W. B., Brock, L.L., Murrah, W. M., et al. (2013). Play-based after-school curricu-lum improves measures of executive function, visuo spatial andmath skills, and classroom behavior for high risk K-1 children. InPaper presented at the meeting of the Society for Research in ChildDevelopment
Heckman, J. J. (2006). Skill formation and the economics of investingin disadvantaged children. Science, 312, 1900–1902.
Hindman, A. H. (2013). Mathematics instruction in Head Start: Nature,extent, and contributions to children’s learning. Journal of AppliedDevelopmental Psychology, 34, 230–240.
Jordan, N. C., Glutting, J., & Ramineni, C. (2010). The importance ofnumber sense to mathematics achievement in first and third grades.Learning and Individual Differences, 20(2), 82–88.
Karoly, L., Kilburn, M. R., & Cannon, J. S. (2005). Early child-hood interventions: Proven results, future promise. Santa Monica:RAND Corporation.
Kriegbaum, K., Jansen, M., & Spinath, B. (2015). Motivation: A pre-dictor of PISA’s mathematical competence beyond intelligence andprior test achievement. Learning and Individual Differences, 43,140–148.
Lehrl, S., Klucznioka, K., & Rossbachba, H. G. (2016). Longer-term associations of preschool education: The predictive roleof preschool quality for the development of mathematical skillsthrough elementary school. Early Childhood Research Quarterly,36, 475–488.
Mazzocco, M., & Thompson, R. (2005). Kindergarten predictorsof math learning disability. Learning Disabilities Research andPractice, 20, 142–155.
MEC, & OCDE (Eds.). (2013a). PISA 2012, Programa para la Evalu-ación Internacional de los Alumnos. Informe Espanol, Volumen I:Resultados y contexto. Madrid: MEC-OECD.
MEC, & OCDE (Eds.). (2013b). Marcos y pruebas de eval-uación de PISA 2012. Resolución de problemas. Madrid:MEC-OECD.
OECD. (2013a). PISA 2012 results, excellence through equity: Giv-ing every student the chance to succeed (volume II). Paris: OECDPublishing.
OECD. (2013b). PISA 2012 results: What makes schools success-ful? Resources, policies and practices (Volume IV). Paris: OECDPublishing.
OECD. (2013c). PISA 2012 Assessment and analytical framework:
Mathematics, reading, science, problem solving and financial lit-eracy. Paris: OECD Publishing.Ramirez, G., Chang, H., Maloney, E. A., Levine, S. C., & Beilock,S. L. (2016). On the relationship between math anxiety and math

tigació
R
S
S
S
E. Bausela Herreras / Acta de Inves
achievement in early elementary school: The role of problem solv-ing strategies. Journal of Experimental Child Psychology, 141,83–100.
osario, P., LourenC o, A., Paiva, M. O., Núnez, J. C., González-Pienda,J. A., & Valle, A. (2012). Autoeficacia y utilidad percibida comocondiciones necesarias para un aprendizaje académico autorregu-lado. Anales de Psicología, 28(1), 37–42.
ánchez, B. (2014). Deberes escolares, motivación y rendimiento en elárea de matemáticas. A Coruna: Universidad de A Coruna (Tesisdoctoral inédita).
egretin, M. S., Lipina, S. J., Hermida, M. J., Sheffield, T. D., Nelson,J. M., Espy, K. A., et al. (2014). Predictors of cognitive enhance-ment after training in preschoolers from diverse socioeconomicbackgrounds. Frontiers in Psychology, 5, 205.
ylva, K., Sammons, P., Chan, L. L. S., Melhuish, E., Siraj, I., &
Taggart, B. (2013). The effects of early experiences at home andpre-school on gains in English and mathematics in primary school:A multilevel study in England. Zeitschrift für Erziehungswis-senschaft, 16, 277–301.n Psicológica 7 (2017) 2606–2617 2617
Taskin, N., & Tugrul, B. (2014). Investigation preschool teachercandidates’ mathematics literacy self-sufficiency beliefs in var-ious variables. Procedia-Social and Behavioral Sciences, 116,3067–3071.
Temple, J. A., & Reynolds, A. J. (2015). Using cost-benefit analy-sis to scale up early childhood programs through Pay for Successfinancing. Journal of Benefit-Cost Analysis, 6, 628–653.
Touron, J., Hernández, L., Morera, M., & Asencio, E. (2012).Alumnos de alto, medio y bajo rendimiento en matemáticas enTIMSS. Estudio del impacto de algunos factores de contexto. EnInstituto Nacional de Evaluación Educativa. In PIRLS – TIMSS2011. Estudio Internacional de progreso en comprensión lectora,matemáticas y ciencias. IEA Volumen ii: Informe espanol. Análisissecundario. pp. 195–236. Madrid: Instituto Nacional de Evalu-ación Educativa.
Zhang, L., Khan, G., & Tahirsylaj, A. (2015). Student performance,school differentiation and world cultures: Evidence from PISA2009. International Journal of Educational Development, 42,43–53.