Embed Size (px)
Citation preview
•
'~ •• --"~---~ •• -.-•• -----.-'-••• ----••• -~-•• "'---,-.--••• _._.,. ___ .,_. _____ ._ •• _ •• __ o_~ ___ • __ .L.. __ • ___ w ___ • _______ • ____ ow,, __ ,,_. __ ••• _. ___ o_. _____ w __ _
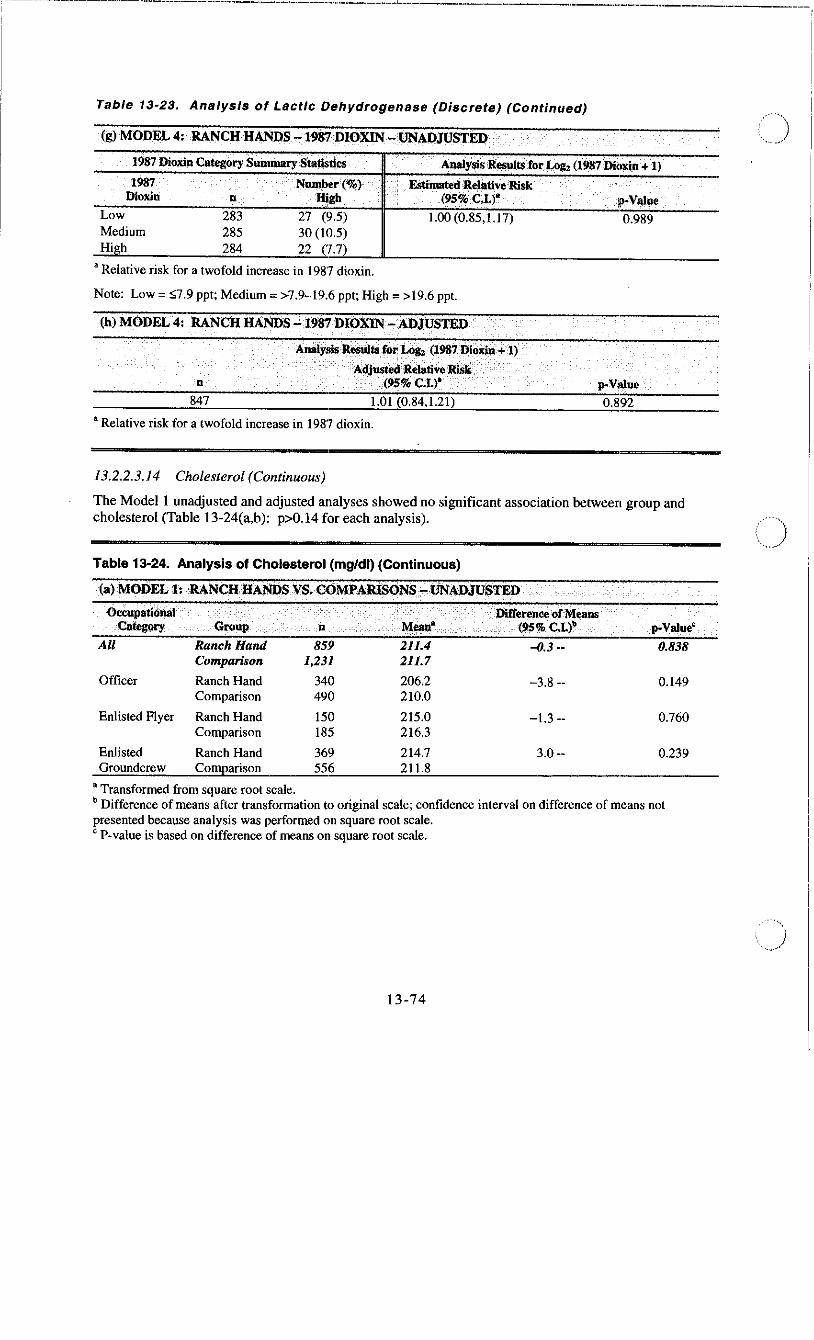
Table 13-23. Analysis of Lactic Dehydrogenase (Discrete) (Continued)
(g) MODEL 4: RANCH HANDS ~ 1987DIOXIN -UNi\DJUSTED
1987 Dioxin Category Summary Statistics AnaJy~sResultsfor,Lo;z (1987 Diox,in + 1)
1987 Number('!<?) , Estimated Re\iltiveRisk (9S%C.L)' Dioxin
Low Medium High
n
283 285 284
High
27 (9.5) 30 (10.5) 22 (7.7)
1.00 (0.85,1.17)
, Relative risk for a twofold increase in 1987 dioxin.
Note: Low = $,7.9 ppt; Medium = >7.9-19.6 ppt; High = >19.6 ppt.
(h) MODEL 4: RANCH HANDS - .1987 DIOXIN -ADJUSTED
AnalysisR...wts forLo;z(1987Dioxin+l)
AdfustedRelative Risk'
,
p-Value
0.989
n (95% CL)' ", p-Value
847 1.01 (0.84,1.21) 0.892
, Relative risk for a twofold increase in 1987 dioxin.
13.2.2.3.14 Cholesterol (Continuous)
The Model 1 unadjusted and adjusted analyses showed no significant association between group and cholesterol (Table 13-24(a,b): p>O.14 for each analysis).
Table 13-24. Analysis of Cholesterol (mg/dl) (Continuous)
(a) MODEL l:RANCH,HANDS VS.COMPARISONS-UNADJUSTED
OcCupational CategOry
All
Officer
Enlisted Flyer
Enlisted
Group
Ranch Hand Comparison
Ranch Hand Comparison
Ranch Hand Comparison
Ranch Hand Groundcrew Comparison
• Transformed from square root scale.
u
859 1,231
340 490
ISO 185
369 556
M • ,-211.4 211.7
206.2 210.0
215.0 216.3
214.7 211.8
'DirrereneeofMeans (95% CL)"
--{}.3 --
-3.8 --
-1.3 --
3.0 --
p-Value'
0.838
0.149
0.760
0.239
b Difference of means after transformation to original scale; confidence interval on difference of means not presented because analysis was performed on square root scale. , P-value is based on difference of means on square root scale.
13-74
.• )
\,)
()
(I
· - .. --.. --.. ,-___ .. _~. __ ... _._ ... ___ •. _. ______ .. _._"'__ .. ____ •. __ . __ ._ .... __ . __ ._._._._. __ , __ •. ___ ..•• ________ ._.--1. .. _. __ .. ____ • __ ... __ ... __ ... __ .. _____ . ________ .
Table 13-24. Analysis of Cholesterol (mg/dl) (Continuous) (Continued)
(b) MODEL 1: R.-U<CH HANDS VS. COMPARISONS -ADJUSTED
Occupational Difference of Adj. Means Category Group n Adj. Me,ao' (95% C.l.)· p-Value'
All Ranch Hand 854 212.3 -4J.3 -- 0.850 Comparison 1,229 212.6
Officer Ranch Hand 340 206.6 -3.8 -- 0.141 Comparison 489 210.4
Enlisted Flyer Ranch Hand 148 215.3 -1.2 -- 0.781 Comparison 184 216.4
Enlisted Ranch Hand 366 214.6 3.2 -- 0.197 Groundcrew Comparison 556 211.4
a Transformed from square root scale. b Difference of means after transformation to original scale; confidence interval on difference of means not presented because analysis was performed on square root scale. C P-value is based on difference of means on square root scale.
(e) MODEL 2: RANCH RANDS -'INITIAL DIOXIN - UNADJUSTED ',,' "
Initial Dioxin Category Summary Statistics '.
, Analysis ReS!IIts for Log, (Initial Dioxln)b "" '" '
Initial lIioxin 0 Meao' Adj. Mean" Low 158 205.9 205.7 0.017
Medium 159 215.1 215.1 High 159 217.9 218.2
, Transformed from square root scale. b Adjusted for percent body fat at the time of the blood measurement of dioxin.
", Slope (Std. Error)'
0.129 (0.046)
, Slope and standard error based on square root of cholesterol versus logz (initial dioxin).
Note: Low ~ 27-63 ppt; Medium ~ >63-152 ppt; High ~ >152 ppt.
, (d}MODEL 2:RANCHHANI>S .,.,1NITlALDIOXlN - ADJUSTED
, p-Value 0.005
Analysis Results for Lo&i:(lnitialDioxln) ,
Initial lIioxin 0 Adj.M~.n· p-VaI"" Low 158 209.0 0.044 0.083 (0.054) 0.122 Medium 158 215.9 Hi h 157 217.4
, Transformed from square root scale. b Slope and standard error based on square root of cholesterol versus logz (initial dioxin).
Note: Low ~ 27-63 ppt; Medium ~ >63-152 ppt; High ~ > 152 ppt.
13-75
Ta~/e 13-24. Analysis of Cholesterol (mgldl) (Continuous) (Continued) ,
(e),MQDEL3: RANCH HANDS AND COMPARISONS BY DIOXINCATEGQRY - UNADJUSTED
Difference of Adj.M.ean
I Dioxin Calegory Mean' Adj. Mean" vs. COlllparisons
p-Valued n (9S~C.I.)'
C01"parison 1,194 211.7 211.7
Bapkground RH 376 209.4 208.8 -2.9 -- 0.183 LowRH 236 209.1 209.3 -2.4 -- 0.351
HitRH 240 216.8 217.4 5.7 -- 0.032 Lo plus High RH 476 213.0 213.4 1.7 -- 0.422
, Transformed from square root scale. b Adjusted for percent body fat at the time of the blood measurement of dioxin. 'Di(ference of means after transformation to original scale; confidence interval on difference of means not presented bec~use analysis was performed on square root scale. d P-value is based on difference of means on square root scale.
Note: RH = Ranch Hand. Comparison: 1987 Dioxin:> 10 ppt. Background (Ranch Hand): 1987 Dioxin:> 10 ppt. Low (Ranch Hand): 1987 Dioxin> 10 ppt, 10 ppt < Initial Dioxin:> 94 ppt. High (Ranch Hand): 1987 Dioxin> 10 ppt, Initial Dioxin> 94 ppt.
(f) f\iODEL3: RANCHliANDS AND COMPARISONS BY DIOXIN CATEGORY - ADJUSTED
: Difference of Adj. Mean
1 DiO)<inCategory n Adj.Meau' " vs. Campansons
(9S%·C.L)' p-Value' i -,," d,
COl'lparison 1,193
Baqkground RH 374 LoW RH 235 HighRH 238 Low plus High RH 473
212.9
211.0 210.6 217.3 214.0
-1.9 ---2.3 --
4.4 -l.I --
0.392 0.389 0.115 0.616
• Tr~nsformed from square root scale. b Difference of means after transformation to original scale; confidence interval on difference of means not presented becal.se analysis was performed on square root scale. , P-~alue is based on difference of means on square root scale.
Not~: RH = Ranch Hand. , Comparison: 1987 Dioxin::; 10 ppt.
Background (Ranch Hand): 1987 Dioxin:> 10 ppt. Low (Ranch Hand): 1987 Dioxin> 10 ppt. 10 ppt < Initial Dioxin:> 94 ppt. High (Ranch Hand): 1987 Dioxin> 10 ppt, Initial Dioxin> 94 ppt.
(g) ~ODEL 4:' RANCH HANDS -1987DIOXIN ';'UNADJUSTED.
Analysis Resulls tor Log, (1987 Dioxin +1)
1~87 Di'l"in n
Low 283 Metlium 285
Hil1h 284
• Transformed from square root scale.
Me$pa
210.9 206.6 216.6
0.008
Adjusted Slor (Std. Error) .
0.077 (0.030)
b Slqpe and standard error based on square root of cholesterol versus log, (1987 dioxin + I).
Note: Low = :>7.9 ppt; Medium = >7.9-19.6 ppt; High = >19.6 ppt.
13-76
p-Value
0.009
.
--------·--------,--r--·---··-r----.----------'"---·---·---~--------------.----~.-.-.-'-" .. --.-------.- .. -.. ------.-.. ----
('" \) /
C 1 ,
Table 13-24. Analysis of Cholesterol (mg/dl) (Continuous) (Continued)
(h) MODEL 4: RANCH HANDS - 1987 DIOXIN - ADJUSTED
1987 Dioxin CategorySullllUllry Statistics . Analysis Results for lAg, (1987.Dioxin + I) 1~7 .
Dioxin Low Medium High
n
283 283 281
Adj. Mean'
214.9 209.6 216.8
R' 0.023
Adjusted Slo~e (Std. Error)
0.046 (0.034)
• Transformed from square root scale. b Slope and standard error based on square root of cholesterol versus log, (1987 dioxin + I).
Note: Low = 5.7.9 ppt; Medium = >7.9-19.6 ppt; High = >19.6 ppt.
p-Value
0.178
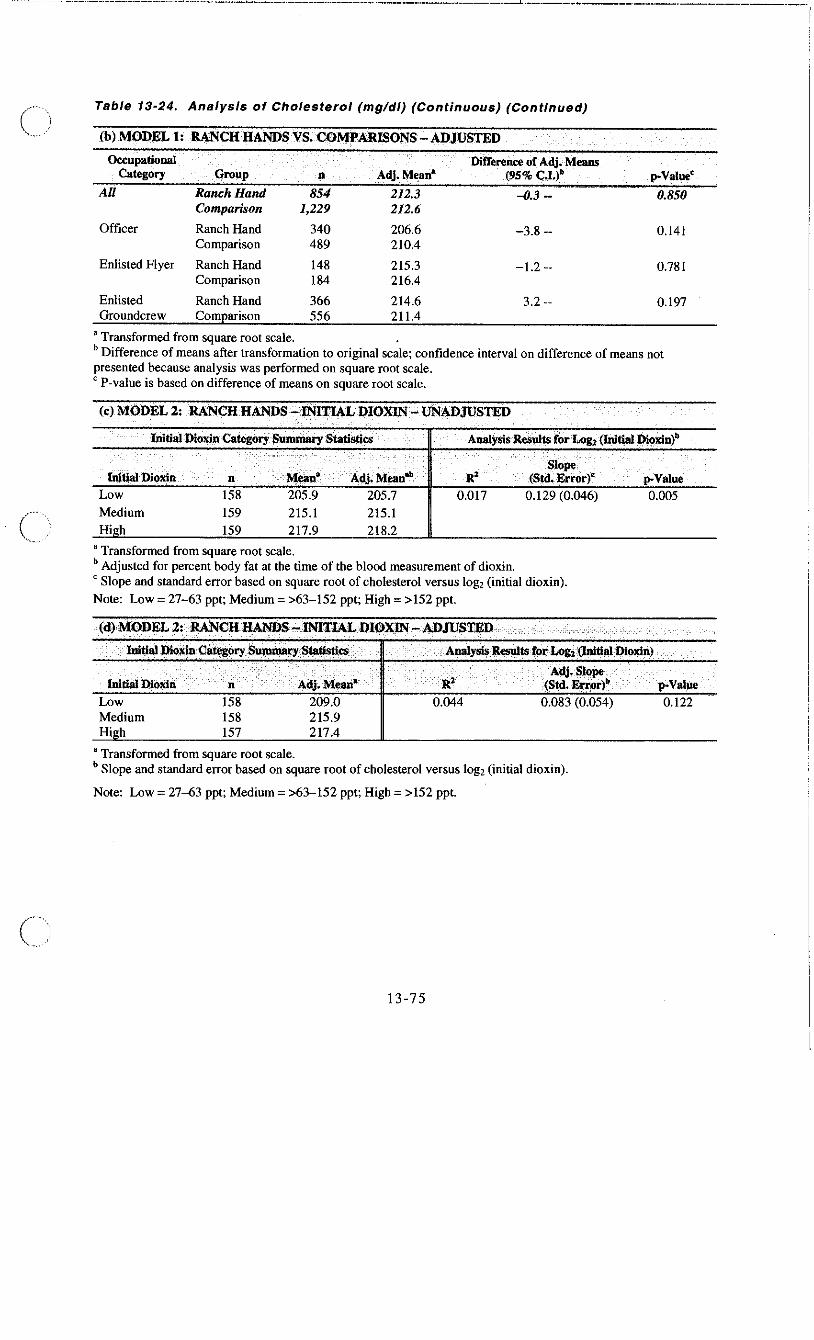
The unadjusted Model 2 analysis revealed a significant positive association between initial dioxin and cholesterol (Table 13-24(c): slope=0.129, p=O.OO5). After covariate adjustment, the relation became nonsignificant (Table 13-24(d): p=O.l22).
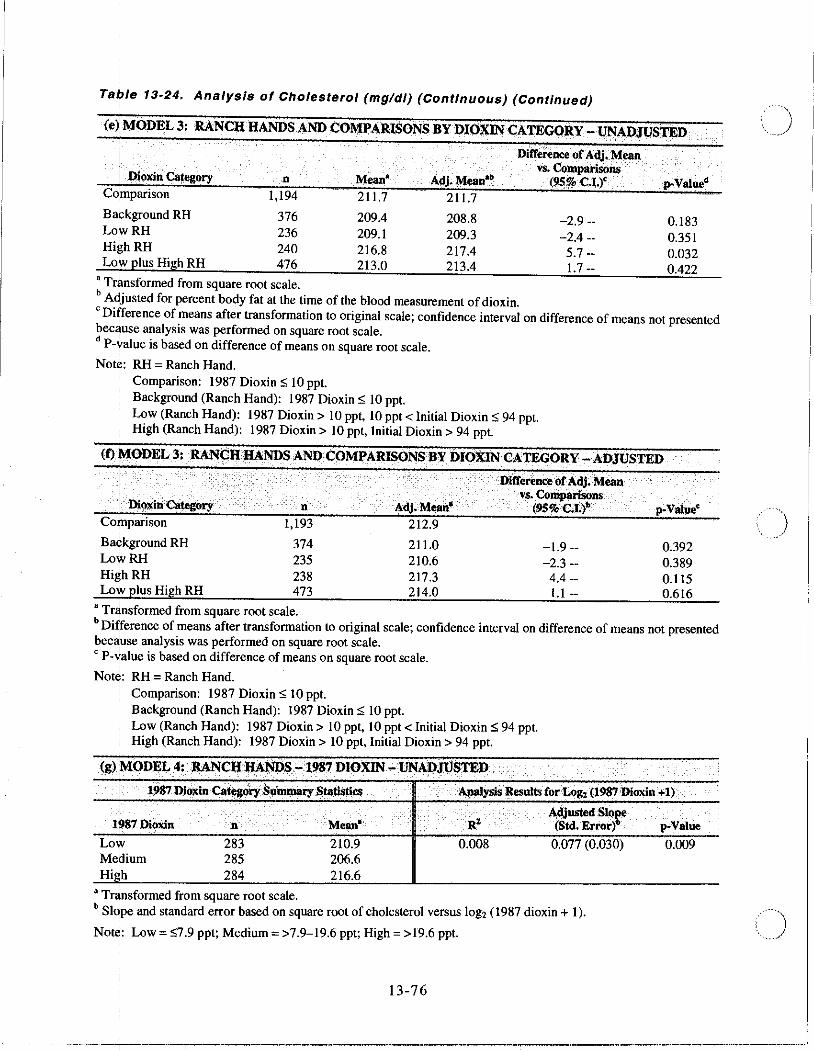
A significant difference between Ranch Hands in the high dioxin category and Comparisons was found in the unadjusted Model 3 analysis of cholesterol (Table 13-24(e): difference ofmeans=5.7 mgldl, p=O.032). The adjusted analysis revealed no significant contrasts (Table 13-24(f): p>O.11 for each contrast).
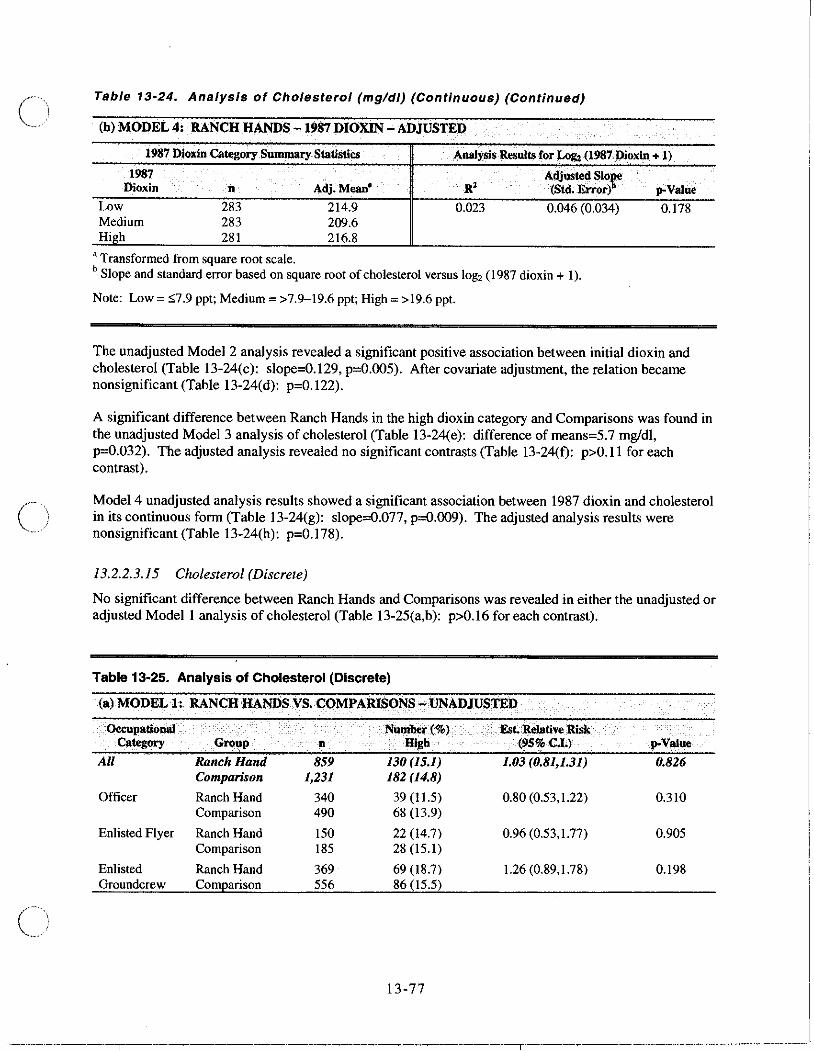
Model 4 unadjusted analysis results showed a significant association between 1987 dioxin and cholesterol in its continuous form (Table l3-24(g): slope=O.077, p,=O.OO9). The adjusted analysis results were nonsignificant (Table 13-24(h): p=O.l78).
13.2.2.3.15 Cholesterol (Discrete)
No significant difference between Ranch Hands and Comparisons was revealed in either the unadjusted or adjusted Modell analysis of cholesterol (Table 13-25(a,b): p>O.16 for each contrast).
Table 13-25. Analysis of Cholesterol (Discrete)
(a) MODEL 1: RANCH HANDS VS. COMPARISONS -UNADJUSTED
O<!cupational Number(%) Est. Relative Risk Categury Group n m~b . (9S%C.L) p-V!IIue
All Ranch Hand 859 130 (15.1) 1.03 (0.81,1.31) 0.826 Comparison 1,231 182 (14.8)
Officer Ranch Hand 340 39 (11.5) 0.80 (0.53,1.22) 0.310 Comparison 490 68 (13.9)
Enlisted Flyer Ranch Hand ISO 22 (14.7) 0.96 (0.53,1.77) 0.905 Comparison 185 28 (15.1)
Enlisted Ranch Hand 369 69 (18.7) 1.26 (0.89,1.78) 0.198 Groundcrew Comparison 556 86 (15.5)
13-77
--·-------'·--"--~·rT--~·-'--~-------·--·-'-------·-'-... ---------.--
Ta~/e 13-25. Analysis of Cholesterol (Discrete) (Continued)
(b)i MOD:EL 1: RANCH lIANDS VS,COMPAIUSONS -ADJUSTED I
I
Aul !
Oftcer
OcI:upational Category
Enlisted Flyer Enlisted Groundcrew
I
Adjusted Relative Risk (95% C,L)
1.04 (0.82,1.34)
0.80 (0.53,1.23) 1.00 (0.54,1.83) 1.28 (0.90,1.82)
(c) MODEL 2: RANCH HANDS - INITIAL DIOXIN -UNADJUSTED I: ' >_ • .
p-Value
0.726
0.312 0.993 0.167
I IOitiai Dio"illcategorySummary Statisti"" A)lalysis It,,,,ults forL9112 (Initial Dioxin)'
I Initial Number(%) I Dioxill .1\. mgb
LOt. 158 19 (12.0) Medium 159 31 (19.5) High 159 32 (20.1)
Estimated Relative Risk (9S% C.I.)'
1.21 (1.01,1.45)
• Adjusted for percent body fat at the time of the blood measurement of dioxin. b Relative risk for a twofold increase in initial dioxin.
Note: Low = 27-63 ppt; Medium = >63-152 ppt; High = >152 ppt. !
(d)!MODEL 2: RANCHHANDS-INmAL DIOXIN ... AD.JUSTED
n
473
... AnalysisResult$ for Log, i(liiitialDioxin)
Adjllsted Relative Risk . (9S%C.L)'
1.23 (0.99,1.52)
a Relative risk for a twofold increase in initial dioxin.
p-Value
0.036
p-Value 0.062
(e) /l.ic.:>:DEL 3:R.~NQiHANDS ,AND COMPARISONS B'yDIOXINCA TEGORY -UNADJUSTED
N'!imoof(%) i Dil'xi,jCa~gory 1\ •
CoiPparison 1,194 177 (14.8)
Ba<ikground RH 376 48 (12.8) Low RH 236 34 (14.4) Hi~h RH 240 48 (20.0) Low plus High RH 476 82 (17.2)
&t:.JtelativeRlsJ( . (95% C.L)"
0.80 (0.56,1.12) 0.98 (0.66,1.46) 1.51 (1.06,2.16) 1.22 (0.91,1.63)
• Relative risk and confidence interval relative to Comparisons. b Adjusted for percent body fat at the time of the blood measurement of dioxin.
Note: RH = Ranch Hand. Comparison: 1987 Dioxin" 10 ppt. Background (Ranch Hand): 1987 Dioxin" 10 ppt. Low (Ranch Hand): 1987 Dioxin> 10 ppt, 10 ppt < Initial Dioxin" 94 ppt. High (Ranch Hand): 1987 Dioxin> 10 ppt, Initial Dioxin> 94 ppt.
13-78
",Value
0.195 0.915 0.023 0.183
--~---~-.~-------r--.---"--r----------'---'----'---"------,--------.... ------.-.---.-,-.... --.~-.----.---.. -----..... -
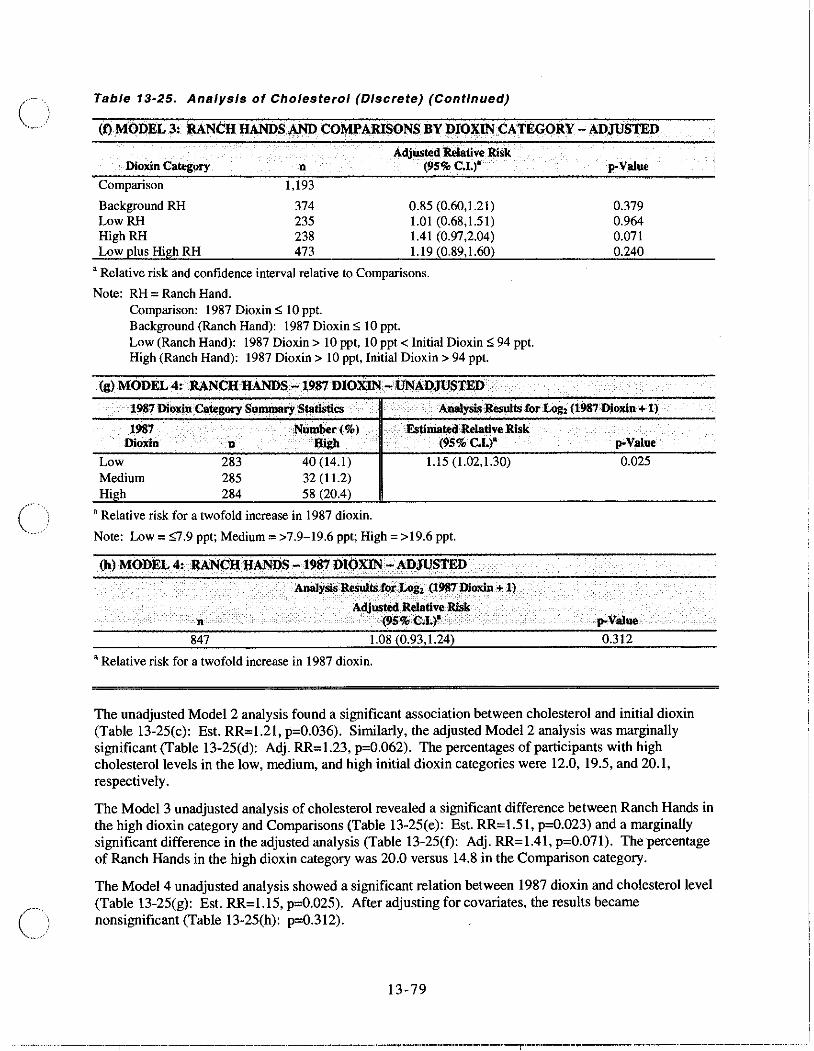
Table 13-25. Analysis of Cholesterol (Discrete) (Continued)
(f).MODEL3: RANCH HANDS AND COMJ.>A.RISONS BY DIO~JlII.CAtEGORY - ADJUSTED
Adjusted Relative Risk Dioxin Catego!')' n . (95% C,I,)'
Comparison 1,193
Background RH 374 0.85 (0.60,1.21) LowRH 235 1.01 (0.68,1.51) High RH 238 1.41 (0.97,2.04) Low plus High RH 473 1.\9 (0.89,1.60)
a Relative risk and confidence interval relative to Comparisons.
Note: RH = Ranch Hand. Comparison: 1987 Dioxin';; \0 ppt. Background (Ranch Hand): 1987 Dioxin';; \0 ppt. Low (Ranch Hand): 1987 Dioxin> \0 ppt, \0 ppt < Initial Dioxin';; 94 ppt. High (Ranch Hand): 1987 Dioxin> \0 ppt, Initial Dioxin> 94 ppt.
(g) MODEL 4: RANCH HANDS-1987DlOXIN-UNADJUSIED . ..
p-Value
0.379 0.964 0.071 0.240
.. 1987 DloxinCatego!,), SUO!JlI8rYSlalistics . ..•• . .. , '. AOaIysiscResuJls Cor Log, (1987 Dioxin + 1)
1987 . ' ··NunIDer(%)'> ;EstimatedRelativeRisk . . . Dioxin ; n ,fligh (95% C,L)' (>oValue
Low 283 40 (14.1) 1.15 (1.02,1.30) 0.Q25 Medium 285 32 (11.2) High 284 58 (20.4)
'Relative risk for a twofold increase in 1987 dioxin.
Note: Low = ';;7.9 ppt; Medium = >7.9-19.6 ppt; High = >19.6 ppt.
(h) MOD.EL 4, RANctillANJ)S -1987 DIOXJll/": ADJU.· STED ~' - ", ' , " '" -" ' " ,,',' ,-
847
AnalysiSResuJts.forJ:,og, (1987 Dioxin + 1)
Adjusted.RelativeRisk .. (9S%.C.L)~;
1.08 (0.93,1.24)
'Relative risk for a twofold increase in 1987 dioxin.
0.312
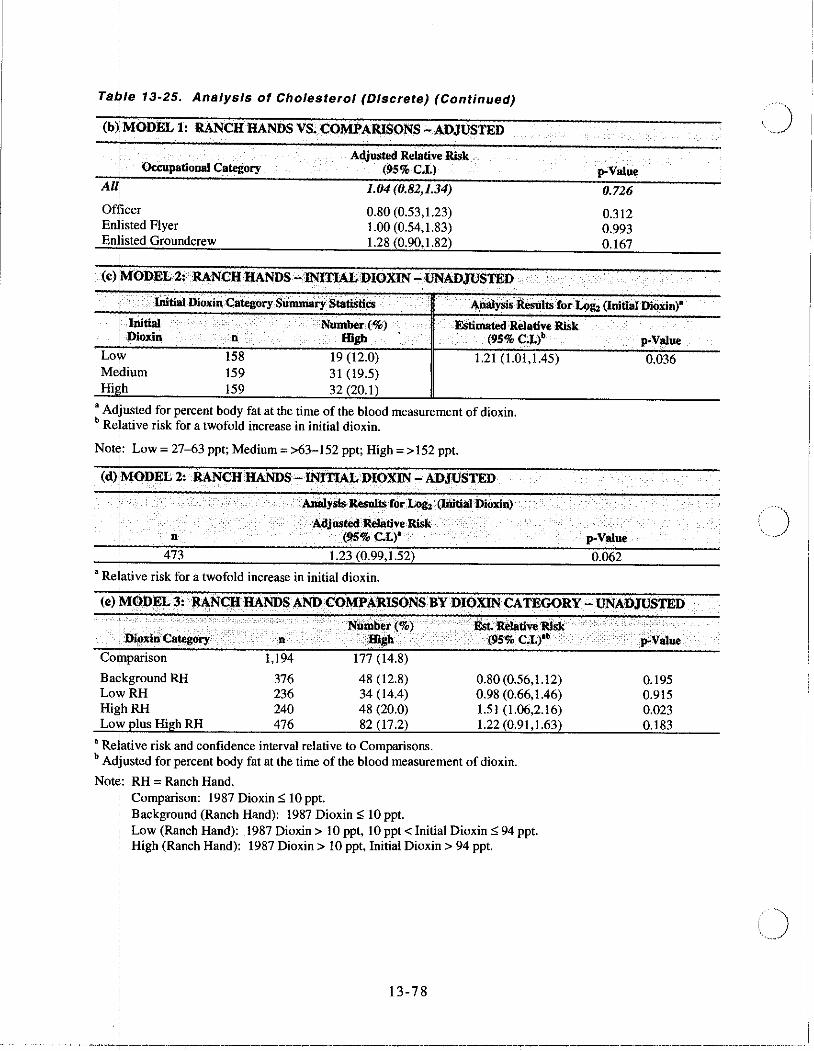
The unadjusted Model 2 analysis found a significant association between cholesterol and initial dioxin (Table 13-25(c): Est. RR=1.21, p=0.036). Similarly, the adjusted Model 2 analysis was marginally significant (Table 13-25(d): Adj. RR=1.23, p=0.062). The percentages of participants with high cholesterol levels in the low, medium, and high initial dioxin categories were 12.0, 19.5, and 20.1, respectively.
The Model 3 unadjusted analysis of cholesterol revealed a significant difference between Ranch Hands in the high dioxin category and Comparisons (Table 13-25(e): Est. RR=1.51, p=0.023) and a marginally significant difference in the adjusted analysis (Table 13-25(f): Adj. RR=1.41, p=,O.071). The percentage of Ranch Hands in the high dioxin category was 20.0 versus 14.8 in the Comparison category.
The Model 4 unadjusted analysis showed a significant relation between 1987 dioxin and cholesterol level (Table 13-25(g): Est. RR=1.15, p=0.025). After adjusting for covariates, the results became nonsignificant (Table 13-25(h): p=0.312).
13-79
........... _ ...... __ ._.,,_._. ___________ ._. _________ ._ .. _ ... _. ___ ._-,-._. ________ ._ .. _ .. __ .. _ .. __ ._. ___ ........ 1
J3.~.2.3.16 HDL Cholesterol (Continuous)
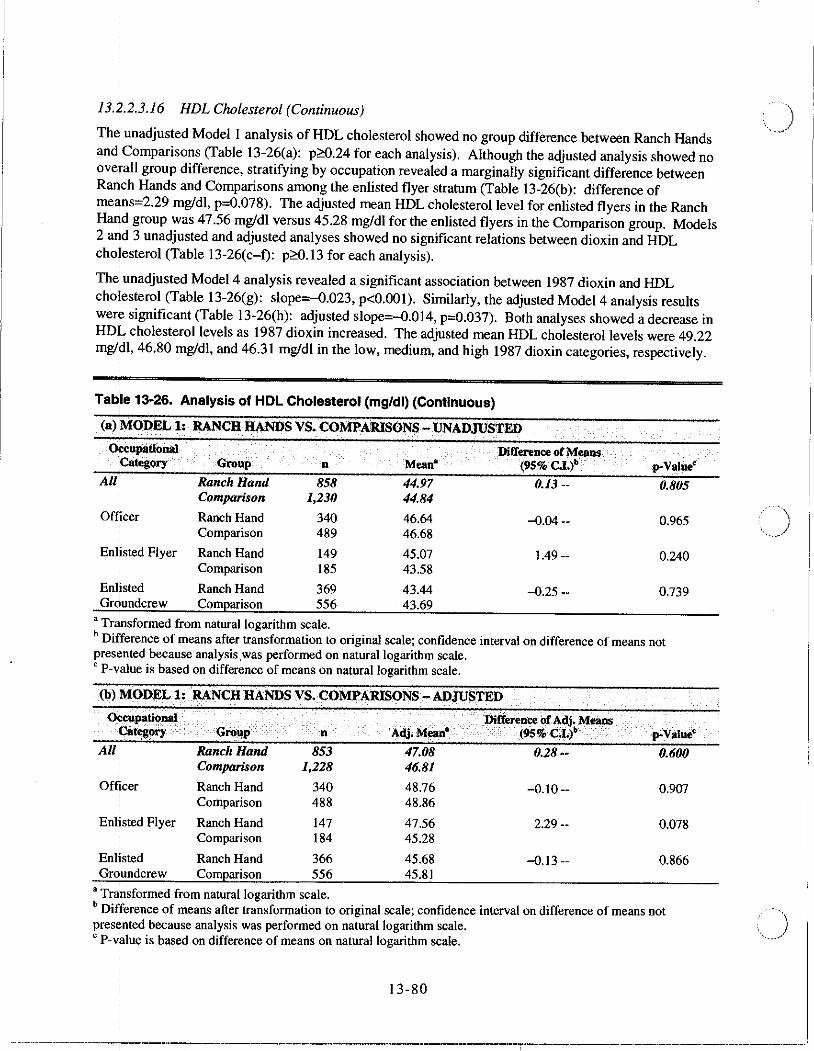
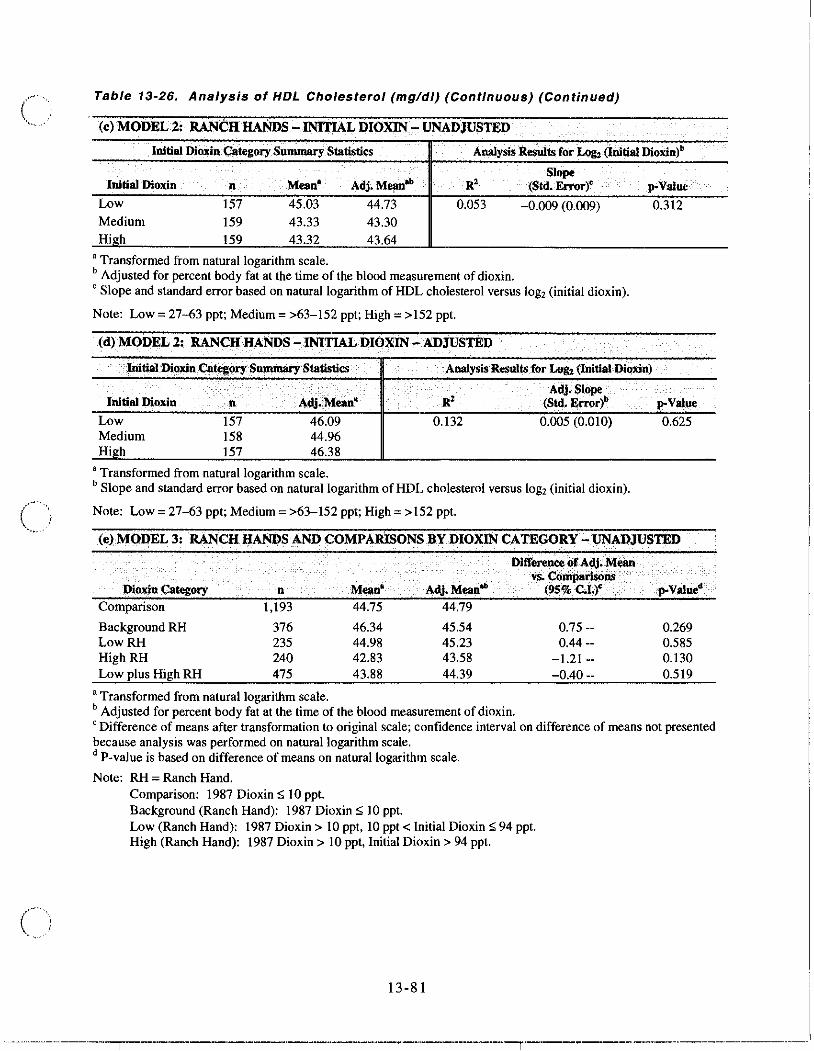
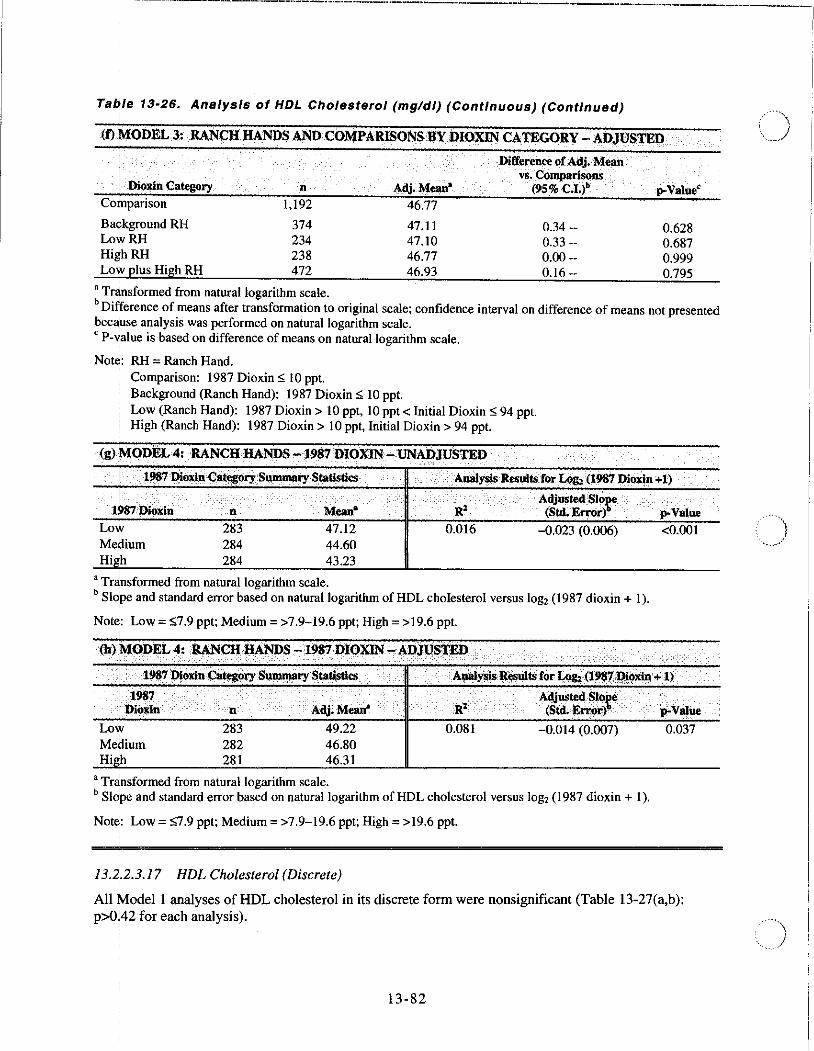
Thl'1 unadjusted Model I analysis of HDL cholesterol showed no group difference between Ranch Hands and;Comparisons (Table 13-26(a): p;::O.24 for each analysis). Although the adjusted analysis showed no overall group difference, stratifying by occupation revealed a marginally significant difference between Ral1ch Hands and Comparisons among the enlisted flyer stratum (Table J3-26(b): difference of meljns=2.29 mg/dl, p=0.078). The adjusted mean HDL cholesterol level for enlisted flyers in the Ranch Hand group was 47.56 mg/dl versus 45.28 mg/dl for the enlisted flyers in the Comparison group. Models 2 and 3 unadjusted and adjusted analyses showed no significant relations between dioxin and HDL cholesterol (Table 13-26(c-f): p;::O.13 for each analysis).
The: unadjusted Model 4 analysis revealed a significant association between 1987 dioxin and HDL cholesterol (Table J3-26(g): slope=-O.023, p<O.OOI). Similarly, the adjusted Model 4 analysis results were significant (Table 13-26(h): adjusted slope=-O.014, p=0.037). Both analyses showed a decrease in HDL cholesterol levels as 1987 dioxin increased. The adjusted mean HDL cholesterol levels were 49.22 mg/tll, 46.80 mg/dl, and 46.31 mg/dl in the low, medium, and high 1987 dioxin categories, respectively.
Tab,e 13-26. Analysis of HDL Cholesterol (mg/dl) (Continuous) I
(a) ~ODEL 1: RANCH HANDS VS. COMPA'RISONS- UNADJUSTED I
~p8donaI Categ<>ry I
All
Officer
Gr<>up n
Ranch Hand 858 Comparison 1,230
Ranch Hand 340 Comparison 489
Enlisted Flyer Ranch Hand 149 Comparison 185
EnlIsted Ranch Hand 369 Gr~underew Comparison 556
, Trl\nsformed from natural logarithm scale.
44.97 44.84
46.64 46.68
45.07 43.58
43.44 43.69
Difference of Means (95% C.l.)b
0.13 --
-0.04 --
1.49 --
-0.25 --
0.805
0.965
0.240
0.739
b Dif!ference of means after transformation to original scale; confidence interval on difference of means not pres¢nted because analysis.was performed on natural logarithm scale. , P-value is based on difference of means on natural logarithm scale.
i •
(b) f\!ODEL 1: .. RANCH HANDS VS. COMPARISONS - ADJUSTED
<*upall<>naI c::al~wy .
All
Officer
Group n
Ranch Hand 853 Comparison 1,228
Ranch Hand 340 Comparison 488
Enlisted Flyer Ranch Hand 147 Comparison 184
Enlisted Ranch Hand 366 Gr9underew Comparison 556
, Transformed from natural logarithm scale.
",dj. Mean'
47.08 46.81
48.76 48.86
47.56 45.28
45.68 45.81
. Dirt.renee of Adj. Means ·.(95%CJ.)b
0.28--
-0.10 --
2.29 --
-0.13 --
p:.Value'
0.600
0.907
0.Q78
0.866
b Difference of means after transformation to original scale; confidence interval on difference of means not prestinted because analysis was performed on natural logarithm scale. , P-value is based on difference of means on natural logarithm scale.
13-80
-.. ---------------r-.------,-----------.---.----.-----------------T------·-·---·--------------------------
(!
Table 13-26. Analysis of HDL Cholesterol (mg/dl) (Continuous) (Continued)
(c) MODEL 2: RANCH HANDS - INITIAL DIOXIN - UNADJUSTED
Initial Dioxin Category Summary Statistics Analysis Results for Log, (Initial Dioxin)" .
Initial Dioxin n Mean" Adj. Mean·b R' Low 157 45.03 44.73 0.053 Medium 159 43.33 43.30 High 159 43.32 43.64
, Transformed from natural logarithm scale. b Adjusted for percent body fat at the time of the blood measurement of dioxin.
Slope (Std. Error)'
-0.009 (0.009)
p-Value .
0.312
, Slope and standard error based on natural logarithm of HDl. cholesterol versus log, (initial dioxin).
Note: Low = 27-63 ppt; Medium = >63-152 ppt; High = >152 ppt.
(d) MODEL 2: RANCRHANDS - INITIAL DIOXIN - ADJUSTED '. ... .
AoaIysis Resull,'l for Log, (inItial Dioxin) . '.
Initial Dioxin n Adj. Mean' Low 157 46.09 Medium 158 44.96 High 157 46.38
R' 0.132
Adj. Slope (Std.li;rror)b
0.005 (0.010)
a Transformed from natural logarithm scale. b Slope and standard error based on natural logarithm of HDL cholesterol versus log, (initial dioxin).
Note: Low = 27-63 ppt; Medium = >63-152 ppt; High = > 152 ppt.
p-Value
0.625
(~)MODEL 3: RANCH H:ANDS AND COMPARISONS BY DIOXIN CATEGORY-UNADJUSTED
DifferenceofAdj;Ml'lIn
AdJ.M~n" vs. Coll1)i8r1sonS
p-Valued Dioxin Category 'n M~n· (95% C.L)' Comparison 1,193 44.75 44.79
Background RH 376 46.34 45.54 0.75 -- 0.269 LowRH 235 44.98 45.23 0044 -- 0.585 HighRH 240 42.83 43.58 -1.21 -- 0.130 l.ow plus High RH 475 43.88 44.39 -0040 -- 0.519
• Transformed from natural logarithm scale. b Adjusted for percent body fat at the time of the blood measurement of dioxin. , Difference of means after transformation to original scale; confidence interval on difference of means not presented because analysis was performed on natural logarithm scale. d P-value is based on difference of means on natural logarithm scale.
Note: RH = Ranch Hand. Comparison: 1987 Dioxin'; 10 ppt. Background (Ranch Hand): 1987 Dioxin'; 10 ppt. l.ow (Ranch Hand): 1987 Dioxin> 10 ppt, 10 ppt < Initial Dioxin'; 94 ppt. High (Ranch Hand): 1987 Dioxin> 10 ppt, Initial Dioxin> 94 ppt.
13-8\
........ - .. - ... --.-.,,--.-.----------.-.-------.--.-.. -.-----.--r.-.--------.... --.--.... - .. - ... - ...... -.-... --.
----__ ... ____ ._._M_._ .•. _. ____ ~··,_ ...... _. __ N .... __ M .. ___ •.• ____ •.•. _ •• ___ • ___ • _____ ~ ___ .•. _______ ....... _______ ._._._._ ... ___ • ____ .. ___ ._. __
Table 13-26. Analysis of HOL Cholesterol (mg/dl) (Continuous) (Continued)
(f) jdODEL3.: RANCH HANDS AND COMPARISONS 8Y DIOXIN CATEGORY - ADJUSTEQ
Difference of Adj. Mean vs. Comparisons
, DiOllin Category n ,\dj.Mean' (95% C.I.), p.Value' Cofuparison 1,192 46.77
Baqkground RH 374 47.11 0.34 -- 0.628 LowRH 234 47.10 0.33 -- 0.687 High RH 238 46.77 0.00 -- 0.999 Low plus High RH 472 46.93 0.16 -- 0.795
, Tr~nsformed from natural logarithm scale. b Difference of means after transformation to original scale; confidence interval on difference of means not presented becaflse analysis was performed on natural logarithm scale. , P-Yalue is based on difference of means on natural logarithm scale.
Not~: RH = Ranch Hand. Comparison: 1987 Dioxin $ 10 ppt. Background (Ranch Hand): 1987 Dioxin $ 10 ppt. Low (Ranch Hand): 1987 Dioxin> 10 ppt, 10 ppt < Initial Dioxin $ 94 ppt.
I High (Ranch Hand): 1987 Dioxin> 10 ppt, Initial Dioxin> 94 ppt.
(g)I\fODEL4:RANCH HANDS -1987 DIOXIN-.UNADJUS'l'ED
Analysis Results for L9g, (1987 Dioxjn +1) . ! ••.•..•
~,Di6"in Low Medium High
.0
283 284 284
Mean' 47.12 44.60 43.23
, Tr~lIsformed from natural logarithm scale.
, ...
0.016
Adjusted Slo:r (Std. Error)
--0.023 (0.006)
b Slope and standard error based on natural logarithm ofHDL cholesterol versus log, (1987 dioxin + I).
Not~: Low = $7.9 ppt; Medium = >7.9-19.6 ppt; High = >19.6 ppt.
p.Value <0.001
!. . . .' '.. ' (h)f\'I9DEL 4:RANCH.l:lAi'IDS ....;1987 DIOXIN - ADJUS:mo '. . .". . ' .. ..... .
11987 <, .. ' .• AdjnstedSlo:r .'. ! Di()~in" 0 Adj. Mean' . . R' (Std.Err,or) , !>'V"!""
Lo,\, 283 49.22 0.081 -0,014 (0.007) 0.037 Me\lium 282 46.80 High 281 46.31
, Transformed from natural logarithm scale. b Slope and standard error based on natural logarithm of HDL cholesterol versus log, (1987 dioxin + I).
Note: Low = $7.9 ppt; Medium = >7.9-19.6 ppt; High = >19.6 ppt.
13.2.2.3.17 HDL Cholesterol (Discrete)
All Modell analyses of HDL cholesterol in its discrete form were nonsignificant (Table 13-27(a,b); p>O!42 for each analysis).
13-82
()
C'\
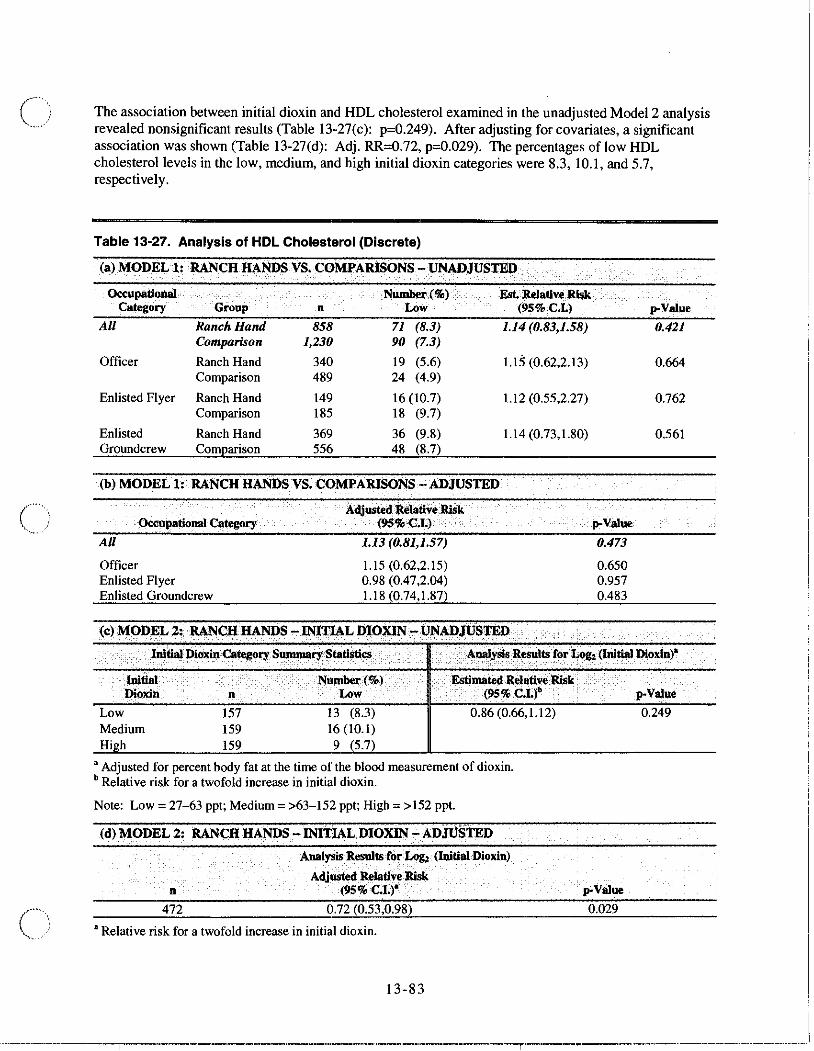
The association between initial dioxin and HDL cholesterol examined in the unadjusted Model 2 analysis revealed nonsignificant results (Table 13-27(c): p=0.249). After adjusting for covariates, a significant association was shown (Table 13-27(d): Adj. RR=O.72, p=0.029). The percentages of low HDL cholesterol levels in the low, medium, and high initial dioxin categories were 8.3,10.1, and 5.7, respectively.
Table 13-27. Analysis of HDL Cholesterol (Discrete)
(a) MODELl:RANCHHAIIlDS VS. COMPARISONS - UNADJUS'flID
OccupationaI Number;(%) Category Group n Low
All Ranch Hand 858 71 (8.3) Comparison 1,230 90 (7.3)
Officer Ranch Hand 340 19 (5.6) Comparison 489 24 (4.9)
Enlisted Flyer Ranch Hand 149 16 (10.7) Comparison 185 18 (9.7)
Enlisted Ranch Hand 369 36 (9.8) Groundcrew Comparison 556 48 (8.7)
(b) MODEL 1: RANCH HANDS VS. COMPARISONS - ADJUSTED
Occupational Category
All
Officer Enlisted Flyer Enlisted Groundcrew
Adjusted.ielativeRlsk (9S%C.I.)·
1.13 (0.81,1.57)
1.15 (0.62,2.15) 0.98 (0.47,2.04) 1.18 (0.74.1.87)
Est. Relative RIsk (9S%.C.L)
I.l4 (0.83,1.58)
1.15 (0.62,2.13)
1.12 (0.55,2.27)
1.14 (0.73,1.80)
(c) MODEL Z: RANCH HANDS -INITIAL DIOXlN- UNADJUSTlID
p-Value
0.473
0.650 0.957 0.483
p-Value
0.421
0.664
0.762
0.561
.. ;.. 1~tia1J)iclxia;categorr S~rrStati~cs . ... ...... ... .;. ;;.AIIIl\~.R~ts for~ (Initial Dioxin)'
lnliiaI . ; - ·C- Number (%) I.. . Estimated RelativeRlsk Dioxin n Low.·. . ··.;(9S:,!>C.I.)b .. ;
Low Medium High
157 13 (8.3) 0.86 (0.66,1.12) 159 16 (10.1) 159 9 (5.7)
• Adjusted for percent body fat at the time of the blood measurement of dioxin. b Relative risk for a twofold increase in initial dioxin.
Note: Low = 27-63 ppt; Medium = >63-152 ppt; High = > 152 ppt.
(d) MODEL 2: RANCH HANDS -INITIAL DIOXIN -ADJ()STED
n
472
Analysis Resultsfof Log, (lmtiaiDioxin)
Adjusted Relative Risk (95%C.1.)·
0.72 (0.53,0.98)
a Relative risk for a twofold increase in initial dioxin.
13-83
p-Value
0.249
p-Value
0.029
---~---------'--"IT--'-------'------'---"'-----'-'--'--... ------.----r.-.--.-.. ----.. -.... --... --.. --.-----.------------
. 1a"le 13-27. Analysis of HDL Cholesterol (Discrete) (Continued)
(d MODEL 3: RANCH HANDS AND COMPARISONS BY DIOXIN CATEGORY - UNADJUSTED
Number (%) Est. Relative Risk ; Dioxin Category n Low (95%C.I.)"
co\nparison 1,193 88 (7.4)
Background RH 376 33 (8.8) 1.35 (0.88,2.05) LowRH 235 19 (8.1) 1.07 (0.64,1.80) HighRH 240 19(7.9) 0.98 (0.58,1.65) Low plus High RH 475 38 (8.0) 1.02 (0.69,1.53)
a Re1ative risk and confidence interval relative to Comparisons. b A~usted for percent body fat at the time of the blood measurement of dioxin.
Note: RH = Ranch Hand. Comparison: 1987 Dioxin :f 10 ppt. Background (Ranch Hand): 1987 Dioxin :f 10 ppt. Low (Ranch Hand): 1987 Dioxin> 10 ppt, 10 ppt < Initial Dioxin :f 94 ppt. High (Ranch Hand): 1987 Dioxin> 10 ppt, Initial Dioxin> 94 ppt.
p-Value
0.170 0.798 0.937 0.910
(I) jl.IODEL 3: RANCHHA.NDS AND COMPARISONS BYDIOX!N CATEGORY - ADJUSTED , ""
Adjusted Relative Risk . Dl,!xin Category n (9S.% C.L)'
Comparison 1,192
Ba~kground RH 374 1.57 (1.()(),2.45) LowRH 234 1.09 (0.64,1.84) HighRH 238 0.80 (0.47,1.37)
, . 472 0.93 (0.62,1.40) Low plus HIgh RH
• Rel~tive risk and confidence interval relative to Comparisons.
Note: RH = Ranch Hand. Comparison: 1987 Dioxin :f 10 ppt. Background (Ranch Hand): 1987 Dioxin :f 10 ppt. Low (Ranch Hand): 1987 Dioxin> 10 ppt, 10 ppt < Initial Dioxin:f 94 ppt. High (Ranch Hand): 1987 Dioxin> 10 ppt, Initial Dioxin> 94 ppt.
(g) fiODEL4:. RANCH~S..,l"'$7DlOXnl/-tJNA~JU$TEQ ..
'p"V1lIue
0.049 0.761 0.416 0.731
1987 Nulnber(%) Estimated Relative Risk ;.. . .. i j)l~xin n . . .~w (!!5% C.I.)' p"Value·
Low 283 23 (8.1) 0.92 (0.78,1.09) 0.349 Medium 284 27 (9.5) High 284 21 (7.4)
• Relative risk for a twofold increase in 1987 dioxin.
Note: Low = :f7.9 ppt; Medium = >7.9-19.6 ppt; High = >19.6 ppt.
(h)\\,!ODEL 4: RANCH HANDS ,...1987 DlO~ - ApJUSTED I, .......•.. . Analysis Resulls for Log,(tm Dioxin+ 1)
Adjusted Relative Risk n (9S% C.I.)' p-Val.ue
846 0.82 (0.68,0.98) 0.029
• Rel~tive risk for a twofold increase in 1987 dioxin.
13-84
i "." •. _' __ ""_'."""_"."" "I . ····-··-· .. ---·--·-T-·---.. -,--.. ·------·---··--·-·-·--.. ---.-------------------.. -.-.. -.-.... --.-.... -----
( )
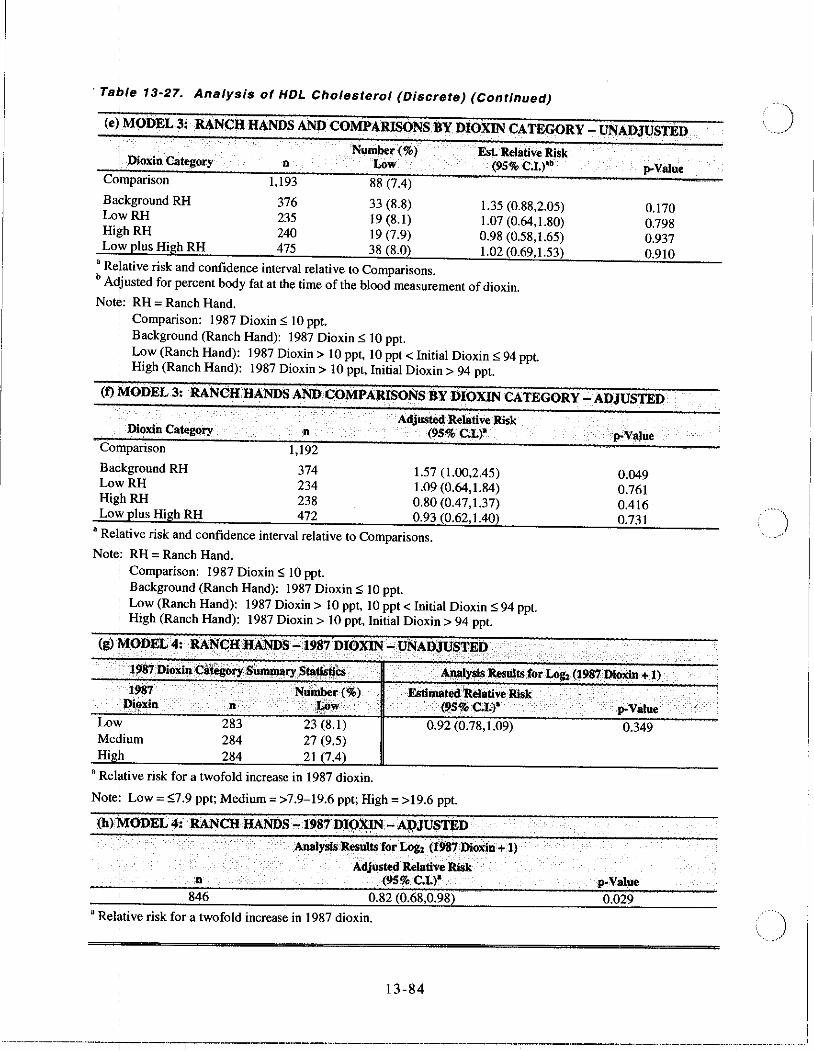
The unadjusted Model 3 analysis of HDL cholesterol did not show any of the Ranch Hand categories to be significantly different from the Comparison group (Table 13-27(e): p~.l7 for all contrasts). In the adjusted analysis, a significant difference between Comparisons and Ranch Hands in the background dioxin category was revealed (Table 13-27(f): Adj. RR= 1.57, p=0.049). The percentage of low HDL cholesterol values among Ranch Hands in the background dioxin category was 8.8 percent versus 7.4 percent for Comparisons.
The unadjusted Model 4 analysis showed nonsignificant results (Table 13-27(g): p=O.349). After covariate adjustment, a significant inverse relation between HDL cholesterol and 1987 dioxin level was shown (Table 13-27(h): Adj. RR=O.82, p=O.029). The percentages of low HDL cholesterol values in the low, medium, and high 1987 dioxin categories were 8.1, 9.5, and 7.4, respectively.
13.2.2.3.18 Cholesterol-HDL Ratio (Continuous)
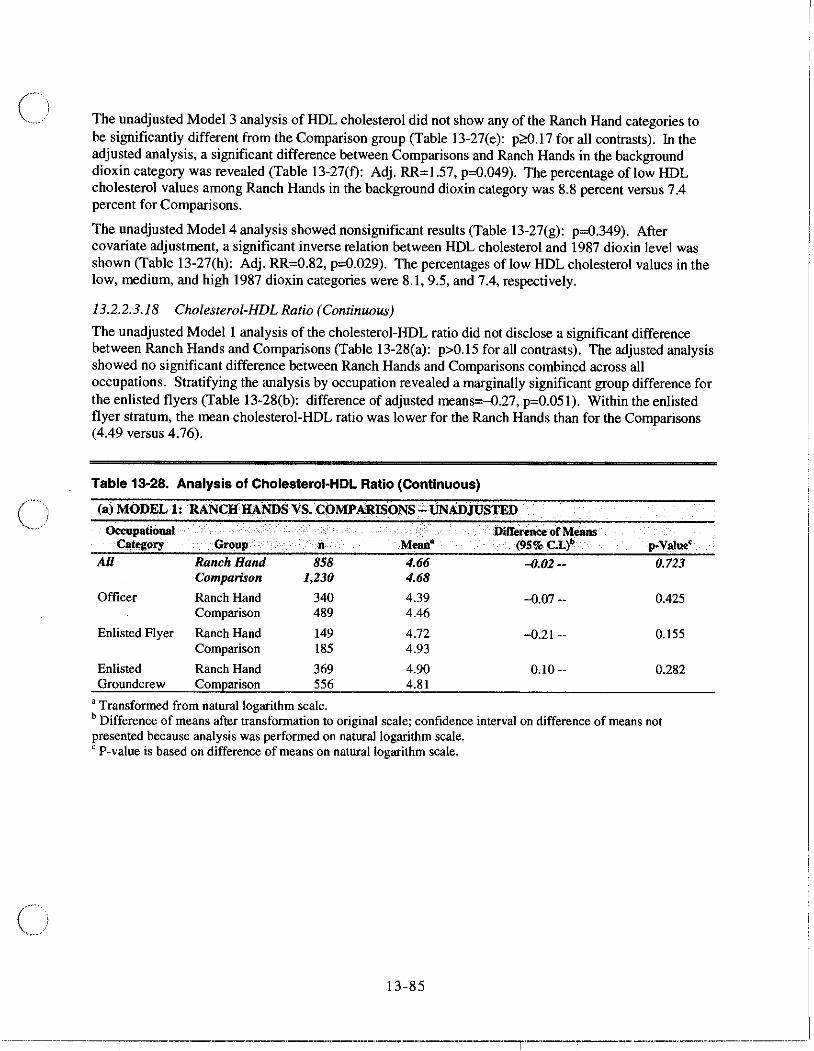
The unadjusted Model 1 analysis of the cholesterol-HDL ratio did not disclose a significant difference between Ranch Hands and Comparisons (Table 13-28(a): p>0.15 for all contrasts). The adjusted analysis showed no significant difference between Ranch Hands and Comparisons combined across all occupations. Stratifying the analysis by occupation revealed a marginally significant group difference for the enlisted flyers (Table 13-28(b): difference of adjusted means=-0.27. p=0.051). Within the enlisted flyer stratum, the mean cholesterol-HDL ratio was lower for the Ranch Hands than for the Comparisons (4.49 versus 4.76).
Table 13·28. Analysis of Cholesterol·HDL Ratio (Continuous)
(a) MODEL 1: RANCH HANDS VS.C.QMPARISONS - UNADJUSTED
Occupational DiITe......eeof.M ...... Category Group D Mean- (95% C.L)" p-Value'
All Ranch Hand 858 4.66 ... {J.02 .. 0.723 Comparison 1,230 4.68
Officer Ranch Hand 340 4.39 -0.07 -- 0.425 Comparison 489 4.46
Enlisted Flyer Ranch Hand 149 4.72 -0.21 -- 0.155 Comparison 185 4.93
Enlisted Ranch Hand 369 4.90 0.10 -- 0.282 Groundcrew Comparison 556 4.81
, Transformed from natural logarithm scale. b Difference of means after transformation to original scale; confidence interval on difference of means not presented because analysis was performed on natural logarithm scale. , P-value is based on difference of means on natural logarithm scale.
13-85
----.. ~~--rr--·----· ...... --... --·-·-.. ---... --'--·-.. -----·-_r·-·-......... ---........... --.. - .. --.-.-.. ---.--... --- I
Ta~/e 13-28. Analysis of Cholesterol-HDL Ratio (Continuous) (Continued)
(b)'!MODEL 1: RANCH HANDS Vs. COMPARISONS -.ADJUSTED
~pationaI K::/ItegQry
Au'.
Oftlicer
Group n
Ranch Hand 853 Comparison 1,228
Ranch Hand 340 Comparison 488
I. Enl/sted Flyer Ranch Hand 147
Comparison 184
Enl/sted Ranch Hand 366 Grqundcrew Comparison 556
Adj. Mean'
4.48 4.51
4.21 4.27
4.49 4.76
4.67 4.58
Diff.rell« of Adj. Means (95% C.I.)"
-{).03 _.
--0.06 ..
-0.27 --
0.08 --
p-Value'
0.546
0.446
0.051
0.316
• Tr~nsformed from natural logarithm scale. b Di~ference of means after transformation to original scale; confidence interval ~m difference of means not pres~nted because analysis was performed on natural logarithm scale. , P-value is based on difference of means on natural logarithm scale.
(c) j\1'ODEL 2: RANCHH.AJlIDs - INITIAL DIOXIN - UNADJUS11i:D
'. Analysis Results for I..og, (Initial Dioxin)"
InItial Dioxin n Mean' Adj. Mean" R' Slope
(Std. Error)' p-Value LoW 157 4.52 4.55 0.055 0.028 (0.009) 0.003 Medium 159 4.92 4.93 High 159 4.99 4.96
• Tr,*,sformed from natural logarithm scale. " Adjusted for percent body fat at the time of the blood measurement of dioxin. , Slope and standard error based on natural logarithm of cholesterol-HDL ratio versus log, (initial dioxin).
Note,: Low = 27-63 ppt; Medium = >63-152 ppt; High = >152 ppt.
(d)ijODEL 2:. RANCH HANDS -INlTIALDIOXIN- ADJUSn;D
ilDllialDibJ\inCalkgorySummary Statisti<s ,. . ··Anlii~R!l$DltsforLog. (I'nl~al DiOXin) . . • , .' " ". .•.. . '.. ..•. .... .. ·.Adj,·Slope
:ml~a1 Dioxin n Adj. Mean' It' (Std"Error)" p-Value Low 157 4.49 0.118 0.007 (0.01 1) 0.499 Me<ilium 158 4.77 Hi,,;" 157 4.66 ,
• Transformed from natural logarithm scale. " Slope and standard error based on natural logarithm of cholesterol-HDL ratio versus log, (initial dioxin).
Note: Low = 27-63 ppt; Medium = >63-152 ppt; High = > 152 ppt.
13-86
-------.-------.,-.---.. ...,---... ------.---.. --.-------.. ----- .. -------T------.. ---·--.. --.. -------.. -.... -------
(
c)
Table 13-28. Analysis of Cholesterol-HDL Ratio (Continuous) (Continued)
(e) MODEL 3: ~ANCH. HANDS AND COMPA~ISONS BY DIOXINCATEGO~Y - UNADJUSTED
DilTerence of Adj. Mean
Dioxin Category n Mean" Adj. Mean'b vs.Comparisons
(95% C.I.)' p-Valued
Comparison 1,193 4.69 4.69
Background RH 376 4.49 4.55 -0.14 -- 0.068 LowRH 235 4.60 4.58 -0.11 -- 0.220 HighRH 240 5.02 4.95 0.26 -- 0.005 Low plus High RH 475 4.81 4.76 0.07 -- 0.282
, Transformed from natural logarithm scale. b Adjusted for percent body fat at the time of the blood measurement of dioxin. 'Difference of means after transformation to original scale; confidence interval on difference of means not presented because analysis was performed on natural logarithm scale. d P-value is based on difference of means on natural logarithm scale.
Note: RH = Ranch Hand. Comparison: 1987 Dioxin';; 10 ppt. Background (Ranch Hand): 1987 Dioxin';; 10 ppt. Low (Ranch Hand): 1987 Dioxin> 10 ppt, 10 ppt < Initial Dioxin';; 94 ppt. High (Ranch Hand): 1987 Dioxin> 10 ppt, Initial Dioxin> 94 ppt.
(t) MODEL 3: RANc:HHANPS AND COMPARISONS BY DIOXIN CATEGORY -ADJUSTED
Ditterence of Adj: Mean
Dio~n -Category n Adj;Mean' vs. Comparisons
(95% C~)' p-Value' Comparison 1,192 4.52
Background RH 374 4.45 -0.07 -- 0.352 LowRH 234 4.43 -0.09 -- 0.289 High RH 238 4.61 0.09 -- 0.290 Low plus High RH 472 4.52 0.00 -- 0.978
• Transformed from natural logarithm scale. b Difference of mcttns after transformation to original scale; confidence interval on difference of means not presented because analysis was performed on natural logarithm scale. 'P-value is based on difference of means on natural logarithm scale.
Note: RH = Ranch Hand. Comparison: 1987 Dioxin';; 10 ppt. Background (Ranch Hand): 1987 Dioxin';; 10 ppt. Low (Ranch Hand): 1987 Dioxin> 10 ppt, 10 ppt < Initial Dioxin';; 94 ppt. High (Ranch Hand): 1987 Dioxin> 10 ppt, Initial Dioxin> 94 ppt.
(g) MODEL 4: RANCH HANDS -1987 DIOXIN - UNADJUSTED . .
1987 Di .. in Category Summary Statistics Analysis Results for Log, (1987 Dioxin +1)
1987 Dioxin
Low Medium Hi~h
n
283 284 284
, Transformed from natural logarithm scale.
4.44 4.59 4.97
.
R' 0.030
Adjusted Slo~e (Std, Error)
0.033 (0.007)
p-Valne
<0.001
b Slope and standard error based on natural logarithm of cholesterol-HDL ratio versus log, (1987 dioxin + I).
Note: Low = ';;7.9 ppt; Medium = >7.9-19.6 ppt; High = >19.6 ppt.
13-87
•
-----------·rr--·----·------·--·------·-'----·.-.---'--,·-.----------." ... ---.------.-------... -.-
Ta"'e 13-28. Analysis of Cholesterol-HDL Ratio (Continuous) (Continued)
(h)iMODEL 4: RANOH.HANDS -1987DIOXIN - ADJP8'fEl)
.. 1 1987 Dioxin Categol"fSummary Staflsflcs Analysis ResUJtsforLog.(I987 Dioxin + 1) , 1987 I Dioxin n Adj. Mean'
... Adjusted SIO~ . Rl (Sid. Error) . p-Value
Low 283 4.34 0.074 0.021 (0.007) 0.006 M4Jium 282 4.44 High 281 4.65
, Trdnsformed from natural logarithm scale. b Sl~pe and standard error based on natural logarithm of cholesterol-HDL ratio versus log2 (1987 dioxin + I).
Note: Low = :5.7.9 ppt; Medium = >7.9-19.6 ppt; High = >19.6 ppt.
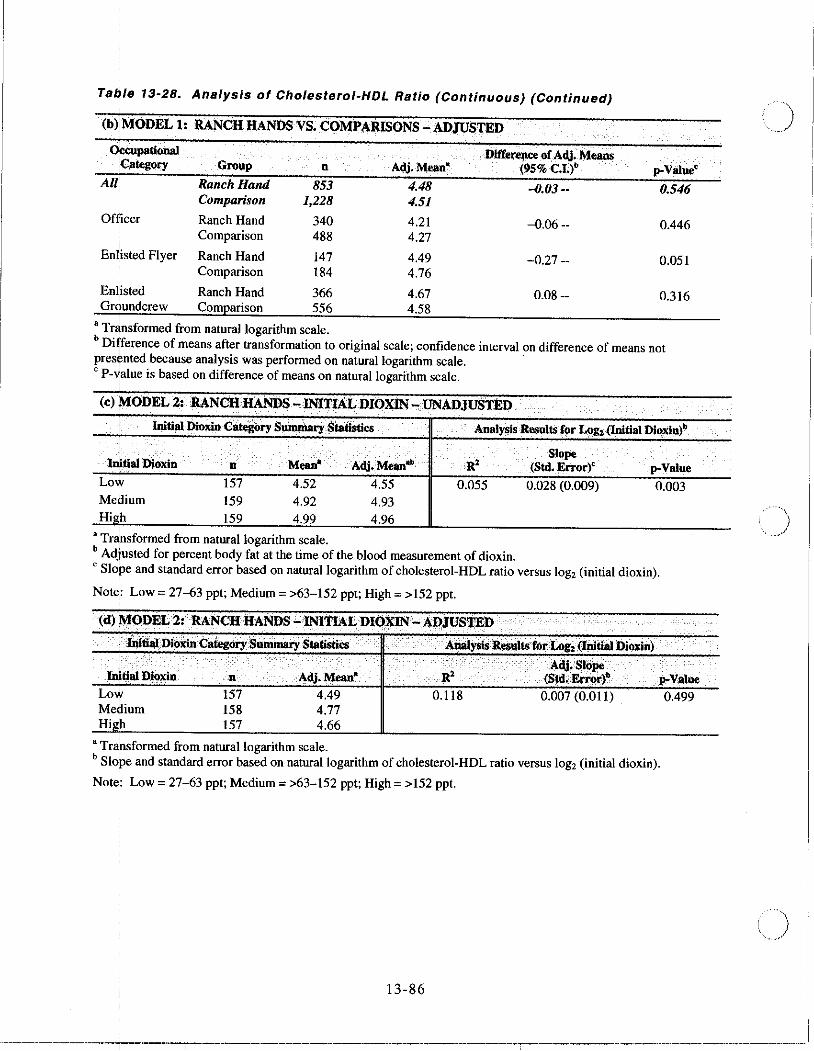
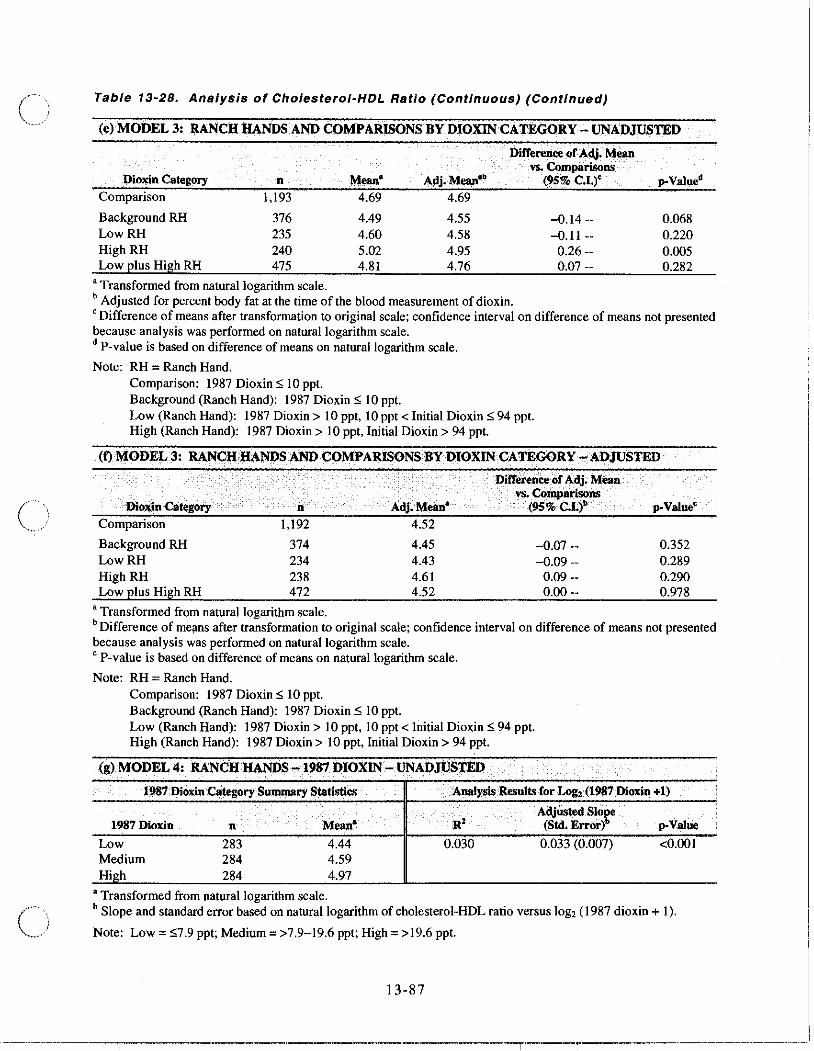
A significant association between initial dioxin and the cholesterol-HDL ratio was seen in the Model 2 una~justed analysis (Table 13-28(c): slope=O.028, p=0.OO3). The adjusted analysis results were non$ignificant (Table 13-28(d): p=0.499).
Theiunadjusted Model 3 analysis revealed significant differences between Ranch Hands in the bac*ground category and Comparisons, as well as between Ranch Hands in the high dioxin category and conitparisons (Table 13-28( e): difference of means=-0.14, p=0.068; difference of means=O.26, p=0.OO5, reswctively). The adjusted Model 3 analysis did not show any of the Ranch Hand categories to be significantly different from the Comparison group (Table 13-28(t): p>O.28 for each analysis).
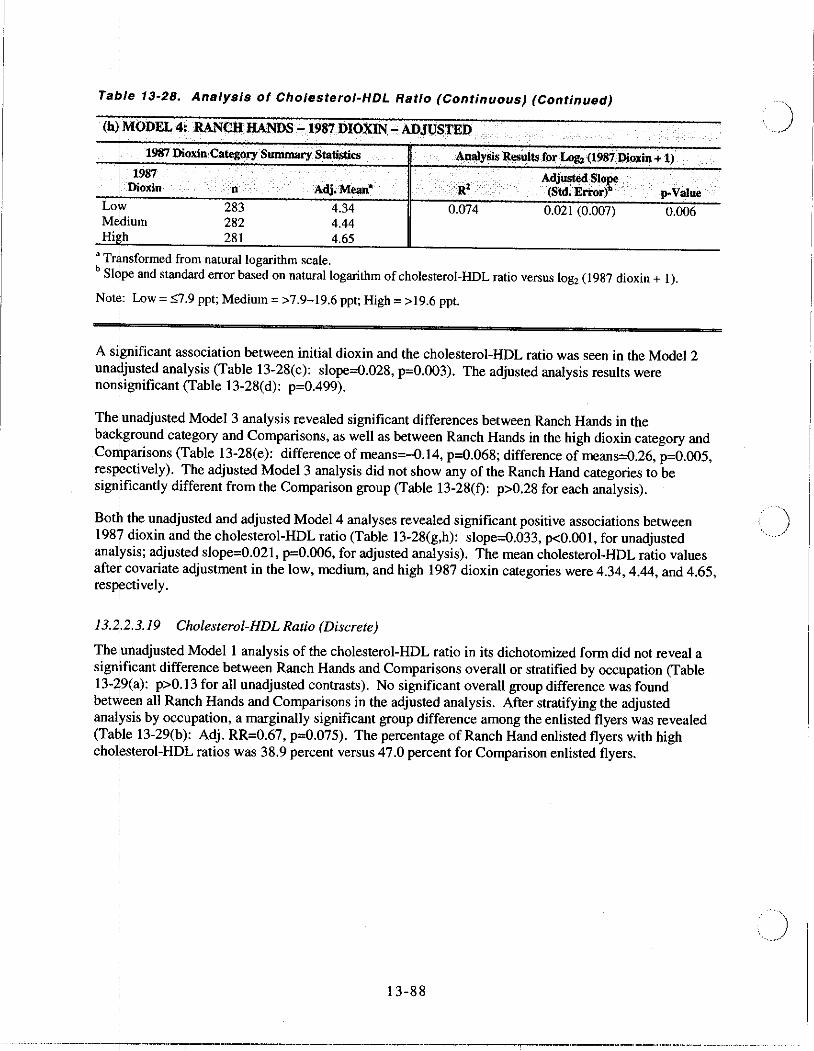
Botl) the unadjusted and adjusted Model 4 analyses revealed significant positive associations between 1987 dioxin and the cholesterol-HDL ratio (Table 13-28(g,h): slope=O.033, p<O.OOI, for unadjusted anal~sis; adjusted slope=0.021, p=0.OO6, for adjusted analysis). The mean cholesterol-HDL ratio values aftet covariate adjustment in the low, medium, and high 1987 dioxin categories were 4.34, 4.44, and 4.65, resPfctively.
13.2.2.3.19 Cholesterol-HDL Ratio (Discrete)
The iunadjusted Model 1 analysis of the cholesterol-HDL ratio in its dichotomized form did not reveal a significant difference between Ranch Hands and Comparisons overall or stratified by occupation (Table 13-~9(a): p>O.I3 for all unadjusted contrasts). No significant overall group difference was found bet~een all Ranch Hands and Comparisons in the adjusted analysis. After stratifying the adjusted anal~sis by occupation, a marginally significant group difference among the enlisted flyers was revealed (Tatile 13-29(b): Adj. RR=0.67, p=0.075). The percentage of Ranch Hand enlisted flyers with high chol~sterol-HDL ratios was 38.9 percent versus 47.0 percent for Comparison enlisted flyers.
13-88
----------_ ... _--------,_._-_ .. -,-----.-----_._-_ .. --_._-_ .. _-----_.-----------_ .. _.-. __ .... __ ._ .. __ . __ .. -.. _---_ .• _ .•
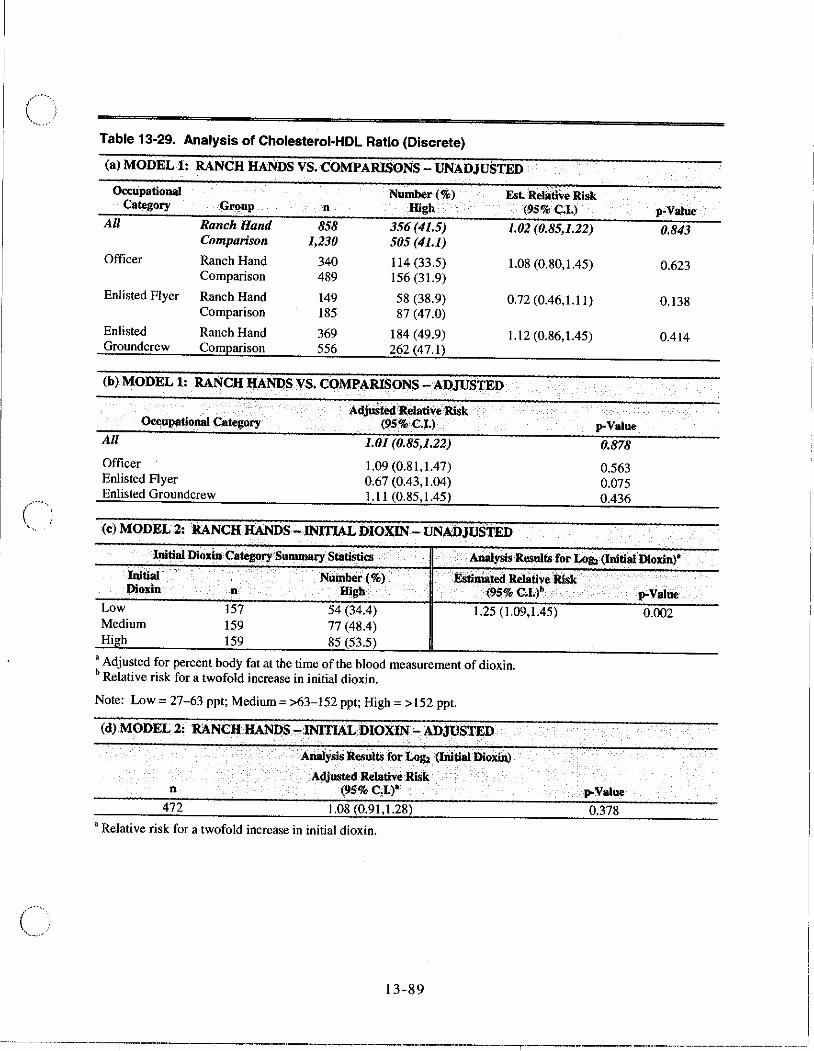
Table 13-29. Analysis of Cholesterol-HDL Ratio (Discrete)
(a) MODEL 1: RANCH HANDS VS. COMPARISONS - UNADJUSTED
Occupational NlDIIber (%) Category Group n Higb
All Ranch Hand 858 356 (41.5) Comparison 1,230 505 (41.1)
Officer Ranch Hand 340 114 (33.5) Comparison 489 156 (31.9)
Enlisted Flyer Ranch Hand 149 58 (38.9) Comparison 185 87 (47.0)
Enlisted Ranch Hand 369 184 (49.9) Groundcrew Comparison 556 262 (47.1)
(b) MODEL 1: RANCH HANDS VS. COMPARISONS - ADJUSTED
Oecupational Category
All
Officer Enlisted Flyer Enlisted Groundcrew
Adju8fed~elativeRisk (95%C.l.)
1.01 (0.85,1.22)
1.09 (0.81,1.47) 0.67 (0.43,1.04) 1.11 (0.85,1.45)
Est.ReI~il"e Risk (95% C.L)
1.02 (0.85,1.22)
1.08 (0.80,1.45)
0.72 (0.46,1.11)
1.12 (0.86,1.45)
(c) MODEL 2: RANCH HANDS-INITIAL DIOXIN - UNADJUSTED
p-Value
0.878
0.563 0.D75 0.436
p·Value
0.843
0.623
0.138
0.414
Initial Dioxin,Category'Summary Statistics .",' I, , "",'AnalysisResuUsfor Log, (lnltlalDioxin)'
Initial Nllillber(%) . Eslhuated.Rehltlve Risk . '.' .. ' . Dioxin n High (95% C.I.)" p-Value
Low 157 54 (34.4) 1.25 (1.09,1.45) 0.002 Medium High
159 77 (48.4) 159 85 (53.5)
, Adjusted for percent hody fat at the time of the blood measurement of dioxin. "Relative risk for a twofold increase in initial dioxin.
Note: Low = 27-63 ppt; Medium = >63-152 ppt; High = >152 ppt.
(d) MODEL 2: RANCHHANDS,..INITlAL DIOXIN - ADJUSTED
n
472
. Analysis Results for Log, (lnitial Dioxin) .
Adjusted Relative Rl~k. (95% CJ.)'
1.08 (0.91,1.28)
a Relative risk for a twofold increase in initial dioxin.
13-89
p-Value
0.378
-- --------------------iT-·------------·----'--------'--·-.. -------.-----,'----.------,.--".--".--.. -.---.---.-----.. -,-,-------
Tab'le 13-29. Analysis of Cholesterol-HDL Ratio (Discrete) (Continued)
(e)jiiOD)<:L 3.: RANCH HANDS AND COMPARISONS BY DIOXIN CATEGORY - UNADJUSTED , Number(%) Est. Relative .Risk I ! Dioxin Category n Hlgh (95% C,I.)"
COlj:lparison 1,/93 492 (41.2)
Bac)<ground RH 376 136 (36.2) 0.88 (0.69,1.13) LowRH 235 86 (36.6) 0.80 (0.60,1.07) HignRH 240 130 (54.2) 1.57 (!.l8,2.08) Low plus High RH 475 216 (45.5) 1.12 (0.90,1.40)
'Rellitive risk and confidence interval relative to Comparisons. b Adjusted for percent body fat at the time of the blood measurement of dioxin.
Note; RH = Ranch Hand. Comparison: 1987 Dioxin'; 10 ppt. Background (Ranch Hand): 1987 Dioxin'; 10 ppt. Low (Ranch Hand): 1987 Dioxin> 10 ppt, 10 ppt < Initial Dioxin'; 94 ppt. High (Ranch Hand): 1987 Dioxin> 10 ppt, Initial Dioxin> 94 ppt.
p-Value
0.321 0.135 0.002 0.295
(f) t{tODEL 3: RANCH .HANDS AND COMPARISONS BYDlOXIN CATEGORY - ADJUSTED
j Dioxin Category n
COI1lparison 1,192
Adjusted RelallveRisk (~S%C.I.)·
Bac/<ground RH 374 1.00 (0.77,1.28) Lovi RH 234 0.83 (0.61,!.l2) High RH 238 1.26 (0.93,1.69) Lo, plus High RH 472 1.02 (0.82,1.28)
'Rel~tive risk and confidence interval relative to Comparisons.
Note! RH = Ranch Hand . . Comparison: 1987 Dioxin'; 10 ppt.
Background (Ranch Hand): 1987 Dioxin'; 10 ppt. Low (Ranch Hand): 1987 Dioxin> 10 ppt, 10 ppt < Initial Dioxin'; 94 ppt. High (Ranch Hand): 1987 Dioxin> 10 ppt, Initial Dioxin> 94 ppt.
(g)\tfODEL 4: • RANCH HANDS -1987 DIOXIN -UNADJUSTED I
p-Value
0.982 0.221 0.133 0.849
I 1987 Dioxin Category Summary Sta.tistics AnalyslsResults for ~ (1987 Dioxin + 1)
I 1987 Number (%) !Dioxin n High .
Lo\\( 283 104 (36.7) Medium 284 98 (34.5) Hig\! 284 150 (52.8)
'Relative risk for a twofold increase in 1987 dioxin.
EsllDiated Relative Risk (95% .<::'1.)"
1.22 (l.ll, 1.34)
Note: Low = ';7.9 ppt; Medium = >7.9-19.6 ppt; High = >19.6 ppt.
13-90
p-Valne
<0.001 .
() ~""
Table 13-29. Analysis of Cholesterol-HDL Ratio (Discrete) (Continued)
(b) MODEL 4: RANCH HANDS- 198'1 DXOXlN - ADJUSTED
n 846
Analysis Results for Log, (1987 Dioxin + 1)
Adjusted Relative Risk (9S%CJ.)'
1.13 (1.01,1.26)
, Relative risk for a twofold increase in 1987 dioxin.
p-Value 0.025
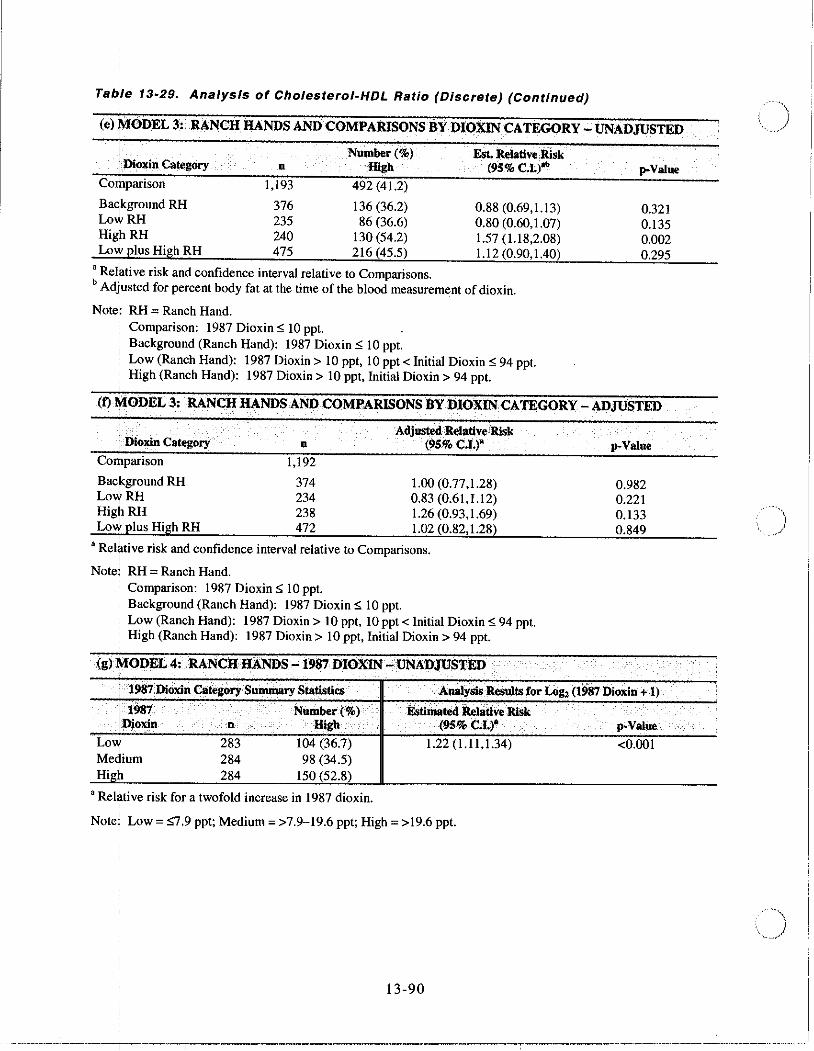
A significant positive association between the cholesterol-HOL ratio and initial dioxin was shown in the unadjusted Model 2 analysis (Table 13-29(c): Est. RR=,1.25, p=0.002). After adjustment for covariates, the analysis results were nonsignificant (Table 13-29(d): p=O.378).
The Model 3 unadjusted analysis of the cholesterol-HOL ratio revealed a significant difference between Ranch Hands in the high dioxin category and Comparisons (Table 13-29(e): Est. RR=1.57, p=0.OO2). All contrasts between the Ranch Hand categories and Comparisons were nonsignificant in the adjusted analysis (Table 13-29(0: p>O.l3 for each contrast).
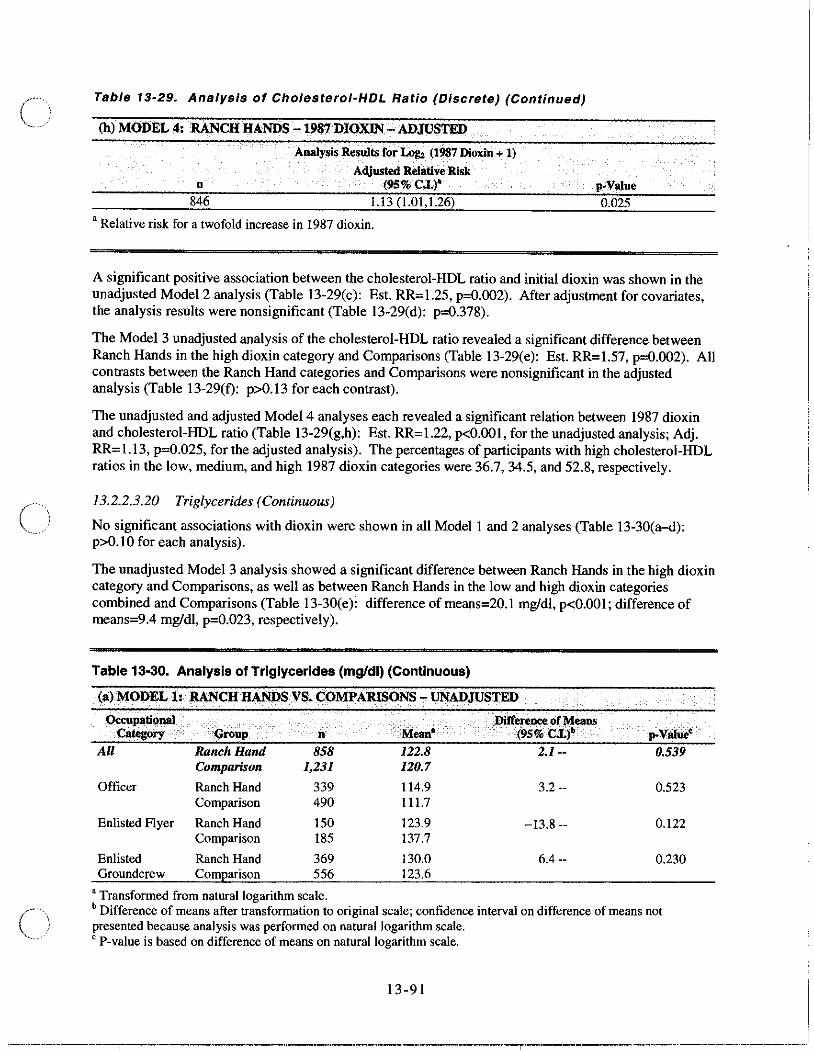
The unadjusted and adjusted Model 4 analyses each revealed a significant relation between 1987 dioxin and cholesterol-HOL ratio (Table 13-29(g,h): Est. RRd.22, p<O.OOI, for the unadjusted analysis; Adj. RR=l.13, p=0.025, for the adjusted analysis). The percentages of participants with high cholesterol-HOL ratios in the low, medium, and high 1987 dioxin categories were 36.7, 34.5, and 52.8, respectively.
13.2.2.3.20 Triglycerides (Continuous)
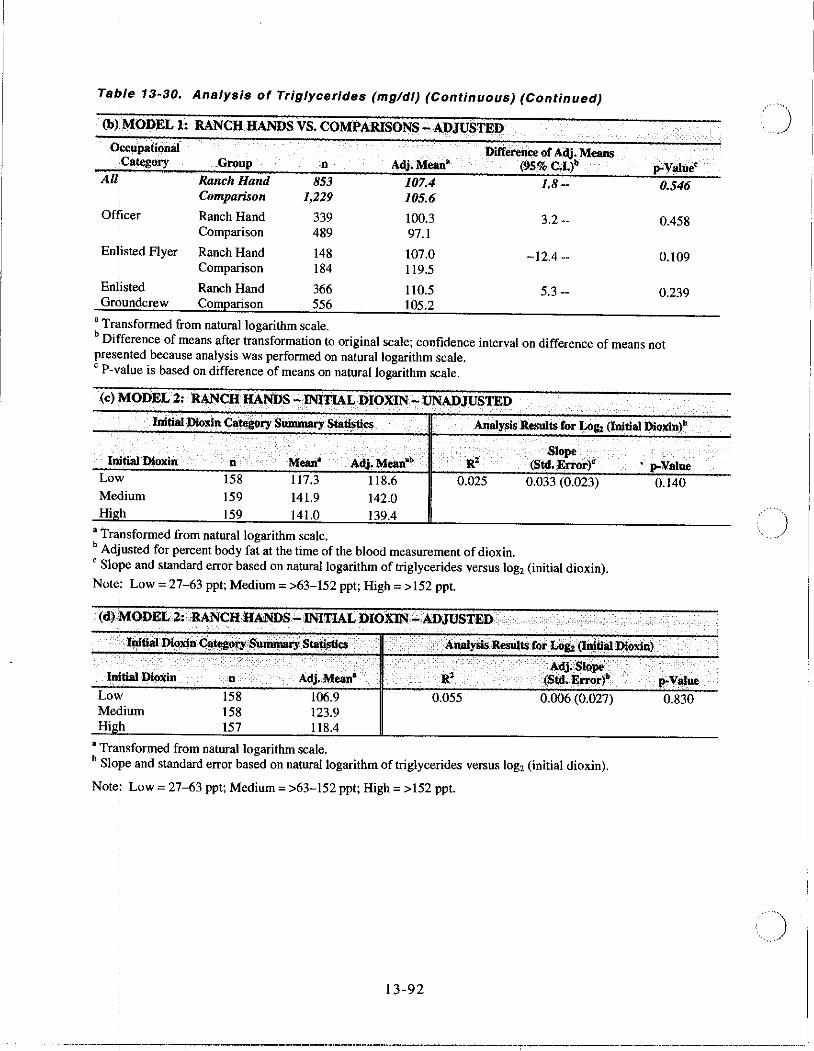
No significant associations with dioxin were shown in ail Model I and 2 analyses (Table 13-30(a-d): p>O.lO for each analysis).
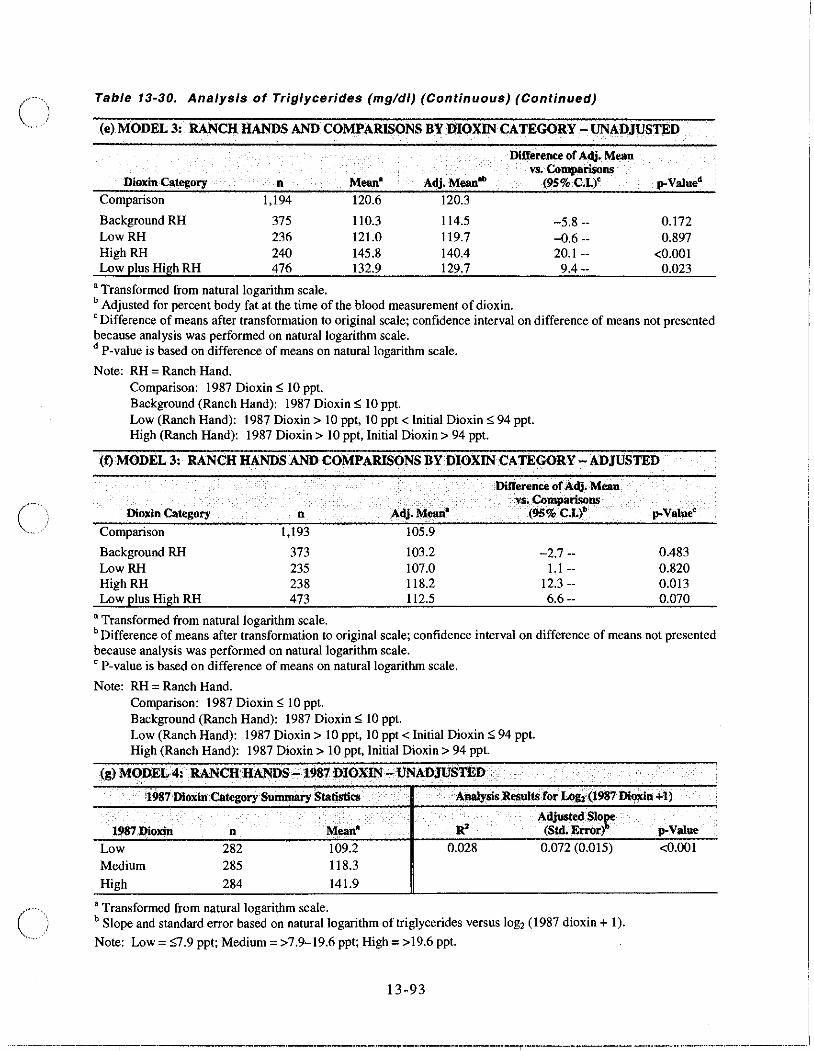
The unadjusted Model 3 analysis showed a significant difference between Ranch Hands in the high dioxin category and Comparisons, as well as between Ranch Hands in the low and high dioxin categories combined and Comparisons (Table 13-30(e): difference ofmeans=20.l mgldl, p<O.OOI; difference of means=9.4 mgldl, p=0.023, respectively).
-Table 13·30. Analysis of Triglycerides (mgldl) (Continuous)
(a) MODll:Ll.:,RANCH HANDS VS. COMPARIsONS - UNADJUSTED
Occupational Group M ......
Dilrerenee of Means ea\egory n (9S%C.t)b p-VaIuee
All Ranch Hand 858 122.8 2.1-- 0.539 Comparison 1,231 120.7
Officer Ranch Hand 339 114.9 3.2 -- 0.523 Comparison 490 111.7
Enlisted Flyer Ranch Hand 150 123.9 -13.8 -- 0.122 Comparison 185 137.7
Enlisted Ranch Hand 369 130.0 6.4 -- 0.230 Groundcrew Comparison 556 123.6
, Transformed from natural logarithm scale. b Difference of means after transformation to original scale; confidence interval on difference of means not presented because analysis was performed on natural logarithm scale. , P-value is based on difference of means on naturallogarithrn scale.
13-91
-------------------.~--.----"------.----'-----.--'--.---.------.---r.-.--'------,.-.".--"----... --.----.-..... -----.-.. ------
TalJle 13-30. Ana/ysis of Trig/yeer/des (mg/d/) (Continuous) (Continued)
(b)iMOD!J)L 1: RANCH HANDS VS. COMPARISO/llS -ADJUSTED.
o\:.upationa) . Difference of A<\j. Means iCategoryGroup n Adj. Mean' (95% C.L)·
AU' Ranch Hand 853 107.4 1.8 --
i
Of/licer
Comparison 1,229 105.6
Ranch Hand 339 Comparison 489
Enlisted Flyer Ranch Hand 148
Enlisted Groundcrew
Comparison 184
Ranch Hand 366 Comparison 556
100.3 97.1
107.0 119.5
110.5 105.2
3.2 --
-12.4--
5.3 --
0.546
0.458
0.109
0.239
, Trllnsformed from natural logarithm scale. b Di~ference of means after transformation to original scale; confidence interval on difference of means not pres~nted because analysis was performed on natural logarithm scale. o P-value is based on difference of means on natural logarithm scale.
(e) ~ODEL Z: RANCH HANDS .... INITIAL DIOXIN -UNADJUSTED . ..
. lnltiidDioxin Ca~i:oi-y SUIIIID8I'Y St8tIsti. cs , ." .,. .. ... . Analysisltesolts tor Loe. (InItial Dio;dll)h
Initial Dioxin II Meana A<\j. Mean" . R' Low 158 117.3 118.6 0.025 Me~ium 159 141.9 142.0 Hig~ 159 141.0 139.4
, Trapsformed from natural logarithm scale. b Adjusted for percent body fat at the time of the blood measurement of dioxin.
Slope (Sid. Error)'
0.033 (0.023)
o Slope and standard error based on natural logarithm of triglycerides versus log, (initial dioxin).
Note,: Low = 27-63 ppt; Medium = >63-152 ppt; High = >152 ppt. I
• p-Value
0.140
' .... , " • AnalySlsResullS fOI'Log,(lIll~!'I Dioxin) . .. j ..•.... . './' ...
Injtiid Dioxin n ••.•..••• A<\j. Mean' ... .., •. . .. . A<\j.SI~pe'. '. . .•
R' . (Std; Error>" .... Vlllue
Lo'Y 158 106.9 123.9 118,4
0.055 0.006 (0.027) 0.830 Meqium 158 High 157
, Transformed from natural logarithm scale. b Slope and standard error based on natural logarithm of triglycerides versus log, (initial dioxin).
Note: Low = 27-63 ppt; Medium = >63-152 ppt; High = > 152 ppt.
\3-92
. ..
.. )
·----~-·-------I-·---··__,_--·--·------·---'·----'---··----·---'--------i·~-----·--·-·-·-'-·-·---·-------·--"'·-------.-_.-.---
C
Table 13-30. AnalysIs of Triglycerides (mg/dl) (Continuous) (Continued)
(e) MODEL 3: RANCH HANDS AND COMPARISONS BY DIOXIN CATEGORY - UNADJUSTED
Difference of Adj. Mean vs. Comparisons
Dioxin Category n Mean' Adj. Mean" (9S%C.L)' p-Valued
Comparison 1,194 120.6 120.3
Background RH 375 1l0.3 114.5 -5,8 -- 0.172 l.owRH 236 121.0 119.7 -0,6 -- 0.897 High RH 240 145.8 14004 20.1 -- <0.001 l.ow plus High RH 476 132.9 129.7 904 -- 0.023
, Transformed from natural logarithm scale. b Adjusted for percent body fat at the time of the blood measurement of dioxin. e Difference of means after transformation to original scale; confidence interval on difference of means not presented because analysis was performed on natural logarithm scale. d P-value is based on difference of means on natural logarithm scale.
Note: RH = Ranch Hand. Comparison: 1987 Dioxin':; 10 ppt. Background (Ranch Hand): 1987 Dioxin':; 10 ppt. l.ow (Ranch Hand): 1987 Dioxin> 10 ppt, 10 ppt < Initial Dioxin':; 94 ppt. High (Ranch Hand): 1987 Dioxin> 10 ppt, Initial Dioxin> 94 ppt.
(f)MODEL 3: RANCH HANDS AND COMPARISONS BY DIOXIN ,CATEGORY - ADJUSTED
-Difference of Adj. Mean
Dioxin Category n Adj. Mean' vo.Comparisons
(95% C,I.)' p-Value'
Comparison 1,193 105.9
Background RH 373 103.2 -2.7 .. - 00483 l.owRH 235 107.0 1.1 .. - 0.820 HighRH 238 118.2 12.3 .. - 0.013 Low plus High RH 473 112.5 6.6 .. - 0.070
• Transformed from natural logarithm scale. b Difference of means after transformation to original scale; confidence interval on difference of means not presented because analysis was performed on natural logarithm scale. e P-value is based on difference of means on natural logarithm scale.
Note: RH = Ranch Hand. Comparison: 1987 Dioxin':; 10 ppt. Background (Ranch Hand): 1987 Dioxin':; 10 ppt. Low (Ranch Hand): 1987 Dioxin> 10 ppt, 10 ppt < Initial Dioxin':; 94 ppt. High (Ranch Hand): 1987 Dioxin> 10 ppt, Initial Dioxin> 94 ppt.
(g) MODEL4: ,RANCHH.ANDS,...1987 DIOXIN -VNADJUSTED ,
'1987 Dioxin Category Summary Statistics ,', Analysis Results for Log; (1987 Di~ln +1) ,"
1987 Dioxin
Low Medium
High
n 282 285
284
, - Adjusted Slor Mean' R2 (Std. Error)
109.2 0.028 0.072 (0.015)
118.3
141.9
, Transformed from natural logarithm scale. b Slope and standard error based on natural logarithm oftriglycerides versus log, (1987 dioxin + I). Note: Low = ':;7.9 ppt; Medium = >7.9-19.6 ppt; High = >19.6 ppt.
13-93
p-Value
<0.001
-
I
.-.---.,--r--.---------.-.----------'-.-------'----r'-.-------..... __ ._ .. _ .... _ .. __ .. _ ........ _ ........ J
Tab!/e 13-30. Analysis of Trlglyeerides (mg/dl) (Continuous) (Continued)
(h)I\iODEL 4: RANCH HANDS -1987DIOXIN - ADJUSTED
! 1987 Dioxin Category Summary Statistics J\nalysis Results f9r,Log, (1987 Dioxin + I)
: ·1987. AdjustedSI0l!" i Dioxin n Adj. Mean' R' (Std.lj:rror) p.Value
Lo\)' 282 96.3 0.041 0.063 (0.017) Medium 283 105.7 High 281 122.9
<0.001
• Trl"sformed from natural logarithm scale. b Slo~e and standard error based on natural logarithm of triglycerides versus log, (1987 dioxin + I).
Note: Low = 9.9 ppt; Medium = >7.9-19.6 ppt; High = >19.6 ppt.
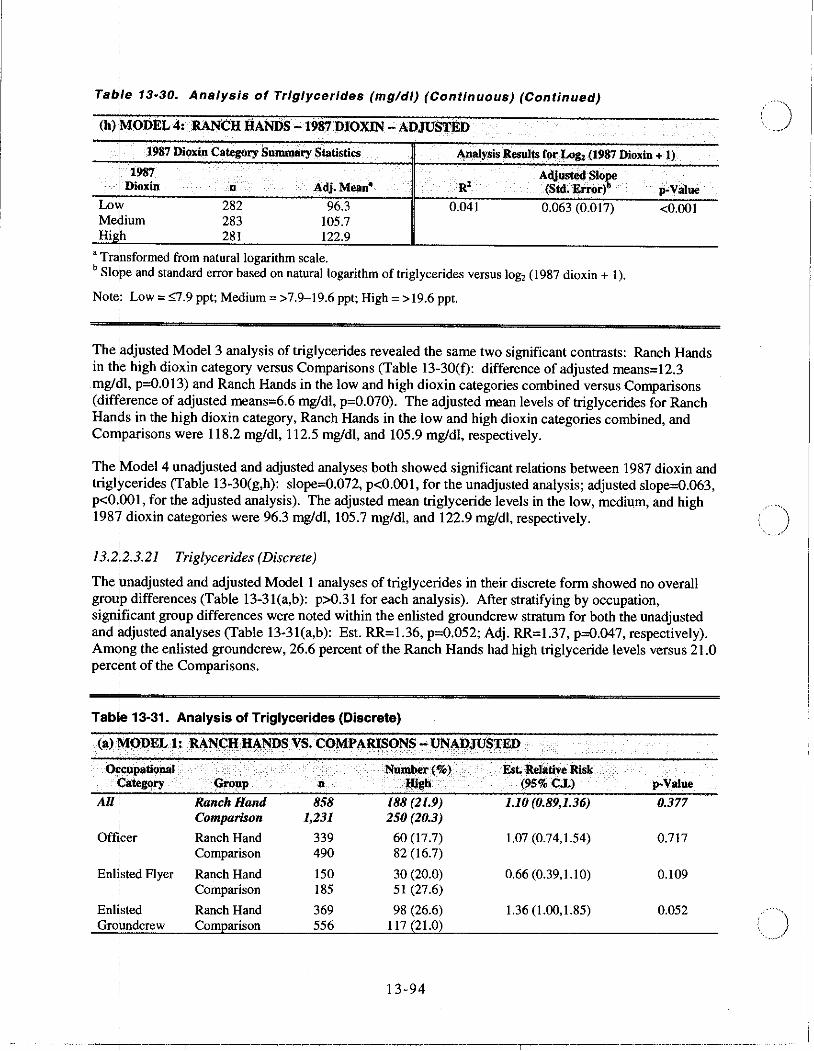
The 'adjusted Model 3 analysis of triglycerides revealed the same two significant contrasts: Ranch Hands in th~ high dioxin category versus Comparisons (Table 13-30(f): difference of adjusted means=12.3 mg/QI, p=O.013) and Ranch Hands in the low and high dioxin categories combined versus Comparisons (dif~erence of adjusted means=6.6 mg/dl, p=0.070). The adjusted mean levels of triglycerides for Ranch Han~s in the high dioxin category, Ranch Hands in the low and high dioxin categories combined, and COIl\parisons were 118.2 mg/dl, 112.5 mg/dl, and 105.9 mg/dl, respectively.
i ," ""
I. )
The Model 4 unadjusted and adjusted analyses both showed significant relations between 1987 dioxin and triglycerides (Table 13-30(g,h): slope=O.On, p<O.OOI, for the unadjusted analysis; adjusted slope=0.063, p<O.pOl, for the adjusted analysis). The adjusted mean triglyceride levels in the low, medium, and high 1981 dioxin categories were 96.3 mg/dl, 105.7 mg/dl, and 122.9 mg/dl, respectively. '.)
13.2;2.3.21 Triglycerides (Discrete)
The lmadjusted and adjusted Model I analyses of triglycerides in their discrete form showed no overall group differences (Table 13-31(a,b): p>0.31 for each analysis). After stratifying by occupation, signjficantgroup differences were noted within the enlisted groundcrew stratum for both the unadjusted and ildjusted analyses (Table 13-31(a,b): Est. RR=1.36, p=0.052; Adj. RR=1.37, p=O.047, respectively). Among the enlisted groundcrew, 26.6 percent of the Ranch Hands had high triglyceride levels versus 21.0 percbnt of the Comparisons.
Table 13-31. Analysis of Triglycerides (Discrete)
<a) '\\fODEL 1: RANCH HANDS VS.COMPARISONS - UN~DJUS'l'ED
o.kupational Number(%) Est. ReJlUi". Risk ~tegQry . Groupn Qigh (95%C.L)
All ! Ranch Hand 858 188 (21.9) 1.10 (0.89,1.36)
i Comparison
Officer Ranch Hand Comparison
Enlisted Flyer Ranch Hand Comparison
Enl\sted Ranch Hand Gro\mdcrew Comparison
1,231
339 490
150 185
369 556
250(20.3)
60 (17.7) 82 (16.7)
30 (20.0) 51 (27.6)
98 (26.6) 117 (21.0)
13-94
1.07 (0.74,1.54)
0.66 (0.39,1.10)
1.36 (1.00,1.85)
p-Value
0.377
0.717
0.109
0.052
----------~~----__r-.---.. '__,_--------.---.---.-.---.. ----~----.----~-------.---.-'-... ---.--------.-.... -.. --------._-, .. I
() "--.. -
c:'
c.
Table 13-31. Analysis of Triglyeerides (Discrete) (Continued)
(b) MODEL l:RANCHfIA,.NDS VS. COMPARISONS - ADJUSTED
Occupatiolllll Category
All
Officer Enlisted Flyer Enlisted Groundcrew
Adjusted Relative Risk (95% C.I.)
1.12 (0.90,1.39)
1.10 (0.76,1.58) 0.66 (0.39,1.12) 1.37 (1.00,1.88)
(c) MODEL 2: RANCH HANDS -INITIAL DIOXIN,.. UNADJUSTED . .
p-VlIIue
0.318
0.628 0.123 0.047
lniti.rpi~.inCategdry SummBry Slfttiti/ics ... . . A,oaIysis ~ults for t:,.og, (lnitial.Dfoxln)'
Initial Number (%) DioXin nJ:ljll"
Low Medium High
158 159 159
37 (23.4) 45 (28.3) 49 (30.8)
. Estimated Relative RiSk
(9S%C.L)b
1.09 (0.94,1.27)
• Adjusted for percent body fat at the time of the blood measurement of dioxin. b Relative risk for a twofold increase in initial dioxin.
Note: Low = 27-63 ppt; Medium = >63-152 ppt; High = >152 ppt.
(d)MODEL2: RANCH HANDS - INI'flALDIOXIN,.. ADJUSTED
n'
473
AnalySis l:I.eS\lltsforLogz(lnidal DioXin)
Adj~RelativeRisk (95% C.I.)'
0.96 (0.80,1.15)
• Relative risk for a twofold increase in initial dioxin.
p,Value
0.275
p-Value
0.690
(e) MODEL 3; RANCH HANDS AND COMPARISONS BY DIOXIN CATEGORY- UNADJUSTED
Nuilll.Or(%) .... EsL'a"I8Uve :Risk . DioXin Category n > .J:ljgb (9S%C.I.)'·
Comparison 1,194 240 (20.1)
Background RH 375 53 (14.1) 0.72 (0.52,1.00) LowRH 236 54 (22.9) Ll5 (0.82,1.62) HighRH 240 77 (32.1) 1.74 (1.27,2.37) Low plus High RH 476 131 (27.5) 1.42 (LlO,1.82)
• Relative risk and confidence interval relative to Comparisons. b Adjusted for percent body fat at the time of the blood measurement of dioxin.
Note: RH = Ranch Hand. Comparison: 1987 Dioxin" 10 ppt. Background (Ranch Hand): 1987 Dioxin" 10 ppt. Low (Ranch Hand): 1987 Dioxin> 10 ppt, 10 ppt < Initial Dioxin" 94 ppt. High (Ranch Hand): 1987 Dioxin> 10 ppt, Initial Dioxin> 94 ppt.
13-95
-"",','
p-Value
0.051 0.411
<0.001 0.006
-- ___ .' •••• _' •• ___ •• __ • __ .~--.----"----.--.--------'.-_' __ ._. __ WR ___ '---r' ____ ._ .. ____ ,. __ ,,· __ " _________ · ___ · __ · ... -----.-... -----
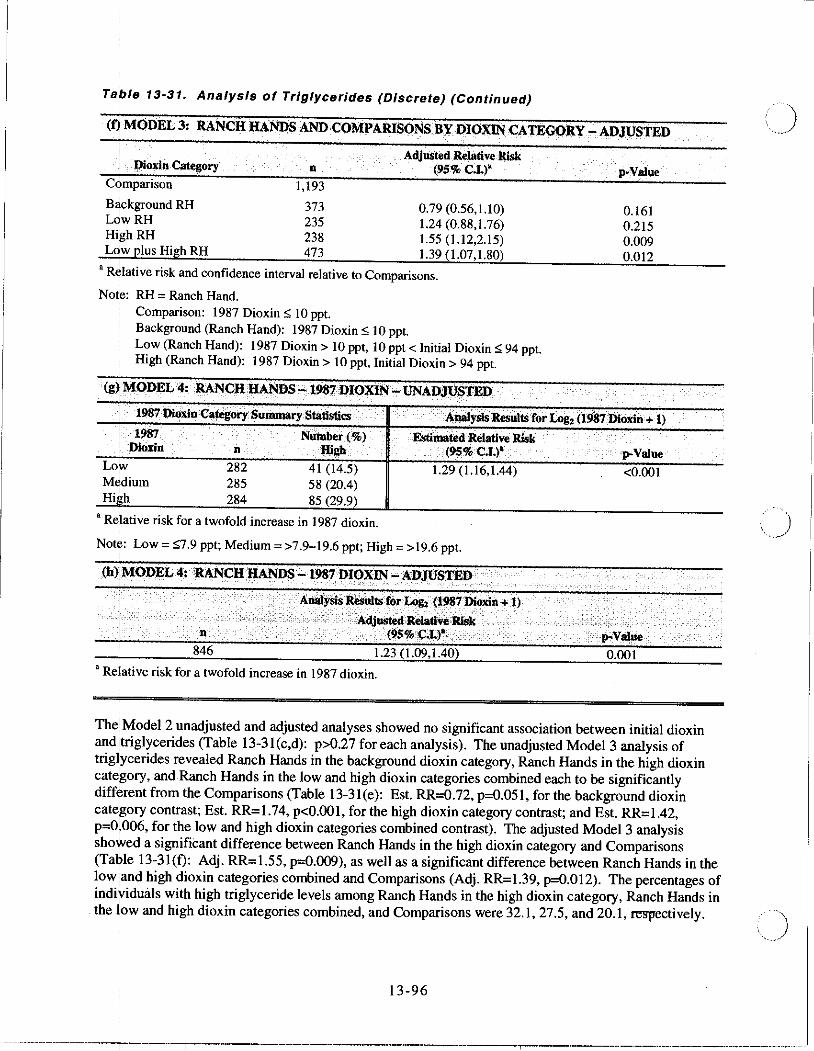
Table 13-31. Analysis of Trlglyeerides (Discrete) (Continued)
<q MODEL.3: RANCH HANDs ANDCOMPARlSONSBY DlOXIN CATEGORY.., ADJUStED I
! I)loxin Category n
CJmparison 1,193
Adjusted Relative Risk (95% CL)'
B~ckground RH 373 0.79 (0.56,1.10) Low RH 235 1.24 (0.88,1.76) High RH 238 1.55 (1.12,2.15) Low plus High RH 473 1.39 (1.07,1.80)
,
a Relative risk and confidence interval relative to Comparisons.
Note: RH = Ranch Hand. Comparison: 1987 Dioxin::; to ppt. Background (Ranch Hand): 1987 Dioxin::; 10 ppt. Low (Ranch Hand): 1987 Dioxin> to ppt, 10 ppt < Initial Dioxin::; 94 ppt. High (Ranch Hand): 1987 Dioxin> to ppt, Initial Dioxin> 94 ppt.
(g~,MODEL 4: RANCH HANDS -1987DlOXIN - UNADJQSTED ..
p-VaJue
0.161 0.215 0.009 0.012
1987 l)io~inCa1'igory Summary Statl&1ios An8Jyois Results Cor Log. (19117l>ioxin + I) 1987 . Nurnber{%)
',Dioxin . n . fligh
Lo)v 282 41 (14.5) M~dium 285 58 (20.4) High 284 85 (29.9)
• Relative risk for a twofold increase in 1987 dioxin.
EstlmatedRelative Risk .• (95%C.I.)·
1.29 (1.16,1.44)
Note: Low = ::;7.9 ppt; Medium = >7.9-19.6 ppt; High = >19.6 ppt. ,
n
846
An8JYSlsResuJtsforLog,. (1987Dioxln + 1) ... ' .Adj~.Relatl .. e.RIsJ(
. (95% 'C.I:)': 1.23 (1.09,1.40)
• Relative risk for a twofold increase in 1987 dioxin.
<0.001
0.001
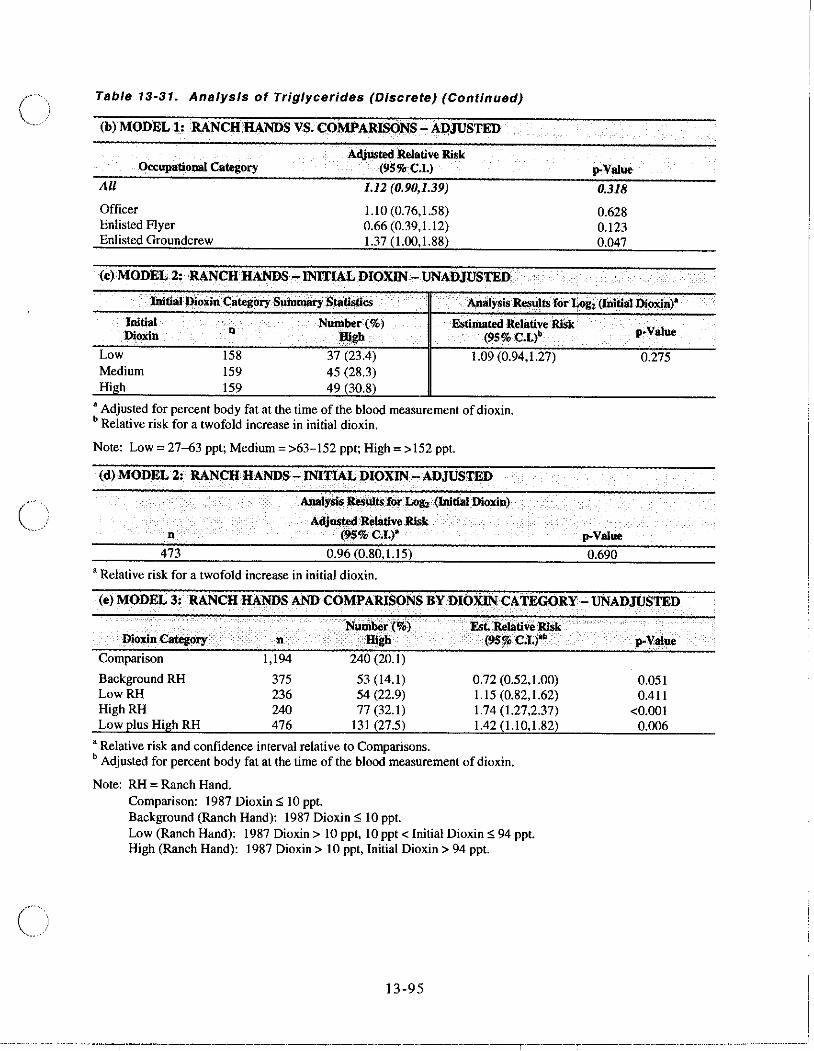
The! Model 2 unadjusted and adjusted analyses showed no significant association between initial dioxin and Itriglycerides (Table 13-31(c,d): p>O.27 for each analysis). The unadjusted Model 3 analysis of trigl!ycerides revealed Ranch Hands in the background dioxin category, Ranch Hands in the high dioxin cate~ory, and Ranch Hands in the low and high dioxin categories combined each to be significantly difftiorent from the Comparisons (Table 13-31(e): Est. RR=O.72, p=O.051, for the background dioxin cate~ory contrast; Est. RR=1.74, p<O.OOl, for the high dioxin category contrast; and Est. RR=I.42, p=OI006, for the low and high dioxin categories combined contrast). The adjusted Model 3 analysis showed a significant difference between Ranch Hands in the high dioxin category and Comparisons (Ta~le 13-31(f): Adj. RR=1.55, p=0.OO9), as well as a significant difference between Ranch Hands in the low:and high dioxin categories combined and Comparisons (Adj. RR=I.39, p=0.012). The percentages of indiyiduitls with high triglyceride levels among Ranch Hands in the high dioxin category, Ranch Hands in the low and high dioxin categories combined, and Comparisons were 32.1,27.5, and 20.1, respectively.
13-96
)
----.----.-----------r-.---"-r--... ------.-----------.. ---.--·-·---r------.. -·-·--· .. ·-·-.. ---· .. · .... ----·-··,,·
( "
i
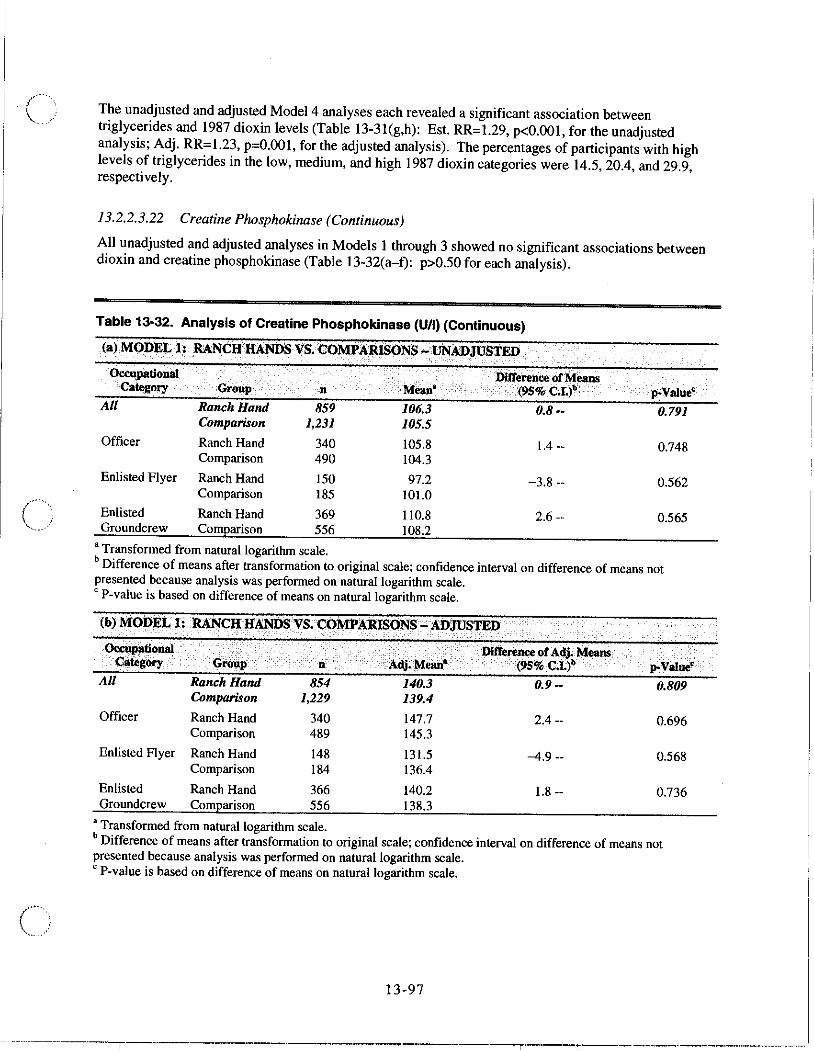
The unadjusted and adjusted Model 4 analyses each revealed a significant association between triglycerides and 1987 dioxin levels (Table 13-31(g,h); Est. RR=1.29, p<O.OOI, for the unadjusted analysis; Adj. RR=I.23, p=O.OOI, for the adjusted analysis). The percentages of participants with high levels of triglycerides in the low, medium, and high 1987 dioxin categories were 14.5,2004, and 29.9, respectively.
13.2.2.3.22 Creatine Plwsphokinase (Continuous)
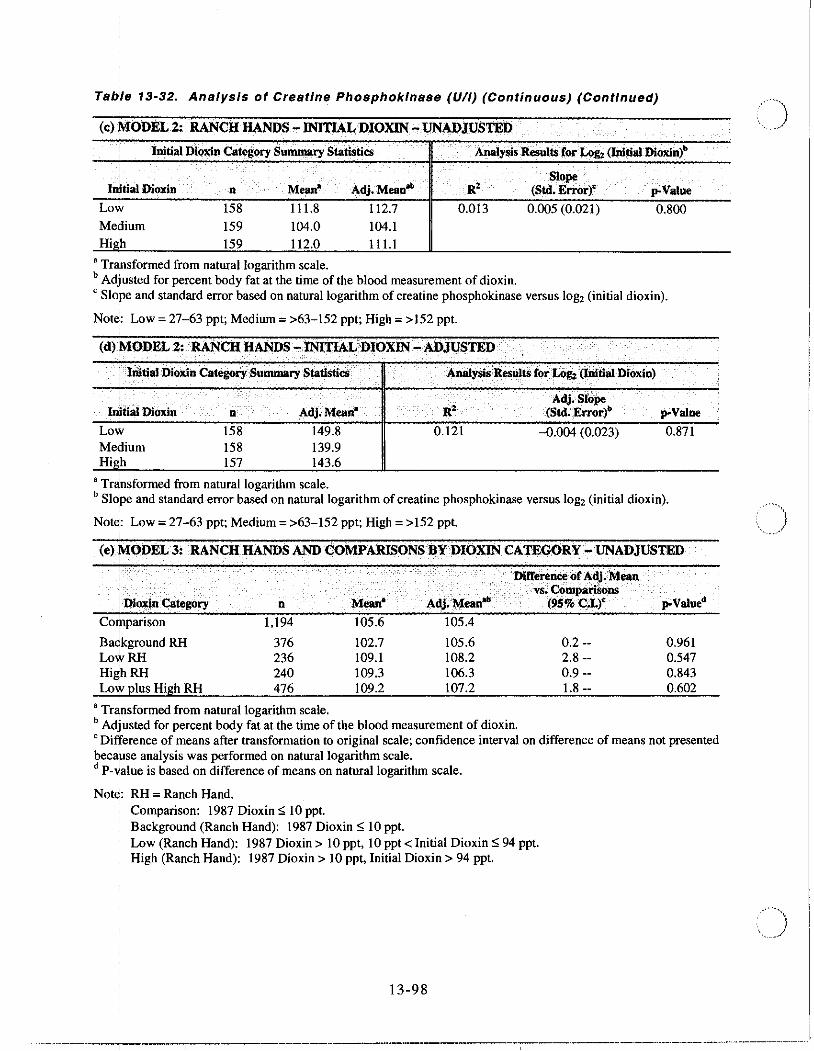
All unadjusted and adjusted analyses in Models 1 through 3 showed no significant associations between dioxin and creatine phosphokinase (Table 13-32(a-t); p>0.50 for each analysis).
Table 13-32. Analysis of Creatine Phosphokinase (uti) (Continuous)
(a)MODEI..l: RANCH HANDS VS. COMPA1USONS -UNADJUSTED . '. - . .... ~' . .
Occ",padonal DUl'erenceofMeans Category Gr01!P n :Meana (95% C.l.)b' . p-VaJue'
All Ranch Hand 859 106.3 0.8·- 0.791 Comparison 1,231 105.5
Officer Ranch Hand 340 105.8 1.4 -- 0.748 Comparison 490 104.3
Enlisted Flyer Ranch Hand 150 97.2 -3.8 -- 0.562 Comparison 185 101.0
Enlisted Ranch Hand 369 110.8 2.6 -- 0.565 Groundcrew Comparison 556 108.2
• Transformed from natural logarithm scale. b Difference of means after transformation to original scale; confidence interval on difference of means not presented because analysis was performed on natural logarithm scale. , P-value is based on difference of means on natural logarithm scale.
(b) MODEL ll.RANCHHANDSYS.COMPARISONS;;;lIDJUSTED
~tIonal G.i~p
Diltereru:eof Adj. Means . C~iegory n ··Adj·Me~n· '(95%C~)' p-VaJue'
All Ranch Hand 854 140.3 0.9 -- 0.809 Comparison 1,229 139.4
Officer Ranch Hand 340 147.7 2.4 -- 0.696 Comparison 489 145.3
Enlisted PI yer Ranch Hand 148 131.5 -4.9 -- 0.568 Comparison 184 136.4
Enlisted Ranch Hand 366 140.2 1.8 -- 0.736 Groundcrew Comparison 556 138.3
• Transformed from natural logarithm scale. b Difference of means after transformation to original scale; confidence interval on diffenmce of means not presented because analysis was performed on natural logarithm scale. , P-value is based on difference of means on natural logarithm scale.
13-97
.. ---------------.-.--.-;-T--'-----------.---..------'-~.-.----.---r.-.--------,.-.... --"---.. -.---.-.... -.-.-----.-
Tab~e 13-32. Analysis of Creatine Phosphokinase (UlI) (Continuous) (Continued)
(c) 1VI0DEL 2: RANCH HANDS ,..INITIAL DIOXIN - UNADJUSTED .. . ...
! Initial Di</x.ln Category SUmmary Statistics Analysis Resuits for J-og, (Initial Dioxin)"
,
Inltial Dioxin D Meana Adj. Mean" Low 158 111.8 112.7 0.013 Medium 159 104.0 104.1 High 159 112.0 111.1
• Trl\l1sformed from natural logarithm scale. b Adjusted for percent body fat at the time of the blood measurement of dioxin.
Slope' . (Stel. Error)'
0.005 (0.021)
p-Value
0.800
, Slope and standard error based on natural logarithm of creatine phosphokinase versus log, (initial dioxin).
Note: Low = 27-63 ppt; Medium = >63-152 ppt; High = > 152 ppt.
(d) MODEL 2: RANCH HANDS ..,..lNITIAVDlOXIN -ADJUSTED
; lroitial DioXin Category Summary Statistics
! .... •
In)iial Dioxin LoW Me\lium High
n
158 158 157
Adj. Mean"
149.8 139.9 143.6
.. . .. Analysis Results for LOg, (Initial Dioxin) . . ... .... ... .
0.121
Adj. Slope (Std •. Error)"
-0.004 (0.023)
p-Value
0.871
, Transformed from natural logarithm scale. b Slope and standard error based on natural logarithm of creatine phosphokinase versus log, (initial dioxin).
Not<1: Low = 27-63 ppt; Medium = >63-152 ppt; High = >152 ppt.
(e) ~ODEL 3:. RANCH HANDS AND tOMPARISONS~Y DI()XIN CATEGORY - UNADJUSTED
Difference ()f Adj. Mean
Adj. Mean" vs. 'cOmpariSons
p-Valued ! Dio~n Category n Mean" (95%C·L)'
Col\lparison 1,194 105.6 105.4
Baokground RH 376 102.7 105.6 0.2 -- 0.961 LoWRH 236 109.1 108.2 2.8 -- 0.547 HighRH 240 109.3 106.3 0.9 -- 0.843 Low plus High RH 476 109.2 107.2 1.8 -- 0.602
, Tr~nsformed from natural logarithm scale. b Adjusted for percent body fat at the time of the blood measurement of dioxin.
.
e Difference of means after transformation to original scale; confidence interval on difference of means not presented beca~se analysis was performed on natural logarithm scale. d p-"alue is based on difference of means on natural logarithm scale.
Note: RH = Ranch Hand. Comparison: 1987 Dioxin"; 10 ppt. Background (Ranch Hand): 1987 Dioxin"; 10 ppt. Low (Ranch Hand): 1987 Dioxin> 10 ppt, 10 ppt < Initial Dioxin"; 94 ppt. High (Ranch Hand): 1987 Dioxin> 10 ppt, Initial Dioxin> 94 ppt.
13-98
--~---""'-------I-'----'-T----'------'----'"---'---'.--------.--------;----.-----.-.-.-.--.---.-------....... " .. ----.---.-"----
Cl
(I
Table 13-32. Analysis of Creatine Phosphokinase (UlI) (Continuous) (Continued)
(f) MODEL3:RANCH HANDS AND COMPARISONS BY DIOXIN CATEGORY -ADJUSTED
Difference of Adj. Mean VB. Comparisons
Dioxin C~legory n Adj. Mean' (95% C.I.)· p-VlIIlle' Comparison 1,193 140.2
Background RH 374 139.5 -0.7-- 0_889 LowRH 235 142.6 2.4 --- 0.679 HighRH 238 143_8 3_6 --- 0.549 Low plus High RH 473 143_2 3.0 --- 0.503
, Transformed from natural logarithm scale. b Difference of means after transformation to original scale; confidence interval on difference of means not presented because analysis was performed on natural logarithm scale_ , P-value is based on difference of means on natural logarithm scale.
Note: RH = Ranch Hand. Comparison: 1987 Dioxin:> 10 ppt. Background (Ranch Hand): 1987 Dioxin:> 10 ppt. Low (Ranch Hand): 1987 Dioxin> 10 ppt, 10 ppt < Initial Dioxin:> 94 ppt. High (Ranch Hand): 1987 Dioxin> 10 ppt, Initial Dioxin> 94 ppt.
(g) MODEL 4:f{ANCHHANDS..,i!l87 DIOXIN -'UNADJUSTED
AlI8lyslsResul~ Cor Log, (1987 Dioxill +1) ..... ..•. . -.. 1987DiOJdn . n<: .'. •.... l\iltan'
. " .. '.A.lijuSted.SIOPe' . .R' (Sid, Error)' p-Value'.
Low 283 285 284
99.8 110.6 108.7
0.004 0.024 (0.014) 0.084 Medium High
, Transformed from natural logarithm scale. b Slope and standard error based on natural logarithm of creatine phosphokinase versus log, (1987 dioxin + 1)_
Note: Low = g.9 ppt; Medium = >7.9-19.6 ppt; High = >19.6 ppt.
(h) MODEL 4:RANCH-HANDS-- 1987.DIOXIN ...,ADJUSTED . . '.'
1987 . .' . .., . AdjlJSted S1o~ R' (Sid. Error) :'Di9xin . -"D Adj. Mean' p-Value
Low 283 126.6 0.091 0.039 (0.015) 0.011 Medium 283 141.1 High 281 143.2
• Transformed from natural logarithm scale_ b Slope and standard error based on natural logarithm of crealine phosphokinase versus log, (1987 dioxin + 1)_
Note: Low = :>7.9 ppt; Medium = >7.9-19.6 ppt; High = >19.6 ppt.
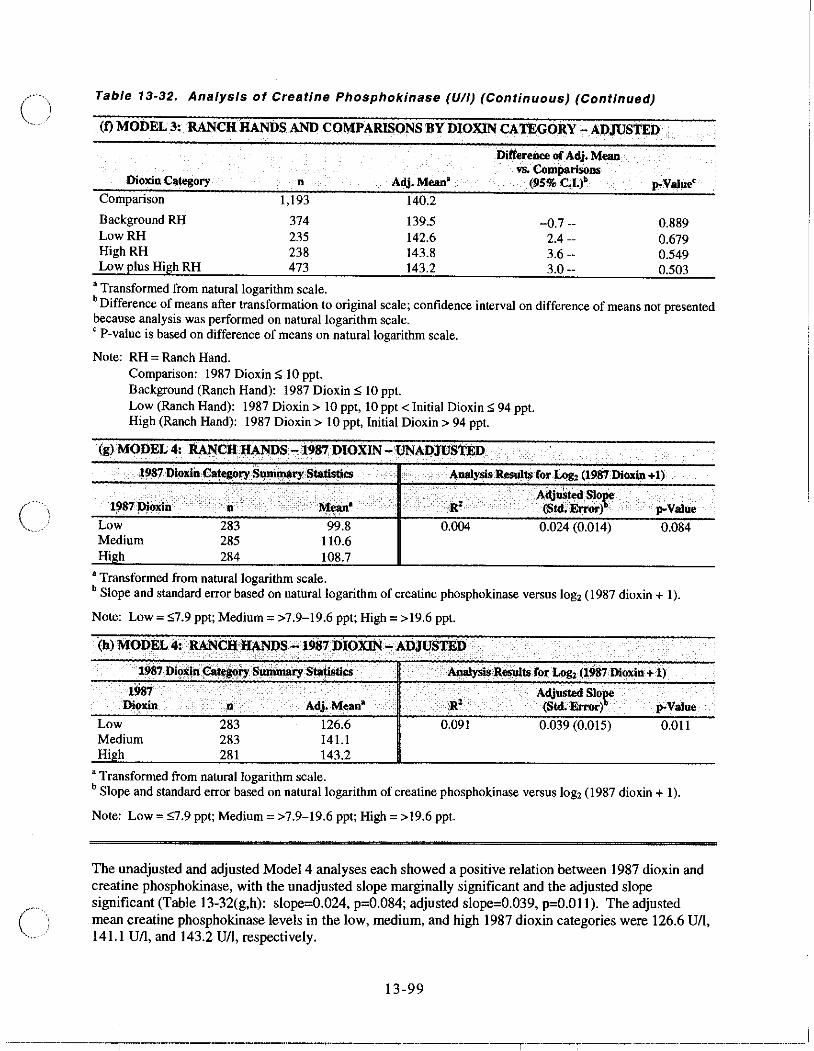
The unadjusted and adjusted Model 4 analyses each showed a positive relation between 1987 dioxin and creatine phosphokinase, with the unadjusted slope marginally significant and the adjusted slope significant (Table 13-32(g,h): slope=O.024, p=O.084; adjusted slope=O.039, p=O.OII). The adjusted mean creatine phosphokinase levels in the low, medium, and high 1987 dioxin categories were 126.6 VII, 141.1 UII, and 143.2 UII, respectively.
13-99
.-------------:-r-.------------.------.-----------------.-----r.--------.-------------------------------------
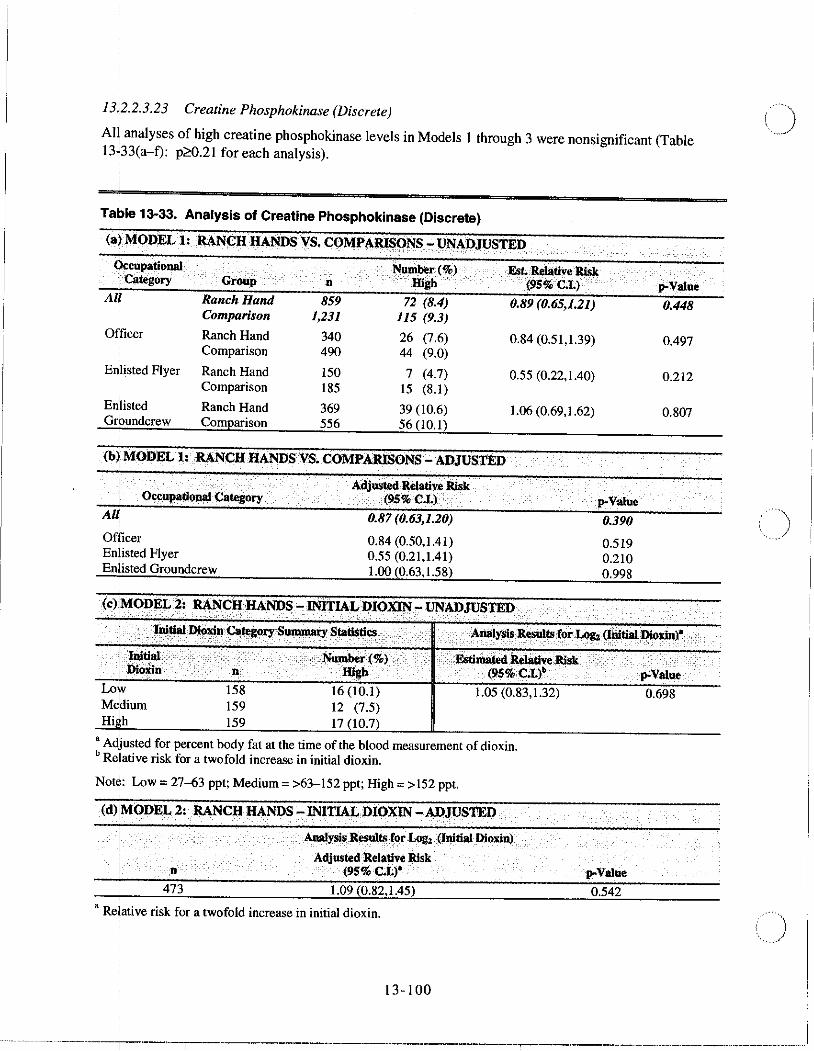
13.2.2.3.23 Creatine Phosphokinase (Discrete)
All analyses of high creatine phosphokinase levels in Models I through 3 were nonsignificant (Table 13:33(a-f): p~0.21 for each analysis).
Ta\>le 13-33. Analysis of Creatine Phosphokinase (Discrete)
(a~.MOJ)EL 1:, .RAN~lI HANDS VS. COMPA~9NS -:UNADJUSTED
qccupatiOnal. Jl!umber (%) , Est. Rdative Risk i Category Group n Hi8h ,,' . (9:S%C.I.)
All Ranch Hand 859 72 (8.4) 0.89 (0.65,1.21) Comparison 1,231 115 (9.3)
Officer Ranch Hand 340 26 (7.6) 0.84 (0.51,1.39) Comparison 490 44 (9.0)
Enlisted Flyer Ranch Hand 150 7 (4.7) 0.55 (0.22,1.40) Comparison 185 15 (8.1)
Enlisted Ranch Hand 369 39 (10.6) 1.06 (0.69,\.62) Groundcrew Comparison 556 56 (10.1)
I
(b~ MODEL 1: ,RANCH lIANDS VS. COMPARISONS - ADJUSTED
I O"""patioualCategory
Officer En isted Flyer En isted Groundcrew
Adjusted Relative Risk (9S%C.L) ,
0.87 (0.63,1.20)
0.84 (0.50,1.41) 0.55 (0.21,1.41) 1.00 (0.63,1.58)
(e) MODEL 2: RANCH ,HANDS - INlTIALDIOXlN -UNADJUSTED I ' , ' '-: ,<" " , , ':'
, , IlIItial !DiOi'ln
Lo\" Me~Jium Hi 'h
158 159 159
.Numbcor(%) Hi$b
16 (10.1) 12 (7.5) 17 (10.7)
F8timaied,kel~tlveJUsk . (9S%CL)' '
1.05 (0.83,1.32)
, Adjusted for percent body fat at the time of the blood measurement of dioxin. b Relative risk for a twofold increase in initial dioxin.
Note: Low = 27~3 ppt; Medium = >63-152 ppt; High = >152 ppt.
(d) iMODEL 2: RANCH HANDS -INITIAL DIOXIN - ADJUSTED
Analysis Results for Log, '(lIIItiaI Dioxin)
Adjusted Reiative Risk
p-Value
0.390
0.519 0.210 0.998
n, (9S%C.I.)' p-Value
473 1.09 (0.82,1.45) 0.542
, Relative risk for a twofold increase in initial dioxin.
13-100
.,..Value
0.448
0.497
0.212
0.807
p-Value
0.698
(!
(.)
Table 13-33. Analysis of Creatine Phosphokinase (Discrete) (Continued)
(e) ~ODlJ:L 3:RANCH.HANDS AND COMPARISONS BY DIOXINC4.TEGORY -l.1N4.DJll~l'ED
Number(%) Est. Relative R.isk Dioxin Category n Higb (95% C.I.)"
Comparison 1,194 111 (9.3)
Background RH 376 26 (6.9) 0.81 (0.51,1.26) LowRH 236 20 (8.5) 0.87 (0.53,1.44) HighRH 240 25 (10.4) 1.03 (0.65,1.64) Low plus High RH 476 45 (9.5) 0.95 (0.66,1.37)
• Relative risk and confidence interval relati ve to Comparisons. b Adjusted for percent body fat at the time of the blood measurement of dioxin.
Note: RH = Ranch Hand. Comparison: 1987 Dioxin $ 10 ppt. Background (Ranch Hand): 1987 Dioxin $ 10 ppi. Low (Ranch Hand): 1987 Dioxin> 10 ppt, 10 ppt < Initial Dioxin $ 94 ppt. High (Ranch Hand): 1987 Dioxin> 10 ppt, Initial Dioxin> 94 ppt.
p-Value
0.345 0.599 0.905 0.781
(f) MO])EL3:RANCH HAJ'olDSAND COll!(PARISONS BY DIOXIN CATEGORY - ADJUSTED
Adjusted Relative .Risk Dioxin Category n . (95%C.I.)'
Comparison 1,193
Background RH 374 0.75 (0.46,1.20) LowRH 235 0.80 (0.47,1.35) High RH 238 1.20 (0.73,1.98) Low plus High RH 473 0.98 (0.67,1.45)
a Relative risk and confidence interval relative to Comparisons.
Note: RH = Ranch Hand. Comparison: 1987 Dioxin $ 10 ppt. Background (Ranch Hand): 1987 Dioxin $ 10 ppt. Low (Ranch Hand): 1987 Dioxin> 10 ppt, 10 ppt < Initial Dioxin $ 94 ppt. High (Ranch Hand): 1987 Dioxin> 10 ppt, Initial Dioxin> 94 ppt.
p-Value
0.227 0.402 0.465 0.923
(g) MODEL 4, RANCHHANDS-1987 DIOXIN - UNADJUSTED .' ..•
1987 ~i9Xin Category SummarySlatistio:$. '.. I·.·. ... . Au8JysisRes~.for.Log, (1.987 Dioxin ,.. 1)
1987 y.' Number(%) .Estimatedll.elative.R.isk ... .. Dioxin n "High .' . . (95% C.L)' "'Value.
Low 283 17 (6.0) 1.14 (0.97,1.33) 0.123 Medium 285 26 (9.1) Hij1;h 284 28 (9.9)
• Relative risk for a twofold increase in 1987 dioxin.
Note: Low = $7.9 ppt; Medium = >7.9-19.6 ppt; High = >19.6 ppt.
(h) MODEL 4: ~NCHHAJ'olDS -.1987 DIOXIN - ADJUSTED
n
Analysis Results for Log, (1987D1oxin,.. 1)
Adjusted ReJativeRisk (9S% C.l.)'
847 1.22 (1.00,1.49)
• Relative risk for a twofold increase in 1987 dioxin.
13-101
p-Value
0.043
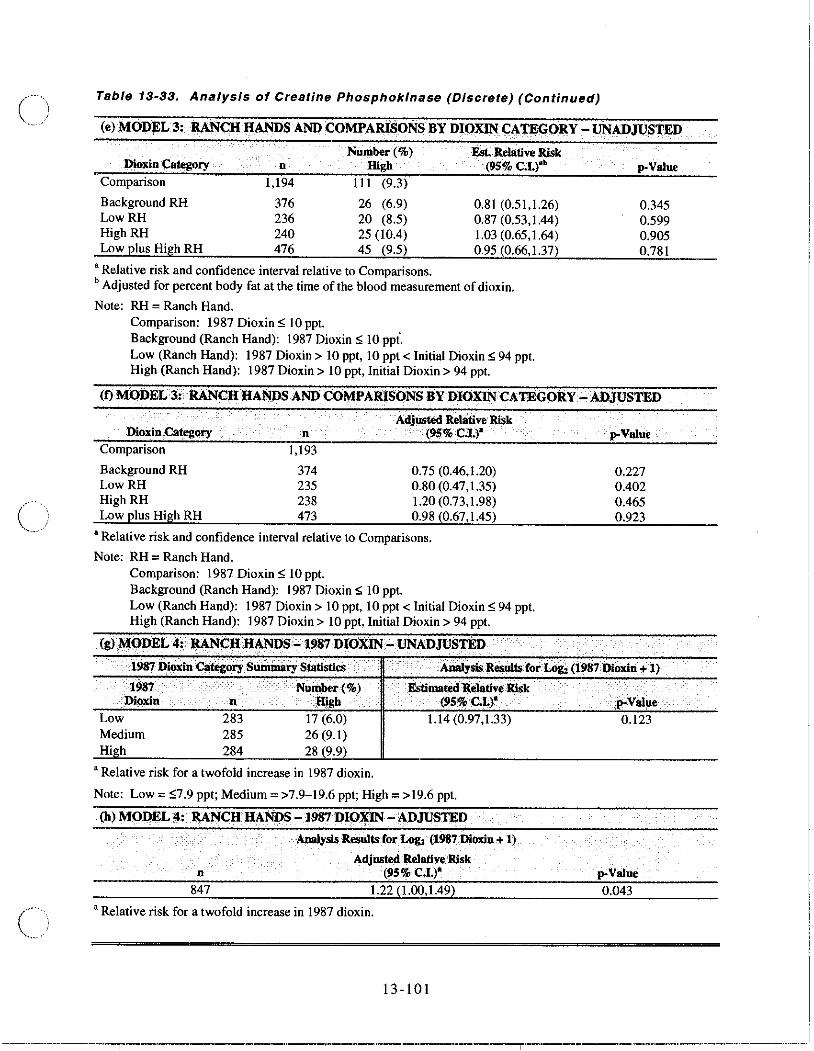
The: unadjusted Model 4 analysis results were nonsignificant (Table 13-33(g): p=0.123). After adjusting for yovariates, a significant relation between creatine phosphokinase in its dichotomous form and 1987 diOJ\in was revealed (Table 13-33(h): Adj. RR=1.22, p=0.043). The percentages of participants with high lev'lls of creatine phosphokinase in the low, medium, and high 1987 dioxin categories were 6.0, 9.1, and 9 .9,,respectively.
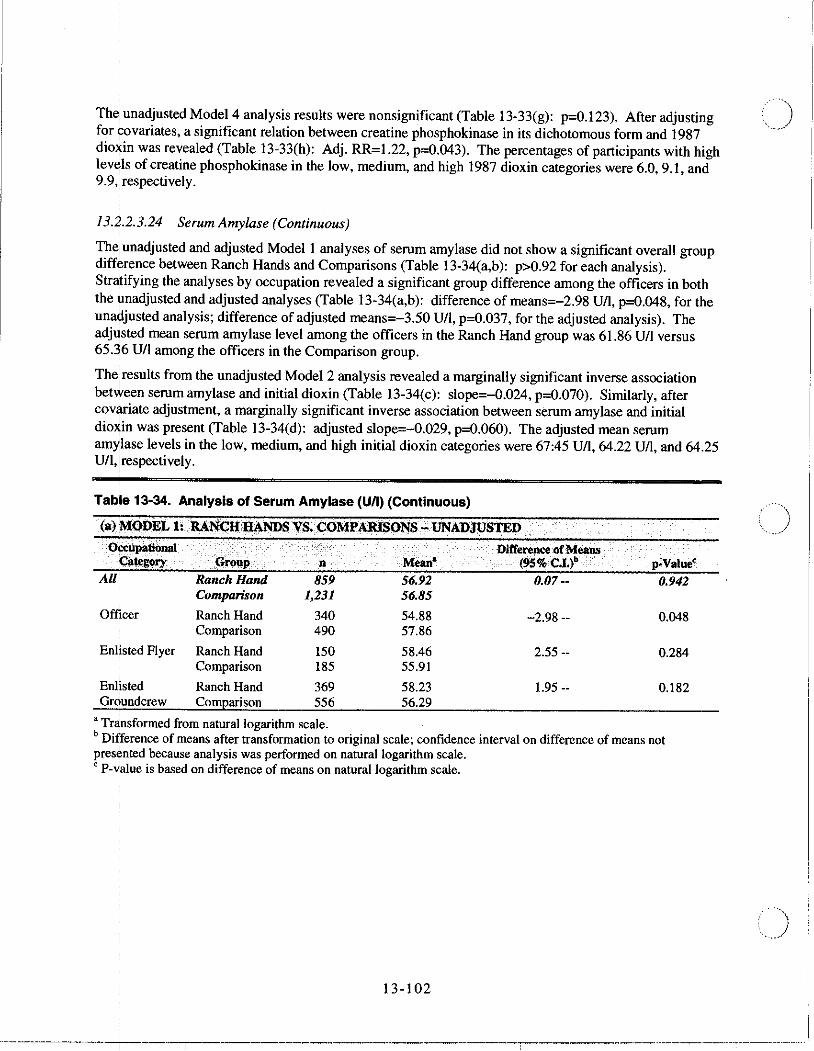
13.2.2.3.24 Serum Amylase (Continuous)
Theiunadjusted and adjusted Modell analyses of serum amylase did not show a significant overall group difference between Ranch Hands and Comparisons (Table 13-34(a,b): p>0.92 for each analysis). Stra~ifying the analyses by occupation revealed a significant group difference among the officers in both the Unadjusted and adjusted analyses (Table 13-34(a,b): difference of means=-2.98 UII, p=0.048, for the una~justed analysis; difference of adjusted means=-3.50 UIl, p=0.037, for the adjusted analysis). The adj~sted mean serum amylase level among the officers in the Ranch Hand group was 61.86 Ull versus 65.~6 utI among the officers in the Comparison group.
The , results from the unadjusted Model 2 analysis revealed a marginally significant inverse association ,
between serum amylase and initial dioxin (Table 13-34(c): slope=-O.024, p=0.070). Similarly, after covl)riate adjustment, a marginally significant inverse association between serum amylase and initial dio~in was present (Table 13-34(d): adjusted slope=-0.029, p=0.060). The adjusted mean serum am~lase levels in the low, medium, and high initial dioxin categories were 67:45 UII, 64.22 UIl, and 64.25 U/I,lrespectively.
Table 13-34. Analysis of Serum Amylase (UlI) (Continuous)
(a) re<>DEL l:.RANCH.aiU"OS YS.COMPAIUSONS .-UNADJUSTED Oi:<:upatibnal Difference of Means ~tegoryGroup n Mean' (9S%.C.I.)b .
All i . Ranch Hand 859 56.92 0.07 __ 0.942 Comparison 1,231 56.85
Officer Ranch Hand 340 54.88 -2.98 -- 0.048 Comparison 490 57.86
EnlIsted Flyer Ranch Hand 150 58.46 2.55 -- 0.284 Comparison 185 55.91
EnlIsted Ranch Hand 369 58.23 1.95 -- 0.182 Gr9undcrew Comparison 556 56.29
• Transformed from natural logarithm scale. b Difference of means after transformation to original scale; confidence interval on difference of means not pres¢nted because analysis was performed on natural logarithm scale. , P-value is based on difference of means on natural logarithm scale.
\3-\ 02
)1
-·-··--.. ·-------------r-·-----T-----------·---.. ---·-··--··--·----------T-------·-·-·--·-----------··--··----·-·---.-.. -.

()
Table 13-34. Analysis of Serum Amylase (UlI) (Continuous) (Continued)
.(b)MODEL 1: llANCHHANDS VS. COMPARISONS - ADJUSTED
Occupational Dirterenee of Adj. Means Category GrollP 0 Adj. Me.ao' (95% C,Ll' p-Value'
All Ranch Hand 854 63.65 -(J.09 -.. 0.929 Comparison 1,229 63.74
Officer Ranch Hand 340 61.86 -3.50-·· 0.037 Comparison 489 65.36
Enlisted Flyer Ranch Hand 148 65.17 2.73 -. 0.301 Comparison 184 62.44
Enlisted Ranch Hand 366 64.84 1.98 -- 0.218 Groundcrew Comparison 556 62.86
• Transformed from natural logarithm scale. b Difference of means after transformation to original scale; confidence interval on difference of means not presented because analysis was performed on natural logarithm scale. 'l'-value is based on difference of means on natural logarithm scale.
(e) MODEL 2:· llANCHHANDS -JNlTIAL I>IOXlN-VNADJUSn:D
Initial Dioxin Category Summill.yStattSti.. . ., .. '. 'AUa!y!ils Results {or Loll: (Initial Dioxin)' . .' .' . Slope
R' . . (Std. Err!>r)' Initial DI!,xln 0 M~' A.dj.Mean" p-Value
Low 158 59.22 58.66 0.052 -0.024 (0.013) 0.070 Medium 159 55.89 55.83 High 159 55.54 56.13
• Transformed from natural logarithm scale. b Adjusted for percent body fat at the time of the blood measurement of dioxin. , Slope and standard error based on natural logarithm of serum amylase versus log, (initial dioxin).
Note: Low = 27-63 ppt; Medium = >63-152 ppt; High = > 152 ppt.
(d) MOI>EL 2: llANCIl.HANDS._INFrlAL DlO:xJN:'- ADJUSW . . .. '. .. -,
•.... " ........•... ..' .'. . ....... , •.. ",\dj.Slope· .•..
Initial DlO=!dn n Adj.¥ean· It' (Std. Error)' p-Value
Low 158 67.45 0.125 -0.029 (0.015) 0.060 Medium 158 64.22 High 157 64.25 .
• Transformed from natural logarithm scale. b Slope and standard error based on natural logarithm of serum amylase versus log, (initial dioxin).
Note: Low = 27-63 ppt; Medium = >63-152 ppt; High = >152 ppt.
13-103
-----.-----------.--.-:-T----------.--.---~-------~.-.-.---.---,-.-.--------.--... --".-.-.. -----.-... --.-.---.. --
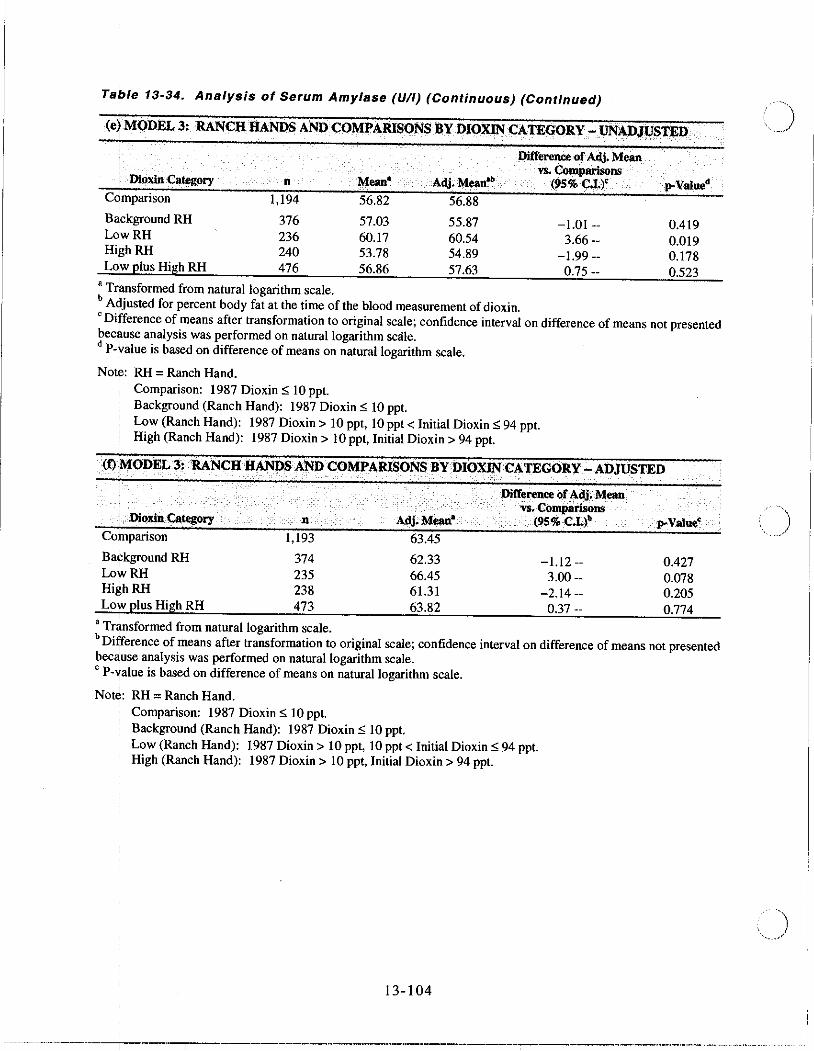
Table 13-34. Analysis of Serum Amylase (UII) (Continuous) (Continued)
<eJ MQDEL 3: RANCH HANDS AND COMPARISONS BYDIOXIJIICATEGORY - UN'ADJ·USTED. I ' ' ", , ~
DitTerence of Adj. Mean
Adj. Mean" vs. Comparisons
!>'Valued , DioxinCategllry n Mean- (95% CJ.)' I •
1,194 Comparison 56.82 56.88
Background RH 376 57.03 55.87 -1.01 .. 0.419 LowRH 236 60.17 60.54 3.66 _. 0.019 Hi~hRH 240 53.78 54.89 -1.99 _. 0.178 LOF plus High RH 476 56.86 57.63 0.75 _. 0.523 . '
b A justed for percent body fat at the time of the blood measurement of dioxin. Trt;fOrmed from natural logarithm scale.
e Di ference of means after transformation to original scale; confidence interval on difference of means not presented because analysis was performed on natural logarithm scale. d p.{.alue is based on difference of means on natural logarithm scale.
Note: RH = Ranch Hand. Comparison: 1987 Dioxin:;; 10 ppt. Background (Ranch Hand): 1987 Dioxin:;; 10 ppt. Low (Ranch Hand): 1987 Dioxin> 10 ppt, 10 ppt < Initial Dioxin:;; 94 ppt. High (Ranch Hand): 1987 Dioxin> 10 ppt, Initial Dioxin> 94 ppt.
(f) ,"ODEL3:RANCH HANDS 'AND COMPARISONS BY DIOXIN CATEGORY- ADJUSTED !
Colnparison' DioxinCotegory n
1,193
Ba~kground RH 374 LowRH 235 High RH 238 Lor plus High RH 473
63.45
62.33 66.45 61.31 63.82
Difference of Adj; Mean . "".ComparisOns
(95% eL)'
-1.12·· 3.00 ..
-2.14·· 0.37 ..
!>'Value'
0.427 0.078 0.205 0.774
, Tr~nsformed from natural logarithm scale. b Diflference of means after transformation to original scale; confidence interval on difference of means not presented
,
bec~use analysis was performed on natural logarithm scale. , P·~alue is based on difference of means on natural logarithm scale.
Not~: RH = Ranch Hand. Comparison: 1987 Dioxin:;; 10 ppt. Background (Ranch Hand): 1987 Dioxin:;; 10 ppt. Low (Ranch Hand): 1987 Dioxin> 10 ppt, 10 ppt < Initial Dioxin:;; 94 ppt. High (Ranch Hand): 1987 Dioxin> 10 ppt, Initial Dioxin> 94 ppt.
13-104
.--.---- ... ---.-----r-.---.-,---.-----.. ---.. --.---.. ----------.-----------....... --....... - ... - .. - ........ ---.. --.....
(
(;
Table 13-34. Analysis of Serum Amylase (UII) (Continuous) (Continued)
(g) MODEL 4: RANCH HANDS - 1987 DIOXIN - UNADJUSTED . . .
1987 Dioxin Category SnlDl11lIlY Statisti", Analysis Results for ~ (1.987 Dioxin +1)
1987 Dioxin
Low Medium High
n
283 285 284
57.84 57.77 55.23
, Transformed from natural logarithm scale.
0.005
Adjusted Slor (Std. Error) .
-0.019 (0.009)
b Slope and standard error based on natural logarithm of serum amylase versus log, (1987 dioxin + I).
Note: Low = $7.9 ppt; Medium = >7.9-19.6 ppt; High = >19.6 ppt.
(h) MODEL 4: RANCH HANDS-1987 DIOXIN - ADJUSTED
p-Value
0.035
1987 Dioxin Category SUlIIIDlIry Statistics .... Ana1ysis'Results for Log, (1987 Dioxin + 1) 1987 . .
Dioxin
Low Medium High
n
283 283 281
Adj. Mean'
68.24 66.40 62.16
, Transformed from natural logarithm scale.
.. Adjusted Slope R' (Std. Errod'
0.063 -0.030 (0.010)
b Slope and standard error based on natural logarithm of serum amylase versus log, (1987 dioxin + I).
Note: Low = $7.9 ppt; Medium = >7.9-19.6 ppt; High = >19.6 ppt.
p-Value
0.003
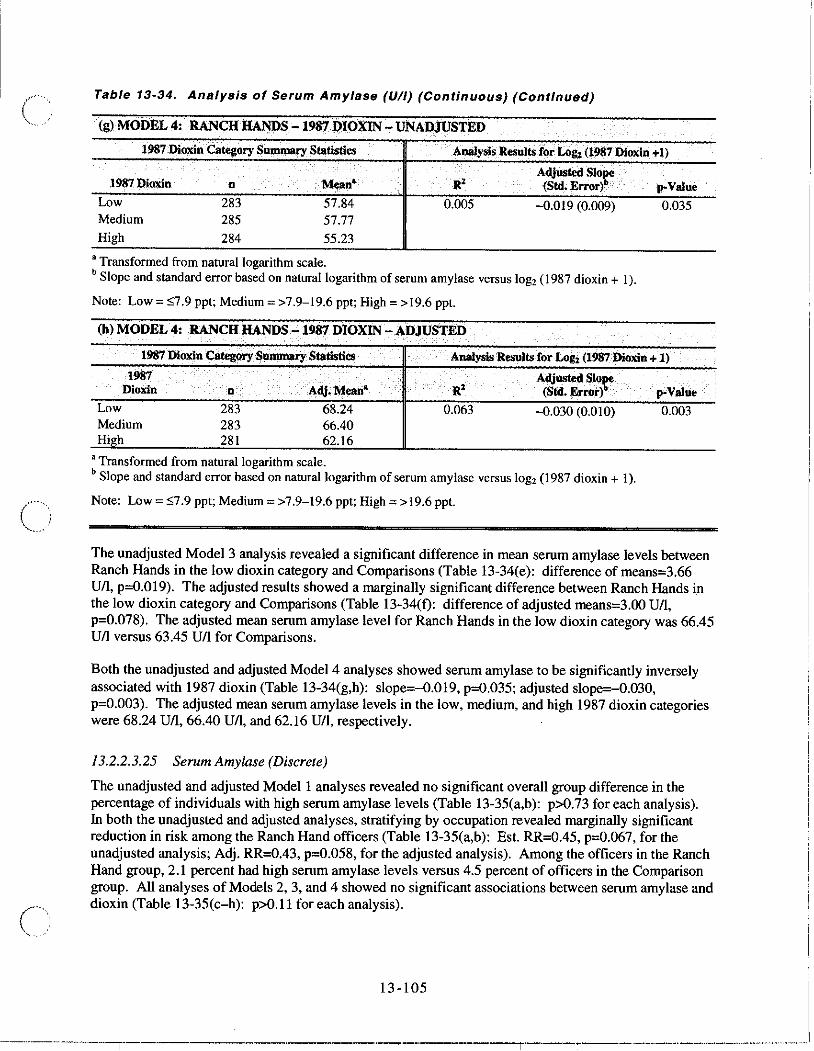
The unadjusted Model 3 analysis revealed a significant difference in mean serum amylase levels between Ranch Hands in the low dioxin category and Comparisons (Table 13-34(e): difference of means=3.66 UII, p=O.019). The adjusted results showed a marginally significant difference between Ranch Hands in the low dioxin category and Comparisons (Table 13-34(f): difference of adjusted means=3.00 UII, p=0.078). The adjusted mean serum amylase level for Ranch Hands in the low dioxin category was 66.45 UII versus 63.45 UII for Comparisons.
Both the unadjusted and adjusted Model 4 analyses showed serum amylase to be significantly inversely associated with 1987 dioxin (Table 13-34(g,h): slope=-·0.019, p=O.035; adjusted slope=-0.030, p=0.003). The adjusted mean serum amylase levels in the low, medium, and high 1987 dioxin categories were 68.24 UII, 66.40 UII, and 62.16 UII, respectively.
13.2.2.3.25 Serum Amylase (Discrete)
The unadjusted and adjusted Modell analyses revealed no significant overall group difference in the percentage of individuals with high serum amylase levels (Table 13-35(a,b): p>O.73 for each analysis). In both the unadjusted and adjusted analyses, stratifying by occupation revealed marginally significant reduction in risk among the Ranch Hand officers (Table 13-35(a,b): Est. RR=0.45, p=O.067, for the unadjusted analysis; Adj. RR=0.43, p=O.058, for the adjusted analysis). Among the officers in the Ranch Hand group, 2.1 percent had high serum amylase levels versus 4.5 percent of officers in the Comparison group. All analyses of Models 2, 3, and 4 showed no significant associations between serum amylase and dioxin (Table 13-35(c-h): p>O.l1 for each analysis).
13 -1 05
-_ .... _._ ... _--_."._._._---------_._--------'--_.-_.-._.-----,-'_._----_. __ .... ,._ .. - ...... _._-_._ ........ __ ._ .........
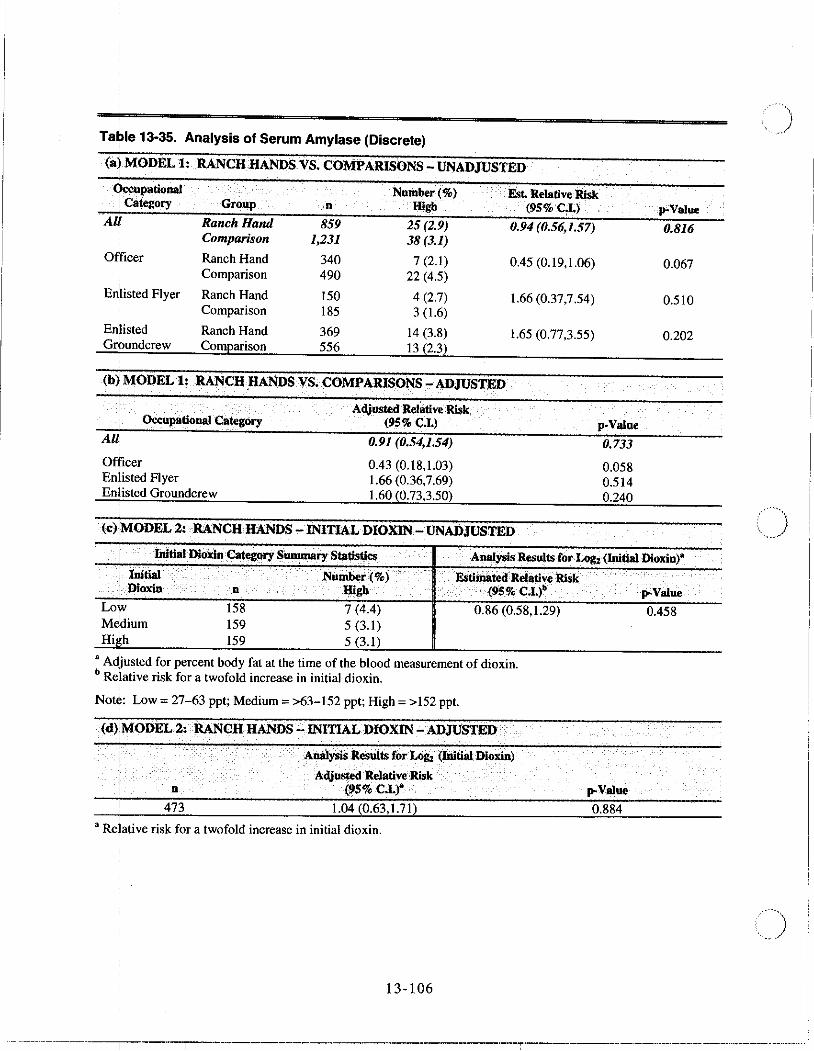
Table 13-35. Analysis of Serum Amylase (Discrete) ,
(alMODEL 1: RANCH HANDS VS. COMPARISONS - UNADJUSTED
Qccupational Number ('l'C) Est. Relative Risk : Category Group ,n High (95% CJ.)
All Ranch Hand 859 25 (2.9) 0.94 (0.56.1.57) Comparison 1,231 38 (3.1)
Officer Ranch Hand 340 7 (2.1) OA5 (0.19,1.06) Comparison 490 22 (4.5)
Enlisted Flyer Ranch Hand 150 4 (2.7) 1.66 (0.37,7.54) Comparison 185 3 (1.6)
Enlisted Ranch Hand 369 14 (3.8) 1.65 (0.77,3.55) Grbundcrew Comparison 556 13 (2.3)
(b~ MODEL 1: RANCH HANDS VS. COMPARISONS - ADJUSTED
Occullational Category
All',
Offtcer Enlisted Flyer Enjisted Groundcrew
Adjusted Relative Risk (95% C.I.)
0.91 (0.54,1.54)
0.43 (0.18,1.03) 1.66 (0.36,7.69) 1.60 (0.73,3.50)
(~) IMODEL2: .. RANCH HANDS .. INITIAL DIOXIN- UNADJUSTED
p.Value
0.733
0.058 0.514 0.240
poValue
0.816
0.067
0.510
0.202
I Initial Di(lxin Caleg<!rysummary SIa!lsl,lcs A,,*,",s Results for Logz (InitlalDioxin)*
'. EstimatedRelativeRlsk. .. . . (95% C.L)" poValue
i Initial Number (%) . II Dioxin n lIigh
Lo~ 158 7 (4A) 0.86 (0.58,1.29) 0.458 Medium 159 5 (3.1) High 159 5 (3.1)
• Adjusted for percent body fat at the time of the blood measurement of dioxin. b Relative risk for a twofold increase in initial dioxin.
Not~: Low = 27-63 ppt; Medium = >63-152 ppt; High = > 152 ppt.
(d)iMODEL 21RANCHHANDS - INITIAL DIOXIN - ADJUSTED .
n
473
Analysis Resuits for Log, (Initial Dioxin)
Adjusted Relative Risk (95'l'C C.I.)"
1.04 (0.63,1.71)
, Relative risk for a twofold increase in initial dioxin.
13·106
poValue
0.884
·---· .. -·-------,--·---.. -T--· .. ·-----.. ---··---·---.. ---·--· .... -----,------.. -.-.--....... - .... - .... -.-...... ---- ............... .
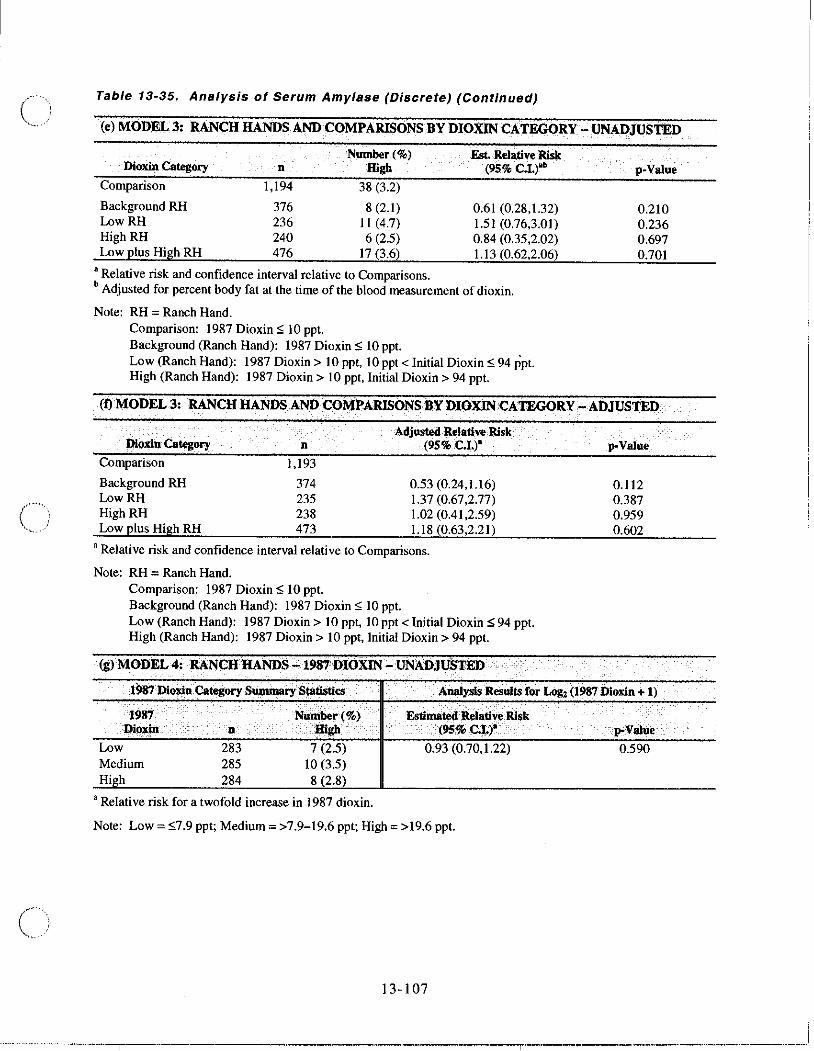
() Table 13-35. Analysis of Serum Amylase (Discrete) (Continued)
(e) MODEL 3: RANCH HANDS AND COMPARISONS BY DIOXIN CATEGORY - UNADJUSTED
Dioxin Category
Comparison
Background RH LowRH High RH Low plus High RH
n
1,194
376 236 240 476
Number(%) High
38 (3.2)
8 (2.1) II (4.7) 6 (2.5)
17 (3.6)
Est. Relative Risk (95% CJ:.)'b
0.61 (0.28,1.32) 1.51 (0.76,3.01) 0.84 (0.35,2.02) 1.13 (0.62,2.06)
'Relative risk and confidence interval relative to Comparisons. b Adjusted for percent body fat at the time of the blood measurement of dioxin.
Note: RH; Ranch Hand. Comparison: 1987 Dioxin::; 10 ppt. Background (Ranch Hand): 1987 Dioxin::; 10 ppt. Low (Ranch Hand): 1987 Dioxin> 10 ppt, 10 ppt < Initial Dioxin::; 94 ppt. High (Ranch Hand): 1987 Dioxin> 10 ppt, Initial Dioxin> 94 ppt.
p-Value
0.210 0.236 0.697 0.701
(f) MODEL.3:RANCHHANDS AND COM"PARISONSBY DIOXlNCA TEGORY- ADJUSTED
. Qioxin Category
Comparison
Background RH LowRH HighRH Low plus High RH
n
1,193
374 235 238 473
Adjusted Relative Risk. (9S%C.I.)·
0.53 (0.24,1.16) 1.37 (0.67,2.77) 1.02 (0.41,2.59) 1.18 (0.63,2.21)
a Relative risk and confidence interval relative to Comparisons.
Note: RH; Ranch Hand. Comparison: 1987 Dioxin::; 10 ppt. Background (Ranch Hand): 1987 Dioxin::; 10 ppt. Low (Ranch Hand): 1987 Dioxin> 10 ppt, 10 ppt < Initial Dioxin::; 94 ppt. High (Ranch Hand): 1987 Dioxin> 10 ppt, Initial Dioxin> 94 ppt.
(g) MODEL 4: RANCH HANDS -1987 DIOXlN -UNADJUS1lED .. .
p-Value
0.112 0.387 0.959 0.602
Analysis Results for Log, (1987 Dioxin + 1)
1987 Number(%) EstimatedltelativeRisk. . l)i01'In .. ." n . ..... ~ . .. (95% q.) •. . p-Value
Low 283 7 (2.5) 0.93 (0.70,1.22) 0.590 Medium 285 10 (3.5) High 284 8 (2.8)
, Relative risk for a twofold increase in 1987 dioxin.
Note: Low; ::;7.9 ppt; Medium; >7.9-19.6 ppt; High; >19.6 ppt.
13-107
'-'-"'---"'--' --.--.:---r--.. ----------.----'----'--.-.-"---.~.-.------.--"-.".-~".-"-.. -.--.---.-.... ----.-.---.-
,
I
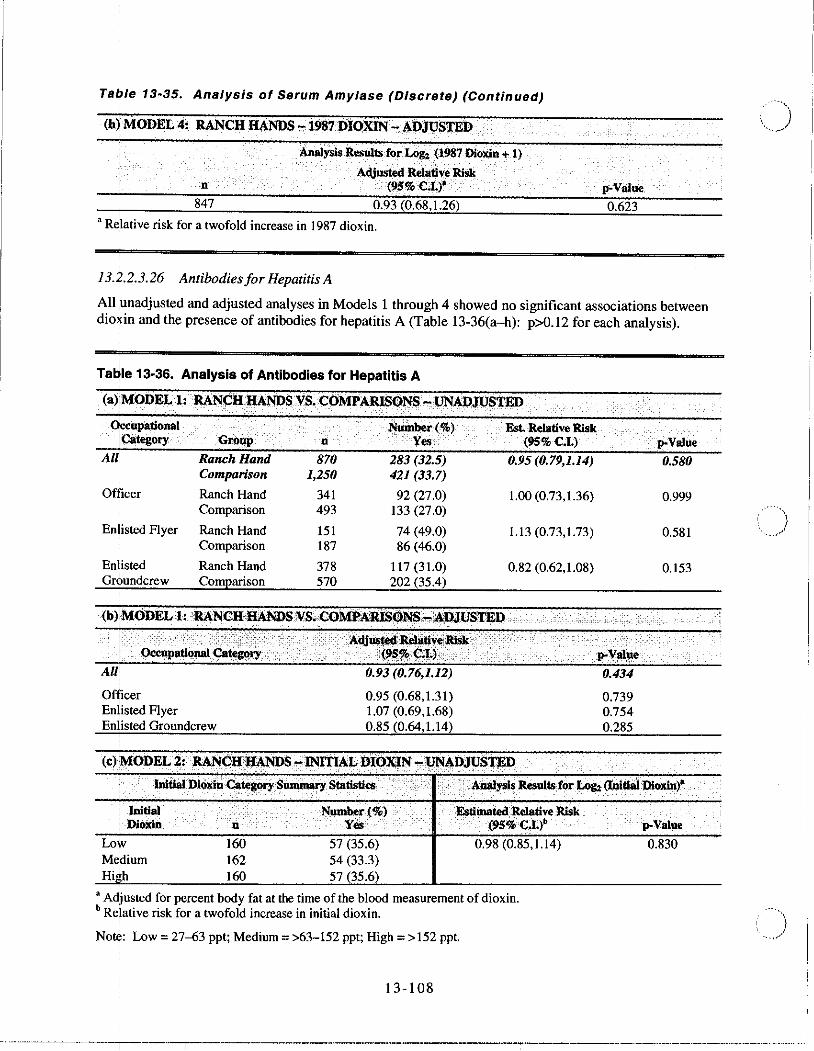
Table 13-35. Analysis of Serum Amylase (Discrete) (Continued)
(hj MODEL 4: RANCH HANDS .,,1987DJQXIN.., MJJ~Sll'ED .
n
847
Analysis Results for. Log, (1987 Dioxin + 1)
Adjusted Relative Risk (95%(:.1.)' .
0.93 (0.68,1.26)
'Relative risk for a twofold increase in 1987 dioxin.
13.2.2.3.26 Antibodiesfor Hepatitis A
p-VaJue
0.623
All pnadjusted and adjusted analyses in Models 1 through 4 showed no significant associations between dioJ>in and the presence of antibodies for hepatitis A (Table 13-36(a-h): p>0.12 for each analysis).
Ta~le 13-36. Analysis of Antibodies for Hepatitis A
(a)!MODEL l:RANCHHANDSVS. C(jMPAIUSONS . ..,UN;\DJUS'I'ED
cupational N.um.er(%) Category GrmIP n Yes
All' Ranch Hand 870 283 (32.5) Comparison 1,250 421 (33.7)
Officer Ranch Hand 341 92 (27.0) Comparison 493 133 (27.0)
Enlisted Flyer Ranch Hand 151 74 (49.0) Comparison 187 86 (46.0)
Enlisted Ranch Hand 378 117 (31.0) Gnimndcrew ComEarison 570 202 (35.4)
I 'h '</'Adjusted~ti~I\<Ri$k I Ocellpatio,,", Ca~~~<'~~~;L)i
Alli
Of$cer Enlisted Flyer Enlisted Groundcrew
0.93 (0.76,1.12)
0.95 (0.68,1.31) 1.07 (0.69,1.68) 0.85 (0.64,1.14)
Est. Relative Risk (95% C.!.)
0.95 (0.79,1.14)
1.00 (0.73,1.36)
1.13 (0.73,1.73)
0.82 (0.62,1.08)
(c) !MODEL 2: RANCH 'HANDS "'INlTIALDIOX'IN .,.,UNADJUSTED
0.434
0.739 0.754 0.285
p-Value
0.580
0.999
0.581
0.153
Initial Dioxin CalegorySUIIIltUIry Statisties ' •. "". '<""" '.Analysls ResuJtsfor Log, (Initial Dioxln)" ."
Initial .' "Number{%) '.' Estimated Relative Risk ; Dioxin .' n .'.' . Yeo <95%CJ.)"
Low 160 57 (35.6) 0.98 (0.85,1.14) Medium 162 54 (33.3) Hi~h 160 57 (35.6)
, Adjusted for percent body rat at the time of the blood measurement of dioxin. b Relative risk for a twofold increase in initial dioxin.
Not<!: Low = 27--63 ppt; Medium = >63-152 ppt; High = >152 ppt.
13-108
. p-Value
0.830
,) ",_ . .;.s
-·····-·----.. --·-----T-·---··-,---.. ------.. ---···----·----.. ---.--.. -------------...... --...... - .... -.. - .......... --.- .... ..
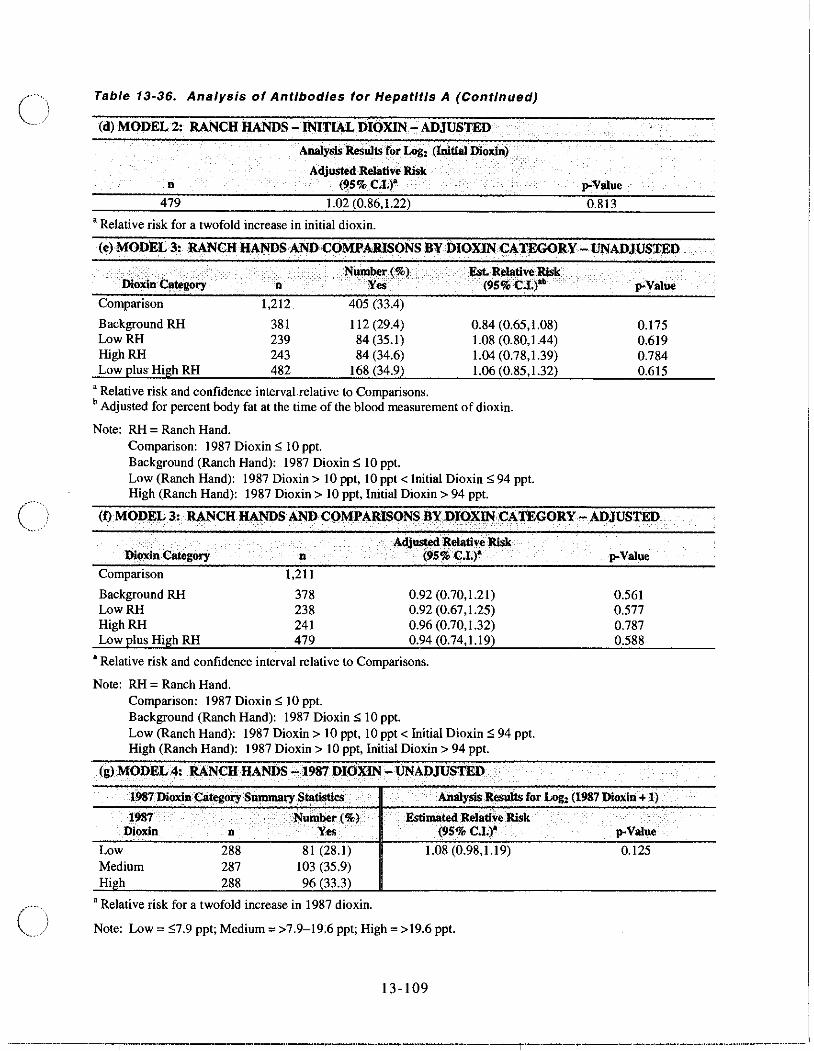
Table 13-36. Analysis of Antibodies for Hepatitis A (Continued)
(d) MODEL.2: RANCH HANDS - INITIAL DIOXIN - ADJUSTED
n
479
Anai3'slsResuil' for Log, (InItial Dioxin)
AdjllSt!>dReiative Risk (9S%C.l.)·
1.02 (0.86,1.22)
a Relative risk for a twofold increase in initial dioxin.
p-Value
0.813
(e) MODa 3: RANCH HANDS AND COMPARISONS .BY.DlOXINCATEGORY-UNADJUSTED
DioxiDCa~ry n Number(%)
. YeS .Est.R~ve~k
(95%C.I.)
Comparison 1,212 405 (33.4)
Background RH 381 112 (29.4) 0.84 (0.65,1.08) LowRH 239 84 (35.1) 1.08 (0.80,1.44) HighRH 243 84 (34.6) 1.04 (0.78,1.39) Low plus High RH 482 168 (34.9) 1.06 (0.85,1.32)
'Relative risk and confidence interval relative to Comparisons. b Adjusted for percent body fat at the time of the blood measurement of dioxin.
Note: RH = Ranch Hand. Comparison: 1987 Dioxin" 10 ppt. Background (Ranch Hand): 1987 Dioxin" 10 ppt. Low (Ranch Hand): 1987 Dioxin> 10 ppt, 10 ppt < Initial Dioxin" 94 ppt. High (Ranch Hand): 1987 Dioxin> 10 ppt, Initial Dioxin> 94 ppt.
p-Value
0.175 0.619 0.784 0.615
(t') MODEL 3: RANCH RANDS AND COMPARISON$ BY DI0,XiINCATEGORY- ADJUSTED
Adjusted Relative Risk Die»<lnCategory D (95% .c.I.)~
Comparison 1,211
Background RH 378 0.92 (0.70,1.21) LowRH 238 0.92 (0.67,1.25) High RH 241 0.96 (0.70,1.32) Low plus High RH 479 0.94 (0.74,1.19)
• Relative risk and confidence interval relative to Comparisons.
Note: RH = Ranch Hand. Comparison: 1987 Dioxin" 1 0 ppt. Background (Ranch Hand): 1987 Dioxin" 1 0 ppt. Low (Ranch Hand): 1987 Dioxin> 10 ppt, 10 ppt < Initial Dioxin" 94 ppt. High (Ranch Hand): 1987 Dioxin> 10 ppt, Initial Dioxin> 94 ppt.
(g) MODEL4: RANCH HANlJS -1987 DIOXIN - UNADJUSTED.· ..
. p.Value
0.561 0.577 0.787 0.588
1987 Dioxin ~orySu~ry Statistics Analysis Results for Log, (1987 Dioxin +1) 1987 --: . ··Number(%)
: Dioxin n Yes
Low Medium Hi.h
288 287 288
81 (28.1) 103 (35.9) 96 (33.3)
'Relative risk for a twofold increase in 1987 dioxin.
Estimated Relative Risk (95% C.T;)"
1.08 (0.98,1.\9)
Note: Low = ,,7.9 ppt; Medium = >7.9-19.6 ppt; High = >19.6 ppt.
13 -1 09
. .
p-Value .
0.125
---------_____ ._ .. ..-,-_._. __________ . _________ '_~.-.-P~---.--r.-.--------'.~.".-~"---.. -.--.-..... -.-.-."--.-
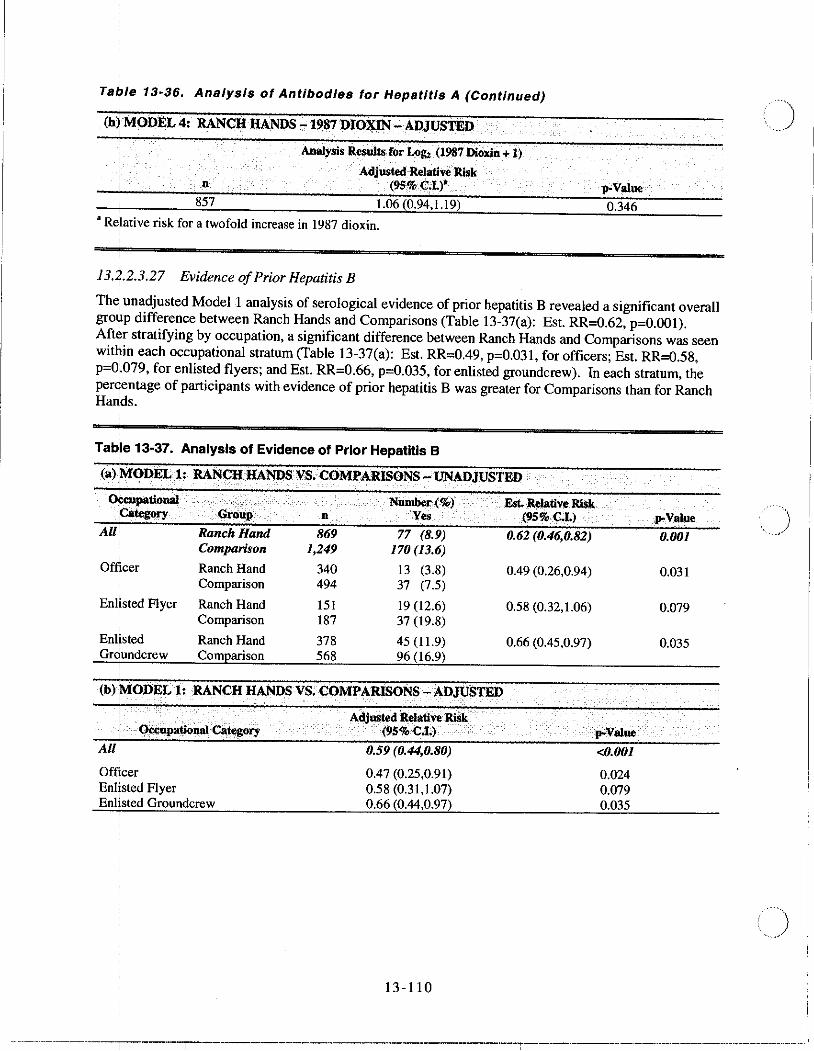
Taqle 13-36. Analysis of Antibod/es for Hepatitis A (Continued)
(h~ MODEL 4: RANCH HANDS ,.. 1~87 DIOXIN -ADJUSTED
D
857
Analysis Results for Log, (1987 Dioxi.D + 1)
AdJusted'RelatlveRisk (95% C,I.)*
1.06 (0.94.Ll9)
• Relative risk for a twofold increase in 1987 dioxin.
13.t2.3.27 Evidence of Prior Hepatitis B
p.VaJue
0.346
The, unadjusted Modell analysis of serological evidence of prior hepatitis B revealed a significant overall group difference between Ranch Hands and Comparisons (Table 13-37(a): Est. RR=0.62, p=O.OOI). After stratifying by occupation. a significant difference between Ranch Hands and Comparisons was seen witllin each occupational stratnm (Table \3-37(a): Est. RR=0.49. p=0.03I, for officers; Est. RR=0.58, p=0~079, for enlisted flyers; and Est. RR=0.66, p=0.035, for enlisted groundcrew). In each stratum, the perQentage of participants with evidence of prior hepatitis B was greater for Comparisons than for Ranch Harids.
Tab,e 13-37. Analysis of Evidence of Prior Hepatitis B
(a) [MODEL 1: RANCH HANDS VS. COMPARISONS - UNADJUSTED
oi:cupatlonaJ Number(%) Est.ltelative Risk Pltegory Group n Yes (9S%C.L)
All' Ranch Hand 869 77 (8.9) 0.62 (0.46,0.82) Comparison 1,249 170(13.6)
Officer Ranch Hand 340 13 (3.8) 0.49 (0.26.0.94) Comparison 494 37 (7.5)
Enlisted Flyer Ranch Hand 151 19 (12.6) 0.58 (0.32.1.06) Comparison 187 37 (19.8)
Enlisted Ranch Hand 378 45 (11.9) 0.66 (0.45,0.97) Grdundcrew Comparison
!
568 96 (16.9)
(b) \\'iODEL 1: RANCH HANDS VS. COMPARISONS - ADJUSTED
All
Off\cer Enlisted Flyer EnlIsted Groundcrew
Adjusted Relative Risk' (9S%C.I.)
0.59 (0.44,0.80)
0.47 (0.25,0.91) 0.58 (0.31.1.07) 0.66 (0.44,0.97)
13-110
p;.Value <0.001
0.024 0.079 0.035
p-Vaiue
0.001
0.031
0.079
0.D35
." ""\ .... .!
(\.)
... ·-··-·---··--T-·-----r---.. -----.. ---·---·-·--··---------------T---·----.. -·---·· .... -··---·-·· .. ·---·-.. ···--··
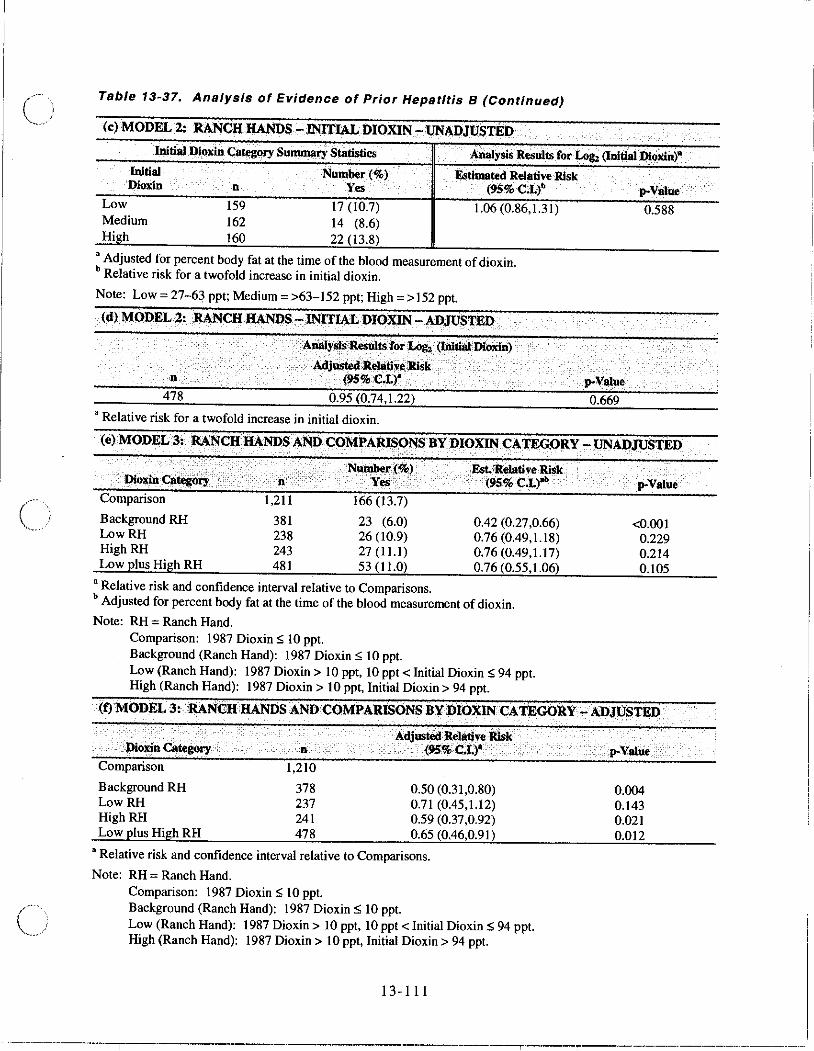
(
()
Table 13-37. Analysis of Evidence of Prior Hepatitis B (Continued)
(e)MODEL2: RANCHHANDS - INITIAL DIOXIN-UNADJUSTED '. . . . . .
. InitlalQIQxln CallmQI"Y SUJtllllll.1"Y Statistics Analysis Results for Log, (Initial {)Ioxin)'
Initial Number (%) Estimalell Reiative'Risk Qloxin n Yes (95% C.I.)"
Low 159 17 (10.7) 1.06 (0.86,1.31) Medium 162 14 (8.6) High 160 22 (13.8)
• Adjusted for percent body fat at the time of the blood measurement of dioxin. b Relative risk for a twofold increase in initial dioxin.
Note: Low = 27-63 ppt; Medium = >63-152 ppt; High = >152 ppt.
(d) MODEL 2: RANCH HANDS - INITIAL DIOXIN -. ADJU$TEQ "
'. Anlily$iS Results for Log, (lblii8l"{)Ioxm)
u'
478 0.95 (0.74,1.22)
• Relative risk for a twofold increase in initial dioxin.
p-Value
0.588
. p-Vlllue
0.669
<eJ MODEL 3: RANCH.HANDS ANQCOMPARISONS BYDIOX~CATEG.oRY - UNADJUSTED
.{)IOXiuCa~O~ Nuinbert%) , . yeS '. Est.'ke!ative Rislc (9S%C.L)"
Comparison 1,211 166 (13.7)
Background RH 381 23 (6.0) 0.42 (0.27,0.66) LowRH 238 26 (10.9) 0.76 (0.49,1.18) High RH 243 27 (11.1) 0.76 (0.49,1.17) Low plus High RH 481 53 (11.0) 0.76 (0.55,1.06)
• Relative risk and confidence interval relative to Comparisons. b Adjusted for percent body fat at the time of the blood measurement of dioxin.
Note: RH = Ranch Hand. Comparison: 1987 Dioxin" 10 ppt. Background (Ranch Hand): 1987 Dioxin" 10 ppt. Low (Ranch Hand): 1987 Dioxin> 10 ppt, 10 ppt < Initial Dioxin" 94 ppt. High (Ranch Hand): 1987 Dioxin> 10 ppt, Initial Dioxin> 94 ppt.
p-Value
<0.001 0.229 0.214 0.105
(t) MODEL 3: RAN(lH HANJ:)S AND COMPARISONS BY DIOXIN CA T)i;OORY- ADJUSTED
Comparison
Background RH LowRH HighRH Low plus High RH
n
1,210
378 237 241 478
Adjusted RellIt!ve Risk (95,% C;r;)" .,
0.50 (0.31,0.80) 0.71 (0.45,1.12) 0.59 (0.37,0.92) 0.65 (0.46,0.91)
• Relative risk and confidence interval relative to Comparisons.
Note: RH = Ranch Hand. Comparison: 1987 Dioxin" 10 ppt. Background (Ranch Hand): 1987 Dioxin" 10 ppt. Low (Ranch Hand): 1987 Dioxin> 10 ppt, 10 ppt < Initial Dioxin" 94 ppt. High (Ranch Hand): 1987 Dioxin> 10 ppt, Initial Dioxin> 94 ppt.
13-111
p-V8Iue
0.004 0.143 0.021 0.012
------------.---~--.----------.---~------'-~.-.-"-"-.--r.-.------.--'"--".-,,--------.--.-.~---~---------
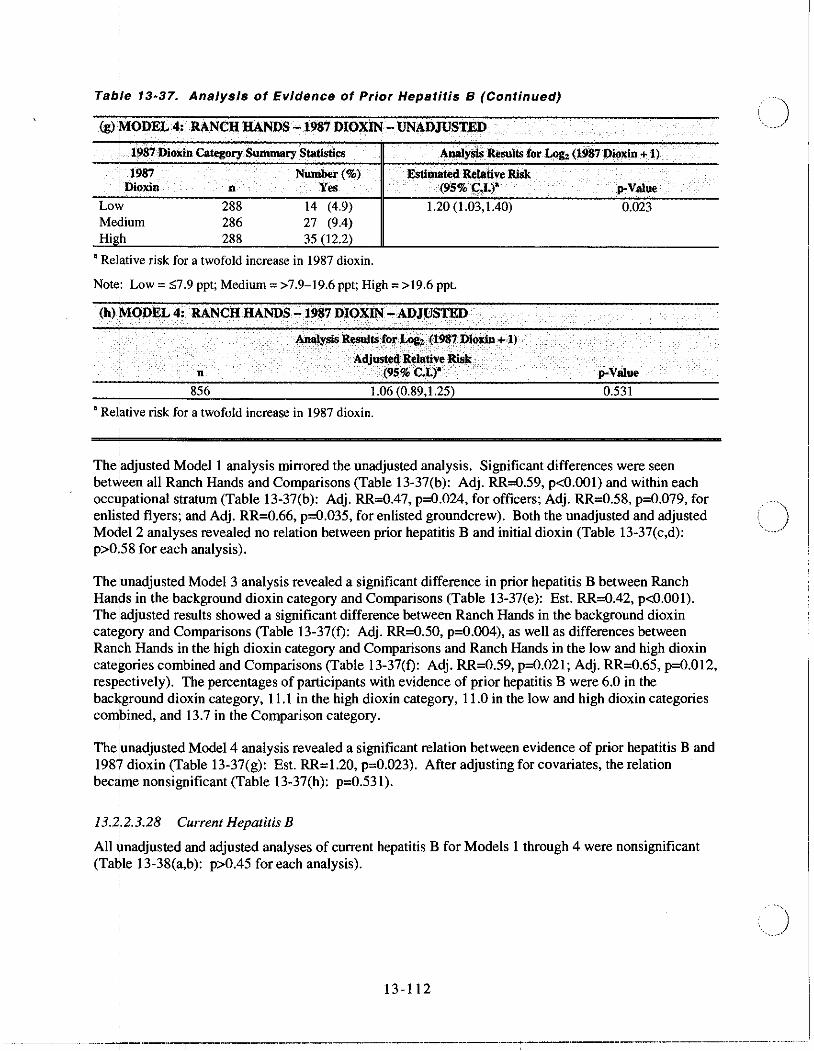
Table 13-37. Analysis of Evidence of Prior Hepatitis B (Continued)
(g) MODEL 4:. RANCH HANDS -1987 DIOXIN - UNADJUSTED i
,1987Dlo"ln CategorySummary statiStics ~nalysiS Results ·for Loez (1li87p11lxin + 1)
1987 .' Number (%) . Estimated. Relative Risk . . i Dioxin n Yes (95% (;,1.)' p-Value
Low 288 14 (4.9) 1.20 (1.03,1.40) 0.023 Medium 286 27 (9.4) High 288 35 (12.2)
• Rel~tive risk for a twofold increase in 1987 dioxin.
Note: Low = ~7.9 ppt; Medium = >7.9-19.6 ppt; High = >19.6 ppt.
(h) MODEL 4:RANCiI.HANDS -1987 DIOXIN -ADJOSTED I "" " ' , !' ' '",
Anaiysis ResuJtsforLOg~(1987 l)IoxlD +1)
AdjustedRel~tlve RiSk. n (95%C;£)' ..
856 1.06 (0.89,1.25)
• Rel~tive risk for a twofold increase in 1987 dioxin.
p-Value
0.531
The :adjusted Model I analysis mirrored the unadjusted analysis. Significant differences were seen bet'Yeen all Ranch Hands and Comparisons (Table 13-37(b): Adj. RR=O.59, p<O.OOI) and within each occljpational stratnm (Table 13-37(b): Adj. RR=0.47, p=O.024, for officers; Adj. RR=0.58, p=0.079, for enli~ted flyers; and Adj. RR=0.66, p=O.035, for enlisted groundcrew). Both the unadjusted and adjusted i') Model 2 analyses revealed no relation between prior hepatitis B and initial dioxin (Table 13-37(c,d): \ ...... p>0:58 for each analysis).
The ,unadjusted Model 3 analysis revealed a significant difference in prior hepatitis B between Ranch Hands in the background dioxin category and Comparisons (Table 13-37(e): Est. RR=0.42, p<O.OOI). The 'adjusted results showed a significant difference between Ranch Hands in the background dioxin cate~ory and Comparisons (Table 13-37(f): Adj. RR=0.50, p=0.OO4), as well as differences between Ranch Hands in the high dioxin category and Comparisons and Ranch Hands in the low and high dioxin categories combined and Comparisons (Table 13-37(f): Adj. RR=0.59, p=0.021; Adj. RR=0.65, p=0.012, resp¢Ctively). The percentages of participants with evidence of prior hepatitis B were 6.0 in the bacl{ground dioxin category. 11.1 in the high dioxin category, 11.0 in the low and high dioxin categories combined, and 13.7 in the Comparison category.
I
The iunadjusted Model 4 analysis revealed a significant relation between evidence of prior hepatitis B and 1987 dioxin (Table 13-37(g): Est. RR=I.20, p=0.023). After adjusting for covariates. the relation bec~me nonsignificant (Table 13-37(h): p=O.531).
13.2:.2.3.28 Current Hepatitis B
All ~nadjusted and adjusted analyses of current hepatitis B for Models 1 through 4 were nonsignificant (TallIe 13-38(a,b): p>0.45 for each analysis).
13-112
... __ .-.. _-_ .. _--,-------,---_._----_._--_._ .. _.--_ .. _---------------;--------_._._. __ .... _-_ .. _-_ ... - .. _-_ ...... _ ... -
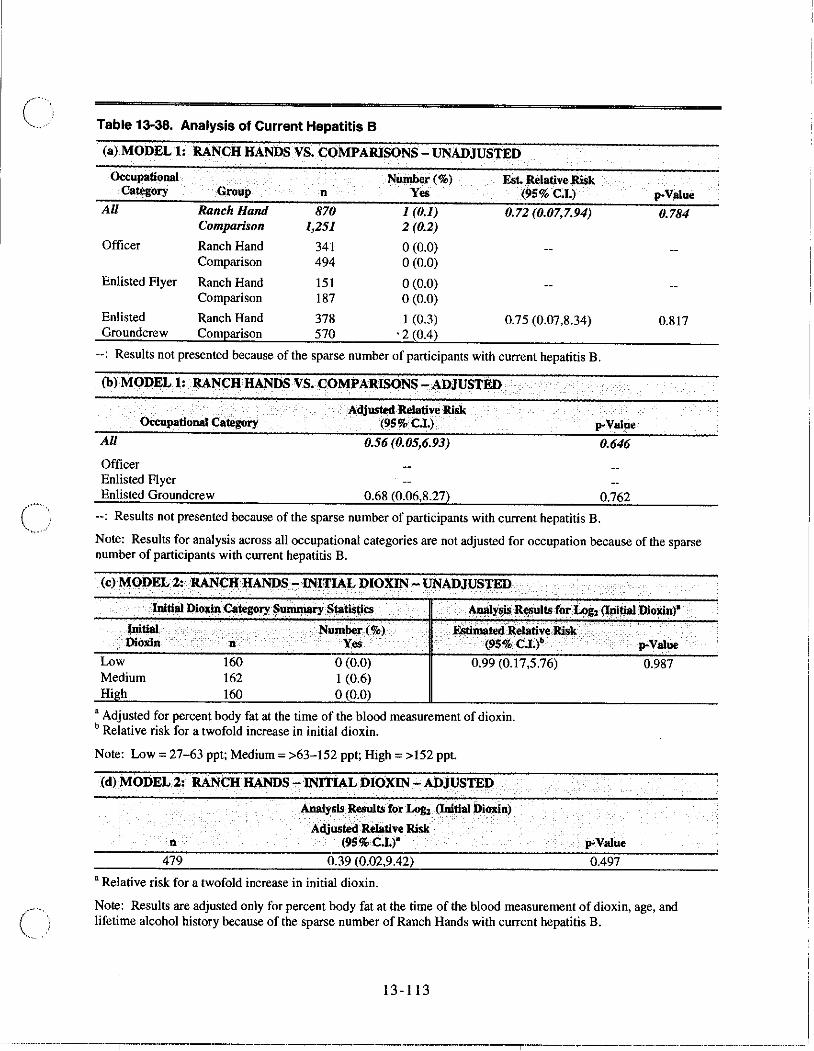
Table 13-38. Analysis of Current Hepatitis B
(a) MODEL 1: RANCH HANDS VS. COMPARISONS - UNADJUSTED
Occupational Number(%) Est. Relative Risk Category Group n Yes (95% C.I.)
All Ranch Hand 870 1 (0.1) 0.72 (0.07,7.94) Comparison 1,251 2 (0.2)
Officer Ranch Hand 341 0(0.0) Comparison 494 0(0.0)
Enlisted Flyer Ranch Hand 151 0(0.0) Comparison 187 0(0.0)
Enlisted Ranch Hand 378 1 (0.3) 0.75 (0.07,8.34) Groundcrew Comparison 570 . 2 (0.4)
.. : Results not presented because of the sparse number of participants with current hepatitis B.
(b) MODELl: RANCH HANDS VS. COMPARlSONS -ADJUSTED.
Occupational Category
All
Officer Enlisted Flyer Enlisted Groundcrew
Adj~ Relative Risk (95%C.I.)
0.56 (0.05,6.93)
0.68 (0.06,8.27)
p-Value
0.646
0.762
p-Value
0.784
0.817
C" ) --: Results not presented because of the sparse number of participants with current hepatitis B.
() "'- '
Note: Results for analysis aCross all occupational categories are not adjusted for occupation because of the sparse number of participants with current hepatitis B.
(c) MODELl: 'RANCH H: ANDS:-INITIAL DIOXIN - UNADJUSTED
.. . ·.JDitial D1o:xlnCategory$~ry Sjatistil!s
IuItlal Number ( %) EStImated ReI8t1ve .R.iSk. , .. ,Dioxin n Yes I· (95% C.I.)"
Low Medium High
160 162 160
0(0.0) 1 (0.6) 0(0.0)
0.99 (0.17,5.76)
• Adjusted for percent body fat at the time of the blood measurement of dioxin. b Relative risk for a twofold increase in initial dioxin.
Note: Low = 27-63 ppt; Medium = >63-152 ppt; High = >152 ppt.
(d) MODELl: RAN.CH HANDS. -INITIAL DIOXIN - ADJUSTED
n
479
Analysis Results for Log, (lnitialDioxin)
Adj~ Relative Risk (95% C.I.)'
0.39 (0.02,9.42)
• Relative risk for a twofold increase in initial dioxin.
p-Value
0.497
p-Value
0.987
Note: Results are adjusted only for percent body fat at the time of the blood measurement of dioxin, age, and lifetime alcohol history because of the sparse number of Ranch Hands with current hepatitis B.
13-113
--., .. ---.-,".-,.-.--~.--.~-.--.-----------.---..--,-----'---.-.------.-r.-.--------,.-.".-".-.. -.. -.-.---.. - ..... -----....... ---.. -.
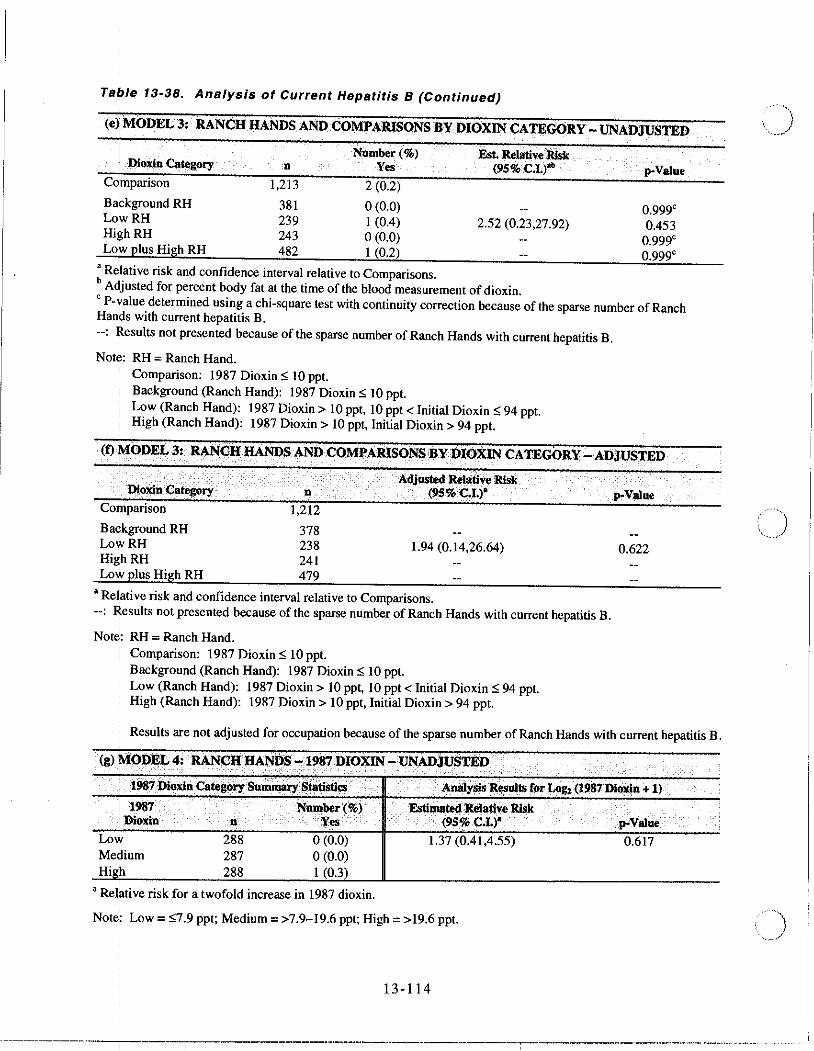
Ta~/e 13-38. Analysis of Current Hepatitis B (Continued)
(e),MODEL 3: RANCH.HANDS_AND CO\\:IPARISONS BY DIOXIN CATEGORY - UNADJUSTED
i Dioxin Ca~()ry n ColIlparison 1,213
Background RH 381 LowRH 239 High RH 243 Low plus High RH 482
Number(%) Yes
2 (0.2)
0(0.0) 1 (0.4) 0(0.0) 1 (0.2)
Est. Rela1ive'Rlsk (9S%C.L)'·
2.52 (0.23,27.92)
a Relative risk and confidence interval relative to Comparisons. b Adjusted for percent body fat at the time of the blood measurement of dioxin.
p-Value
0.999' 0.453
0.999' 0.999'
, P-value determined using a chi-square test with continuity correction because of the sparse number of Ranch Hanps with current hepatitis B. --: Iitesuits not presented because of the sparse number of Ranch Hands with current hepatitis B.
Note: RH = Ranch Hand. Comparison: 1987 Dioxin S 10 ppt. Background (Ranch Hand): 1987 Dioxin S 10 ppt. Low (Ranch Hand): 1987 Dioxin> 10 ppt, 10 ppt < Initial Dioxin S 94 ppt. High (Ranch Hand): 1987 Dioxin> 10 ppt, Initial Dioxin> 94 ppt.
(t)f'iODEL 3: RANGHHANDS AND COMPARISONS BY DIOXIN CATEGORY - ADJUSTED
I i Dioxin Category D
Comparison 1,212
Adjusted Relative RIsk_ (95%C.I.)' _ p-VlIIue
Ba9kground RH 378 LoW RH 238 1.94 (0.14,26.64) 0.622 High RH 241 Lot plus High RH 479
,
a ReI:ative risk and confidence interval relative to Comparisons. --: Results not presented because of the sparse number of Ranch Hands with current hepatitis B.
Not~: RH = Ranch Hand. Comparison: 1987 Dioxin S 10 ppt. Background (Ranch Hand): 1987 Dioxin S 10 ppt. Low (Ranch Hand): 1987 Dioxin> 10 ppt, 10 ppt < Initial Dioxin S 94 ppt. High (Ranch Hand): 1987 Dioxin> 10 ppt, Initial Dioxin> 94 ppt.
Results are not adjusted for occupation because of the sparse number of Ranch Hands with current hepatitis B.
(g)\"ODEL 4: RANCHHANDS,--;1987 DIOXIN ~UNAD:roSTED_ - - _ -_ _
1987 - --- --- Number (%)EstlmatedRelative RIsk .. I Dioxin - u - Yes - (95%-C.L)' p-Value
Low 288 0 (0.0) 1.37 (0.41,4.55) 0.617 Me¥um 287 0 (0.0) Hig!t 288 1 (0.3)
• Rel~tive risk for a twofold increase in 1987 dioxin.
Note: Low = S7.9 ppt; Medium = >7.9-19.6 ppt; High = >19.6 ppt.
13-114
\)
-----------------,--------T---------·----·---·------------.. -------;----------------.-.---------------------------
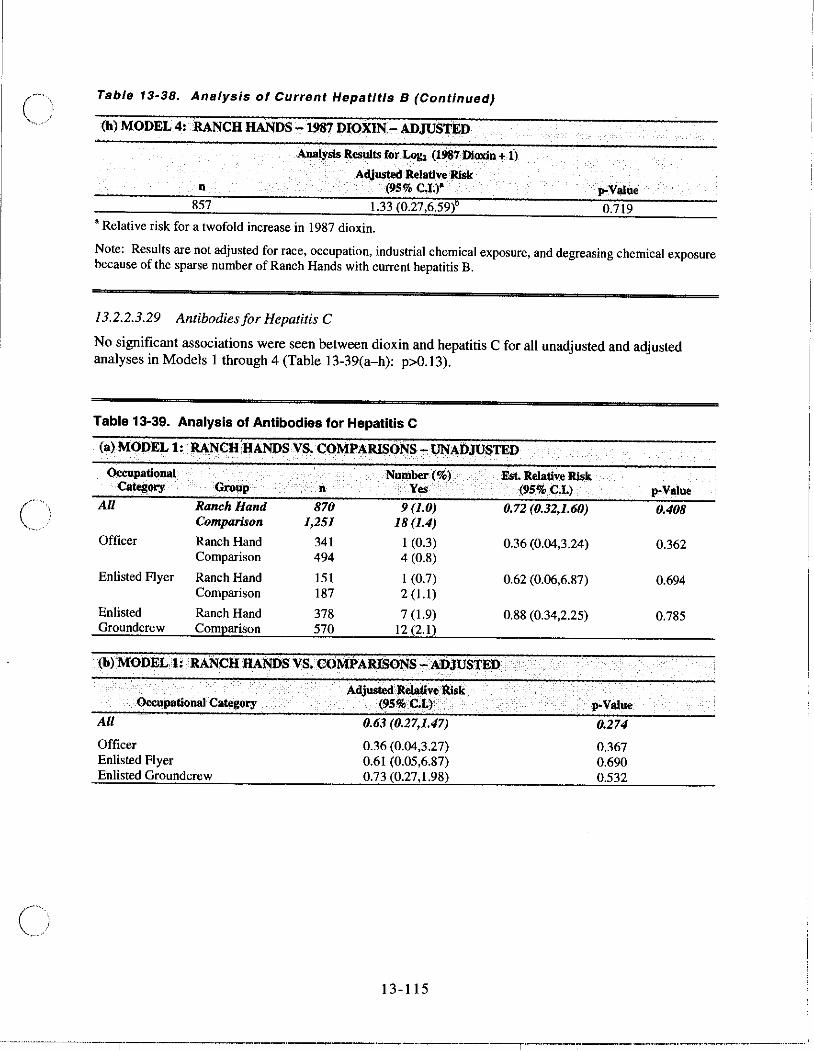
Cl
Table 13-38. Analysis of Current Hepatitis B (Continued)
(h) MODEL 4: RANCH HANDS -1m DIOXlN-ADJUSTED
n
857
Analysis Results for Log, (1987 Dioxin + i) A<\justed RelativeRlsk
(95% C.I.)"
1.33 (0.27,6.59)6
, Relative risk for a twofold increase in 1987 dioxin.
J!'Value 0.719
Note: Results are not adjusted for race, occupation, industrial chemical exposure, and degreasing chemical exposure because of the sparse number of Ranch Hands with current hepatitis B.
13.2.2.3.29 Antibodiesfor Hepatitis C
No significant associations were seen between dioxin and hepatitis C for all unadjusted and adjusted analyses in Models I through 4 (Table 13-39(a-h): p>O.13).
Table 13-39. Analysis of Antibodies for Hepatitis C
(a) MODEL 1: RANCH HANDS VS. COMPARISONS - UNADJUSTED
Oeeupational Nunlber(%) Est. Rclative RIsk Category Gro"I' n Yes (95%C.L)
All Ranch Hand 870 9 (1.0) 0.72 (0.32,1.60) Comparison 1,251 18 (1.4)
Officer Ranch Hand 341 I (0.3) 0.36 (0.04,3.24) Comparison 494 4 (0.8)
Enlisted Flyer Ranch Hand 151 I (0.7) 0.62 (0.06,6.87) Comparison 187 2 (1.1)
Enlisted Ranch Hand 378 7 (1.9) 0.88 (0.34,2.25) Groundcrew Comparison 570 12 (2.1)
(b) MODELl: RANCH HANDS VS. COMPAR1S()NS -:ADJUSTED
Occupational Category
All
Officer Enlisted Flyer Enlisted Groundcrew
A<\justed~e1ativ.Rlsk (95%C.L)
0.63 (0.27,1.47)
0.36 (0.04,3.27) 0.61 (0.05,6.87) 0.73 (0.27,1.98)
13-115
0.274
0.367 0.690 0.532
p-Value
0.408
0.362
0.694
0.785
-- -------------------~.--.---------.--.--------"---.-----_.--,._.-------_ .. ,,-_._--"-----_._""-------------"
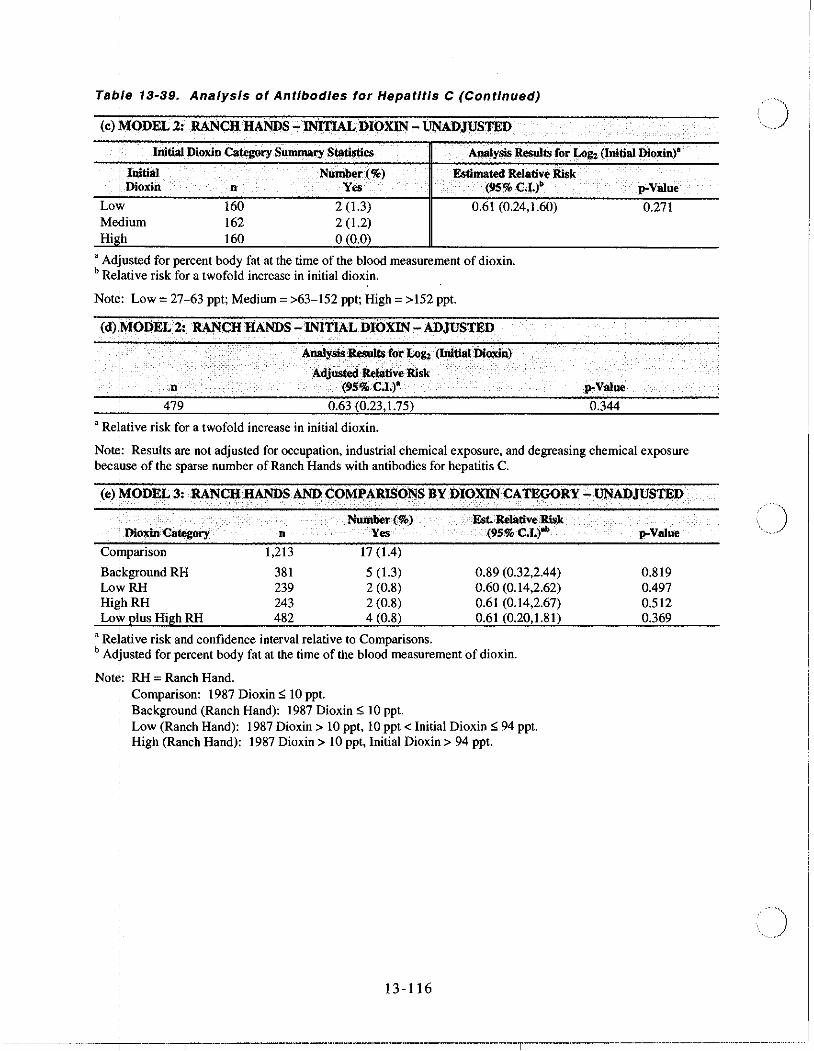
Tab:/e 13-39. Analysis of Antibodies for Hepatitis C (Continued)
(c) MODEL2:RANCliH,\NDS ..,.INlTIALDIOXIl\l - UJIIADJ\1STED
ImtialDioxin Ca~ory Summary Stati~.,. "'laly';s Results for J,.ogz (Initial Dioxin)'
: Initial . Numb~r(%) i Dioxin n Yes
Lo',f' 160 2 (1.3) Me\lium 162 2 (1.2) High 160 0 (0.0)
EstImated Relative Risk (95% C.I.)"
0.61 (0.24,1.60)
• Adjusted for percent body fat at the time of the blood measurement of dioxin. b Relative risk for a twofold increase in initial dioxin.
Note: Low = 27-63 ppt; Medium = >63-152 ppt; High = > 152 ppt.
(d*ODEL 2: RANCH H,\NDS - INITIAL DIOXIN - ADJUSTED
479
Al!alysi •. ~tsfot Logz (Initial DiQxin)
AdjUsted Relative Risk (95'%. C.I.)'
0.63 (0.23,1.75)
a Relative risk for a twofold increase in initial dioxin.
p-Value
0.271
p-VaJue
0.344
Not~: Results are not adjusted for occupation, industrial chemical exposure, and degreasing chemical exposure because of the sparse number of Ranch Hands with antibodies for hepatitis C.
(e) MODEL 3:RANCHHANl>S AND COMPARISONS BY DIOXIN CATEGORY -UJIIAl>JUSTED
. Nulllber( %) ! Dioxin Category n Yeo
Co&;parison 1,213 17 (1.4)
Background RH 381 5 (1.3) Low RH 239 2 (0.8) Hillh RH 243 2 (0.8) Lot plus High RH 482 4 (0.8)
Est RelativeBisk {95%C.L)'"
0.89 (0.32,2.44) 0.60 (0.14,2.62) 0.61 (0.14,2.67) 0.61 (0.20,1.81)
a Re~ative risk and confidence interval relative to Comparisons. b Adjusted for percent body fat at the time of the blood measurement of dioxin.
Notd: RH = Ranch Hand. Comparison: 1987 Dioxin ~ 10 ppt. Background (Ranch Hand): 1987 Dioxin ~ 10 ppt. Low (Ranch Hand): 1987 Dioxin> 10 ppt, 10 ppt < Initial Dioxin ~ 94 ppt. High (Ranch Hand): 1987 Dioxin> 10 ppt, Initial Dioxin> 94 ppt.
13-116
p-Value
0.819 0.497 0.512 0.369
\J
-----------.--------r-.---.---r---.-----~.----'.---.-.--".------------------T'---·------·---·---···-------------~.-.. -.. ----..... -.. -... '.
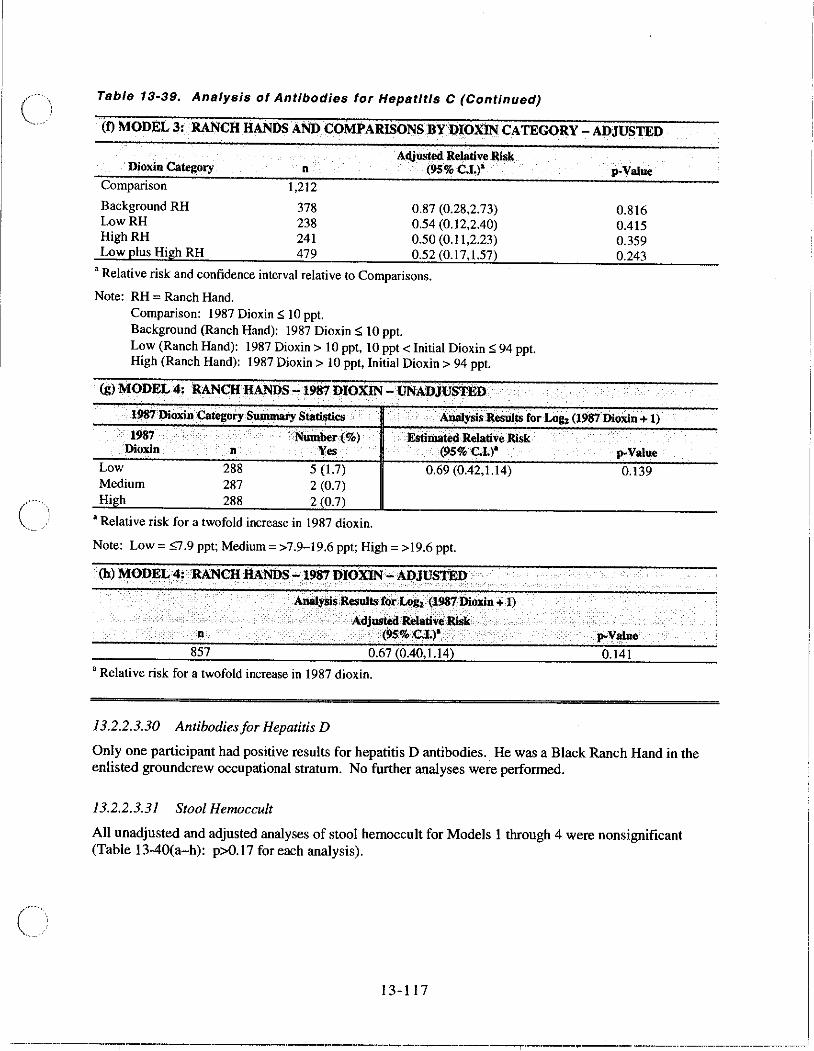
(i
c
Table 13-39. Analysis of Antibodies for Hepatitis C (Continued)
(f) MODEL 3: RANCH HANDS AJIID COMPARISOl'ilS BVDlOXll'! CATEGORY - ADJUSTED
Adjusted Relative Risk Dioxin Ca~ory n (95%C.L)'
Comparison 1,212
Background RH 378 0.87 (0.28,2.73) LowRH 238 0.54 (0.12,2.40) HighRH 241 0.50 (0.11 ,2.23) Low plus High RH 479 0.52 (0.17,1.57)
a Relative risk and confidence interval relative to Comparisons.
Note: RH = Ranch Hand. Comparison: 1987 Dioxin" 10 ppt. Background (Ranch Hand): 1987 Dioxin" 10 ppt. Low (Ranch Hand): 1987 Dioxin> 10 ppt, 10 ppt < Initial Dioxin" 94 ppt. High (Ranch Hand): 1987 Dioxin> 10 ppt, Initial Dioxin> 94 ppt.
(g) MODEL 4; RANCH HANDs -1987 DIOXIN - uNADJUSTED . ' ". ' '. " , ,
p-Value
0.816 0.415 0.359 0.243
1!187 Dioxin CategorySn_ry Stati~cs ,. .·AQaJysis.Resulls Cor Loll: (1987,Dloxin + 1)
... 1987 Nlimber(%) .Estimated·ReJativeRlsk· '. , ,Dioxin n Yes (95% "C.I.)· p-Value
Low 288 5 (1.7) 0.69 (0.42,1.14) 0.139 Medium 287 2 (0.7) High 288 2 (0.7)
• Relative risk for a twofold increase in 1987 dioxin.
Note: Low = ,,7.9 ppt; Medium = >7.9-19.6 ppt; High = >19.6 ppt.
(b)l\10DEI.,~.: ,RANCH HANDS .... .1987 DIOXIN - ADJySTlll)
n
857
Analysis.Resuilsfor.lA!I:. ,(l!187:Dioxin -1'.1)
.' Adjusted:ReIative'iRlsko: ." (95% ,CI.)'·
0.67 (0.40,1.14)
• Relative risk for a twofold increase in 1987 dioxin.
13.2.2.3.30 Antibodies/or Hepatitis D
0.141
Only one participant had positive results for hepatitis D antibodies. He was a Black Ranch Hand in the enlisted groundcrew occupational stratum. No further analyses were performed.
13.2.2.3.31 Stool Hemoccult
All unadjusted and adjusted analyses of stool hemoccult for Models 1 through 4 were nonsignificant (Table 13-40(a-h): p>O.17 for each analysis).
13-117
_____________ . __ . ....--,-__ . __________ . _________ ' __ ._._w ____ .-----r-.-.--------"--".-~"--------.---.-.... ----.-----.-

Ta~le 13-40. Analysis of Stool Hemoccult
(a)IMODEL 1; RkNCHHANDS VS. COMPARISONS - UNADJUSTED ,
Of!cupational Number(%) :Category Group n Yes
All Ranch Hand 834 29 (3.5) Comparison 1,196 53 (4.4)
Ofilicer Ranch Hand 332 14 (4.2) Comparison 483 22 (4.6)
Enlisted Flyer Ranch Hand 147 2 (1.4) Comparison 178 7 (3.9)
Enlisted Ranch Hand 355 13 (3.7) Gr6undcrew Comparison 535 24 (4.5)
i . ". .'
(b)IMODEL.l: RANCH HANDS VS. COMPARlSONS-ADJUS1'Jl:D
I Oecupatlonal Ca~ory All
Officer Enlisted Flyer Enlisted Groundcrew
Adjusted lMati .. Risk (,)S%CJ.)
0.78 (0.49,1.25)
0.90 (0.45,1.80) 0.34 (0.07,1.70) 0.82 (0.41,1.64)
Est. Relati .. Risk (,)S%Cl.)
0.78 (0.49,1.23)
0.92 (0.46,1.83)
0.34 (0.07,1.65)
0.81 (0.41,1.61)
(c),MODEL 2: . RANCH HANDS '-INITlALDIOXIN- UNAD.JUSTED
p.Value
0.301
0.774 0.191 0.574
p.Value
0.279
0.818
0.179
0.547
jInitial N~I'(%) Eslijj.ated R.rAtiveRisl< .. ' .' . '.' '.' '., I Dioxin . n· Yes .. . (95%CJ.)· . . p.VIII~e
L0o/ 156 4 (2.6) 0.85 (0.59,1.24) 0.390 Me(lium 156 II (7.1) High 152 4 (2.6)
, Adjusted for percent body fat at the time of the blood measurement of dioxin. b Relative risk for a twofold increase in initial dioxin.
Not~: Low = 27-63 ppt; Medium = >63-152 ppt; High = >152 ppt.
(d) !MQDELl: RkNCHH,ANDS..., INIT1A.LDlOXIN- AQJUSTED. :
n
461
.' AnalysisResuJtSforLogz (Initial Dioxin) '.
Adjus\edReiativeRisk (!lSl)I, C,I.)'
0.97 (0.62,1.51)
, Relative risk for a twofold increase in initial dioxin.
13-118
p.Value
0.880
\) , '.-
······----·-·-.. ·---·--T-·-----T--------.. ---.. ---·---.. --------------------.-.-.--... ---.. ---.-.. -.-------....

() Table 13-40. Analysis of Stool Hemoccuit (Continued)
(e) MODEL 3: RANCHa-ANDS AND. COMPARISONS B1:' DlOXINCA TEGORY - UNADJUSTED
Number (%) El.i.. R.el.tive Risk Dioxin Category n Yes (95% C.L)'·
Comparison 1,162 50 (4.3)
Background RH 365 10 (2.7) 0.68 (0.34,1.35) LowRH 232 11 (4.7) 1.08 (0.55,2.12) High RH 232 8 (3.4) 0.74 (0.35,1.59) Low plus High RH 464 19(4.1) 0.90 (0.52,1.55)
• Relative risk and confidence interval relative to Comparisons. b Adjusted for percent body fat at the time of the blood measurement of dioxin.
Note: RH = Ranch Hand. Comparison: 1987 Dioxin :5 10 ppt. Background (Ranch Hand): 1987 Dioxin :5 10 ppt. Low (Ranch Hand): 1987 Dioxin> 10 ppt, 10 ppt < Initial Dioxin :5 94 ppt. High (Ranch Hand): 1987 Dioxin> 10 ppt, Initial Dioxin> 94 ppt.
p-Value
0.270 0.814 0.443 0.696
(I) MODEL.3: RANCH HANDS AND COMPARISONS BY DIOXIN CATEGORY - ADJUSTED
Dioxin Catl!gory
Comparison
Background RH LowRH HighRH Low plus High RH
n
1,161
363 231 230 461
Adjusted 'Relative Risk (95%C.I.)'
0.63 (0.31,1.28) 1.08 (0.55,2.13) 0.86 (0.39,1.90) 0.96 (0.55,1.68)
• Relative risk and confidence interval relative to Comparisons.
Note: RH = Ranch Hand. Comparison: 1987 Dioxin:5 10 ppt. Background (Ranch Hand): 1987 Dioxin :5 10 ppt. Low (Ranch Hand): 1987 Dioxin> 10 ppt, 10 ppt < Initial Dioxin :5 94 ppt. High (Ranch Hand): 1987 Dioxin> 10 ppt, Initial Dioxin> 94 ppt.
p-Value
0.201 0.822 0.705 0.895
(g) MODEL 4: RANCHa-ANDS,-l!187 DIOXIN-UNADJUSTED ',,' '.'
19117 Dioxin O\legorySufumary StatiStics., ' ,', '. AnalY!lis~es"Its for Log, (1987 DiOl<in + 1)
1987 .. . Number(%} li:stima"", Relative rusk Dioxinn .' . Yes .' <(95% (;+)' . p-Value
Low 275 8 (2.9) 1.04 (0.81,1.34) 0.760 Medium 280 9 (3.2) High 274 12 (4.4)
• Relative risk for a twofold increase in 1987 dioxin.
Note: Low = :57.9 ppt; Medium = >7.9-19.6 ppt; High = >19.6 ppt.
13-119
,
.
-_ ..... _,,-' _._--. ..,-------------_.---------_ .. -._--------,-_.-----_ ... - -...... _._" .. _--- --- .-""
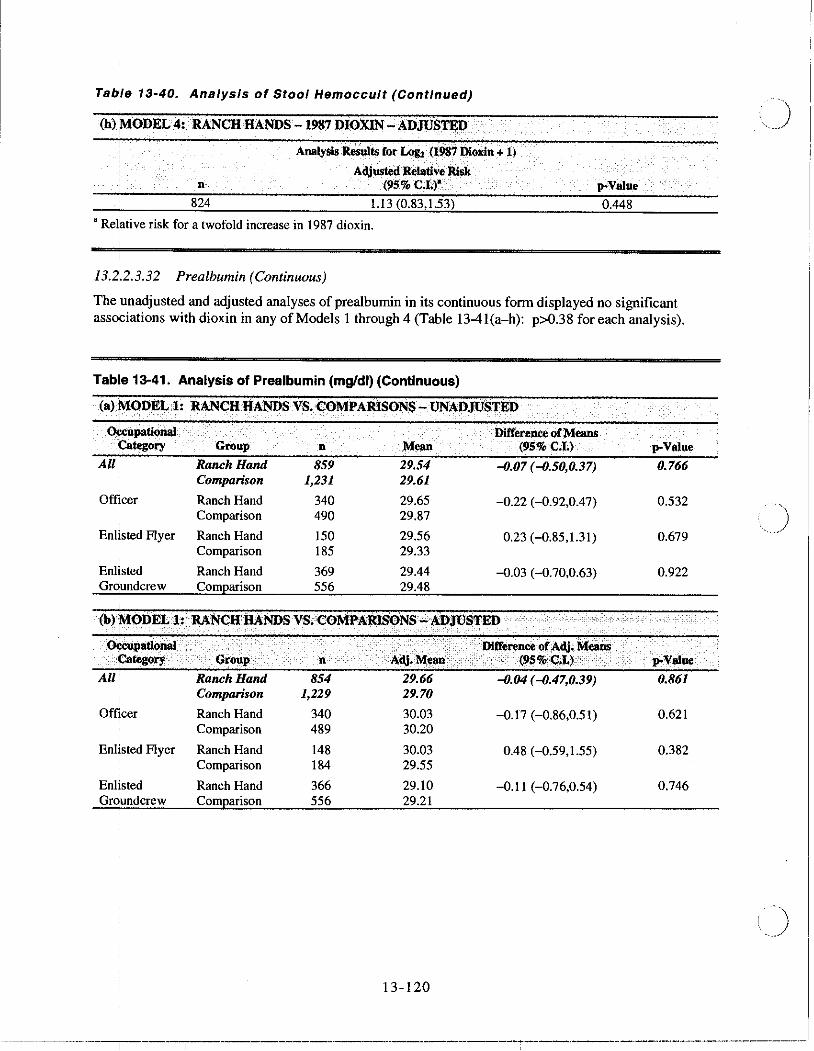
Tab'le 13·40. Analysis of Stool Hemoccu/t (Continued)
(h) )\10DEL 4:. RANCH HANDS - 1987 DIOXIN' - ADJUS:rED I ' , ,
n
824
AnalySis ReSulfs for Log, (1987 Dioxin ... 1.)
Adjusted Relative Risk (!IS% C.I;)·
1.13 (0.83,1.53)
• Relative risk for a twofold increase in 1987 dioxin.
13.2:2.3.32 Prealbumin (Continuous)
!>'Value 0.448
The ,unadjusted and adjusted analyses of prealbumin in its continuous form displayed no significant assopiations with dioxin in any of Models I through 4 (Table I3-4I(a-h): p>O.38 for each analysis).
Table 13-41. Analysis of Prealbumin (mg/dl) (Continuous)
(a)l\iODEL 1: RANCH HANDS VS.COMPARISONS- UNAD.JlJSTED i , '
~patiOnal DIfference of Means , tegory Group n MOjIIl (95'1OC.I.) , !>'Vaille I
All Ranch Hand 859 29.54 -0.07 (-0.50,0.37) 0.766 Comparison 1,231 29.61
Officer Ranch Hand 340 29.65 -0.22 (-0.92,0.47) 0.532 Comparison 490 29.87
Enlisted Flyer Ranch Hand 150 29.56 0.23 (-0.85,1.31) 0.679 Comparison 185 29.33
Enlisted Ranch Hand 369 29.44 -0.03 (-0.70,0.63) 0.922 Gro:Undcrew ComQarison 556 29.48
(b)j\iOI>EL1: RANCH HANDS VS;COMP:A:RIS~NS",:A:1:)JUSTED ' ,'" '<" c-"
I ',' "', ,'" """ "", '
" "Difference of .Adj; Mea~ <>taUPational ' •• tegory GrOllI" II Adj.~\lan (95%C;L) -. '!>'Value
All' Ranch Hand 854 29.66 -0.04 (-0.47,0.39) 0.861 Comparison 1,229 29.70
Officer Ranch Hand 340 30.03 -0.17 (-0.86,0.51) 0.621 Comparison 489 30.20
Enlisted Flyer Ranch Hand 148 30.03 0.48 (-0.59,1.55) 0.382 Comparison 184 29.55
Enlisted Ranch Hand 366 29.10 -0.11 (-0.76,0.54) 0.746 Gro1undcrew ComQarison 556 29.21
13·120
, , )
--------'---------r-'-----T----·-----·---'----'-·--""-------------;----'---------'----,.--"----'--------------------'-
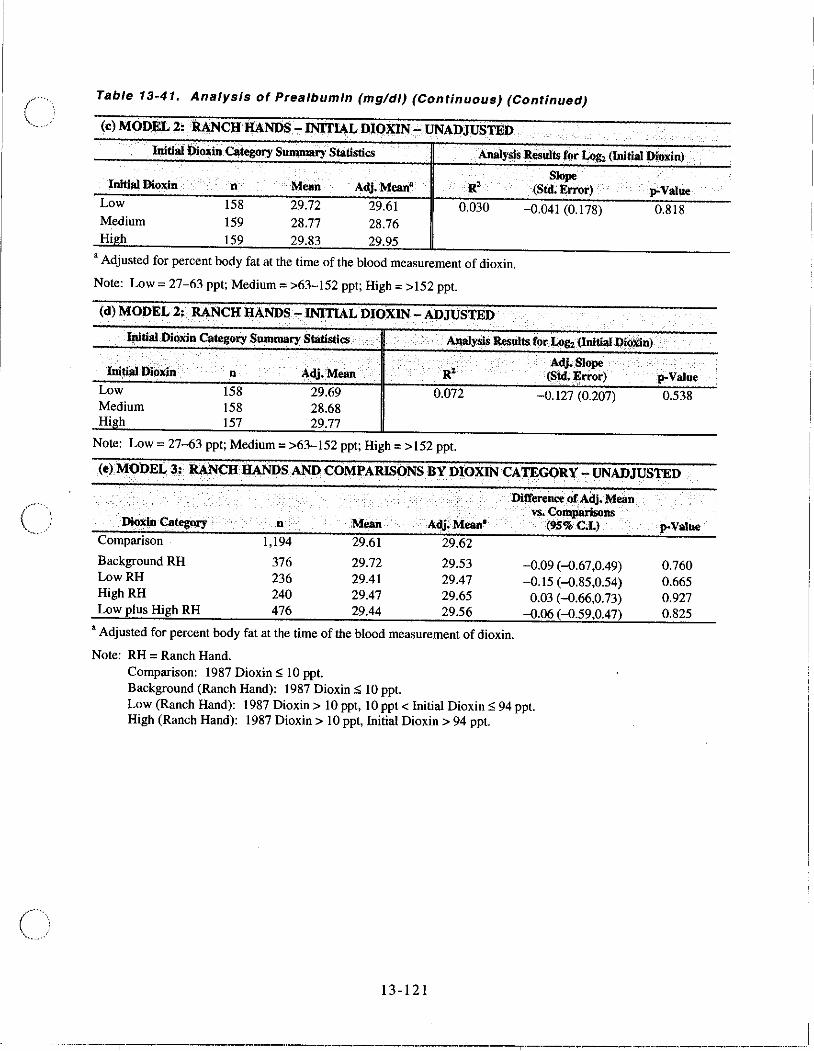
C. .... ~ .. )
Table 13-41. Analysis of Prealbumln (mg/dl) (Continuous) (Continued)
(c) MODEL 2: RANCH HANDS - INITIAL DIOXIN - UNADJUSTED .. .. .
Initiall>io~inC~tegory Summary Statistics Analys/sRcilults for 1A!.1l> (Initial Dioxin) ..
Initial Dioxin n Mean Adj. Mean' R' Low 158 29.72 29.61 0.030 Medium 159 28.77 28.76 High 159 29.83 29.95
, Adjusted for percent body fat at the time of the blood measurement of dioxin.
Note: Low = 27-63 ppt; Medium = >63-152 ppt; High = > 152 ppt.
(d) MODEL 2: RANCH HANDS -lNlTIAL DIOXIN _. ADJUSTED
Slope (Std. Error) p-Value
-0.041 (0.178) 0.818
I!Utial Dioxin Category Summary Statistics ....• .. Al\alySis Results for Log, (Initial I11@n) . . . ...
•
I!UtiIllDio"in n Adj. Mean . R' Low 158 29.69 0.072 Medium 158 28.68 High 157 29.77
Note: Low = 27-63 ppt; Medium = >63-152 ppt; High = >152 ppt.
Adj.Siope (Std .• :W;;rror)
-0.127 (0.207)
p-Value 0.538
(e) MODEL 3: RANCH HANDS AND COMPARISONS BY DIOXIN CATEGORY - UNADJUSTED
DillOrenceOf Adj. Mean
Dioxin Category n Mean Adj. Mean'
Comparison 1,194 29.61 29.62
Background RH 376 29.72 29.53 LowRH 236 29.41 29.47 HighRH 240 29.47 29.65 Low plus High RH 476 29.44 29.56
, Adjusted for percent body fat at the time of the blood measurement of dioxin.
Note: RH = Ranch Hand. Comparison: 1987 Dioxin S; 10 ppt. Background (Ranch Hand): 1987 Dioxin S; 10 ppt.
vs. ComParisons (95'10 C.l.)
-0.09 (-0.67,0.49) -0.15 (-0.85,0.54)
0.03 (-0.66,0.73) -0.06 (-0.59,0.47)
Low (Ranch Hand): 1987 Dioxin> 10 ppt, 10 ppt < Initial Dioxin S; 94 ppt. High (Ranch Hand): 1987 Dioxin> 10 ppt, Initial Dioxin> 94 ppt.
13-121
p-Value
0.760 0.665 0.927 0.825
_________ ~ _____ . __ .:__,_-------------.-----'------.-.----'--r'----------.. --".--".------.---.-... ---.----- 'I
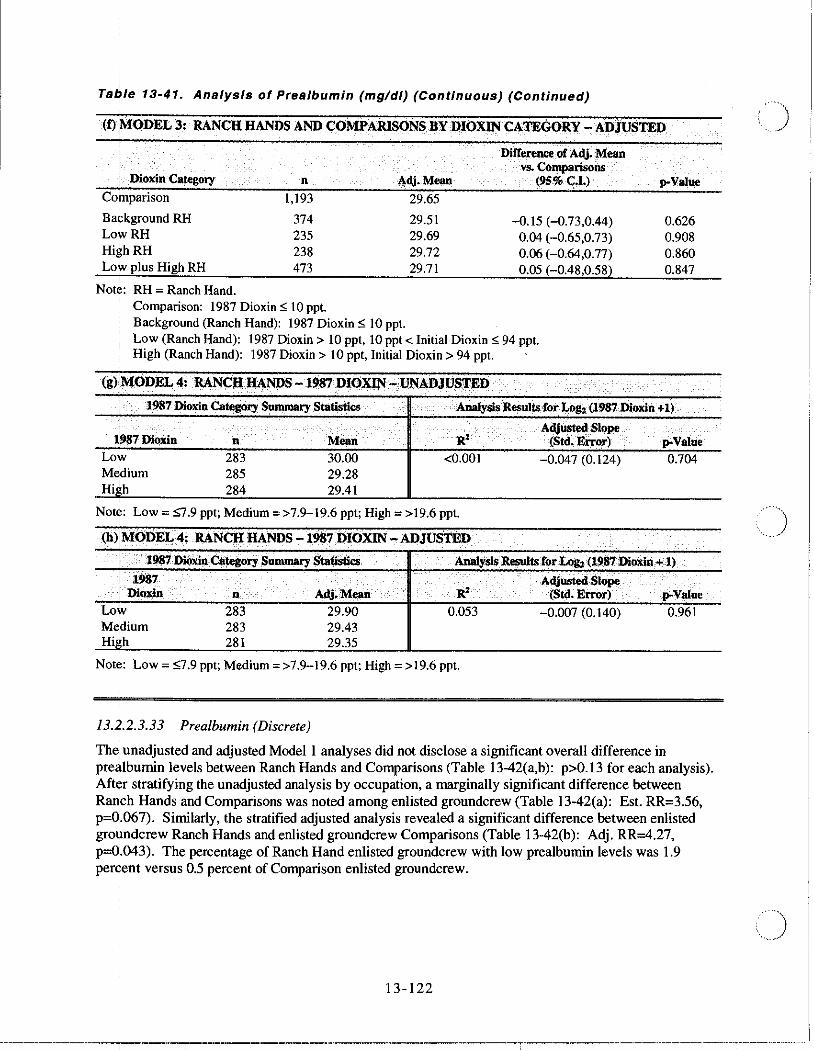
Ta/j/e 13-41. Analysis of Prealbumin (mg/dl) (Continuous) (Continued)
(f) f'i'ODEL 3.: RANCl{ HANDS AND COMPARISONS BY DIOXIN CATEGORY.., ADJUSTED
Dirterenoe of Adj. Mean vs. Comparisons
, Dioxin Category n Adj. Mean (95% C.I.) p-Value I •
Comparison 1,193 29.65
Ba9kground RH 374 29.51 -0.15 (-0.73,0.44) 0.626 LowRH 235 29.69 0.04 (-0.65,0.73) 0.908 HighRH 238 29.72 0.06 (-0.64,0.77) 0.860 Low plus High RH 473 29.71 0.05 (-0.48,0.58) 0.847
,
Note: RH = Ranch Hand. Comparison: 1987 Dioxin';; 10 ppt. Background (Ranch Hand): 1987 Dioxin';; 10 ppt.
I Low (Ranch Hand): 1987 Dioxin> 10 ppt, 10 ppt < Initial Dioxin';; 94 ppt. High (Ranch Hand): 1987 Dioxin> 10 ppt, Initial Dioxin> 94 ppt.
I
(g)'MODEL 4:RANCH~NDS -1987 DIOXIN-:UNADJlJSTED . . ;. '.
1987 Dioxin Category Summary Statistics .. " ,AnaIy$s R~ultS'for Log; (1987 Dioxin +1) .' . .
! 19$7 Dioxin
Low
~erium High
n 283 285 284
Mean 30.00 29.28 29.41
<0.001
Not¢: Low = 9.9 ppt; Medium = >7.9-19.6 ppt; High = >19.6 ppt.
(h)IMOJ}EL4: RANCH HANDS -1987 DIOXIN - ADJtJSTED
. Adjusted Slope
(Std. Error)
-0.047 (0.124)
p-Value
0.704
i·'; .·l987DlOXin Clttegory Summary Sta(IStics ". AnalySis Results for Log; (l987Dioxin+,1)
! 1987 Adjusted Slope r Dioxin n '. Adj. MeaD . .' .. R' (Std. Error) p-Value
LoW 283 29.90 0.053 -0.007 (0.140) 0.961 Me~ium 283 29.43 High 281 29.35
Note: Low = ';;7.9 ppt; Medium = >7.9-19.6 ppt; High = >19.6 ppt.
13.2.2.3.33 Prealbumin (Discrete)
The. unadjusted and adjusted Modell analyses did not disclose a significant overall difference in pre!\lbumin levels between Ranch Hands and Comparisons (Table 13-42(a,b): p>O.13 for each analysis). After stratifying the unadjusted analysis by occnpation, a marginally significant difference between Ranch Hands and Comparisons was noted among enlisted groundcrew (Table 13-42(a): Est. RR=3.56, p=O.067). Similarly, the stratified adjusted analysis revealed a significant difference between enlisted grOl/ndcrew Ranch Hands and enlisted groundcrew Comparisons (Table 13-42(b): Adj. RR=4.27, p=(X043). The percentage of Ranch Hand enlisted groundcrew with low preaIbumin levels was 1.9 percent versus 0.5 percent of Comparison enlisted groundcrew.
13-122
•.. ) ., .. "
-----------------,--·---.. -T--· .. ·--·---·----···---·-·--.. ----.--.-.---,.-------.. -.-.--.... --.------.--.---- ... -.-.... --
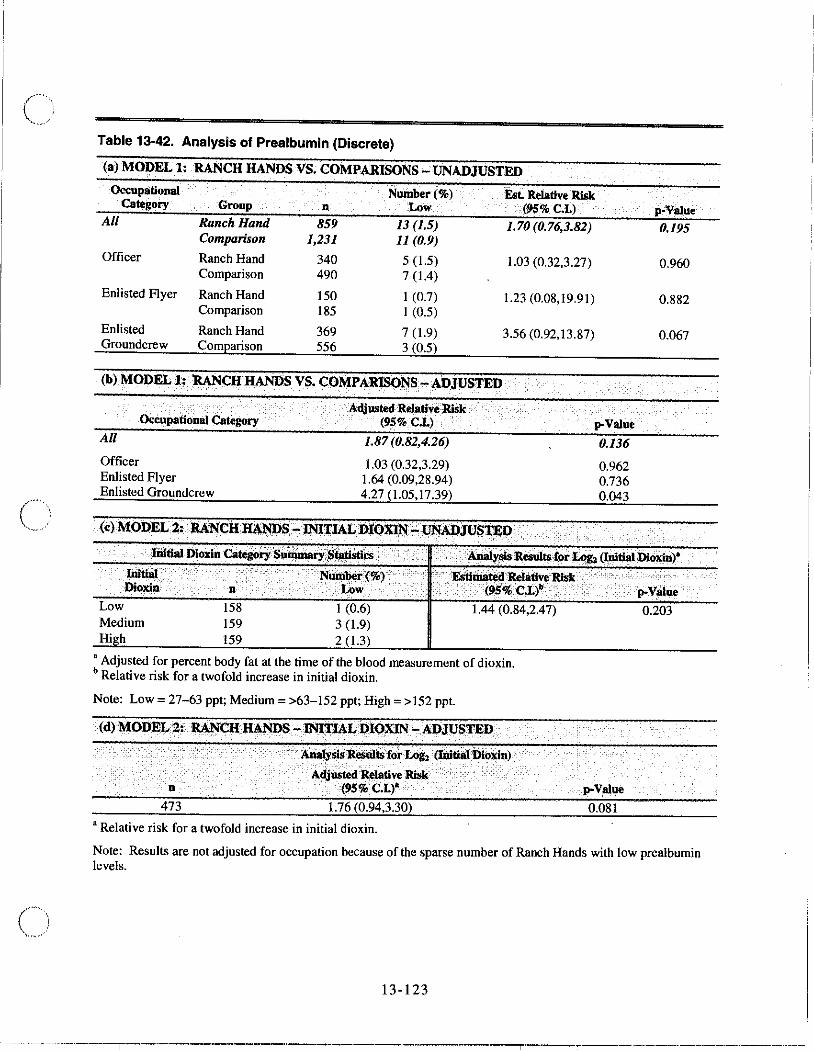
c
Table 13-42. Analysis of Prealbumin (Discrete)
(a) MODEL 1: RANCH HANDS VS. COMPARISONS - UNADJUSTED
Occupati?nal Number(%) Category Group n Low
All Ranch Hand 859 13 (1.5) Comparison 1,231 11 (0.9)
Officer Ranch Hand 340 5 (1.5) Comparison 490 7 (1.4)
Enlisted Flyer Ranch Hand 150 1 (0.7) Comparison 185 I (0.5)
Enlisted Ranch Hand 369 7 (1.9) Groundcrew Comparison 556 3 (0.5)
(b) MODEL h 'RANCliHANDS VS. COMPARlSONS - ADlUSTED
Occupational Category
All
Officer Enlisted Flyer Enlisted Groundcrew
A1\iusledReiativeRisk (9S%C.I.) .
1.87 (0.82,4.26)
1.03 (0.32,3.29) 1.64 (0.09,28.94) 4.27 (1.05,17.39)
llst.. Relative Risk (95% C.I.)
1. 70 (0.76,3.82)
1.03 (0.32,3.27)
1.23 (0.08,19.91)
3.56 (0.92,13.87)
p-Yalue
0.136
0.962 0.736 0.043
p-Yalue 0.195
0.960
0.882
0.067
Jliltial Dioxin Category~ry.~jistll'S .. ·.~.Rl'Sul~ (or~ (Initial DioXin)'
IulIili1 . ·NWnbeJo.(%) . Dioxin:' n . row .
Low 158 I (0.6) 1.44 (0.84,2.47) Medium 159 3 (1.9)
.lIigh 159 2 (1.3)
, Adjusted for percent body fat at the time of the blood measurement of dioxin. b Relative risk for a twofold increase in initial dioxin.
Note: Low = 27-63 ppt; Medium = >63-152 ppt; High = > 152 ppt.
(d) MODEL '2: RANCHHANDS-JNn,'IAL~IOXIN-ADJUSTED .
473
...• lUIalYsiSRellultSfor Log, (Iwti8t'DlOlin)'"
A<lj,;.ttit ReI~tiveRi.k . (9S%C.I.)'
1.76 (0.94,3.30)
a Relative risk for a twofold increase in initial dioxin.
0.203
p-YaIue
0.081
Note: Results are not adjusted for occupation because of the sparse number of Ranch Hands with low prealbumin levels.
13-123