Embed Size (px)
Citation preview
Notes in italics are repeated to help random browsers—
systematic readers should ignore them
1. The timing of the initial and final surveys differed by
population. These surveys were usually eight to ten years
apart but the interval could be as little as six years. The
calendar years and months varied. See G10 and
MONICA Quality assessment of age, date of examina-
tion and survey periods (1).
2. Results are shown as the mean systolic blood pressure
in millimetres of mercury, mmHg, for the 35–64 age
group. The results are age-standardized to minimize any
effect of differing age structures on the apparent findings.
See #38 Population Prevalence and Trends, #39 Age
Standardization.
3. The graphs characterize men and women over a thirty-
year age band in each survey for each population with
a single value, but levels and trends vary with age. Age-
specific data are published in the MONICA Data
Book of population surveys, table 6.1.2 (1), and early
results in MONICA Publication 11 (2).
4. Survey results could be influenced by failure to partici-
pate by some of those selected for the survey. The issue is
complex. Different methods of recruitment and sampling
were used in different populations. There is more than
one definition of response rates. See#28 Sampling, #29
Recruitment and Response Rates, MONICA Quality
assessment of participation rates, sampling frames and
fractions (1).
5. To convert to and from SI Units: 100 mmHg = 13.3
kilopascal (kPa); 10 kPa = 75 mmHg.
6. In a reading such as 156/82, the systolic blood pressure
is the first, higher reading—156, and the second lower
one—82, is the diastolic blood pressure. It was formerly
believed that the diastolic blood pressure was of greater
medical significance, and it was the target of medical
intervention. Measurement of the systolic blood pres-
sure is easier to standardize; it is now considered to be
of equal or greater significance than diastolic blood
pressure as a risk factor predicting cardiovascular
disease; and it is increasingly the target of treatment.
See #32 Blood pressure.
7. In the MONICA population surveys blood pressure
was measured twice with the subject at rest, and the
average of the two readings was used. See MONICA
Manual Part III, Section 1 (1), MONICA Quality
assessment of data on blood pressure (1).
8. Real differences in average blood pressure in popula-
tions over time and space are important to epidemiol-
ogists, but they could be spuriously created by bad
measurement techniques. Readings are ephemeral and
cannot be stored for re-measurement like blood spec-
imens. Some centres used simple mercury sphygmo-
manometers and others more complex ‘random-zero’
mercury sphygmomanometers, designed to reduce
observer bias. Extensive training, quality control and
monitoring of performance were done to encourage
standardized recording. See #32 Blood Pressure,
MONICA Quality assessment of data on blood pres-
sure (1). MONICA Publications 11, 14, 20, 31 (2).
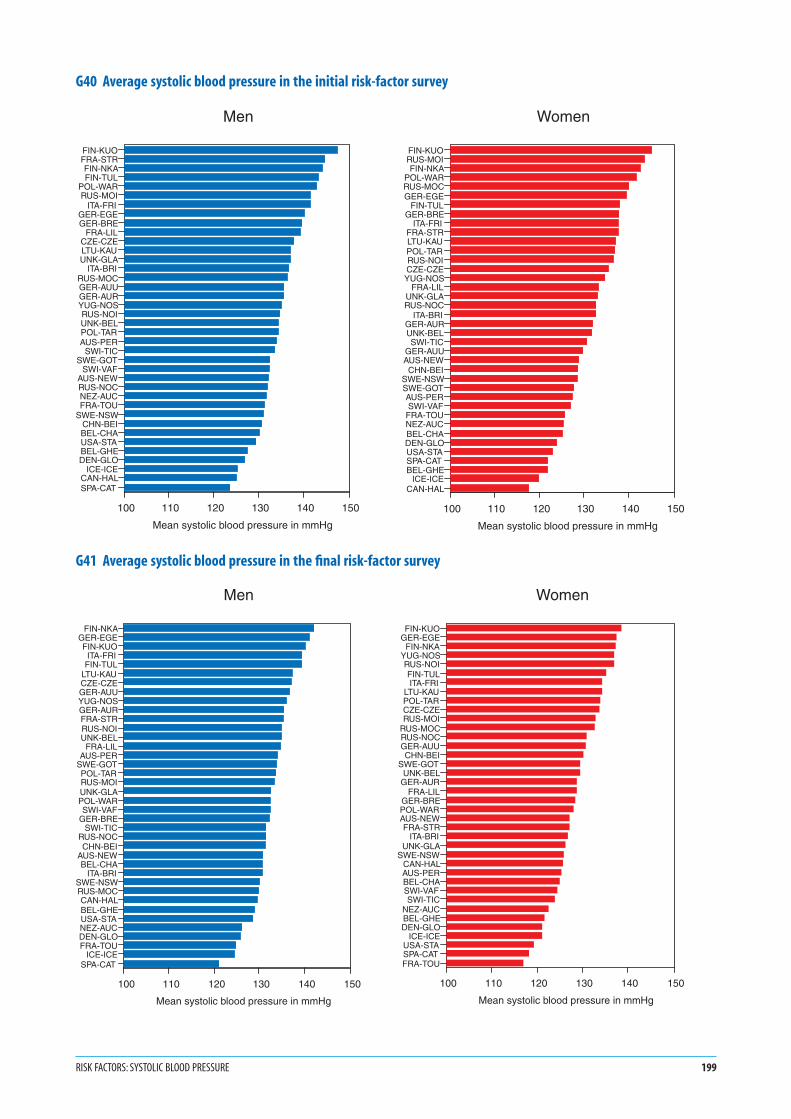
9. The scale for men and women is the same, as is the
range across populations of average systolic blood pres-
sure. The latter varied by about 25 mmHg in the initial
survey, and rather less in the final survey, where pres-
sures appear more uniform. Rankings appear similar in
the two sexes.
10. These graphs are based on the MONICA Data Book of
population surveys, table 6.1.2 (1). The Data Book con-
tains information on many more blood pressure items,
such as diastolic blood pressure, blood pressure cate-
gories, and identification and treatment of hyperten-
sion in different populations. See MONICA Quality
assessment of data on hypertension control (1), MONICA
Data Book of population surveys, tables 6.1.2–6.1.6 (1).
11. The Data book also contains age-specific data (as did
MONICA Publication 11) (2). These show that in
many populations the blood pressure in women aged
35–44 is lower than that in men of the same age, but at
55–64 it is higher. The age-standardized readings
shown here conceal this difference in age-gradients.
1. See Monograph CD-ROM or MONICA Websitehttp://www.ktl.fi/monica/.
2. Full references and summaries of MONICA Publicationsappear in #85/86.
198 MONICA MONOGRAPH AND MULTIMEDIA SOURCEBOOK
Risk factors: systolic blood pressure
G40 Average systolic blood pressure in the initial risk-factor survey
G41 Average systolic blood pressure in the final risk-factor survey
RISK FACTORS: SYSTOLIC BLOOD PRESSURE 199
FIN-KUOFRA-STRFIN-NKAFIN-TUL
POL-WARRUS-MOI
ITA-FRIGER-EGEGER-BRE
FRA-LILCZE-CZELTU-KAUUNK-GLA
ITA-BRIRUS-MOCGER-AUUGER-AURYUG-NOSRUS-NOIUNK-BELPOL-TARAUS-PER
SWI-TICSWE-GOT
SWI-VAFAUS-NEWRUS-NOCNEZ-AUCFRA-TOU
SWE-NSWCHN-BEIBEL-CHAUSA-STABEL-GHEDEN-GLO
ICE-ICECAN-HALSPA-CAT
100 110 120 130 140 150
Mean systolic blood pressure in mmHg
Men
FIN-KUORUS-MOIFIN-NKA
POL-WARRUS-MOCGER-EGE
FIN-TULGER-BRE
ITA-FRIFRA-STRLTU-KAUPOL-TARRUS-NOICZE-CZEYUG-NOS
FRA-LILUNK-GLARUS-NOC
ITA-BRIGER-AURUNK-BELSWI-TIC
GER-AUUAUS-NEWCHN-BEI
SWE-NSWSWE-GOTAUS-PERSWI-VAF
FRA-TOUNEZ-AUCBEL-CHADEN-GLOUSA-STASPA-CATBEL-GHE
ICE-ICECAN-HAL
100 110 120 130 140 150
Mean systolic blood pressure in mmHg
Women
FIN-NKAGER-EGEFIN-KUO
ITA-FRIFIN-TUL
LTU-KAUCZE-CZEGER-AUUYUG-NOSGER-AURFRA-STRRUS-NOIUNK-BEL
FRA-LILAUS-PER
SWE-GOTPOL-TARRUS-MOIUNK-GLAPOL-WARSWI-VAF
GER-BRESWI-TIC
RUS-NOCCHN-BEI
AUS-NEWBEL-CHA
ITA-BRISWE-NSWRUS-MOCCAN-HALBEL-GHEUSA-STANEZ-AUCDEN-GLOFRA-TOU
ICE-ICESPA-CAT
100 110 120 130 140 150
Mean systolic blood pressure in mmHg
Men
FIN-KUOGER-EGE
FIN-NKAYUG-NOSRUS-NOIFIN-TULITA-FRI
LTU-KAUPOL-TARCZE-CZERUS-MOI
RUS-MOCRUS-NOCGER-AUUCHN-BEI
SWE-GOTUNK-BEL
GER-AURFRA-LIL
GER-BREPOL-WARAUS-NEWFRA-STR
ITA-BRIUNK-GLA
SWE-NSWCAN-HALAUS-PERBEL-CHASWI-VAFSWI-TIC
NEZ-AUCBEL-GHEDEN-GLO
ICE-ICEUSA-STASPA-CATFRA-TOU
100 110 120 130 140 150
Mean systolic blood pressure in mmHg
Women

Notes in italics are repeated to help random browsers—
systematic readers should ignore them
G421. Calculation of trends is explained in #38 Population
Prevalence and Trends.
2. The initial and final surveys did not take place exactly
ten years apart, but this graph incorporates corrections to
standardize the differences, as if they were being meas-
ured across ten years.
3. Horizontal bars in G42 show the 95% confidence inter-
vals around the estimated 10-year trend. The smaller the
length of the bars the more precise the estimated trend. If
the bars fail to cross the zero line the estimated trend is
considered to deviate significantly from zero. Declining
trends are shown to the left of the zero line, increasing
trends to the right.
4. Confidence intervals are similar for men and women; the
population surveys sampled them in similar numbers.
5. To convert to and from SI Units: 100 mmHg = 13.3kilo-
Pascal (kPa); 10 kPa = 75 mmHg.
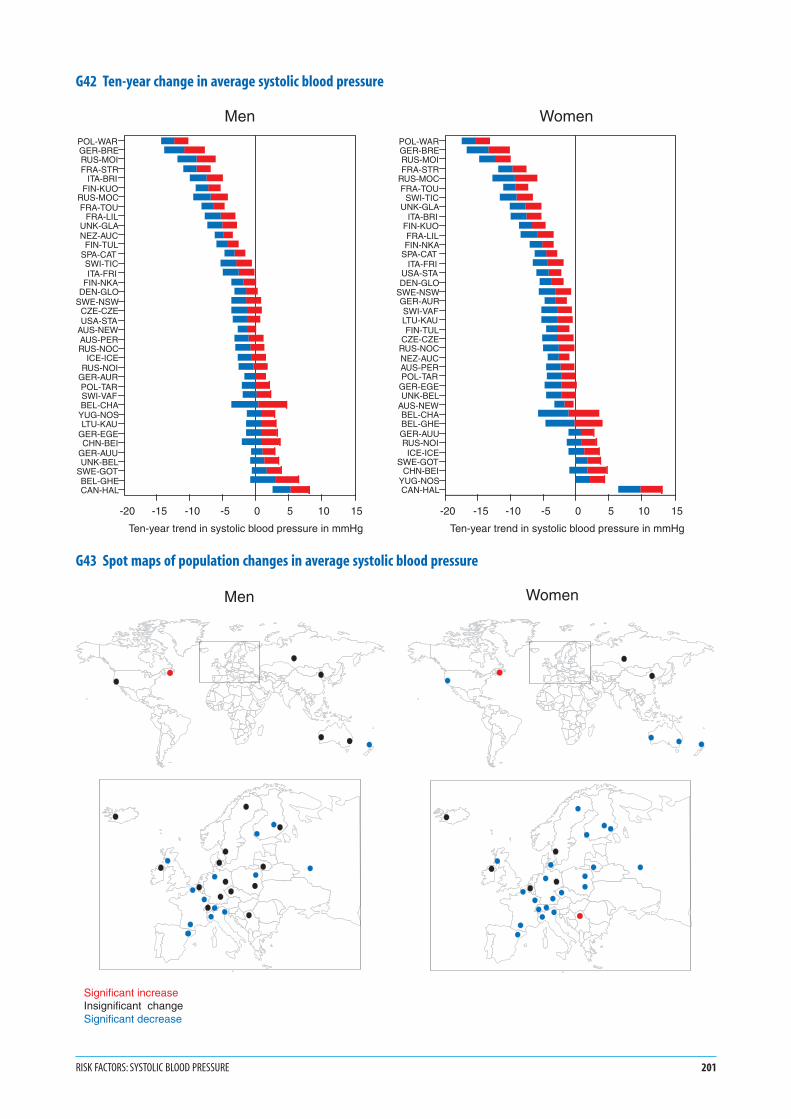
6. G42 shows similar trends in systolic blood pressure in
men and women in the various populations. The
majority of male populations show decreasing trends.
Two-thirds of the populations show a decreasing trend,
to the left of zero. The trend is increasing, to the right
of zero in 12. In women, more populations show a
decrease. Only seven have an estimated increasing
trend. Age-specific data are available in the MONICA
Data Book of population surveys (1).
G437. G43 is a spot map showing the geographical distribu-
tion of the results shown in G42. Many of the confi-
dence intervals in G42 include zero, particularly in
men. The populations concerned are marked with black
spots. Those with a significant decrease in systolic blood
pressure are shown with blue spots, while those with a sig-
nificant increase are marked with red spots.
8. Only one population, Canada-Halifax, CAN-HAL, see
#54, had a significant increase in mean systolic blood
pressure in both men and women. It had the second
lowest average systolic blood pressure in men in the
initial population survey, and the lowest average in
women. In the final survey CAN-HAL readings had
increased but still remained low.
9. It is unlikely that blood pressure data of poor quality
had a significant effect on overall MONICA results:
G56 (see later) shows that most population RUAs had
acceptable blood pressure quality scores and that these
did not appear to relate strongly to trends in blood
pressure. Ensuring continued high quality readings in
the field is difficult however, and it is not possible to
carry out external quality control or to archive mate-
rial. Automatic machines may, in the future, remove
some but not all, of the causes of variability and bias
in blood pressure measurement. In the mid-1980s to
mid-1990s they were not sufficiently tested and
standardized for reliability and comparability to be
recommended for the MONICA population surveys.
Investigators were expected to replicate the same
standard methods when repeating their population
surveys.
10. See the MONICA Data Book of population surveys,
tables 6.1.2–6.1.6 (1) for blood pressure items.
MONICA Publications 14, 20, 31 (2) are on data
quality and blood pressure levels, while MONICA Pub-
lication 11 (2) provided early cross-sectional data. For
further information, see #32 Blood Pressure, MONICA
Quality assessment of data on blood pressure (1),
MONICA Quality assessment of data on hypertension
control (1). Further publications will be listed on the
MONICA Website (1) as they appear.
1. See Monograph CD-ROM or MONICA Websitehttp://www.ktl.fi/monica/.
2. Full references and summaries of MONICA Publicationsappear in #85/86.
200 MONICA MONOGRAPH AND MULTIMEDIA SOURCEBOOK
G42 Ten-year change in average systolic blood pressure
G43 Spot maps of population changes in average systolic blood pressure
RISK FACTORS: SYSTOLIC BLOOD PRESSURE 201
POL-WARGER-BRERUS-MOIFRA-STR
ITA-BRIFIN-KUO
RUS-MOCFRA-TOU
FRA-LILUNK-GLANEZ-AUC
FIN-TULSPA-CATSWI-TICITA-FRI
FIN-NKADEN-GLO
SWE-NSWCZE-CZEUSA-STA
AUS-NEWAUS-PERRUS-NOC
ICE-ICERUS-NOI
GER-AURPOL-TARSWI-VAFBEL-CHA
YUG-NOSLTU-KAU
GER-EGECHN-BEI
GER-AUUUNK-BEL
SWE-GOTBEL-GHECAN-HAL
-20 -15 -10 -5 0 5 10 15
Ten-year trend in systolic blood pressure in mmHg
Men
POL-WARGER-BRERUS-MOIFRA-STR
RUS-MOCFRA-TOU
SWI-TICUNK-GLA
ITA-BRIFIN-KUOFRA-LILFIN-NKA
SPA-CATITA-FRI
USA-STADEN-GLO
SWE-NSWGER-AURSWI-VAFLTU-KAUFIN-TUL
CZE-CZERUS-NOCNEZ-AUCAUS-PERPOL-TAR
GER-EGEUNK-BEL
AUS-NEWBEL-CHABEL-GHEGER-AUURUS-NOI
ICE-ICESWE-GOT
CHN-BEIYUG-NOSCAN-HAL
-20 -15 -10 -5 0 5 10 15
Ten-year trend in systolic blood pressure in mmHg
Women
Men Women
Significant increaseInsignificant change Significant decrease
Notes in italics are repeated to help random browsers—
systematic readers should ignore them
1. The timing of the initial and final surveys differed by
population. These surveys were usually eight to ten years
apart but the interval could be as little as six years.
The calendar years and months varied. See G10 and
MONICA Quality assessment of age, date of examina-
tion and survey periods.
2. Results are shown as the estimated mean total choles-
terol in millimoles per litre (mmol/l) in the 35–64 age
group. The results are age-standardized to minimize any
effect of differing age structures on the apparent findings.
See #38 Population Prevalence and Trends, #39 Age
Standardization.
3. To convert to and from SI Units: 200 mg/dl =5.17 mmol/l; 10 mmol/l = 387 mg/dl.
4. The graphs characterize men and women over a thirty-
year age band in each survey for each population with
a single value, but levels and trends vary with age. Age-
specific data are published in the MONICA Data
Book of population surveys, table 6.2.2 (1), and early
results in MONICA Publication 11 (2).
5. Survey results could be influenced by failure to partici-
pate by some of those selected for the survey. The issue is
complex. Different methods of recruitment and sampling
were used in different populations. There is more than
one definition of response rates. See #28 Sampling, #29
Recruitment and Response rates, MONICA Quality
assessment of participation rates, sampling frames and
fractions (1).
6. Cholesterol is one of the classic coronary risk factors,
measured in blood as serum or plasma cholesterol. It
is otherwise known as total cholesterol because it
includes different fractions (such as low, intermediate
and high-density lipoprotein, HDL-cholesterol). It is
not influenced appreciably by time of day or fasting/
non-fasting status, so it can be measured without
special preparation.
7. Cholesterol was the only classical risk factor in
MONICA dependent on the laboratory. Ensuring and
maintaining comparability of different laboratories
across ten years and 21 countries was a complex
problem. Laboratory readings can drift. MONICA
established a quality control centre for lipid measure-
ment in Prague in the Czech Republic, which worked
with its equivalent in Atlanta in the USA. See #33 Cho-
lesterol, MONICA Manual Part III, Sections 1, 2 (1),
MONICA Quality assessment of data on cholesterol
(1), MONICA Quality assessment of data on awareness
and treatment of cholesterol (1), the MONICA Data
Book of population surveys, tables 6.2.1–6.2.7 (1), and
MONICA Publication 13 (2).
8. Participants in the MONICA surveys consented to
venepuncture. Blood was taken from an arm vein with
minimal or no use of a tourniquet. It was analysed
according to a written protocol as plasma or serum, for
total and HDL-cholesterol, some being deep-frozen
and stored for future reference. See #33 Cholesterol,
MONICA Manual Part III, Sections 1, 2 (1).
9. The scale for men and women is the same. Mean cho-
lesterol levels were similar in the two sexes. Compared
with historical population differences there was rela-
tively little variation between most populations, with
mean readings ranging between 5.5 and 6.3 mmols/l.
The population with the highest readings varied
between men and women and the initial and final
surveys. China-Beijing, CHN-BEI, see #55 had the
lowest mean total cholesterol in all four graphs by a
considerable margin.
10. The readings here are age-standardized so they conceal
age differences. There is a steeper age gradient in
women so that their cholesterol readings are lower than
those in men of the same age at 35–44, but they are
higher at age 55–64. Age-specific readings are given in
the MONICA Data Book of population surveys, table
6.2.2 (1), and early results in MONICA Publication
11 (2).
11. The Data book contains tables covering a number of
other data items concerning cholesterol, such as the
percentage of participants above and below certain
cut points, HDL-cholesterol, and in later surveys the
reported frequency of earlier measurement and treat-
ment. See the MONICA Data Book of population
surveys, tables 6.2.1–6.2.7 (1). This Monograph
discusses only total cholesterol. Despite our efforts,
standardization for epidemiological comparison of
measurement of HDL-cholesterol in the MONICA
decade was unsatisfactory and failed to meet our
criteria for formal publication. See MONICA Quality
assessment of data on HDL-cholesterol (1).
1. See Monograph CD-ROM or MONICA Websitehttp://www.ktl.fi/monica/.
2. Full references and summaries of MONICA Publicationsappear in #85/86.
202 MONICA MONOGRAPH AND MULTIMEDIA SOURCEBOOK
Risk factors: total blood cholesterol
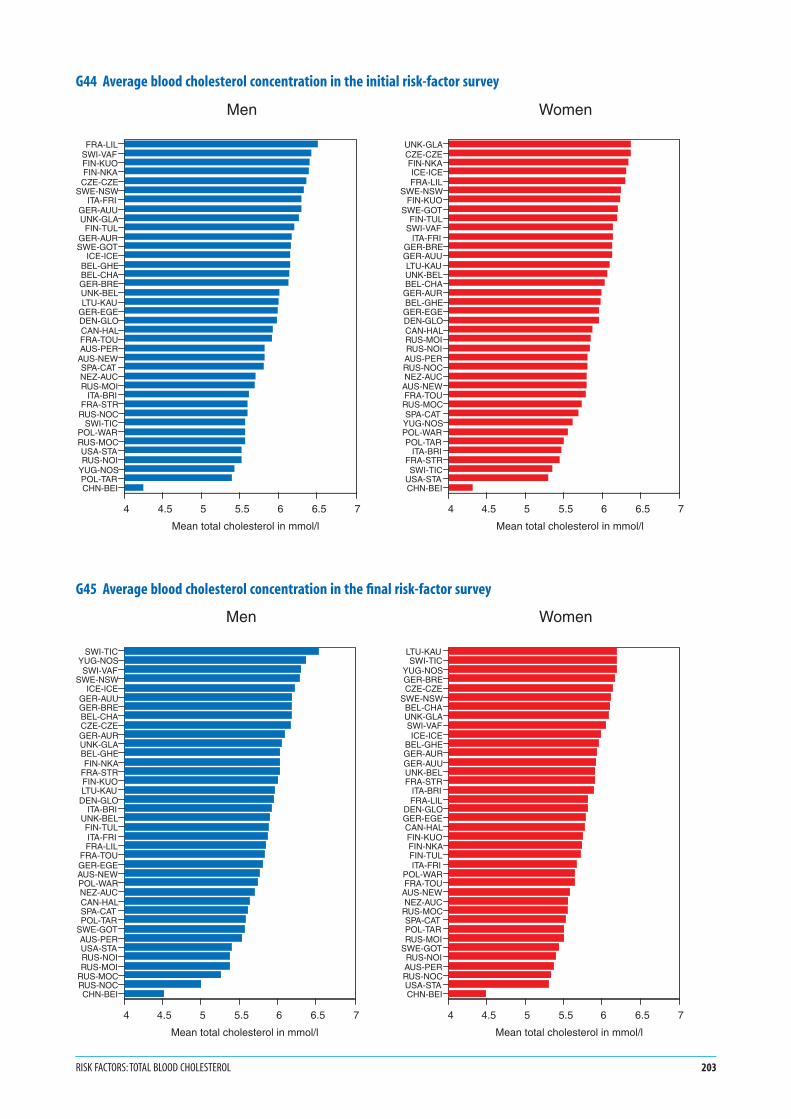
G44 Average blood cholesterol concentration in the initial risk-factor survey
G45 Average blood cholesterol concentration in the final risk-factor survey
RISK FACTORS: TOTAL BLOOD CHOLESTEROL 203
FRA-LILSWI-VAFFIN-KUOFIN-NKACZE-CZE
SWE-NSWITA-FRI
GER-AUUUNK-GLAFIN-TUL
GER-AURSWE-GOT
ICE-ICEBEL-GHEBEL-CHAGER-BREUNK-BELLTU-KAU
GER-EGEDEN-GLOCAN-HALFRA-TOUAUS-PER
AUS-NEWSPA-CATNEZ-AUCRUS-MOI
ITA-BRIFRA-STR
RUS-NOCSWI-TIC
POL-WARRUS-MOCUSA-STARUS-NOI
YUG-NOSPOL-TARCHN-BEI
4 4.5 5 5.5 6 6.5 7
Mean total cholesterol in mmol/l
Men
UNK-GLACZE-CZEFIN-NKAICE-ICEFRA-LIL
SWE-NSWFIN-KUO
SWE-GOTFIN-TUL
SWI-VAFITA-FRI
GER-BREGER-AUULTU-KAUUNK-BELBEL-CHAGER-AURBEL-GHEGER-EGEDEN-GLOCAN-HALRUS-MOIRUS-NOIAUS-PERRUS-NOCNEZ-AUCAUS-NEWFRA-TOURUS-MOCSPA-CATYUG-NOSPOL-WARPOL-TAR
ITA-BRIFRA-STRSWI-TIC
USA-STACHN-BEI
4 4.5 5 5.5 6 6.5 7
Mean total cholesterol in mmol/l
Women
SWI-TICYUG-NOSSWI-VAF
SWE-NSWICE-ICE
GER-AUUGER-BREBEL-CHACZE-CZEGER-AURUNK-GLABEL-GHEFIN-NKA
FRA-STRFIN-KUOLTU-KAU
DEN-GLOITA-BRI
UNK-BELFIN-TULITA-FRIFRA-LIL
FRA-TOUGER-EGEAUS-NEWPOL-WARNEZ-AUCCAN-HALSPA-CATPOL-TAR
SWE-GOTAUS-PERUSA-STARUS-NOIRUS-MOI
RUS-MOCRUS-NOCCHN-BEI
4 4.5 5 5.5 6 6.5 7
Mean total cholesterol in mmol/l
Men
LTU-KAUSWI-TIC
YUG-NOSGER-BRECZE-CZE
SWE-NSWBEL-CHAUNK-GLASWI-VAFICE-ICE
BEL-GHEGER-AURGER-AUUUNK-BELFRA-STR
ITA-BRIFRA-LIL
DEN-GLOGER-EGECAN-HALFIN-KUOFIN-NKAFIN-TULITA-FRI
POL-WARFRA-TOU
AUS-NEWNEZ-AUC
RUS-MOCSPA-CATPOL-TARRUS-MOI
SWE-GOTRUS-NOIAUS-PERRUS-NOCUSA-STACHN-BEI
4 4.5 5 5.5 6 6.5 7
Mean total cholesterol in mmol/l
Women
Notes in italics are repeated to help random browsers—
systematic readers should ignore them
G461. Calculation of trends is explained in #38 Population
Prevalence and Trends.
2. The initial and final surveys did not take place exactly
ten years apart. G46 incorporates corrections to stan-
dardize the differences, as if they were being measured
across ten years.
3. Horizontal bars in G46 show the 95% confidence inter-
vals around the estimated annual trend. The smaller the
length of the bars, the more precise the trend estimate. If
the bars fail to cross the zero line, the estimated trend is
considered to deviate significantly from zero. Declining
trends are shown to the left of the zero line, increasing
trends, to the right.
4. To convert to and from SI Units: 200 mg/dl =5.17 mmol/l; 10 mmol/l = 387 mg/dl.
5. Confidence intervals are similar for men and women; the
population surveys sampled them in similar numbers.
6. G46 shows similar trends in total cholesterol in men
and women, in the various populations. Two-thirds of
the male populations show a decrease, tending to the
left of zero. Ten show an increase, right of zero. In
women, results are virtually the same, although specific
populations vary a little in their ranking. Age-specific
data are available in the MONICA Data Book on
population surveys table 6.2.2 (1).
G477. G47 is a spot map showing the geographical distribution
of the results shown in G46. Some of the confidence inter-
vals in G46 include zero. These populations are marked
with black spots. Those with a significant decrease in cho-
lesterol levels are shown with blue spots while a signifi-
cant increase is shown with a red spot. ‘Significant’ is
statistical, meaning that the change is large enough for
it to be unlikely to have arisen by chance when random
sampling variation is taken into account. Significant
changes and differences can occur through undetected
bias, such as a drift in laboratory standards over time.
These findings have not been adjusted for measure-
ment quality.
8. Many populations show a significant decline in choles-
terol between the initial and final surveys. Seven male
and five female populations show an increase. There is
some apparent geographical clustering of results.
9. Results shown here should be interpreted in associa-
tion with the MONICA Quality assessment of data
on total cholesterol (1), and with G56 (see later).
The quality of total cholesterol data, despite intense
attempts at standardization in the planning of
MONICA, raises more questions than the quality of
data on other risk factors. G56 shows that some of the
more extreme cholesterol trends arose among popula-
tion RUAs whose cholesterol quality scores were sub-
optimal. See notes on G56.
10. The only publication specific to cholesterol is
MONICA Publication 13 (2) on data quality. MONICA
Publication 11 (2) contained early cross-sectional and
age-specific data. Further publications are in prepara-
tion and will be listed on the MONICA Website (1) as
they appear.
1. See Monograph CD-ROM or MONICA Websitehttp://www.ktl.fi/monica/.
2. Full references and summaries of MONICA Publicationsappear in #85/86.
204 MONICA MONOGRAPH AND MULTIMEDIA SOURCEBOOK

G46 Ten-year change in average blood cholesterol concentration
G47 Spot maps of population changes in average blood cholesterol concentration
RISK FACTORS: TOTAL BLOOD CHOLESTEROL 205
FRA-LILRUS-NOCSWE-GOT
ITA-FRIRUS-MOIFIN-KUOCAN-HALFIN-NKAFIN-TUL
RUS-NOIRUS-MOCCZE-CZEBEL-GHEUNK-GLAAUS-PERSPA-CAT
GER-EGEUNK-BELSWI-VAFUSA-STAFRA-TOUGER-AUUGER-AURAUS-NEWLTU-KAU
SWE-NSWDEN-GLONEZ-AUCBEL-CHA
ICE-ICEGER-BREPOL-WARPOL-TARCHN-BEIFRA-STR
ITA-BRIYUG-NOS
SWI-TIC
-1.5 -1 -0.5 0 0.5 1 1.5 2
Ten-year trend in total cholesterol in mmol/l
MenSWE-GOTRUS-NOC
FRA-LILFIN-NKAITA-FRI
RUS-NOIFIN-KUOFIN-TUL
RUS-MOIAUS-PERUNK-GLACZE-CZE
ICE-ICERUS-MOCUNK-BELNEZ-AUCGER-AUUGER-EGESPA-CAT
AUS-NEWFRA-TOU
SWE-NSWDEN-GLOSWI-VAFCAN-HALGER-AURBEL-GHEUSA-STAPOL-TARLTU-KAU
POL-WARGER-BREBEL-CHACHN-BEIFRA-STR
YUG-NOSITA-BRI
SWI-TIC
-1.5 -1 -0.5 0 0.5 1 1.5 2
Ten-year trend in total cholesterol in mmol/l
Women
Men Women
Significant increaseInsignificant change Significant decrease
Notes in italics are repeated to help random browsers—
systematic readers should ignore them
1. The timing of the initial and final surveys differed by
population. They were usually eight to ten years apart but
the interval could be as little as six years. The calendar
years and months varied. See G10 and MONICA Quality
assessment of age, date of examination and survey
periods.
2. Results are shown as the mean body mass index (BMI)
in kilograms per square metre for the 35–64 age group.
See #34 Height, Weight, and Waist Circumference.
The results are age-standardized to minimize any effect
of differing age structures on the apparent findings.
See #38 Population Prevalence and Trends, #39 Age
Standardization.
3. The graphs characterize men and women over a thirty-
year age band in each survey for each population with a
single value, but levels and trends vary with age. Age-
specific data are published in the MONICA Data Book
of population surveys, table 6.3.4 (1), and early results
in MONICA Publication 11 (2).
4. Survey results could be influenced by failure to partici-
pate by some of those selected for the survey. The issue is
complex. Different methods of recruitment and sampling
were used in different populations. There is more than
one definition of response rates. See #28 Sampling, #29
Recruitment and Response Rates, MONICA Quality
assessment of participation rates, sampling frames and
fractions (1).
5. Body mass index is used as an indicator of obesity or
body fat. Weight is corrected by the square of the body
height. Although bone and muscle also contribute, the
biggest variation between body mass in individuals,
particularly in sedentary groups, is in their body fat.
Epidemiologists have always been interested in the dis-
tribution of body fat, originally using calliper meas-
urement of skin-fold thickness, but this was difficult to
standardize. Measurement of abdominal obesity by
waist circumference and its ratio with hip circumfer-
ence became standard just too late for the MONICA
protocol for the initial population surveys, although it
was introduced into later MONICA surveys. Popula-
tion surveys need simple techniques. Isotope tests, and
weighing under water for body fat estimation can be
done in laboratories but not in field surveys. See #34
Height, Weight, and Waist Circumference.
6. Participants had their weight and height measured
with shoes and outside clothes removed. Measurement,
as with blood pressure, appears simple and easy, but
there is potential for problems in standardization of
measurements, and of equipment, to ensure that
population trends are genuine. See #34 Height, Weight,
and Waist Circumference, MONICA Manual Part III,
Section 1 (1), MONICA Quality assessment of data on
weight and height (1), MONICA Quality assessment of
data on waist and hip circumference (1).
7. The scale for men and women is the same. There was
little variation between most population RUAs in the
initial survey in men, except for China-Beijing, CHN-
BEI, see #55, as previously for cholesterol. There was
more variation in women. In the final survey there was
again more variation between female populations than
in men. Some populations show similar, and some
rather different rankings between the two sexes, possi-
bly related to differences in smoking levels by sex. Even
a quick glance down the page shows that obesity is
increasing between G48 and G49. This is confirmed
when you turn the page to G50.
8. The MONICA Data Book of population surveys con-
tains several tables 6.3.2–6.3.7 covering a number of
items related to measurements of height, weight, body
mass index, obesity cut points, waist and hip circum-
ference and their ratio. Height itself is of epidemiolog-
ical interest, as a marker of nutritional status in early
life.
9. Obesity is not considered a major classical risk factor
for coronary disease as are cigarette smoking, blood
pressure and cholesterol, but it is of great importance
for public health and has generated several papers in
MONICA. See #34 Height, Weight, and Waist Circum-
ference, MONICA Publications 27, 35, 37, 41 (2).
1. See Monograph CD-ROM or MONICA Websitehttp://www.ktl.fi/monica/.
2. Full references and summaries of MONICA Publicationsappear in #85/86.
206 MONICA MONOGRAPH AND MULTIMEDIA SOURCEBOOK
Risk factors: obesity, body mass index
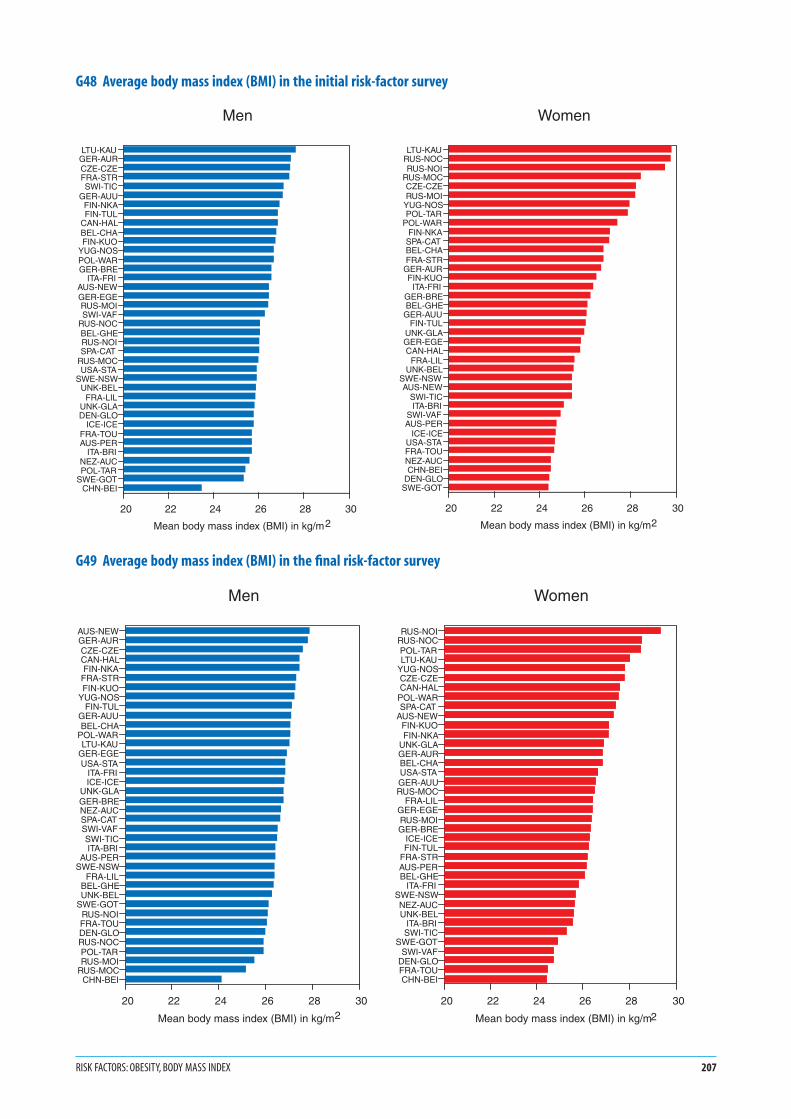
G48 Average body mass index (BMI) in the initial risk-factor survey
G49 Average body mass index (BMI) in the final risk-factor survey
RISK FACTORS: OBESITY, BODY MASS INDEX 207
LTU-KAURUS-NOCRUS-NOI
RUS-MOCCZE-CZERUS-MOI
YUG-NOSPOL-TAR
POL-WARFIN-NKA
SPA-CATBEL-CHAFRA-STR
GER-AURFIN-KUO
ITA-FRIGER-BREBEL-GHE
GER-AUUFIN-TUL
UNK-GLAGER-EGECAN-HAL
FRA-LILUNK-BEL
SWE-NSWAUS-NEW
SWI-TICITA-BRI
SWI-VAFAUS-PER
ICE-ICEUSA-STAFRA-TOUNEZ-AUCCHN-BEI
DEN-GLOSWE-GOT
20 22 24 26 28 30
Mean body mass index (BMI) in kg/m
Women
2
LTU-KAUGER-AURCZE-CZEFRA-STRSWI-TIC
GER-AUUFIN-NKAFIN-TUL
CAN-HALBEL-CHAFIN-KUO
YUG-NOSPOL-WARGER-BRE
ITA-FRIAUS-NEWGER-EGERUS-MOISWI-VAF
RUS-NOCBEL-GHERUS-NOISPA-CAT
RUS-MOCUSA-STA
SWE-NSWUNK-BEL
FRA-LILUNK-GLADEN-GLO
ICE-ICEFRA-TOUAUS-PER
ITA-BRINEZ-AUCPOL-TAR
SWE-GOTCHN-BEI
20 22 24 26 28 30
Mean body mass index (BMI) in kg/m
Men
2
RUS-NOIRUS-NOCPOL-TARLTU-KAU
YUG-NOSCZE-CZECAN-HAL
POL-WARSPA-CAT
AUS-NEWFIN-KUOFIN-NKA
UNK-GLAGER-AURBEL-CHAUSA-STAGER-AUURUS-MOC
FRA-LILGER-EGERUS-MOIGER-BRE
ICE-ICEFIN-TUL
FRA-STRAUS-PERBEL-GHE
ITA-FRISWE-NSWNEZ-AUCUNK-BEL
ITA-BRISWI-TIC
SWE-GOTSWI-VAF
DEN-GLOFRA-TOUCHN-BEI
20 22 24 26 28 30
Mean body mass index (BMI) in kg/m
Women
2
AUS-NEWGER-AURCZE-CZECAN-HALFIN-NKA
FRA-STRFIN-KUO
YUG-NOSFIN-TUL
GER-AUUBEL-CHA
POL-WARLTU-KAU
GER-EGEUSA-STA
ITA-FRIICE-ICE
UNK-GLAGER-BRENEZ-AUCSPA-CATSWI-VAFSWI-TICITA-BRI
AUS-PERSWE-NSW
FRA-LILBEL-GHEUNK-BEL
SWE-GOTRUS-NOIFRA-TOUDEN-GLORUS-NOCPOL-TARRUS-MOI
RUS-MOCCHN-BEI
20 22 24 26 28 30
Mean body mass index (BMI) in kg/m
Men
2
Notes in italics are repeated to help random browsers—
systematic readers should ignore them
1. Calculation of trends is explained in #38 Population
Prevalence and Trends.
G502. The initial and final surveys did not take place exactly
ten years apart, but this graph incorporates corrections to
standardize the differences as if they were being measured
across ten years.
3. Horizontal bars in G50 show the 95% confidence inter-
vals around the estimated annual trend. The smaller the
length of the bars, the more precise the trend estimate. If
the bars fail to cross the zero line the estimated trend is
considered to deviate significantly from zero. Declining
trends are shown to the left of the zero line, increasing
trends to the right.
4. Confidence intervals appear similar for men and
women, although possibly a bit wider in more female
populations. The population surveys sampled similar
numbers of men and women.
5. G50 shows similar trends in body mass index in men
and women in the various populations. The majority
of male populations show an increase, so that the esti-
mated trend is to the left of zero in only six popula-
tions, and to the right in the remainder. In women,
there is a similar but less marked pattern with 15 pop-
ulations showing a decline in body mass index, and the
remainder an increase. Changes in women are more
extreme at the top and bottom of the graphs than
they are in men. Age-specific data are available in the
MONICA Data Book of population surveys, table
6.3.4 (1).
G516. G51 is a spot map showing the geographical distribution
of the results shown in G50. Some of the confidence inter-
vals in G50 include zero. The populations concerned are
marked by black spots. Those with a significant decrease
in body mass index are shown with blue spots, while a
significant increase is shown with a red spot.
7. Many populations show a significant increase in
body mass index between the initial and final surveys.
There is some apparent polarization of red and blue
across Europe, particularly in women, but this is not
consistent.
8. These results should be considered in association with
the MONICA Quality assessment of data on weight
and height, and with G56 (see later), which plots trends
in population RUA results against their quality scores.
These suggest that the population increases in body
mass index shown here are real.
9. For further information see #34 Height, Weight, and
Waist Circumference, MONICA Quality assessment of
data on weight and height (1), MONICA Quality
assessment of data on waist and hip circumference (1),
MONICA Data Book of population surveys, tables
6.3.2–6.3.7 (1), MONICA Publications 27, 35, 37, 41
(2). Further publications are listed on the MONICA
Website as they appear (1).
1. See Monograph CD-ROM or MONICA Websitehttp://www.ktl.fi/monica/.
2. Full references and summaries of MONICA Publicationsappear in #85/86.
208 MONICA MONOGRAPH AND MULTIMEDIA SOURCEBOOK

G50 Ten-year change in average body mass index (BMI)
G51 Spot maps of population changes in average body mass index (BMI)
RISK FACTORS: OBESITY, BODY MASS INDEX 209
RUS-MOISWI-TIC
RUS-MOCLTU-KAU
RUS-NOCFRA-STR
GER-AUURUS-NOICZE-CZEDEN-GLO
FIN-TULSWI-VAF
GER-BREITA-FRI
POL-WARGER-AURFRA-TOUFIN-KUOUNK-BEL
GER-EGEFRA-LIL
POL-TARBEL-CHA
YUG-NOSBEL-GHEFIN-NKA
CAN-HALSWE-NSWSPA-CATAUS-PERCHN-BEI
SWE-GOTITA-BRI
NEZ-AUCICE-ICE
UNK-GLAUSA-STA
AUS-NEW
-4 -3 -2 -1 0 1 2 3 4
Ten-year trend in body mass index (BMI) in kg/m
Men
2
RUS-MOCRUS-MOILTU-KAU
RUS-NOCCZE-CZE
ITA-FRIFRA-STRBEL-CHAYUG-NOSSWI-VAFRUS-NOIFRA-TOUBEL-GHEFIN-NKASWI-TIC
CHN-BEIUNK-BELGER-BREPOL-WARGER-AUR
SWE-NSWFIN-TUL
DEN-GLOITA-BRI
SPA-CATGER-AUUGER-EGESWE-GOTPOL-TARFIN-KUOUNK-GLA
FRA-LILNEZ-AUCAUS-PER
ICE-ICEAUS-NEWUSA-STACAN-HAL
-4 -3 -2 -1 0 1 2 3 4
Ten-year trend in body mass index (BMI) in kg/m
Women
2
Men Women
Significant increaseInsignificant change Significant decrease
Notes in italics are repeated to help random browsers—
systematic readers should ignore them
1. The timing of the initial and final surveys differed by
population. They were usually eight to ten years apart but
the interval could be as little as six years. The calendar
years and months varied. See G10 and MONICA Quality
assessment of age, date of examination and survey
periods (1).
2. Results are shown as the estimated average coronary risk-
factor score in the 35–64 age group. The results are age-
standardized to minimize any effect of differing age
structures on the apparent findings. See #35 Risk-Factor
Scores, #38 Population Prevalence and Trends, #39 Age
Standardization.
3. The graphs characterize men and women over a thirty-
year age band in each survey for each population with
a single value, but levels and trends vary with age. Age-
specific data are not published. The risk-factor score
is derived from risk-factor data published in the
MONICA Data Book of population surveys.
4. Survey results could be influenced by failure to partici-
pate by some of those selected for the survey. The issue is
complex. Different methods of recruitment and sampling
were used in different populations. There is more than
one definition of response rates. See #28 Sampling, #29
Recruitment and Response Rates, MONICA Quality
assessment of participation rates, sampling frames and
fractions (1).
5. The risk-factor score is used to summarize the pre-
sumed contribution of the classical coronary risk
factors: cigarette smoking, systolic blood pressure, and
total cholesterol, along with body mass index, to coro-
nary risk. The formula is based on follow-up or cohort
studies in Europe in which thousands of subjects
had such risk-factor measurements and were then
followed-up for coronary events. Smoking, blood
pressure and cholesterol contribute heavily to the score
as classical major risk factors. The contribution of body
mass index is smaller, particularly in women. See #35
Risk-Factor Scores, MONICA Publications 12, 32, 33, 38
(2), and Appendix to 38 published on the MONICA
Website (1).
6. Although the scale for men and women is similar in
G52 and G53, the scores differ on average by about 0.5
units between men and women. Populations rank
similarly in men and women, but there are disparities.
These may relate to sex differences in smoking rates,
which are large in some population RUAs.
7. The risk-factor score is unique among the factors dis-
played in these charts, in that it is not the same for men
and women. Although smoking levels differed in the
two sexes, as did blood pressure sometimes, these did
not account entirely for the lower score in women in
G52 and G53. The statistical coefficients derived for
men and women are different. Identical risk-factor
values in the two sexes would produce lower scores in
women. See #35 Risk-Factor Scores. Comparison of the
sexes for this item is misleading.
8. The choice of a coronary risk-factor score for testing
the MONICA risk-factor hypothesis involved consid-
erable research and planning, some of which is pub-
lished. See MONICA Publications 12, 32, 33, 38 (2) and
the Appendix to publication 38 on the MONICA
Website and Monograph CD-ROM. (1)
9. Coefficients for a stroke risk-factor score are similar but
not identical. See #35 Risk-Factor Scores.
1. See Monograph CD-ROM or MONICA Websitehttp://www.ktl.fi/monica/.
2. Full references and summaries of MONICA Publicationsappear in #85/86.
210 MONICA MONOGRAPH AND MULTIMEDIA SOURCEBOOK
Risk factors: risk-factor score
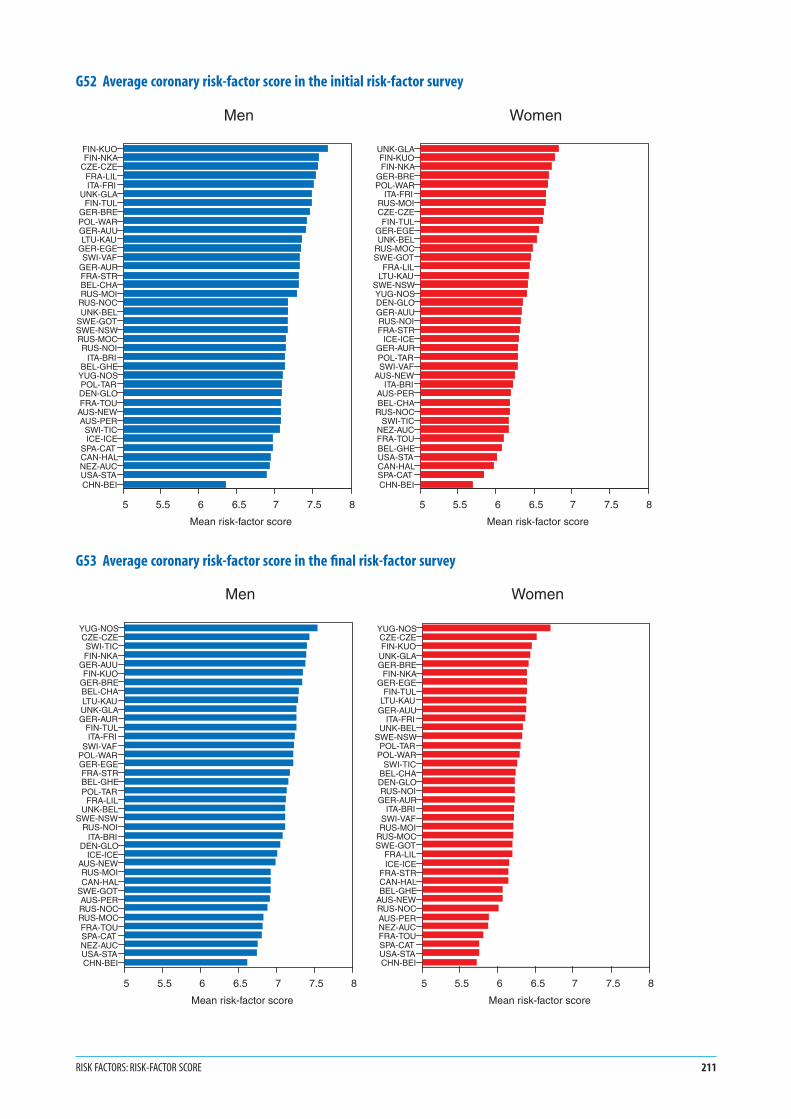
G52 Average coronary risk-factor score in the initial risk-factor survey
G53 Average coronary risk-factor score in the final risk-factor survey
RISK FACTORS: RISK-FACTOR SCORE 211
FIN-KUOFIN-NKA
CZE-CZEFRA-LILITA-FRI
UNK-GLAFIN-TUL
GER-BREPOL-WARGER-AUULTU-KAU
GER-EGESWI-VAF
GER-AURFRA-STRBEL-CHARUS-MOI
RUS-NOCUNK-BEL
SWE-GOTSWE-NSWRUS-MOCRUS-NOI
ITA-BRIBEL-GHE
YUG-NOSPOL-TARDEN-GLOFRA-TOU
AUS-NEWAUS-PER
SWI-TICICE-ICE
SPA-CATCAN-HALNEZ-AUCUSA-STACHN-BEI
5 5.5 6 6.5 7 7.5 8
Mean risk-factor score
Men
UNK-GLAFIN-KUOFIN-NKA
GER-BREPOL-WAR
ITA-FRIRUS-MOICZE-CZEFIN-TUL
GER-EGEUNK-BEL
RUS-MOCSWE-GOT
FRA-LILLTU-KAU
SWE-NSWYUG-NOSDEN-GLOGER-AUURUS-NOIFRA-STR
ICE-ICEGER-AURPOL-TARSWI-VAF
AUS-NEWITA-BRI
AUS-PERBEL-CHA
RUS-NOCSWI-TIC
NEZ-AUCFRA-TOUBEL-GHEUSA-STACAN-HALSPA-CATCHN-BEI
5 5.5 6 6.5 7 7.5 8
Mean risk-factor score
Women
YUG-NOSCZE-CZESWI-TICFIN-NKA
GER-AUUFIN-KUO
GER-BREBEL-CHALTU-KAUUNK-GLAGER-AUR
FIN-TULITA-FRI
SWI-VAFPOL-WARGER-EGEFRA-STRBEL-GHEPOL-TAR
FRA-LILUNK-BEL
SWE-NSWRUS-NOI
ITA-BRIDEN-GLO
ICE-ICEAUS-NEWRUS-MOICAN-HAL
SWE-GOTAUS-PERRUS-NOCRUS-MOCFRA-TOUSPA-CATNEZ-AUCUSA-STACHN-BEI
5 5.5 6 6.5 7 7.5 8
Mean risk-factor score
Men
YUG-NOSCZE-CZEFIN-KUO
UNK-GLAGER-BRE
FIN-NKAGER-EGE
FIN-TULLTU-KAU
GER-AUUITA-FRI
UNK-BELSWE-NSW
POL-TARPOL-WAR
SWI-TICBEL-CHADEN-GLORUS-NOI
GER-AURITA-BRI
SWI-VAFRUS-MOI
RUS-MOCSWE-GOT
FRA-LILICE-ICE
FRA-STRCAN-HALBEL-GHE
AUS-NEWRUS-NOCAUS-PERNEZ-AUCFRA-TOUSPA-CATUSA-STACHN-BEI
5 5.5 6 6.5 7 7.5 8
Mean risk-factor score
Women
Notes in italics are repeated to help random browsers—
systematic readers should ignore them
G541. Calculation of trends is explained in #38 Population
Prevalence and Trends.
2. The initial and final surveys did not take place exactly
ten years apart, but this graph incorporates corrections
to standardize the differences, as if they were being
measured across ten years.
3. Horizontal bars in G54 show the 95% confidence inter-
vals around the estimated 10-year trend. The smaller the
length of the bars the more precise the estimated trend. If
the bars fail to cross the zero line the estimated trend is
considered to deviate significantly from zero. Declining
trends are shown to the left of the zero line, increasing
trends to the right.
4. Confidence intervals are similar for men and women; the
population surveys sampled them in similar numbers.
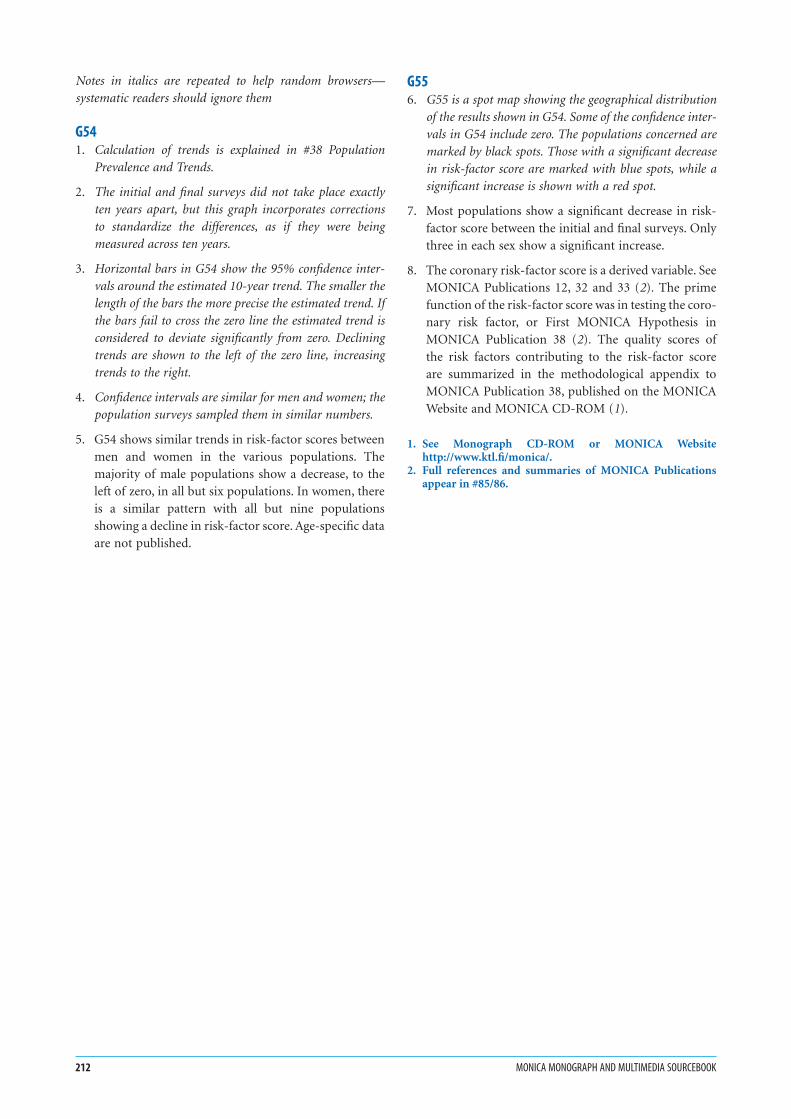
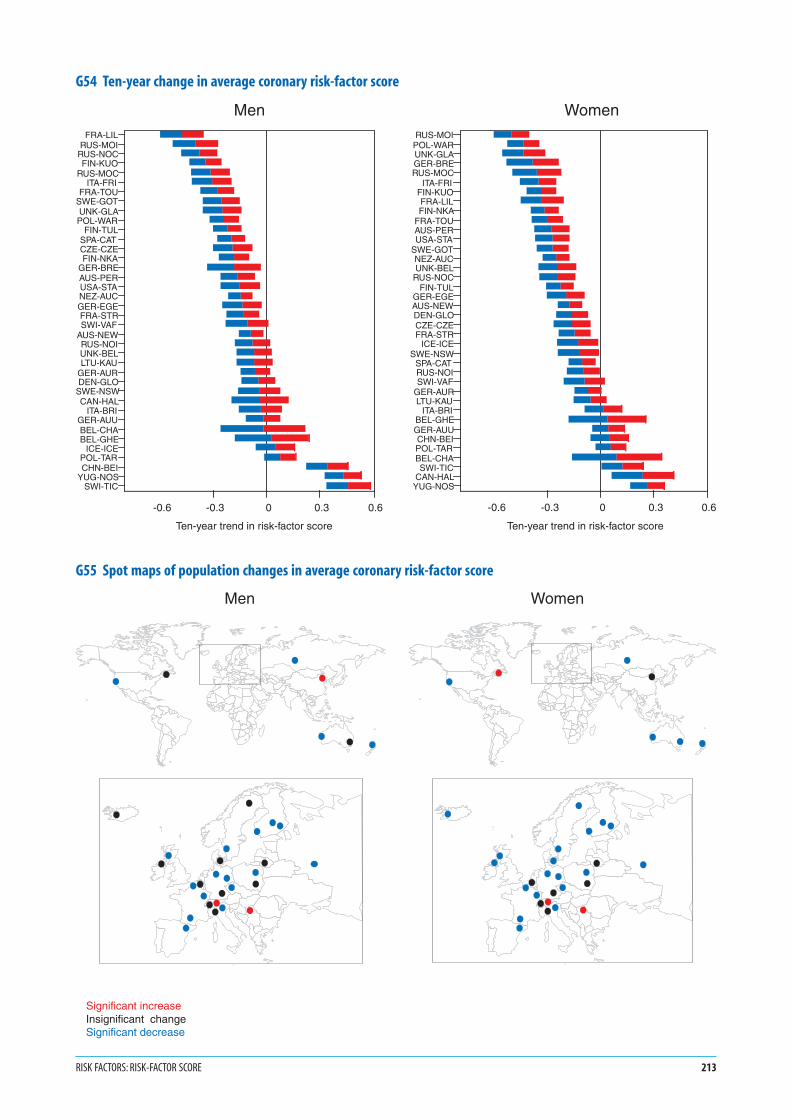
5. G54 shows similar trends in risk-factor scores between
men and women in the various populations. The
majority of male populations show a decrease, to the
left of zero, in all but six populations. In women, there
is a similar pattern with all but nine populations
showing a decline in risk-factor score. Age-specific data
are not published.
G556. G55 is a spot map showing the geographical distribution
of the results shown in G54. Some of the confidence inter-
vals in G54 include zero. The populations concerned are
marked by black spots. Those with a significant decrease
in risk-factor score are marked with blue spots, while a
significant increase is shown with a red spot.
7. Most populations show a significant decrease in risk-
factor score between the initial and final surveys. Only
three in each sex show a significant increase.
8. The coronary risk-factor score is a derived variable. See
MONICA Publications 12, 32 and 33 (2). The prime
function of the risk-factor score was in testing the coro-
nary risk factor, or First MONICA Hypothesis in
MONICA Publication 38 (2). The quality scores of
the risk factors contributing to the risk-factor score
are summarized in the methodological appendix to
MONICA Publication 38, published on the MONICA
Website and MONICA CD-ROM (1).
1. See Monograph CD-ROM or MONICA Websitehttp://www.ktl.fi/monica/.
2. Full references and summaries of MONICA Publicationsappear in #85/86.
212 MONICA MONOGRAPH AND MULTIMEDIA SOURCEBOOK
G54 Ten-year change in average coronary risk-factor score
G55 Spot maps of population changes in average coronary risk-factor score
RISK FACTORS: RISK-FACTOR SCORE 213
FRA-LILRUS-MOI
RUS-NOCFIN-KUO
RUS-MOCITA-FRI
FRA-TOUSWE-GOTUNK-GLAPOL-WAR
FIN-TULSPA-CATCZE-CZEFIN-NKA
GER-BREAUS-PERUSA-STANEZ-AUCGER-EGEFRA-STRSWI-VAF
AUS-NEWRUS-NOIUNK-BELLTU-KAU
GER-AURDEN-GLO
SWE-NSWCAN-HAL
ITA-BRIGER-AUUBEL-CHABEL-GHE
ICE-ICEPOL-TARCHN-BEI
YUG-NOSSWI-TIC
-0.6 -0.3 0 0.3 0.6
Ten-year trend in risk-factor score
MenRUS-MOI
POL-WARUNK-GLAGER-BRERUS-MOC
ITA-FRIFIN-KUOFRA-LILFIN-NKA
FRA-TOUAUS-PERUSA-STA
SWE-GOTNEZ-AUCUNK-BEL
RUS-NOCFIN-TUL
GER-EGEAUS-NEWDEN-GLOCZE-CZEFRA-STR
ICE-ICESWE-NSW
SPA-CATRUS-NOISWI-VAF
GER-AURLTU-KAU
ITA-BRIBEL-GHEGER-AUUCHN-BEIPOL-TARBEL-CHASWI-TIC
CAN-HALYUG-NOS
-0.6 -0.3 0 0.3 0.6
Ten-year trend in risk-factor score
Women
Men Women
Significant increaseInsignificant change Significant decrease
1. G56 shows scatter plots for the change in each risk
factor against the quality score for that factor awarded
after assessment of the data in the MONICA Quality
assessment reports (1). See #12 Quality Assurance.
2. Quality scores covered items that could be assessed
centrally from external quality control, from question-
naires completed by the investigators and from careful
analysis of the data. A poor score was not a guarantee
that results were unreliable. Conversely, a good score
did not guarantee that results were not biased. There
could be biases that had not been anticipated or could
not be measured and assessed. In MONICA a score of
2.0 was awarded for data of acceptable and consistent
quality with no major problems, 1.0 for data with
minor problems or inconsistencies and 0.0 where there
were significant problems that could not be solved
retrospectively. A score of 0.0 is a bad score, but it
does not of itself mean that data are unreliable, only
that there is major concern about their quality.
3. Scoring was explicit and transparent, and done with
the knowledge and cooperation of the investigators
concerned. Quality problems are all discussed in the
appropriate Quality assessment reports (1). Bias is
more important than random error because it is
average values that are being compared.
4. Ideally, the great majority of populations would
achieve high scores, and the trends being measured
would be large in relation to potential measurement
errors. Populations with high scores would show the
widest variation in risk-factor trends, so there would be
no relation between poor scores and extreme results for
trends.
5. The manuscript groups decided that MONICA could
not exclude populations from hypothesis testing if a
few data items were questionable, because almost all
centres had some problem with one item or another.
Instead it chose to incorporate quality scores into the
collaborative analyses. See #12 Quality Assurance,
MONICA Publication 38 (2), and its Appendix (1)
published on the MONICA Website and CD-ROM.
6. Main results of hypothesis-testing appeared relatively
insensitive to whether data quality scores were incor-
porated or not, and with what weighting. See MONICA
Publications 38, 39 (2).
7. In G56 results appear satisfactory for smoking, blood
pressure, and body mass index, and less than satisfac-
tory for cholesterol.
8. Two populations with significant increase in total cho-
lesterol between the initial and final surveys had the
lowest quality score for this item.
9. Results of quality assessment for total cholesterol were
not satisfactory. Those for HDL-cholesterol, not a core
risk factor, but of great interest, were worse. This was
despite involvement from the start of an external
quality control centre, use of standard protocols and
preliminary training, and testing with circulation of
materials. Methods have advanced since the early
1980s, but standardization and quality control prob-
lems never disappear. Anyone denying their existence
cannot have looked for them. Investigators in studies
such as MONICA need to invest considerably in this
area and should assume that they will have problems.
10. The WHO MONICA Project was ahead of its time in
the 1980s in placing great emphasis on quality assur-
ance. It also set a precedent by putting all its indicators
of performance into the public domain by publishing
them on its Website (1).
11. Quality scores aid the interpretation of individual
trends. Along with estimates of precision, they were
fundamental to the testing of the MONICA hypothe-
ses by providing a means for involving different popu-
lations with differing reliability of data. See #40
Statistical Analysis—relating changes in risk factors and
treatments to changes in event rates, MONICA Publica-
tion 38, 39 (2).
1. See Monograph CD-ROM or MONICA Websitehttp://www.ktl.fi/monica/.
2. Full references and summaries of MONICA Publicationsappear in #85/86.
214 MONICA MONOGRAPH AND MULTIMEDIA SOURCEBOOK
Risk factors: risk-factor quality scores

G56 Scatter plots by population of change in risk factors against their quality scores
RISK FACTORS: RISK-FACTOR QUALITY SCORES 215
0 0.5 1 1.5 20Smoking quality score
-20
-10
0
10
20
Tren
d in
dai
ly s
mok
ing
0 0.5 1 1.5 20Smoking quality score
-20
-10
0
10
20
Tren
d in
dai
ly s
mok
ing
0 0.5 1 1.5 20Blood pressure quality score
-20
-15
-10
-5
0
5
10
15
Tren
d in
sys
tolic
blo
od p
ress
ure
0 0.5 1 1.5 20Blood pressure quality score
-20
-15
-10
-5
0
5
10
15
Tren
d in
sys
tolic
blo
od p
ress
ure
0 0.5 1 1.5 20Cholesterol quality score
-1
-0.5
0
0.5
1
1.5
Tren
d in
tota
l cho
lest
erol
0 0.5 1 1.5 20Cholesterol quality score
-1
-0.5
0
0.5
1
1.5
Tren
d in
tota
l cho
lest
erol
0 0.5 1 1.5 20BMI quality score
-3
-2
-1
0
1
2
3
Tren
d in
BM
I
0 0.5 1 1.5 20BMI quality score
-3
-2
-1
0
1
2
3
Tren
d in
BM
I
Wom
enM
en
Daily cigarette smoking
Body mass indexBlood cholesterol concentration
Systolic blood pressure

1. Basic coronary-event monitoring did not originally
include any treatments or interventions. See G8. When
MONICA was planned around 1980, it was not known
whether acute coronary care was effective: most coro-
nary deaths were sudden and untreated. The First
MONICA, or coronary risk-factor Hypothesis seemed
most relevant to disease trends. That acute care influ-
enced survival in coronary events, (or its complement
case fatality), was the basis of the Second MONICA or
coronary care Hypothesis. The importance of cardiac
drugs and treatment in secondary prevention was
insufficiently appreciated.
2. For coronary care MONICA investigators were to
record all relevant medication and interventions in
coronary events for three phases of each coronary
event: before the onset, after the onset during the pre-
hospital and hospital period, and at discharge from
hospital. A minimum of 500 consecutive cases was to
be studied in two periods, near the start and at the end
of coronary-event registration.
3. The 500 cases included large numbers both of
untreated sudden deaths, in which there was difficulty
in identifying previous medication, and also of non-
fatal possible myocardial infarction, not included
in MONICA case definition 1. See #23 Diagnosing
Myocardial Infarction and Coronary Death. Coronary
care data were most complete for non-fatal definite
myocardial infarctions, a minority of the 500. Later it
was agreed to monitor coronary care continuously, but
data remained scanty from the first period.
4. The manuscript group examining the Second
MONICA Hypothesis decided to study change in coro-
nary care in non-fatal definite acute myocardial infarc-
tion across the two periods against change in major
coronary end-points. Event rates, case fatality and mor-
tality could not be measured in non-fatal cases alone,
so a contemporaneous or overlapping period of full
coronary-event registration was used.
5. The two periods of coronary care in each population,
and associated but sometimes longer periods of
coronary-event registration were shown in G11. Both
coronary care, and coronary-registration periods are
a sub-set of the data available. G11 showed that time
periods are not the same, and distances between them
are unequal, in different populations. Treatment
changes are not standardized improvement rates, but
simple differences. The manuscript group concen-
trated on eight evidence-based treatments.
6. G57 and G58 show change in use of beta-blockers,
in cases of definite non-fatal myocardial infarction,
between two time periods. A blue bar indicates increas-
ing use, the left end is the treatment level per cent in
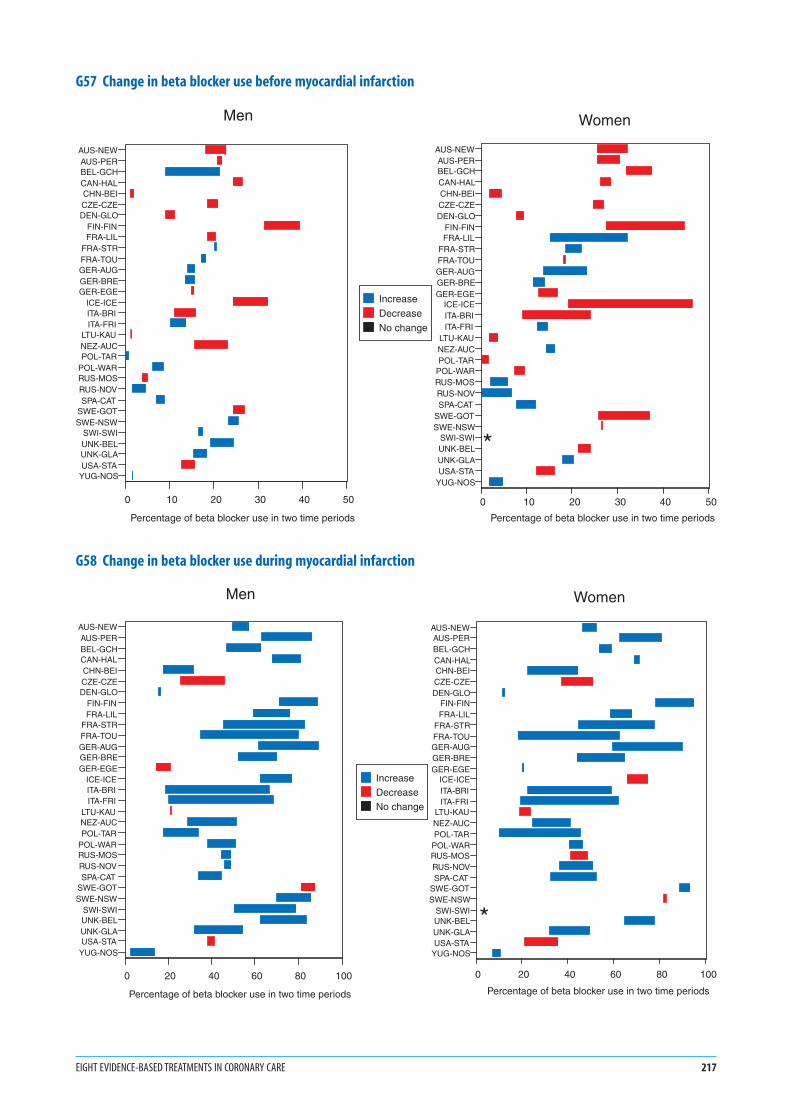
the first period; the right end that in the second. Red
bars indicate decreasing use, the right end is the treat-
ment level per cent in the first period; the left end that
in the second. The colourless gap to the left is common
to both. Beta-blockers were widely used throughout the
MONICA period. This explains why the blue and red
bars begin a long way from zero
7. G57 shows use of beta-blockers prior to myocardial
infarction. Up to one half of new coronary events occur
in those with previous angina pectoris, or myocardial
infarction, in whom prior treatment might be
expected. The other half would have no previous
history of coronary heart disease, but some had hyper-
tension. The scale maximum is 50%. G57 shows
population RUAs with increasing but also decreasing
use before infarction, possibly because of competing
drugs for angina and hypertension.
8. G58 shows use during non-fatal definite myocardial
infarction. The scale maximum is 100%. Use during
infarction increased substantially in many but not all
population RUAs as the findings of large randomized
controlled trials fed through into practice. There is
considerable heterogeneity.
9. Populations, listed alphabetically by country are those
described in note 4c for G1 and G2. The asterisk for
Swiss women marks missing data.
10. Beta-blockers are only one of numerous treatments
and interventions that were recorded. See #24 Acute
Coronary Care, MONICA Manual Part IV, Section 1,
paragraph 4.1.4.3 (1), MONICA Quality assessment
of acute coronary care data (1), the MONICA Data
Book of coronary care, tables 11a-p, 12a-p, 13a-p (1),
MONICA Publication 39 (2) the MONICA Second
Hypothesis, or coronary care paper. The latter gives
the denominators for each of these data points. Its
Appendix, published on the MONICA Website (1)
and Monograph CD-ROM, includes a review of why
specific drugs were chosen for this analysis.
1. See Monograph CD-ROM or MONICA Websitehttp://www.ktl.fi/monica/.
2. Full references and summaries of MONICA Publicationsappear in #85/86.
216 MONICA MONOGRAPH AND MULTIMEDIA SOURCEBOOK
Eight evidence-based treatments in coronary care
G57 Change in beta blocker use before myocardial infarction
G58 Change in beta blocker use during myocardial infarction
EIGHT EVIDENCE-BASED TREATMENTS IN CORONARY CARE 217
AUS-NEWAUS-PERBEL-GCHCAN-HALCHN-BEICZE-CZEDEN-GLO
FIN-FINFRA-LIL
FRA-STRFRA-TOUGER-AUGGER-BREGER-EGE
ICE-ICEITA-BRIITA-FRI
LTU-KAUNEZ-AUCPOL-TAR
POL-WARRUS-MOSRUS-NOVSPA-CAT
SWE-GOTSWE-NSW
SWI-SWIUNK-BELUNK-GLAUSA-STA
YUG-NOS
0 10 20 30 40 50
Percentage of beta blocker use in two time periods
IncreaseDecreaseNo change
Men
AUS-NEWAUS-PERBEL-GCHCAN-HALCHN-BEICZE-CZEDEN-GLO
FIN-FINFRA-LIL
FRA-STRFRA-TOUGER-AUGGER-BREGER-EGE
ICE-ICEITA-BRIITA-FRI
LTU-KAUNEZ-AUCPOL-TAR
POL-WARRUS-MOSRUS-NOVSPA-CAT
SWE-GOTSWE-NSW
SWI-SWIUNK-BELUNK-GLAUSA-STA
YUG-NOS
0 10 20 30 40 50
Percentage of beta blocker use in two time periods
Women
*
AUS-NEWAUS-PERBEL-GCHCAN-HALCHN-BEICZE-CZEDEN-GLO
FIN-FINFRA-LIL
FRA-STRFRA-TOUGER-AUGGER-BREGER-EGE
ICE-ICEITA-BRIITA-FRI
LTU-KAUNEZ-AUCPOL-TAR
POL-WARRUS-MOSRUS-NOVSPA-CAT
SWE-GOTSWE-NSW
SWI-SWIUNK-BELUNK-GLAUSA-STA
YUG-NOS
0 20 40 60 80 100
Percentage of beta blocker use in two time periods
IncreaseDecreaseNo change
Men
AUS-NEWAUS-PERBEL-GCHCAN-HALCHN-BEICZE-CZEDEN-GLO
FIN-FINFRA-LIL
FRA-STRFRA-TOUGER-AUGGER-BREGER-EGE
ICE-ICEITA-BRIITA-FRI
LTU-KAUNEZ-AUCPOL-TAR
POL-WARRUS-MOSRUS-NOVSPA-CAT
SWE-GOTSWE-NSW
SWI-SWIUNK-BELUNK-GLAUSA-STA
YUG-NOS
0 20 40 60 80 100
Percentage of beta blocker use in two time periods
Women
*
Notes in italics are repeated to help random browsers—
systematic readers should ignore them
1. See background notes at the beginning of this section, for
G57 and G58, numbered 1–5.
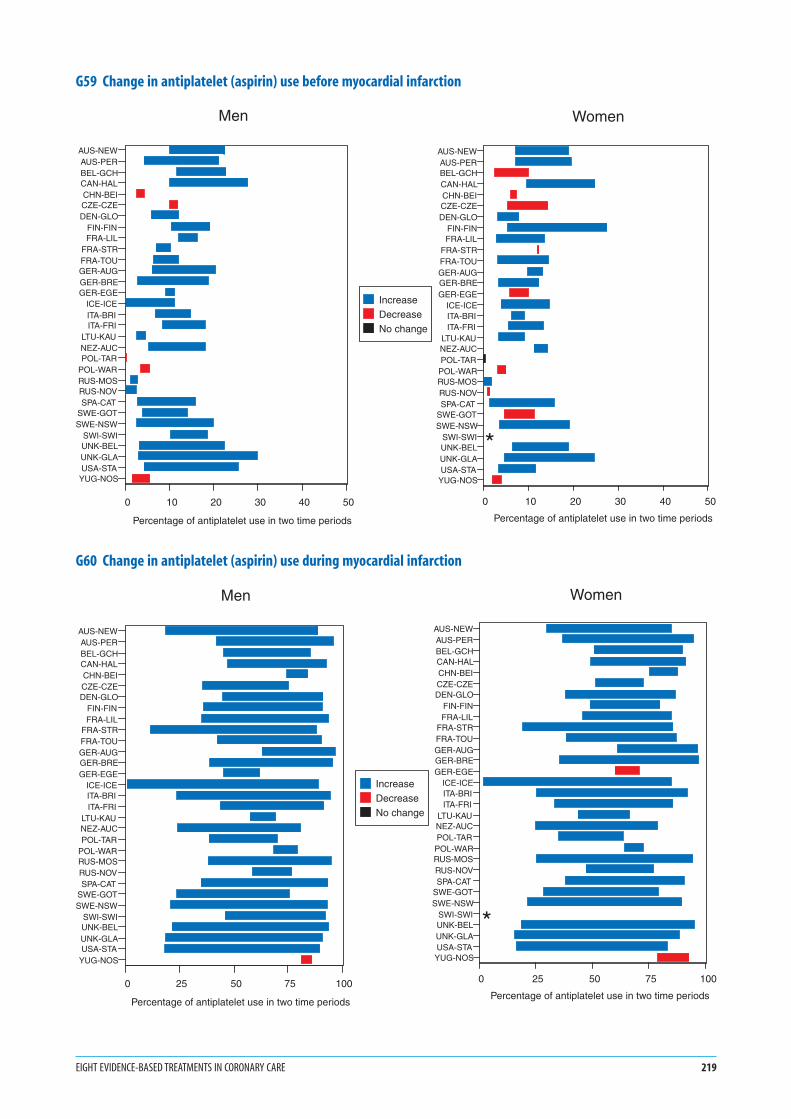
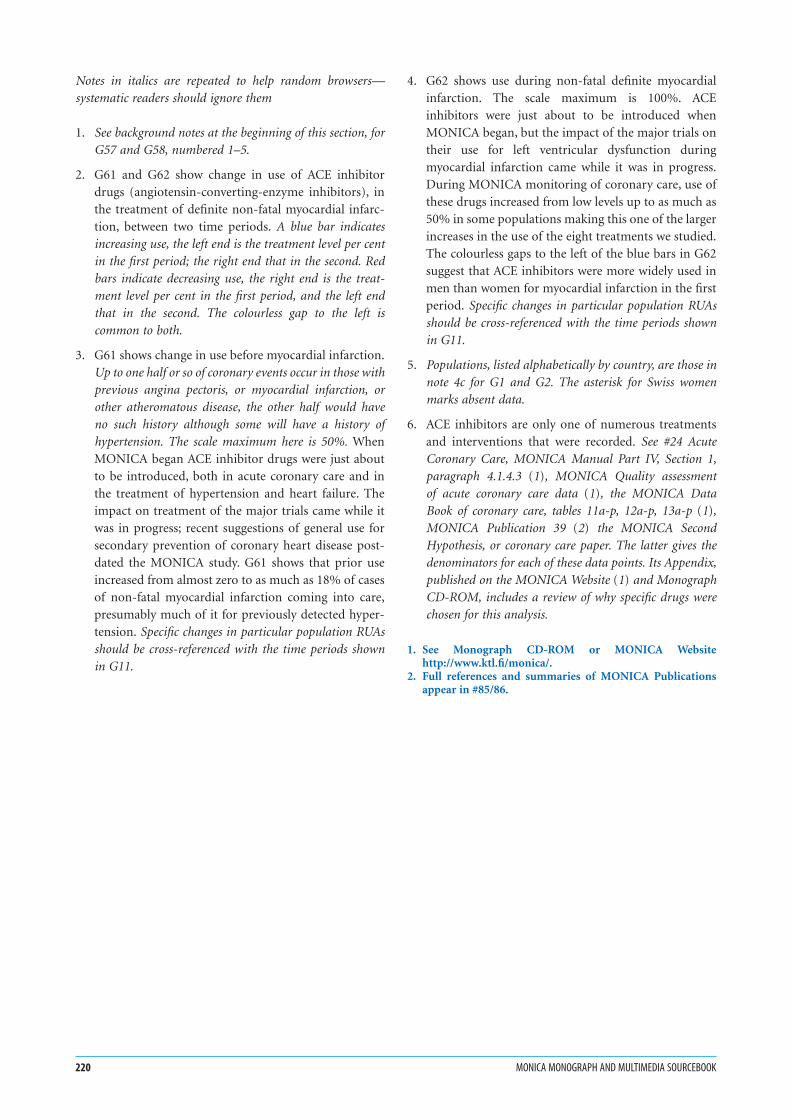
2. G59 and G60 show change in use of antiplatelet drugs,
(usually aspirin), in the treatment of definite non-fatal
myocardial infarction, between two time periods. A
blue bar indicates increasing use, the left end is the treat-
ment level per cent in the first period; the right end that
in the second. Red bars indicate decreasing use, the right
end is the treatment level per cent in the first period, and
the left end that in the second. The colourless gap to the
left is common to both.
3. G59 shows change in use before myocardial infarction.
Up to one half or so of coronary events occur in those with
previous angina pectoris, or myocardial infarction, stroke
or peripheral vascular disease in which prior treatment
might be expected. The other half would have no such
history so the scale maximum is 50%. Antiplatelet drugs
were being introduced when MONICA began, both in
acute care and in secondary prevention, but the impact
on treatment of the major trials came while it was in
progress. G59 shows that prior use was found to have
increased to up to 30% of cases of non-fatal myocar-
dial infarction coming into care. Specific changes in
particular population RUAs should be cross-referenced
with the time periods shown in G1 (1).
4. G60 shows use during non-fatal definite myocardial
infarction. The scale maximum is 100%. Antiplatelet
drugs were being introduced when MONICA began,
both in acute care and in secondary prevention, but the
impact of the major trials came while it was in progress.
During MONICA monitoring of coronary care usage
of these drugs increased by 70% in some populations
making this the largest increase in use of any of the
treatments we studied. Specific changes in particular
population RUAs should be cross-referenced with the time
periods shown in G1 (1).
5. Populations, listed alphabetically by country, are those in
note 4c for G1 and G2. The asterisk for Swiss women
marks absent data.
6. Antiplatelet drugs are only one of numerous treat-
ments and interventions that were recorded. See #24
Acute Coronary Care, MONICA Manual Part IV, Section
1, paragraph 4.1.4.3 (1), MONICA Quality assessment
of acute coronary care data (1), the MONICA Data
Book of coronary care, tables 11a-p, 12a-p, 13a-p (1),
MONICA Publication 39 (2) the MONICA Second
Hypothesis, or coronary care paper. The latter gives the
denominators for each of these data points. Its Appendix,
published on the MONICA Website (1) and Monograph
CD-ROM, includes a review of why specific drugs were
chosen for this analysis.
1. See Monograph CD-ROM or MONICA Websitehttp://www.ktl.fi/monica/.
2. Full references and summaries of MONICA Publicationsappear in #85/86.
218 MONICA MONOGRAPH AND MULTIMEDIA SOURCEBOOK
G59 Change in antiplatelet (aspirin) use before myocardial infarction
G60 Change in antiplatelet (aspirin) use during myocardial infarction
EIGHT EVIDENCE-BASED TREATMENTS IN CORONARY CARE 219
AUS-NEWAUS-PERBEL-GCHCAN-HALCHN-BEICZE-CZEDEN-GLO
FIN-FINFRA-LIL
FRA-STRFRA-TOUGER-AUGGER-BREGER-EGE
ICE-ICEITA-BRIITA-FRI
LTU-KAUNEZ-AUCPOL-TAR
POL-WARRUS-MOSRUS-NOVSPA-CAT
SWE-GOTSWE-NSW
SWI-SWIUNK-BELUNK-GLAUSA-STA
YUG-NOS
0 10 20 30 40 50
Percentage of antiplatelet use in two time periods
IncreaseDecreaseNo change
Men
AUS-NEWAUS-PERBEL-GCHCAN-HALCHN-BEICZE-CZEDEN-GLO
FIN-FINFRA-LIL
FRA-STRFRA-TOUGER-AUGGER-BREGER-EGE
ICE-ICEITA-BRIITA-FRI
LTU-KAUNEZ-AUCPOL-TAR
POL-WARRUS-MOSRUS-NOVSPA-CAT
SWE-GOTSWE-NSW
SWI-SWIUNK-BELUNK-GLAUSA-STA
YUG-NOS
0 10 20 30 40 50
Percentage of antiplatelet use in two time periods
Women
*
AUS-NEWAUS-PERBEL-GCHCAN-HALCHN-BEICZE-CZEDEN-GLO
FIN-FINFRA-LIL
FRA-STRFRA-TOUGER-AUGGER-BREGER-EGE
ICE-ICEITA-BRIITA-FRI
LTU-KAUNEZ-AUCPOL-TAR
POL-WARRUS-MOSRUS-NOVSPA-CAT
SWE-GOTSWE-NSW
SWI-SWIUNK-BELUNK-GLAUSA-STA
YUG-NOS
0 25 50 75 100
Percentage of antiplatelet use in two time periods
IncreaseDecreaseNo change
Men
AUS-NEWAUS-PERBEL-GCHCAN-HALCHN-BEICZE-CZEDEN-GLO
FIN-FINFRA-LIL
FRA-STRFRA-TOUGER-AUGGER-BREGER-EGE
ICE-ICEITA-BRIITA-FRI
LTU-KAUNEZ-AUCPOL-TARPOL-WARRUS-MOSRUS-NOVSPA-CAT
SWE-GOTSWE-NSW
SWI-SWIUNK-BELUNK-GLAUSA-STAYUG-NOS
0 25 50 75 100
Percentage of antiplatelet use in two time periods
Women
*
Notes in italics are repeated to help random browsers—
systematic readers should ignore them
1. See background notes at the beginning of this section, for
G57 and G58, numbered 1–5.
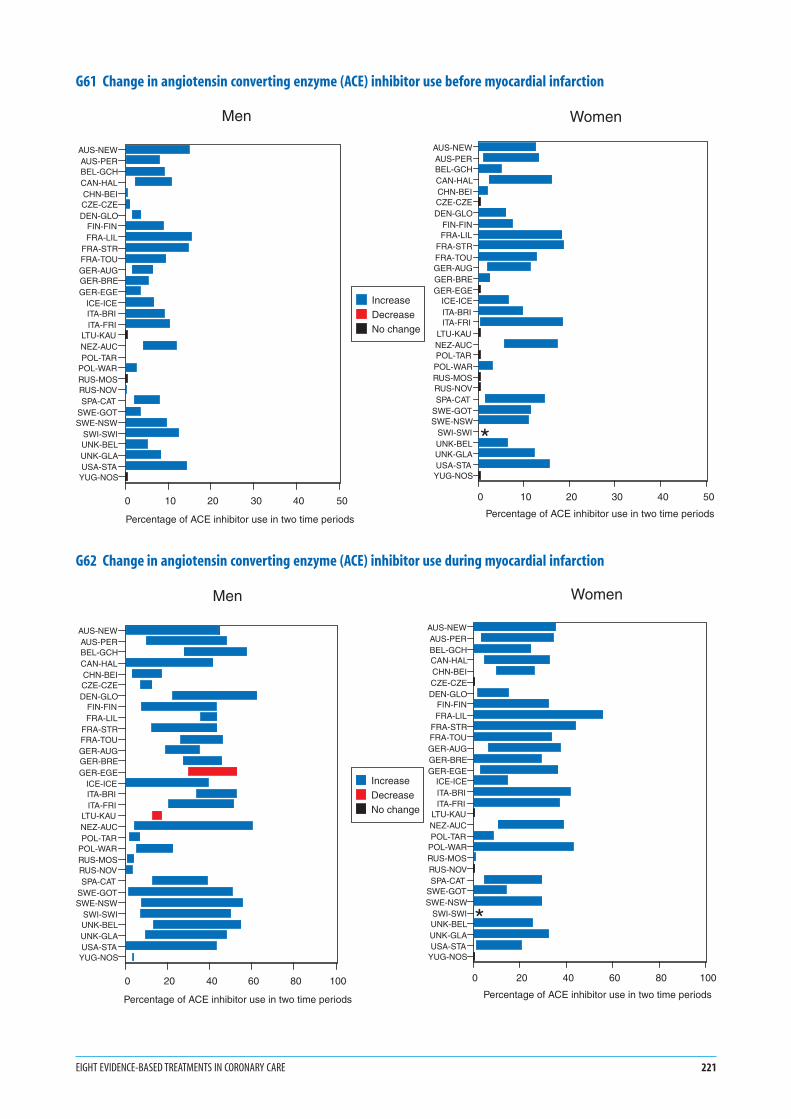
2. G61 and G62 show change in use of ACE inhibitor
drugs (angiotensin-converting-enzyme inhibitors), in
the treatment of definite non-fatal myocardial infarc-
tion, between two time periods. A blue bar indicates
increasing use, the left end is the treatment level per cent
in the first period; the right end that in the second. Red
bars indicate decreasing use, the right end is the treat-
ment level per cent in the first period, and the left end
that in the second. The colourless gap to the left is
common to both.
3. G61 shows change in use before myocardial infarction.
Up to one half or so of coronary events occur in those with
previous angina pectoris, or myocardial infarction, or
other atheromatous disease, the other half would have
no such history although some will have a history of
hypertension. The scale maximum here is 50%. When
MONICA began ACE inhibitor drugs were just about
to be introduced, both in acute coronary care and in
the treatment of hypertension and heart failure. The
impact on treatment of the major trials came while it
was in progress; recent suggestions of general use for
secondary prevention of coronary heart disease post-
dated the MONICA study. G61 shows that prior use
increased from almost zero to as much as 18% of cases
of non-fatal myocardial infarction coming into care,
presumably much of it for previously detected hyper-
tension. Specific changes in particular population RUAs
should be cross-referenced with the time periods shown
in G11.
4. G62 shows use during non-fatal definite myocardial
infarction. The scale maximum is 100%. ACE
inhibitors were just about to be introduced when
MONICA began, but the impact of the major trials on
their use for left ventricular dysfunction during
myocardial infarction came while it was in progress.
During MONICA monitoring of coronary care, use of
these drugs increased from low levels up to as much as
50% in some populations making this one of the larger
increases in the use of the eight treatments we studied.
The colourless gaps to the left of the blue bars in G62
suggest that ACE inhibitors were more widely used in
men than women for myocardial infarction in the first
period. Specific changes in particular population RUAs
should be cross-referenced with the time periods shown
in G11.
5. Populations, listed alphabetically by country, are those in
note 4c for G1 and G2. The asterisk for Swiss women
marks absent data.
6. ACE inhibitors are only one of numerous treatments
and interventions that were recorded. See #24 Acute
Coronary Care, MONICA Manual Part IV, Section 1,
paragraph 4.1.4.3 (1), MONICA Quality assessment
of acute coronary care data (1), the MONICA Data
Book of coronary care, tables 11a-p, 12a-p, 13a-p (1),
MONICA Publication 39 (2) the MONICA Second
Hypothesis, or coronary care paper. The latter gives the
denominators for each of these data points. Its Appendix,
published on the MONICA Website (1) and Monograph
CD-ROM, includes a review of why specific drugs were
chosen for this analysis.
1. See Monograph CD-ROM or MONICA Websitehttp://www.ktl.fi/monica/.
2. Full references and summaries of MONICA Publicationsappear in #85/86.
220 MONICA MONOGRAPH AND MULTIMEDIA SOURCEBOOK
G61 Change in angiotensin converting enzyme (ACE) inhibitor use before myocardial infarction
G62 Change in angiotensin converting enzyme (ACE) inhibitor use during myocardial infarction
EIGHT EVIDENCE-BASED TREATMENTS IN CORONARY CARE 221
AUS-NEWAUS-PERBEL-GCHCAN-HALCHN-BEICZE-CZEDEN-GLO
FIN-FINFRA-LIL
FRA-STRFRA-TOUGER-AUGGER-BREGER-EGE
ICE-ICEITA-BRIITA-FRI
LTU-KAUNEZ-AUCPOL-TAR
POL-WARRUS-MOSRUS-NOVSPA-CAT
SWE-GOTSWE-NSW
SWI-SWIUNK-BELUNK-GLAUSA-STA
YUG-NOS
0 10 20 30 40 50
Percentage of ACE inhibitor use in two time periods
IncreaseDecreaseNo change
Men
AUS-NEWAUS-PERBEL-GCHCAN-HALCHN-BEICZE-CZEDEN-GLO
FIN-FINFRA-LIL
FRA-STRFRA-TOUGER-AUGGER-BREGER-EGE
ICE-ICEITA-BRIITA-FRI
LTU-KAUNEZ-AUCPOL-TARPOL-WARRUS-MOSRUS-NOVSPA-CAT
SWE-GOTSWE-NSW
SWI-SWIUNK-BELUNK-GLAUSA-STAYUG-NOS
0 10 20 30 40 50
Percentage of ACE inhibitor use in two time periods
Women
*
AUS-NEWAUS-PERBEL-GCHCAN-HALCHN-BEICZE-CZEDEN-GLO
FIN-FINFRA-LIL
FRA-STRFRA-TOUGER-AUGGER-BREGER-EGE
ICE-ICEITA-BRIITA-FRI
LTU-KAUNEZ-AUCPOL-TAR
POL-WARRUS-MOSRUS-NOVSPA-CAT
SWE-GOTSWE-NSW
SWI-SWIUNK-BELUNK-GLAUSA-STA
YUG-NOS
0 20 40 60 80 100
Percentage of ACE inhibitor use in two time periods
IncreaseDecreaseNo change
Men
AUS-NEWAUS-PERBEL-GCHCAN-HALCHN-BEICZE-CZEDEN-GLO
FIN-FINFRA-LIL
FRA-STRFRA-TOUGER-AUGGER-BREGER-EGE
ICE-ICEITA-BRIITA-FRI
LTU-KAUNEZ-AUCPOL-TAR
POL-WARRUS-MOSRUS-NOVSPA-CAT
SWE-GOTSWE-NSW
SWI-SWIUNK-BELUNK-GLAUSA-STA
YUG-NOS
0 20 40 60 80 100
Percentage of ACE inhibitor use in two time periods
Women
*

Notes in italics are repeated to help random browsers—
systematic readers should ignore them
1. See background notes at the beginning of this section, for
G57 and G58, numbered 1–5.
2. G63 shows change in prior coronary artery revascular-
ization and G64, change in use of thrombolytic therapy
in the acute treatment of definite non-fatal myocardial
infarction between two time periods. A blue bar indi-
cates increasing use, the left end is the treatment level per
cent in the first period; the right end that in the second.
Red bars indicate decreasing use, the right end is the
treatment level per cent in the first period; the left end
that in the second. The colourless gap to the left is
common to both.
3. G63 shows coronary artery revascularization proce-
dures any time before the myocardial infarction being
considered. Up to one half of coronary events occur in
those with previous angina pectoris, or myocardial
infarction, in which prior procedures might be
expected. The other half would have no previous
history of coronary heart disease. The scale maximum
is 50%. Coronary artery bypass surgery was long estab-
lished when MONICA began, but not common in most
MONICA populations. It was supplemented by coro-
nary angioplasty more recently. Prevalence of prior
procedures in victims of heart attack is questionable as
a measure of the use of such procedures in the general
population, but it was the only measure available in the
core data for MONICA. See #18 Health Services. G63
shows low prevalence in most populations and consid-
erable disparities, but a net increase over time in the
majority. Specific changes in particular population RUAs
should be cross-referenced with the time periods shown
in G11.
4. G64 shows use of thrombolytic drugs during non-fatal
myocardial infarction. The scale maximum is 100%.
Thrombolytic therapy was part of the coronary care
revolution, occurring while MONICA was monitoring
change. G64 shows a major increase in usage, not quite
as much as for antiplatelet drugs, but from a lower
level, in many populations. There is marked hetero-
geneity between populations, unlike antiplatelet drugs,
perhaps reflecting the financial cost, and the complex-
ity of administration, compared with aspirin. Specific
changes in particular population RUAs should be cross-
referenced with the time periods shown in G11.
5. Populations, listed alphabetically by country, are those in
note 4c for G1 and G2. The asterisk for Swiss women
marks absent data.
6. These are only two of numerous treatments and inter-
ventions that were recorded. See #24 Acute Coronary
Care, MONICA Manual Part IV, Section 1, paragraph
4.1.4.3 (1), MONICA Quality assessment of acute coro-
nary care data (1), the MONICA Data Book of coronary
care, tables 11a-p, 12a-p, 13a-p (1), MONICA Publica-
tion 39 (2) the MONICA Second Hypothesis, or coronary
care paper. The latter gives the denominators for each
of these data points. Its Appendix, published on the
MONICA Website (1) and Monograph CD-ROM,
includes a review of why specific drugs were chosen for
this analysis.
1. See Monograph CD-ROM or MONICA Websitehttp://www.ktl.fi/monica/.
2. Full references and summaries of MONICA Publicationsappear in #85/86.
222 MONICA MONOGRAPH AND MULTIMEDIA SOURCEBOOK

G63 Change in coronary artery revascularization (bypass graft or angioplasty) before myocardial infarction
G64 Change in thrombolytic drug use during myocardial infarction
EIGHT EVIDENCE-BASED TREATMENTS IN CORONARY CARE 223
AUS-NEWAUS-PERBEL-GCHCAN-HALCHN-BEICZE-CZEDEN-GLO
FIN-FINFRA-LIL
FRA-STRFRA-TOUGER-AUGGER-BREGER-EGE
ICE-ICEITA-BRIITA-FRI
LTU-KAUNEZ-AUCPOL-TAR
POL-WARRUS-MOSRUS-NOVSPA-CAT
SWE-GOTSWE-NSW
SWI-SWIUNK-BELUNK-GLAUSA-STA
YUG-NOS
0 10 20 30 40 50
Percentage prior revascularization in two time periods
IncreaseDecreaseNo change
Men
AUS-NEWAUS-PERBEL-GCHCAN-HALCHN-BEICZE-CZEDEN-GLO
FIN-FINFRA-LIL
FRA-STRFRA-TOUGER-AUGGER-BREGER-EGE
ICE-ICEITA-BRIITA-FRI
LTU-KAUNEZ-AUCPOL-TARPOL-WARRUS-MOSRUS-NOVSPA-CAT
SWE-GOTSWE-NSW
SWI-SWIUNK-BELUNK-GLAUSA-STAYUG-NOS
0 10 20 30 40 50
Percentage prior revascularization in two time periods
Women
*
AUS-NEWAUS-PERBEL-GCHCAN-HALCHN-BEICZE-CZEDEN-GLO
FIN-FINFRA-LIL
FRA-STRFRA-TOUGER-AUGGER-BREGER-EGE
ICE-ICEITA-BRIITA-FRI
LTU-KAUNEZ-AUCPOL-TAR
POL-WARRUS-MOSRUS-NOVSPA-CAT
SWE-GOTSWE-NSW
SWI-SWIUNK-BELUNK-GLAUSA-STA
YUG-NOS
0 20 40 60 80 100
Percentage of thrombolytic drug use in two time periods
IncreaseDecreaseNo change
Men
AUS-NEWAUS-PERBEL-GCHCAN-HALCHN-BEICZE-CZEDEN-GLO
FIN-FINFRA-LIL
FRA-STRFRA-TOUGER-AUGGER-BREGER-EGE
ICE-ICEITA-BRIITA-FRI
LTU-KAUNEZ-AUCPOL-TAR
POL-WARRUS-MOSRUS-NOVSPA-CAT
SWE-GOTSWE-NSW
SWI-SWIUNK-BELUNK-GLAUSA-STA
YUG-NOS
0 20 40 60 80 100
Percentage of thrombolytic drug use in two time periods
Women
*
1. In order to test the Second or coronary care Hypothe-
sis, MONICA needed an index of coronary care
equivalent to the risk-factor score used in the First
Hypothesis.
2. The manuscript group was divided between those pro-
moting a sophisticated score, incorporating carefully
judged weightings of each component (Weighted
Treatment Score), and those who wanted a simple
pragmatic score reflecting implementation of
evidence-based treatments (Equivalent Treatment
Score). See #25 Treatment scores, and MONICA
Publication 39 (2) Appendix. (1).
3. Both were tested. A strong correlation was found. The
Weighted Treatment Score was strongly affected by one
component, because of the heavy weighting given to it,
prior coronary artery revascularization procedures (see
G63). The simpler score was adopted.
4. The Equivalent Treatment Score, is simply one eighth
of the sum of all eight of the treatments per cent,
shown in G56 to G64. Three drug groups, beta-
blockers, antiplatelet, and ACE-inhibitors, score twice
each, once for use before the onset of myocardial
infarction, and once for use afterwards. Treatments at
hospital discharge were not included in the score but
would have been very highly correlated with use in the
event.
5. The Equivalent Treatment Score has the greatest con-
tribution from treatments that changed most, in
absolute percentage terms, between the two coronary
care periods in MONICA. The leader was antiplatelet
drugs (aspirin), during the attack (see G60).
6. G65 shows populations listed alphabetically by
country, as in previous treatment graphs. The asterisk
for Swiss women indicates missing data. G66 shows
their ranking by change between the two coronary care
periods, as in earlier formats.
7. Note that maximum change in G65, giving a high rank
in G66 implies a low start and a high finish point.
Populations could rank highly for either or both of
these reasons. The actual finishing score was similar in
many populations, some of which started with a high
score, and therefore ranked only for moderate change.
G65 needs to be studied with G11, and with MONICA
Publication 39 (2), which tabulates numbers and time
periods precisely. Differences in population RUAs with
high finishing scores from other treatments were often
influenced by discrepancies in their use of beta-block-
ers during infarction in the second period (see G58).
8. Inequality of coronary care periods and the distance
between them inhibit simple comparison of the rate of
introduction of new therapies. It did not affect the
testing of the coronary care hypothesis because end-
point changes were compared for similar periods. See
later section, G77.
9. The rate of introduction of different therapies can be
compared using the MONICA Data Book of coronary
care tables 11, 12, 13 (1). Treatments tended to be intro-
duced fairly rapidly in a non-linear manner. Only a
minority of populations, however, have treatment data
for all their years of registration. Years are grouped in
the Data Book.
10. Graphs here and the tables in MONICA Data Book on
coronary care, tables 11a-p, 12a-p, 13a-p and in
MONICA Publication 39 (2), show no significant sex
bias in the use of evidence-based medication in defi-
nite myocardial infarction in the MONICA population
RUAs over the decade that was studied. This is despite
widespread reporting in the literature of the existence
of such a problem. This question is being analysed
in a paper being prepared at the same time as this
Monograph.
11. Further papers on coronary care are in preparation at
the time of writing the Monograph. They will be listed
on the MONICA Website as they appear (1).
1. See Monograph CD-ROM or MONICA Websitehttp://www.ktl.fi/monica/.
2. Full references and summaries of MONICA Publicationsappear in #85/86.
224 MONICA MONOGRAPH AND MULTIMEDIA SOURCEBOOK
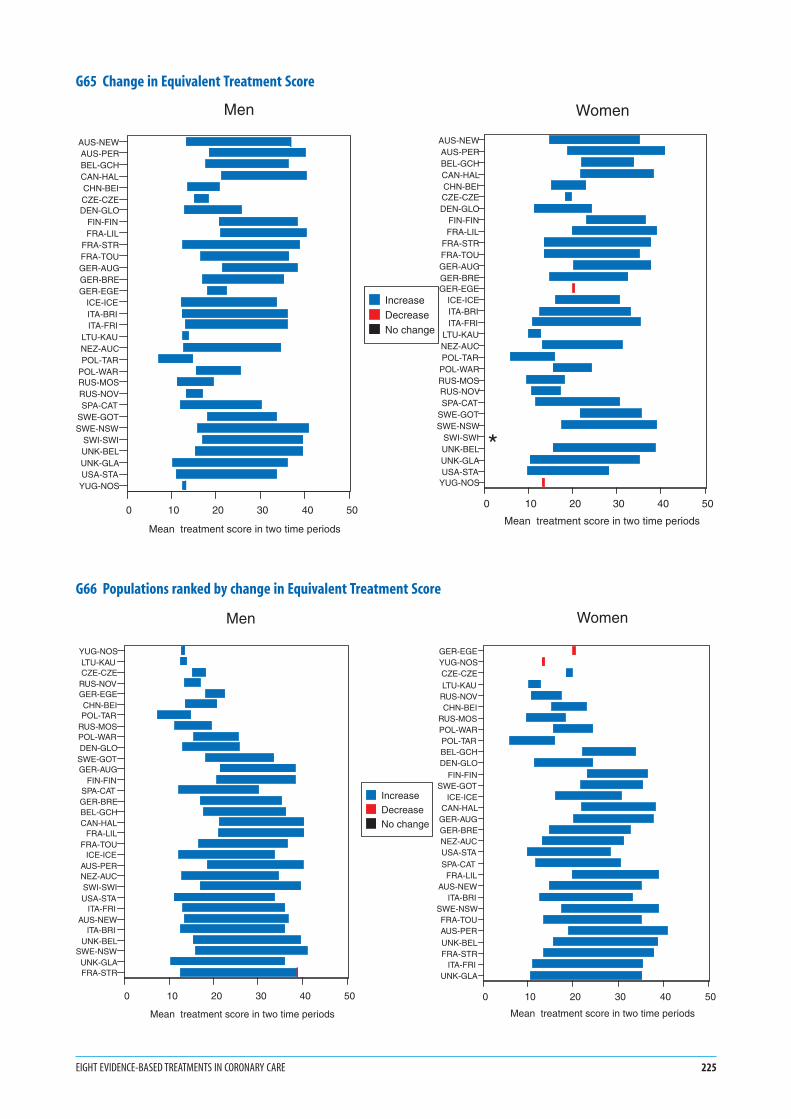
G65 Change in Equivalent Treatment Score
G66 Populations ranked by change in Equivalent Treatment Score
EIGHT EVIDENCE-BASED TREATMENTS IN CORONARY CARE 225
AUS-NEWAUS-PERBEL-GCHCAN-HALCHN-BEICZE-CZEDEN-GLO
FIN-FINFRA-LIL
FRA-STRFRA-TOUGER-AUGGER-BREGER-EGE
ICE-ICEITA-BRIITA-FRI
LTU-KAUNEZ-AUCPOL-TAR
POL-WARRUS-MOSRUS-NOVSPA-CAT
SWE-GOTSWE-NSW
SWI-SWIUNK-BELUNK-GLAUSA-STA
YUG-NOS
0 10 20 30 40 50
Mean treatment score in two time periods
IncreaseDecreaseNo change
Men
AUS-NEWAUS-PERBEL-GCHCAN-HALCHN-BEICZE-CZEDEN-GLO
FIN-FINFRA-LIL
FRA-STRFRA-TOUGER-AUGGER-BREGER-EGE
ICE-ICEITA-BRIITA-FRI
LTU-KAUNEZ-AUCPOL-TAR
POL-WARRUS-MOSRUS-NOVSPA-CAT
SWE-GOTSWE-NSW
SWI-SWIUNK-BELUNK-GLAUSA-STA
YUG-NOS
0 10 20 30 40 50
Mean treatment score in two time periods
Women
*
YUG-NOSLTU-KAUCZE-CZE
RUS-NOVGER-EGECHN-BEIPOL-TAR
RUS-MOSPOL-WARDEN-GLO
SWE-GOTGER-AUG
FIN-FINSPA-CATGER-BREBEL-GCHCAN-HAL
FRA-LILFRA-TOU
ICE-ICEAUS-PERNEZ-AUCSWI-SWIUSA-STA
ITA-FRIAUS-NEW
ITA-BRIUNK-BEL
SWE-NSWUNK-GLAFRA-STR
0 10 20 30 40 50
Mean treatment score in two time periods
IncreaseDecreaseNo change
Men
GER-EGEYUG-NOSCZE-CZELTU-KAU
RUS-NOVCHN-BEI
RUS-MOSPOL-WARPOL-TARBEL-GCHDEN-GLO
FIN-FINSWE-GOT
ICE-ICECAN-HAL
GER-AUGGER-BRENEZ-AUCUSA-STASPA-CAT
FRA-LILAUS-NEW
ITA-BRISWE-NSWFRA-TOUAUS-PERUNK-BELFRA-STR
ITA-FRIUNK-GLA
0 10 20 30 40 50
Mean treatment score in two time periods
Women

G671. These scatter plots are part of the procedures for testing
MONICA findings to see if they are likely to be
genuine, or unduly influenced by variations in data
quality.
2. A data quality score for coronary care was derived from
a number of items. See #12 Quality Assurance,
MONICA Quality assessment of acute coronary care
data, (1) MONICA Publication 39 (2), Appendix (1),
(published on MONICA Website and on the Mono-
graph CD-ROM). Such items included the frequency
with which coronary care records were missing when
they should have been completed, and the frequency
with which data were coded as not known, along with
other items. The acute coronary care quality score is the
same for both sexes in each population RUA.
3. Changes in treatments during the MONICA study
period were very large in relation to possible sources of
error.
4. Both the greatest and the least changes in Equivalent
Treatment Score occurred in populations with high
scores for data quality. There were few poor scores for
data quality. These were associated with the middle
range of treatment changes.
5. It is therefore unlikely that MONICA findings on coro-
nary care are significantly affected by data quality.
G686. This shows the geographical distribution of changes
in the Equivalent Treatment Score. Large treatment
changes are shown in blue while modest ones are
shown in red. There is a more striking geographical
polarization of results than for any of the previous
MONICA spot maps.
7. The previous warning, that unequal periods and dif-
ferent times are being compared, is still true. Examina-
tion of G11 however, shows that while a late first
coronary care recording period and early second
period does apply to some red spot populations (in
Germany-East Germany, GER-EGE, #65, they were
close together) it does not apply to most. The geo-
graphical polarization is therefore real.
8. The polarization of results does raise problems for
interpretation of the coronary care hypothesis (see
later). If populations are clustered together, can they be
considered independent in terms of statistical testing?
What else might be happening? See discussion in
MONICA Publication 39 (2).
1. See Monograph CD-ROM or MONICA Websitehttp://www.ktl.fi/monica/.
2. Full references and summaries of MONICA Publicationsappear in #85/86.
226 MONICA MONOGRAPH AND MULTIMEDIA SOURCEBOOK
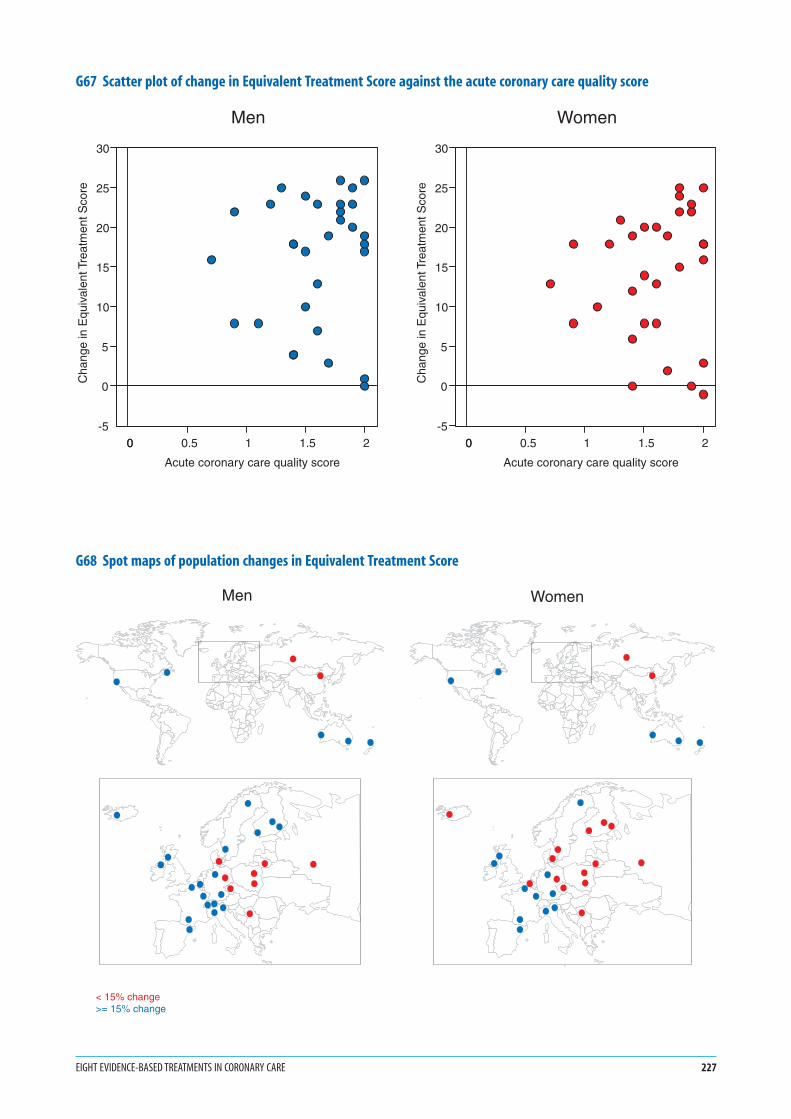
G67 Scatter plot of change in Equivalent Treatment Score against the acute coronary care quality score
G68 Spot maps of population changes in Equivalent Treatment Score
EIGHT EVIDENCE-BASED TREATMENTS IN CORONARY CARE 227
0 0.5 1 1.5 20
Acute coronary care quality score
-5
0
5
10
15
20
25
30
Cha
nge
in E
quiv
alen
t Tre
atm
ent S
core
Men
0 0.5 1 1.5 20
Acute coronary care quality score
-5
0
5
10
15
20
25
30
Cha
nge
in E
quiv
alen
t Tre
atm
ent S
core
Women
Men Women
< 15% change >= 15% change
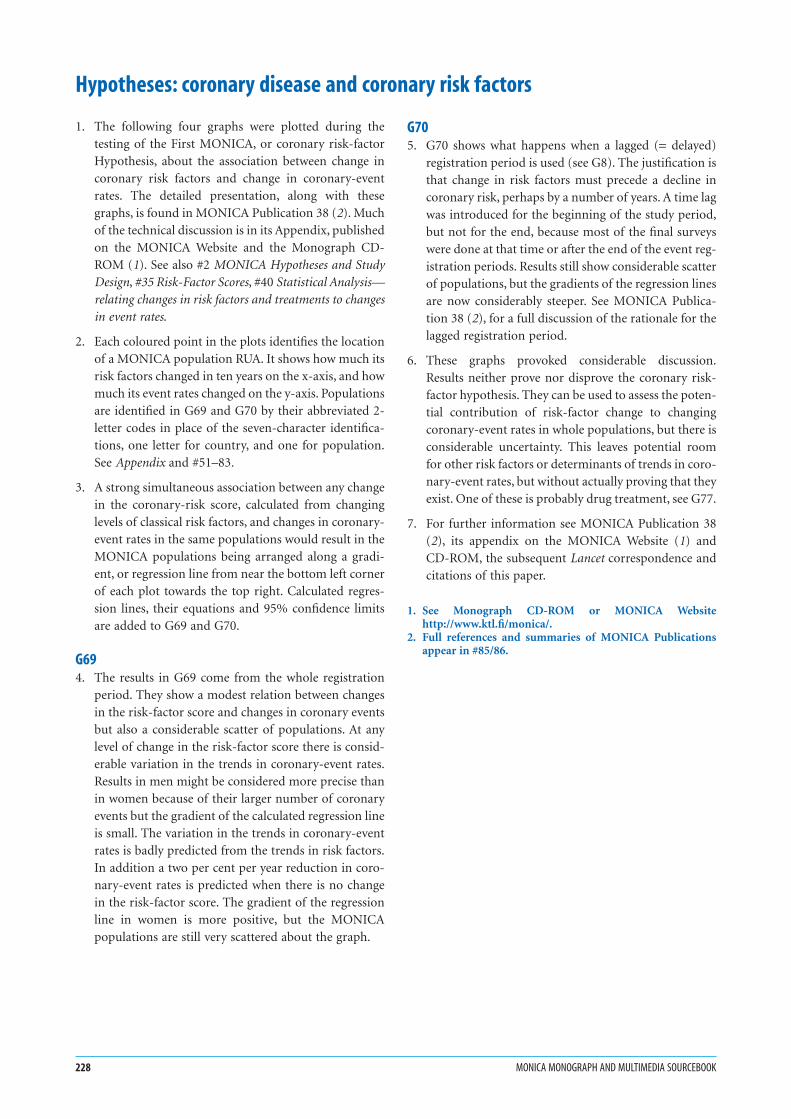
1. The following four graphs were plotted during the
testing of the First MONICA, or coronary risk-factor
Hypothesis, about the association between change in
coronary risk factors and change in coronary-event
rates. The detailed presentation, along with these
graphs, is found in MONICA Publication 38 (2). Much
of the technical discussion is in its Appendix, published
on the MONICA Website and the Monograph CD-
ROM (1). See also #2 MONICA Hypotheses and Study
Design, #35 Risk-Factor Scores, #40 Statistical Analysis—
relating changes in risk factors and treatments to changes
in event rates.
2. Each coloured point in the plots identifies the location
of a MONICA population RUA. It shows how much its
risk factors changed in ten years on the x-axis, and how
much its event rates changed on the y-axis. Populations
are identified in G69 and G70 by their abbreviated 2-
letter codes in place of the seven-character identifica-
tions, one letter for country, and one for population.
See Appendix and #51–83.
3. A strong simultaneous association between any change
in the coronary-risk score, calculated from changing
levels of classical risk factors, and changes in coronary-
event rates in the same populations would result in the
MONICA populations being arranged along a gradi-
ent, or regression line from near the bottom left corner
of each plot towards the top right. Calculated regres-
sion lines, their equations and 95% confidence limits
are added to G69 and G70.
G694. The results in G69 come from the whole registration
period. They show a modest relation between changes
in the risk-factor score and changes in coronary events
but also a considerable scatter of populations. At any
level of change in the risk-factor score there is consid-
erable variation in the trends in coronary-event rates.
Results in men might be considered more precise than
in women because of their larger number of coronary
events but the gradient of the calculated regression line
is small. The variation in the trends in coronary-event
rates is badly predicted from the trends in risk factors.
In addition a two per cent per year reduction in coro-
nary-event rates is predicted when there is no change
in the risk-factor score. The gradient of the regression
line in women is more positive, but the MONICA
populations are still very scattered about the graph.
G705. G70 shows what happens when a lagged (= delayed)
registration period is used (see G8). The justification is
that change in risk factors must precede a decline in
coronary risk, perhaps by a number of years. A time lag
was introduced for the beginning of the study period,
but not for the end, because most of the final surveys
were done at that time or after the end of the event reg-
istration periods. Results still show considerable scatter
of populations, but the gradients of the regression lines
are now considerably steeper. See MONICA Publica-
tion 38 (2), for a full discussion of the rationale for the
lagged registration period.
6. These graphs provoked considerable discussion.
Results neither prove nor disprove the coronary risk-
factor hypothesis. They can be used to assess the poten-
tial contribution of risk-factor change to changing
coronary-event rates in whole populations, but there is
considerable uncertainty. This leaves potential room
for other risk factors or determinants of trends in coro-
nary-event rates, but without actually proving that they
exist. One of these is probably drug treatment, see G77.
7. For further information see MONICA Publication 38
(2), its appendix on the MONICA Website (1) and
CD-ROM, the subsequent Lancet correspondence and
citations of this paper.
1. See Monograph CD-ROM or MONICA Websitehttp://www.ktl.fi/monica/.
2. Full references and summaries of MONICA Publicationsappear in #85/86.
228 MONICA MONOGRAPH AND MULTIMEDIA SOURCEBOOK
Hypotheses: coronary disease and coronary risk factors
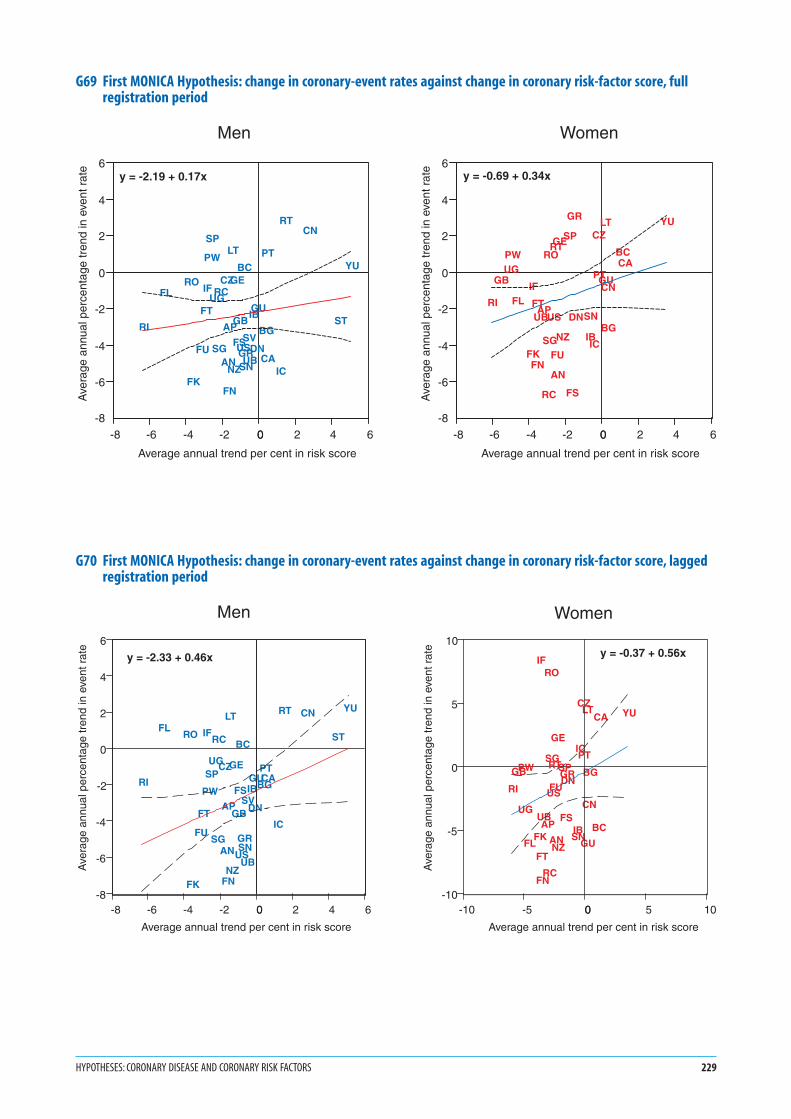
G69 First MONICA Hypothesis: change in coronary-event rates against change in coronary risk-factor score, fullregistration period
G70 First MONICA Hypothesis: change in coronary-event rates against change in coronary risk-factor score, laggedregistration period
HYPOTHESES: CORONARY DISEASE AND CORONARY RISK FACTORS 229
RI
FLRO
FK
FU
FT
IF
PW
SP
UG
SG
RC
AN
CZ
AP
FN
LT
NZ
GE
GB
FSUS
BC
GRSN
SV
UB
IB
DN
GU
BG
CA
PT
IC
RTCN
ST
YU
-8 -6 -4 -2 0 2 4 60
Average annual trend per cent in risk score
-8
-6
-4
-2
0
2
4
6
Ave
rage
ann
ual p
erce
ntag
e tr
end
in e
vent
rat
e
Men
RI
GBUGPW
FL
FK
IF
FN
FTUBAP
RC
RO
SG
US
RT
FU
AN
GE
NZ
SP
FS
GR
DNSN
IBIC
CZ
PTGU
LT
CN
BG
BCCA
YU
-8 -6 -4 -2 0 2 4 60
Average annual trend per cent in risk score
-8
-6
-4
-2
0
2
4
6
Ave
rage
ann
ual p
erce
ntag
e tr
end
in e
vent
rat
e
Women
y = -2.19 + 0.17x y = -0.69 + 0.34x
RI
FLRO
FK
FU
FT
IF
PW
SPUG
SG
RC
AN
CZ
AP
FN
LT
NZ
GE
GB
FS
US
BC
GRSN
SV
UB
IB
DN
GUBGCAPT
IC
RT CN
ST
YU
-8 -6 -4 -2 0 2 4 60
Average annual trend per cent in risk score
-8
-6
-4
-2
0
2
4
6
Ave
rage
ann
ual p
erce
ntag
e tr
end
in e
vent
rat
e
y = -2.33 + 0.46x
Men
RI
GB
UG
PW
FLFK
IF
FN
FT
UBAP
RC
RO
SG
US
RT
FU
AN
GE
NZ
SP
FS
GRDN
SNIB
IC
CZ
PT
GU
LT
CN
BG
BC
CA YU
-10 -5 0 5 100
Average annual trend per cent in risk score
-10
-5
0
5
10
Ave
rage
ann
ual p
erce
ntag
e tr
end
in e
vent
rat
e y = -0.37 + 0.56x
Women
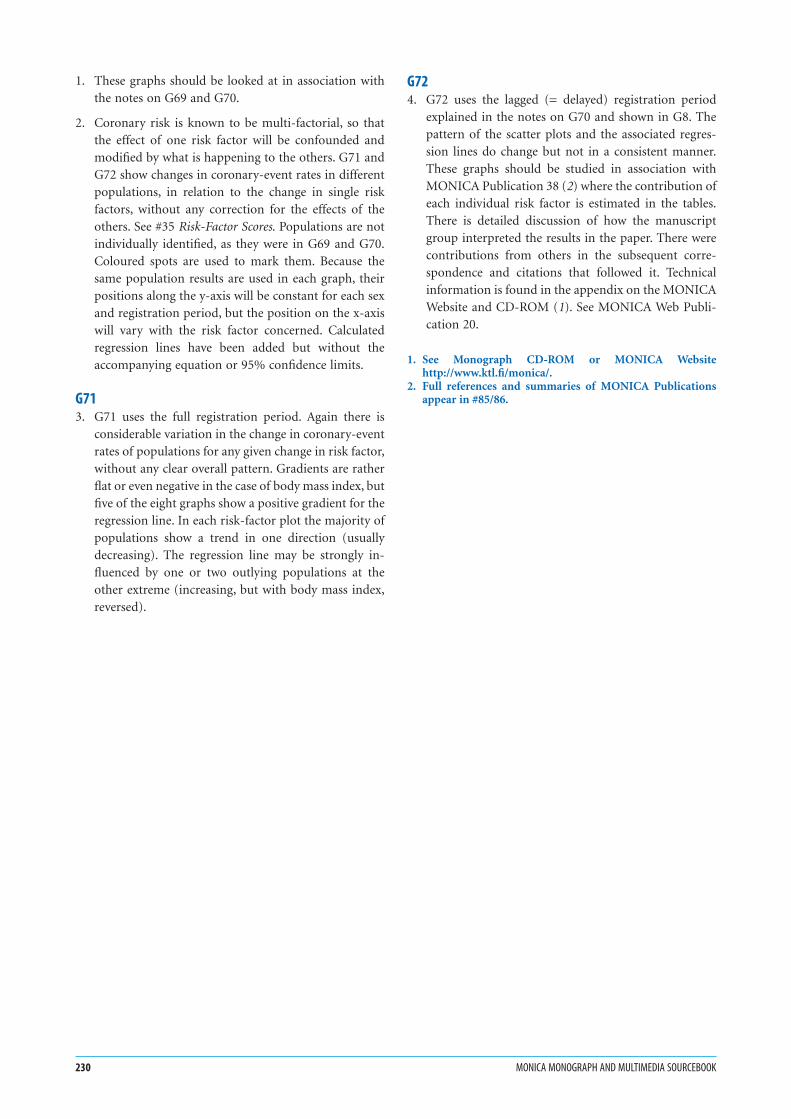
1. These graphs should be looked at in association with
the notes on G69 and G70.
2. Coronary risk is known to be multi-factorial, so that
the effect of one risk factor will be confounded and
modified by what is happening to the others. G71 and
G72 show changes in coronary-event rates in different
populations, in relation to the change in single risk
factors, without any correction for the effects of the
others. See #35 Risk-Factor Scores. Populations are not
individually identified, as they were in G69 and G70.
Coloured spots are used to mark them. Because the
same population results are used in each graph, their
positions along the y-axis will be constant for each sex
and registration period, but the position on the x-axis
will vary with the risk factor concerned. Calculated
regression lines have been added but without the
accompanying equation or 95% confidence limits.
G713. G71 uses the full registration period. Again there is
considerable variation in the change in coronary-event
rates of populations for any given change in risk factor,
without any clear overall pattern. Gradients are rather
flat or even negative in the case of body mass index, but
five of the eight graphs show a positive gradient for the
regression line. In each risk-factor plot the majority of
populations show a trend in one direction (usually
decreasing). The regression line may be strongly in-
fluenced by one or two outlying populations at the
other extreme (increasing, but with body mass index,
reversed).
G724. G72 uses the lagged (= delayed) registration period
explained in the notes on G70 and shown in G8. The
pattern of the scatter plots and the associated regres-
sion lines do change but not in a consistent manner.
These graphs should be studied in association with
MONICA Publication 38 (2) where the contribution of
each individual risk factor is estimated in the tables.
There is detailed discussion of how the manuscript
group interpreted the results in the paper. There were
contributions from others in the subsequent corre-
spondence and citations that followed it. Technical
information is found in the appendix on the MONICA
Website and CD-ROM (1). See MONICA Web Publi-
cation 20.
1. See Monograph CD-ROM or MONICA Websitehttp://www.ktl.fi/monica/.
2. Full references and summaries of MONICA Publicationsappear in #85/86.
230 MONICA MONOGRAPH AND MULTIMEDIA SOURCEBOOK
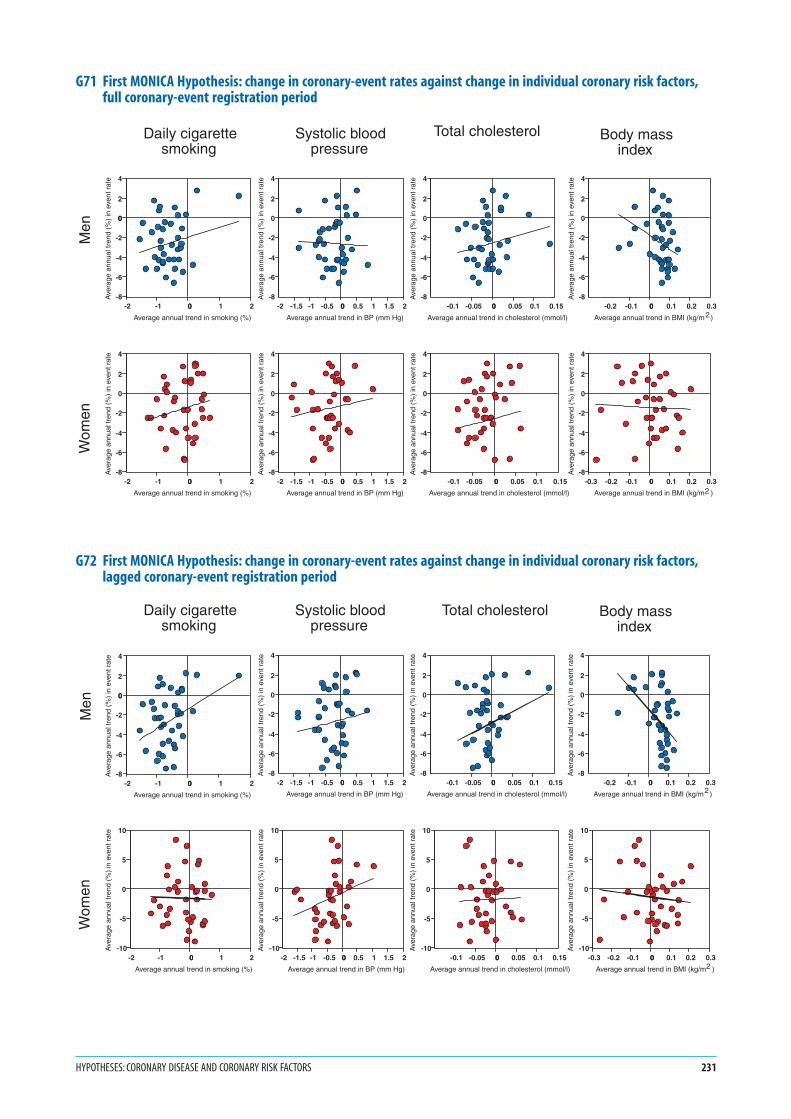
G71 First MONICA Hypothesis: change in coronary-event rates against change in individual coronary risk factors,full coronary-event registration period
G72 First MONICA Hypothesis: change in coronary-event rates against change in individual coronary risk factors,lagged coronary-event registration period
HYPOTHESES: CORONARY DISEASE AND CORONARY RISK FACTORS 231
Men
Wom
en
-2 -1 0 1 20
Average annual trend in smoking (%)
-8
-6
-4
-2
0
2
4
Ave
rage
ann
ual t
rend
(%
) in
eve
nt r
ate
-2 -1 0 1 20
Average annual trend in smoking (%)
-8
-6
-4
-2
0
2
4
0
Ave
rage
ann
ual t
rend
(%
) in
eve
nt r
ate
Daily cigarette smoking
-0.1 -0.05 0 0.05 0.1 0.150
Average annual trend in cholesterol (mmol/l)
-8
-6
-4
-2
0
2
4
Ave
rage
ann
ual t
rend
(%
) in
eve
nt r
ate
-2 -1.5 -1 -0.5 0 0.5 1 1.5 20
Average annual trend in BP (mm Hg)
-8
-6
-4
-2
0
2
4
Ave
rage
ann
ual t
rend
(%
) in
eve
nt r
ate
-0.1 -0.05 0 0.05 0.1 0.150
Average annual trend in cholesterol (mmol/l)
-8
-6
-4
-2
0
2
4
Ave
rage
ann
ual t
rend
(%
) in
eve
nt r
ate
-2 -1.5 -1 -0.5 0 0.5 1 1.5 20
Average annual trend in BP (mm Hg)
-8
-6
-4
-2
0
2
4
Ave
rage
ann
ual t
rend
(%
) in
eve
nt r
ate
Systolic blood pressure
Total cholesterol Body mass index
-0.3 -0.2 -0.1 0 0.1 0.2 0.30
Average annual trend in BMI (kg/m )
-8
-6
-4
-2
0
2
4
Ave
rage
ann
ual t
rend
(%
) in
eve
nt r
ate
2
-0.2 -0.1 0 0.1 0.2 0.30
Average annual trend in BMI (kg/m )
-8
-6
-4
-2
0
2
4
Ave
rage
ann
ual t
rend
(%
) in
eve
nt r
ate
2
Men
Wom
en
-2 -1 0 1 20
Average annual trend in smoking (%)
-10
-5
0
5
10
Ave
rage
ann
ual t
rend
(%
) in
eve
nt r
ate
-2 -1 0 1 20
Average annual trend in smoking (%)
-8
-6
-4
-2
0
2
4
0
Ave
rage
ann
ual t
rend
(%
) in
eve
nt r
ate
Daily cigarette smoking
-0.1 -0.05 0 0.05 0.1 0.150
Average annual trend in cholesterol (mmol/l)
-10
-5
0
5
10
Ave
rage
ann
ual t
rend
(%
) in
eve
nt r
ate
-2 -1.5 -1 -0.5 0 0.5 1 1.5 20
Average annual trend in BP (mm Hg)
-10
-5
0
5
10
Ave
rage
ann
ual t
rend
(%
) in
eve
nt r
ate
-0.1 -0.05 0 0.05 0.1 0.150
Average annual trend in cholesterol (mmol/l)
-8
-6
-4
-2
0
2
4
Ave
rage
ann
ual t
rend
(%
) in
eve
nt r
ate
-2 -1.5 -1 -0.5 0 0.5 1 1.5 20
Average annual trend in BP (mm Hg)
-8
-6
-4
-2
0
2
4
Ave
rage
ann
ual t
rend
(%
) in
eve
nt r
ate
Systolic blood pressure
Total cholesterol Body mass index
-0.3 -0.2 -0.1 0 0.1 0.2 0.30
Average annual trend in BMI (kg/m )
-10
-5
0
5
10
Ave
rage
ann
ual t
rend
(%
) in
eve
nt r
ate
2
-0.2 -0.1 0 0.1 0.2 0.30
Average annual trend in BMI (kg/m )
-8
-6
-4
-2
0
2
4
Ave
rage
ann
ual t
rend
(%
) in
eve
nt r
ate
2

Notes in italics are repeated to help random browsers—
systematic readers should ignore them
1. The next four graphs were plotted during the testing of
the First MONICA stroke, or risk-factor Hypothesis, con-
cerning the association between changes in cardiovascu-
lar risk factors and change in stroke-event rates. A
manuscript containing these graphs was in preparation
for publication at the same time as this Monograph,
linked with a technical appendix similar to MONICA
Publication 38 (2) for coronary events and its Appendix
(1), MONICA Web Publication 20. This analysis is very
much in parallel with that for coronary disease. See
MONICA Publication 45 and MONICA Web Publica-
tion 30, and also #2 MONICA Hypotheses and Study
Design, #35 Risk-Factor Scores, #40 Statistical Analysis—
relating changes in risk factors and treatments to changes
in event rates.
2. Each coloured point in the plots identifies the location of
a MONICA population RUA, showing how much its risk
factors changed in ten years on the x-axis, and how much
its event rates changed on the y-axis. Populations are
identified in G73 and G74 by their abbreviated 2-letter
codes in place of the seven-character identifications, one
letter for country, and one for population. See #90 Appen-
dix and #51–83. The number of stroke population
RUAs is only 40% of the number for coronary-event
registration. The precision with which trends in stroke-
event rates can be estimated within each population is
limited by the numbers of strokes in the 35–64 age
group.
3. A strong simultaneous relation between any change in the
stroke-risk score, calculated from changing levels of clas-
sical risk factors, and related changes in stroke-event rates
in the same populations would result in the MONICA
populations being arranged along a gradient, or regres-
sion line from near the bottom left corner of each plot
towards the top right. Calculated regression lines, their
equations and 95% confidence limits are added to G73
and G74. Note that the scale of the y-axis in the stroke
graphs is different from that in the preceding graphs
G69–G72 for coronary disease. This distorts simple
visual comparison of the gradients of regression lines,
but not whether they are positive or negative.
G734. The analysis in G73 used the whole registration period.
It fails to show any meaningful relation between
changes in the risk-factor score and changes in stroke
event rates in men as the gradient is virtually flat. At
any level of change in the risk-factor score there is con-
siderable variation in the trends in stroke-event rates.
Results in women are different in that the calculated
regression line shows a positive gradient. Both plots
show little change in predicted stroke-event rates when
there is no change in the risk-factor score. The number
of data points is limited and it is possible to argue that
results in both men and women may be being influ-
enced by a small number of outlying populations.
However, sensitivity analyses have not shown that
re-analysis using different weightings for data quality
scores, or omitting certain populations make a signifi-
cant effect on the results of these findings, so they are
comparatively robust.
G745. G74 shows what happens when a lagged (= delayed)
registration period is used (see G9). The justification is
that change in risk factors must precede a decline in
stroke risk, perhaps by a number of years. A time lag
was introduced for the beginning of the study period,
but not for the end, because most of the final surveys
were done at that time or after the end of the event reg-
istration periods. Results still show considerable scatter
of populations. The gradients of the regression lines are
now considerably steeper than in G73. That for women
shows a more strongly positive or increasing trend
with increase in risk-factor score. That for men shows
a more strongly negative or decreasing trend with
increasing risk-factor score. These results are contra-
dictory and difficult to explain. Comparison shows that
certain population RUAs had contrasting stroke-rate
trends in men and women although their risk-factor
changes were similar.
6. Interpretation of these graphs is a matter for discus-
sion. The MONICA study was designed primarily to
investigate and explore trends in coronary-event rates
in male populations. For stroke results it was under-
powered both in numbers of populations and in its
ability to measure trends in event-rates with precision.
It appears from these results that stroke risk-factor
scores, used for estimating stroke risk in individuals,
are less successful in predicting or explaining changes
in the risk of stroke in whole populations. See
MONICA Publication 45.
1. See Monograph CD-ROM or MONICA Websitehttp://www.ktl.fi/monica/.
2. Full references and summaries of MONICA Publicationsappear in #85/86.
232 MONICA MONOGRAPH AND MULTIMEDIA SOURCEBOOK
Hypotheses: stroke and stroke risk factors
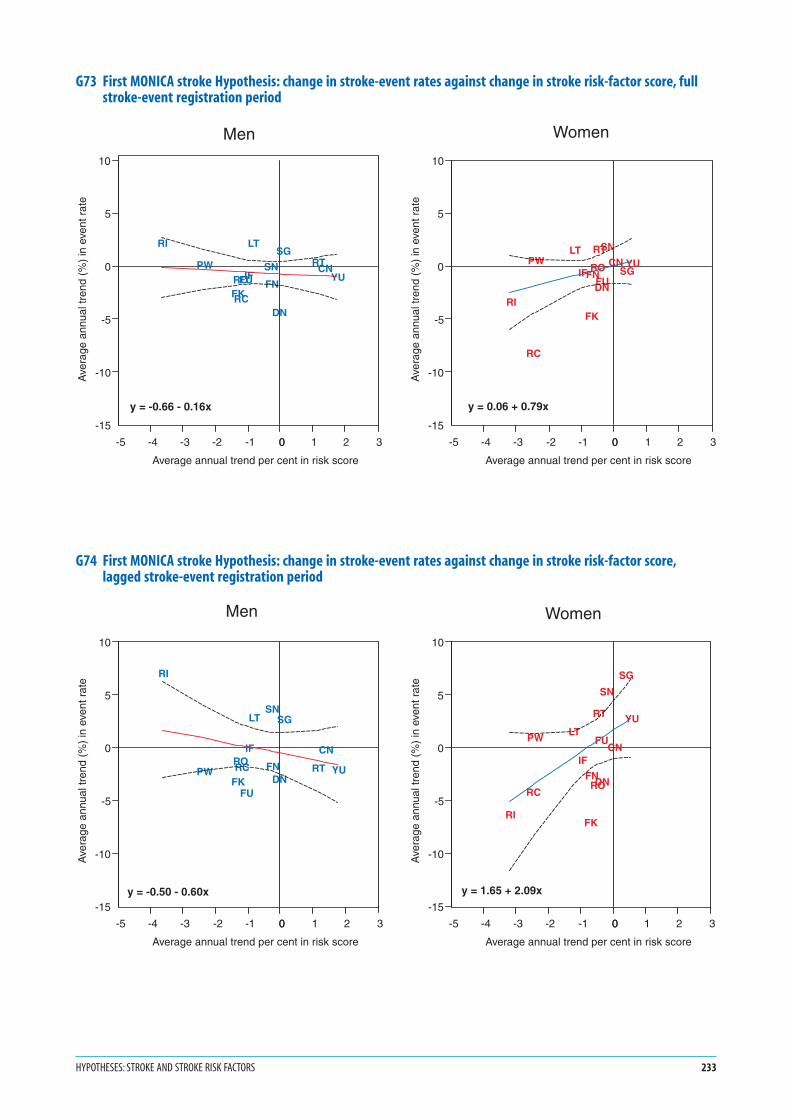
G73 First MONICA stroke Hypothesis: change in stroke-event rates against change in stroke risk-factor score, fullstroke-event registration period
G74 First MONICA stroke Hypothesis: change in stroke-event rates against change in stroke risk-factor score,lagged stroke-event registration period
HYPOTHESES: STROKE AND STROKE RISK FACTORS 233
Men Women
RI
PW
FKRO
RC
FUIF
LT
SN
FN
DN
SGRT
CNYU
-5 -4 -3 -2 -1 0 1 2 30
Average annual trend per cent in risk score
-15
-10
-5
0
5
10
Ave
rage
ann
ual t
rend
(%
) in
eve
nt r
ate
y = -0.66 - 0.16x
RI
RC
PWLT
IF
FK
FNRO
RT
FUDN
SN
CNSG
YU
-5 -4 -3 -2 -1 0 1 2 30
Average annual trend per cent in risk score
-15
-10
-5
0
5
10
Ave
rage
ann
ual t
rend
(%
) in
eve
nt r
ate
y = 0.06 + 0.79x
Men Women
RI
PWFK
RORC
FU
IF
LTSN
FNDN
SG
RT
CN
YU
-5 -4 -3 -2 -1 0 1 2 30
Average annual trend per cent in risk score
-15
-10
-5
0
5
10
Ave
rage
ann
ual t
rend
(%
) in
eve
nt r
ate
y = -0.50 - 0.60x
RI
RC
PWLT
IF
FK
FNRO
RT
FU
DN
SN
CN
SG
YU
-5 -4 -3 -2 -1 0 1 2 30
Average annual trend per cent in risk score
-15
-10
-5
0
5
10
Ave
rage
ann
ual t
rend
(%
) in
eve
nt r
ate
y = 1.65 + 2.09x
Notes in italics are repeated to help random browsers—
systematic readers should ignore them
1. These graphs should be looked at in association with the
notes on G73 and G74.
2. Although related strongly to blood pressure stroke risk is
multi-factorial, so the effect of one risk factor will be con-
founded and modified by what is happening to the others.
The weighting of cardiovascular risk factors for a stroke
risk score is different from that for coronary events. See
#35 Risk-Factor Scores. G75 and G76 show changes in
stroke-event rates in different populations, in relation to
the change in single risk factors, without any correction
for the effects of the others. Populations are not individ-
ually identified as they were in G73 and G74. Coloured
spots are used to mark them. Because the same popula-
tion results are used in each graph, their position along
the y-axis will be constant for each sex and registration
period, but the position on the x-axis will vary with the
risk factor concerned.
3. G75 uses the full stroke-event registration period.
There is considerable variation in the estimated trends
in stroke rates, as seen in the previous graphs. Change
in individual risk factors does not seem to be an effec-
tive method of explaining this variation. The calculated
regression line is virtually flat for three of the risk
factors in men, and negative for the fourth, body mass
index. In women there is a positive gradient for three
factors, although weak in relation to the trends that
were observed, but a weak negative gradient for ciga-
rette smoking.
4. G76 uses the lagged (= delayed) period, explained in
notes on G74 and shown in G9. There is no obvious
change in the results in men other than that the nega-
tive slope of the calculated regression line in body mass
index becomes more negative. In women, as in G73 and
G74 the results are again rather contradictory. This is
not surprising given the contradictory trends in some
population RUAs for men and women for similar risk-
factor results. Change in cigarette smoking shows no
effect on stroke rates but change in blood pressure,
total cholesterol and body mass index all show gradi-
ents in the expected positive direction. Of these the
most important contribution, and the most predictable
from the literature, is for change in systolic blood pres-
sure. It is difficult to explain why there is no similar
effect in men.
5. These results are a matter for debate. They are dis-
cussed in MONICA Publication 45. One contributory
factor may be the geographical origin of the popula-
tions concerned. Changes in stroke rates occurred in
eastern Europe at a time of severe economic upheaval
unaccompanied by major changes in cardiovascular
risk factors. These populations accounted for nearly
half of those in this study.
6. For further information on the general problem of
these analyses with respect to coronary and stroke
events see MONICA Publications 38 and 45 (2) and the
Appendices (1) , MONICA Web Publications 20 and
30.
1. See Monograph CD-ROM or MONICA Websitehttp://www.ktl.fi/monica/.
2. Full references and summaries of MONICA Publicationsappear in #85/86.
234 MONICA MONOGRAPH AND MULTIMEDIA SOURCEBOOK

G75 Change in stroke-event rates against change in individual stroke risk factors, full stroke-event registrationperiod
G76 Change in stroke-event rates against change in individual stroke risk factors, lagged stroke-event registrationperiod
HYPOTHESES: STROKE AND STROKE RISK FACTORS 235
-0.3 -0.2 -0.1 0 0.10
Average annual trend in BMI (kg/m )
-10
-8
-6
-4
-2
0
2
4
Ave
rage
ann
ual t
rend
(%
) in
eve
nt r
ate
Men
Wom
en
-1.5 -1 -0.5 0 0.5 1 1.5 20
Average annual trend in smoking (%)
-5
-4
-3
-2
-1
0
1
2
3
Ave
rage
ann
ual t
rend
(%
) in
eve
nt r
ate
Daily cigarette smoking
-1.5 -1 -0.5 0 0.5 10
Average annual trend in smoking (%)
-10
-8
-6
-4
-2
0
2
4
Ave
rage
ann
ual t
rend
(%
) in
eve
nt r
ate
Systolic blood pressure
-1.5 -1 -0.5 0 0.5 10
Average annual trend in BP (mm Hg)
-5
-4
-3
-2
-1
0
1
2
3
Ave
rage
ann
ual t
rend
(%
) in
eve
nt r
ate
-2 -1.5 -1 -0.5 0 0.5 10
Average annual trend in BP (mmHg)
-10
-8
-6
-4
-2
0
2
4
Ave
rage
ann
ual t
rend
(%
) in
eve
nt r
ate
Total cholesterol
-0.1 -0.05 0 0.05 0.10
Average annual trend in cholesterol (mmol/l)
-5
-4
-3
-2
-1
0
1
2
3
Ave
rage
ann
ual t
rend
(%
) in
eve
nt r
ate
-0.1 -0.05 0 0.05 0.10
Average annual trend in cholesterol (mmol/l)
-10
-8
-6
-4
-2
0
2
4
Ave
rage
ann
ual t
rend
(%
) in
eve
nt r
ate
Body mass index
-0.2 -0.1 0 0.1 0.20
Average annual trend in BMI (kg/m )
-5
-4
-3
-2
-1
0
1
2
3
Ave
rage
ann
ual t
rend
(%
) in
eve
nt r
ate
2
2
Men
Wom
en
-1.5 -1 -0.5 0 0.5 1 1.5 20
Average annual trend in smoking (%)
-6
-4
-2
0
2
4
6
8
Ave
rage
ann
ual t
rend
(%
) in
eve
nt r
ate
Daily cigarette smoking
-1.5 -1 -0.5 0 0.5 10
Average annual trend in smoking (%)
-10
-5
0
5
10
Ave
rage
ann
ual t
rend
(%
) in
eve
nt r
ate
Systolic blood pressure
-1.5 -1 -0.5 0 0.5 10
Average annual trend in BP (mm Hg)
-6
-4
-2
0
2
4
6
8
Ave
rage
ann
ual t
rend
(%
) in
eve
nt r
ate
-2 -1.5 -1 -0.5 0 0.5 10
Average annual trend in BP (mmHg)
-10
-5
0
5
10
Ave
rage
ann
ual t
rend
(%
) in
eve
nt r
ate
Total cholesterol
-0.1 -0.05 0 0.05 0.10
Average annual trend in cholesterol (mmol/l)
-6
-4
-2
0
2
4
6
8
Ave
rage
ann
ual t
rend
(%
) in
eve
nt r
ate
-0.1 -0.05 0 0.05 0.10
Average annual trend in cholesterol (mmol/l)
-10
-5
0
5
10
Ave
rage
ann
ual t
rend
(%
) in
eve
nt r
ate
Body mass index
-0.2 -0.1 0 0.1 0.20
Average annual trend in BMI (kg/m )
-6
-4
-2
0
2
4
6
8
Ave
rage
ann
ual t
rend
(%
) in
eve
nt r
ate
-0.3 -0.2 -0.1 0 0.10
Average annual trend in BMI (kg/m )
-10
-5
0
5
10
Ave
rage
ann
ual t
rend
(%
) in
eve
nt r
ate
2
2

1. G77 shows the results of the analyses made to test the
Second MONICA, or coronary care Hypothesis,
relating changes in treatment of coronary events to
changes in case fatality, and subsequently to changes in
coronary-event rates and mortality rates. They were
published and discussed in MONICA Publication 39
(2), and its methodological Appendix (1). See also the
subsequent Lancet correspondence.
2. Trends in end-points were in G15, G18 and G22;
in treatments and Equivalent Treatment Score in
G57–G66. Populations are as for the latter (abbrevia-
tions on the following page); time periods as in G11.
3. The MONICA coronary care hypothesis relates
increasing treatment with decreasing coronary end-
points. If there is an effect, the fitted regression lines
and equations (along with the 95% confidence limits)
should show decreasing or negative gradients.
4. The original hypothesis was framed in terms of acute
coronary care and 28-day case fatality. This is tested in
G77a. Most coronary deaths occur out of hospital and
are not treated in the attack. Analyses are possible to
see whether it is the hospital or pre-hospital compo-
nent of deaths that are declining—the latter would
emphasize secondary prevention rather than acute
care.
5. The eight evidence-based treatments we examined
were highly correlated so we could not apportion
responsibility for the observed benefits. It is even
conceivable in this observational study of whole
populations (an ‘ecological analysis’) that extraneous
unmeasured factors might have been responsible. See
discussion in MONICA Publication 39, and the subse-
quent correspondence and citations.
6. The manuscript group examined other coronary
end-points. There was a significant association between
treatment change and change in coronary-event rates,
and a stronger one still for change in mortality rates.
See G77b and G77c. The results are very strongly
positive.
7. There is a relation between change in mortality and
associated change in case fatality and coronary-event
rates. (See discussion of G22 and G23). The original
hypotheses related risk factors to coronary-event rates,
and treatments to case fatality. The results of the initial
analyses of trends in end-points, see G23, suggested
that case fatality had less effect on mortality trends than
did event rates. It was a puzzle therefore that new treat-
ments are more strongly related to change in mortality
rates than they are to case fatality—and that an effect
of change in risk factors has been more difficult to
demonstrate.
8. In retrospect it is not surprising that the systematic
introduction of powerful drugs on a large scale by
sophisticated health-care systems had a more measur-
able impact on coronary end-points than that of the
population changes in risk factors, which were small
and difficult to measure. In another decade results
could be different. Risk factors are now under phar-
macological attack.
9. Some MONICA populations had good information
but most were unable to provide data for sudden coro-
nary deaths on previous history and medication.
MONICA as a whole could not separate first presenta-
tions of coronary disease, susceptible to risk-factor
change, from disease progression where drugs for
secondary prevention are important. Analyses in
individual populations, although worth doing, will
lack the power of the MONICA collaboration.
10. MONICA results on change in coronary end-points are
polarized between east and west (see G24, G25), as are
those for treatment (see G67, G68), complicating inter-
pretation of their association.
11. Analyses for the MONICA First and Second Coronary
Hypotheses, MONICA Publications 38 and 39 (2), are
still to be integrated. It will be necessary to define
population RUAs that can be analysed for both studies
together, and plan how to cope with a time-lag for risk
factors, but not for coronary care. New MONICA pub-
lications on this and other subjects will be listed on the
MONICA Website as they appear.
1. See Monograph CD-ROM or MONICA Websitehttp://www.ktl.fi/monica/.
2. Full references and summaries of MONICA Publicationsappear in #85/86.
236 MONICA MONOGRAPH AND MULTIMEDIA SOURCEBOOK
Hypotheses: coronary care

G77a Second MONICA Hypothesis: change in case fatality against change in Equivalent Treatment Score
HYPOTHESES: CORONARY CARE 237
FS UG
SN
UB IB
AN IF US SW
NZ AP
IC FT
FL
CA BE
GB SP
FI GA
SG DN
PW
RM
PT CNGE
RN
CZ LT
YU
0 10 20 300
Change in Equivalent Treatment Score
-50
-40
-30
-20
-10
0
10
20
30
40
50
0
Per
cent
age
chan
ge in
cas
e fa
talit
y y = 12.1 - 0.96x
Men
UG IF FS UB AP
FT
SN
IB
AN
FL
SP
US NZ GB GA
CA
IC
SG
FI
DN
BE
PT PW
RM CN
RN
LT
CZ
YU
GE
0 10 20 300
Change in Equivalent Treatment Score
-50
-40
-30
-20
-10
0
10
20
30
40
50
0
Per
cent
age
chan
ge in
cas
e fa
talit
y y = 7.8 - 0.8x
Women
FS
UG
SN UB
IB
AN
IF
US
SW NZ AP
IC
FT FL
CA
BE GB
SP
FI GA SG
DN PW RM
PT
CN
GE RN CZ
LT YU
0 10 20 300
Change in Equivalent Treatment Score
-50
-40
-30
-20
-10
0
10
20
30
40
50
0
Per
cent
age
chan
ge in
cor
onar
y ev
ent r
ate
y = 7.6 - 1.27x
UG IF
FS UB
AP FT SN
IB
AN
FL
SP
US
NZ
GB GA CA
IC
SG FI
DN BE PT
PW
RM CN
RN LT
CZ
YU
GE
0 10 20 300
Change in Equivalent Treatment Score
-50
-40
-30
-20
-10
0
10
20
30
40
50
0
Per
cent
age
chan
ge in
cor
onar
y ev
ent r
ate
y = 9.0 - 1.14x
FS
UG
SN
UB
IB
AN
IF
US
SW NZ AP
IC
FT
FL
CA
BE GB
SP
FI
GA SG
DN PW
RM
PT
CN
GE
RN
CZ LT
YU
0 10 20 300
Change in Equivalent Treatment Score
-50
-40
-30
-20
-10
0
10
20
30
40
50
0
Per
cent
age
chan
ge in
CH
D m
orta
lity
rate
UG IF
FS
UB AP FT
SN
IB AN
FL
SP
US
NZ
GB
GA
CA
IC
SG
FI
DN
BE
PT PW
RM
CN
RN
LT
CZ
YU
GE
0 10 20 300
Change in Equivalent Treatment Score
-50
-40
-30
-20
-10
0
10
20
30
40
50
0
Per
cent
age
chan
ge in
CH
D m
orta
lity
ratey = 18.7 - 2.11x y = 13.5 - 1.69x
G77b Second MONICA Hypothesis: change in coronary-event rates against change in Equivalent Treatment Score
G77c Second MONICA Hypothesis: change in MONICA coronary heart disease (CHD) mortality rates against changein Equivalent Treatment Score