Embed Size (px)
Citation preview
ORIGINAL PAPER
Risk factors for post-traumatic osteoarthritis of the ankle:an eighteen year follow-up study
Anne Lübbeke & Davide Salvo & Richard Stern & Pierre Hoffmeyer & Nicolas Holzer &
Mathieu Assal
Received: 1 December 2011 /Accepted: 19 December 2011 /Published online: 17 January 2012# Springer-Verlag 2012
AbstractPurpose Long-term studies evaluating risk factors for de-velopment of ankle osteoarthritis (OA) following malleolarfractures are sparse.Methods We conducted a retrospective cohort study includ-ing consecutive patients treated by open reduction and in-ternal fixation for malleolar fracture between January 1988and December 1997. Perioperative information wasobtained retrospectively. Patients were evaluated clinicallyand radiographically 12–22 years postoperatively. Radio-graphic ankle OA was determined on standardised radio-graphs using the Kellgren and Lawrence scale (grade 3–40advanced OA). Uni- and multivariate regression analyseswere performed to determine risk factors for OA.Results During the inclusion period, 373 fractures (372patients; 9% Weber A, 58% Weber B, 33% Weber C) wereoperated upon. The mean age at operation was 42.9 years.There were 102 patients seen at follow-up (mean follow-up17.9 years). Those not available did not differ in demo-graphics and fracture type from those seen. Advanced ra-diographic OA was present in 37 patients (36.3%).Significant risk factors were: Weber C fracture, associatedmedial malleolar fracture, fracture-dislocation, increasingbody mass index, age 30 years or more and length of timesince surgery.
Conclusions Advanced radiographic OA was common 12–22 years after malleolar fracture. The probability of devel-oping post-traumatic OA among patients having three ormore risk factors was 60–70%.
Introduction
Ankle osteoarthritis (OA) is more frequently (70–80%) ofpost-traumatic origin compared to OA (<10%) of the hip orknee [1–3]. Malleolar fractures are the most frequent frac-ture type, present in 37–53% of patients with advanced orend-stage ankle OA [2–4]. Patients with post-traumatic an-kle OA are younger than those with primary OA [2, 3].Long-term studies (follow-up greater than ten years) evalu-ating risk factors for the development of ankle OA aftermalleolar fractures are sparse. Most of them are limited bysmall sample size [5–9] focusing on one or two factors.Only one study [8] assessed risk factors using statisticalmethods which allow for the presence of other risk factors.Additionally, there are a few short- to midterm follow-upstudies evaluating a larger number of patients and possiblerisk factors [10–12].
Several conditions have been associated with an in-creased risk of developing radiographic ankle OA or end-stage OA following a malleolar fracture. These includeincreasing age [4, 13], female gender [14], fracture severity[10, 11, 14], location and extent of cartilage lesions espe-cially of the medial malleolus [8], quality of fracture reduc-tion [10, 12] and presence of a fracture-dislocation [6, 10,11].
Our objective was to identify risk factors for ankle OA onaverage 17.9 years after a malleolar fracture treated by open
A. Lübbeke (*) :D. Salvo :R. Stern : P. Hoffmeyer :N. Holzer :M. AssalDivision of Orthopaedics and Trauma Surgery,Geneva University Hospitals,4, rue Gabrielle-Perret-Gentil,1211 Geneva, Switzerlande-mail: [email protected]
International Orthopaedics (SICOT) (2012) 36:1403–1410DOI 10.1007/s00264-011-1472-7
reduction and internal fixation (ORIF) and to quantify theimpact of both the individual and the combined risk factors.We evaluated their influence on the development of (1)advanced radiographic OA and (2) symptomatic advancedradiographic OA.
Materials and methods
Study population and study design
We conducted a retrospective cohort study including allpatients operated upon at our large university hospital be-tween January 1988 and December 1997 for a malleolarfracture treated by ORIF. Pilon or talus fractures were ex-cluded, as well as those patients younger than 18 years ofage. Operations were performed by a number of differentsurgeons with varying levels of experience. The study wasapproved by our Hospital Ethics Committee.
Potential risk factors
The risk factors evaluated were: (a) age at the time of injuryas continuous and categorical variable (<30 vs ≥30 years assuggested by Lorez and Hintermann [13]); (b) sex; (c) bodymass index (BMI) as continuous and categorical variable(normal weight 0 BMI <25 kg/m2, overweight 0 BMI 25–29.9 kg/m2, obese 0 BMI ≥30 kg/m2); (d) work status at thetime of operation (office, light or heavy work); (e) type offracture according to the Danis-Weber classification [15,16]; (f) associated fracture-dislocation (yes/no); (g) associ-ated fracture of the medial malleolus (yes/no); (h) associatedfracture of the posterior malleolus (yes/no); and (i) timebetween surgery and follow-up in years as continuous andcategorical variable (< 15 years, 15–19.9 years, ≥ 20 years).
Outcomes
The primary outcome of interest was the incidence of ad-vanced radiographic ankle OA 12–22 years after a malleolarfracture. Ankle OA was assessed using the Kellgren andLawrence (K&L) scale [17], the most widely used radio-graphic classification of OA. It includes five grades, andadvanced OA is classified as grades 3 and 4. Since nospecific description of the K&L grades exists for the ankle,we based our radiographic evaluation on the description ofthe grades of OA for the knee. Grade 3 is characterised bythe presence of moderate multiple osteophytes, definite nar-rowing of the joint space, some sclerosis and possible de-formity of bone ends. Grade 4 is defined by the presence oflarge osteophytes, marked narrowing of the joint space,severe sclerosis and definite deformity of bone ends [18].
In the context of knee OA the K&L scale is considered areliable and valid instrument [19, 20].
The second outcome of interest was the incidence ofsymptomatic advanced radiographic ankle OA. This wasdefined by the presence of pain together with advancedradiographic ankle OA. The American Orthopaedic Footand Ankle Society (AOFAS) hindfoot score [21], whichincludes an item for pain (mild, moderate or severe), wasused for evaluation at follow-up. All patients with anAOFAS pain sub-score less than 40 points and K&L grades3 or 4 were considered as incident cases.
Data collection
Perioperative information was obtained retrospectivelythrough chart review. Preoperative and immediate postoper-ative radiographs were not available. In six patients (1.6%)the fracture classification was missing. In 75 patients(20.1%) information on height at the time of surgery wasmissing making the calculation of their preoperative BMIimpossible.
Clinical and radiographic follow-up was standardised.All patients were contacted by mail twice and telephoneinviting them to participate. They were seen on average at17.9 years postoperatively for clinical and radiographicassessment by two surgeons who had not performed theoperations. Ankle OAwas independently assessed on stand-ardised radiographs by two reviewers who were blinded topatient characteristics and clinical outcome.
Statistical analysis
Baseline characteristics were compared between patientsseen and those not available for follow-up. Student’s t testwas used for the comparison of continuous variables and thechi-square test for the comparison of categorical variables.
In order to estimate the association between each riskfactor (predictor) and the main outcome we performed uni-variate analyses and presented relative risks (RR) and 95%confidence intervals (CI) as well as unadjusted odds ratios(OR) and their 95% CIs. We then fitted the full multivariatelogistic regression model including all potential predictors.Predictors were excluded (one by one) if the p value of thelog likelihood ratio test was greater than 0.10. Predictorexclusion was continued until all remaining predictors hadp values less than 0.10, which was then defined as the finalprediction model. The choice of a more restrictive p value,such as p00.05, is generally not recommended because ofthe risk of excluding important variables from the model.
Risk factors for the secondary outcome were only assessedin univariate analyses due to the limited number of outcomeevents. Finally, the incidence of the two outcomes was ana-lysed according to the number of risk factors present per
1404 International Orthopaedics (SICOT) (2012) 36:1403–1410
patient. The predictors BMI and time since surgery, evaluatedas continuous variables in the final model, were dichotomised.For BMI the category at risk was a BMI ≥25 kg/m2 and fortime since surgery an interval ≥20 years.
Results
There were 373 malleolar fractures in 372 patientscorresponding to the inclusion criteria and operated uponduring the study period. Of these patients, 47 (12.6%) haddied, 126 (33.9%) had left the area without current addressand 97 (26.1%) refused or did not participate in the follow-up invitation. In total, 102 patients (27.3%) with 102
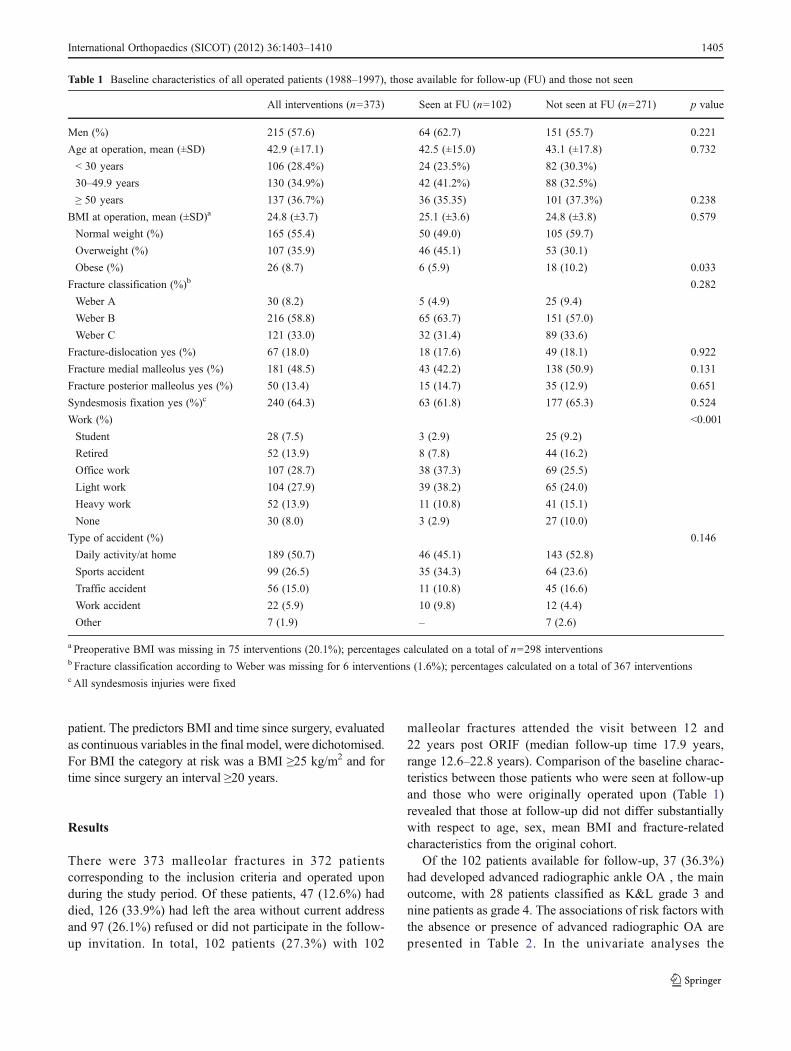
malleolar fractures attended the visit between 12 and22 years post ORIF (median follow-up time 17.9 years,range 12.6–22.8 years). Comparison of the baseline charac-teristics between those patients who were seen at follow-upand those who were originally operated upon (Table 1)revealed that those at follow-up did not differ substantiallywith respect to age, sex, mean BMI and fracture-relatedcharacteristics from the original cohort.
Of the 102 patients available for follow-up, 37 (36.3%)had developed advanced radiographic ankle OA , the mainoutcome, with 28 patients classified as K&L grade 3 andnine patients as grade 4. The associations of risk factors withthe absence or presence of advanced radiographic OA arepresented in Table 2. In the univariate analyses the
Table 1 Baseline characteristics of all operated patients (1988–1997), those available for follow-up (FU) and those not seen
All interventions (n0373) Seen at FU (n0102) Not seen at FU (n0271) p value
Men (%) 215 (57.6) 64 (62.7) 151 (55.7) 0.221
Age at operation, mean (±SD) 42.9 (±17.1) 42.5 (±15.0) 43.1 (±17.8) 0.732
< 30 years 106 (28.4%) 24 (23.5%) 82 (30.3%)
30–49.9 years 130 (34.9%) 42 (41.2%) 88 (32.5%)
≥ 50 years 137 (36.7%) 36 (35.35) 101 (37.3%) 0.238
BMI at operation, mean (±SD)a 24.8 (±3.7) 25.1 (±3.6) 24.8 (±3.8) 0.579
Normal weight (%) 165 (55.4) 50 (49.0) 105 (59.7)
Overweight (%) 107 (35.9) 46 (45.1) 53 (30.1)
Obese (%) 26 (8.7) 6 (5.9) 18 (10.2) 0.033
Fracture classification (%)b 0.282
Weber A 30 (8.2) 5 (4.9) 25 (9.4)
Weber B 216 (58.8) 65 (63.7) 151 (57.0)
Weber C 121 (33.0) 32 (31.4) 89 (33.6)
Fracture-dislocation yes (%) 67 (18.0) 18 (17.6) 49 (18.1) 0.922
Fracture medial malleolus yes (%) 181 (48.5) 43 (42.2) 138 (50.9) 0.131
Fracture posterior malleolus yes (%) 50 (13.4) 15 (14.7) 35 (12.9) 0.651
Syndesmosis fixation yes (%)c 240 (64.3) 63 (61.8) 177 (65.3) 0.524
Work (%) <0.001
Student 28 (7.5) 3 (2.9) 25 (9.2)
Retired 52 (13.9) 8 (7.8) 44 (16.2)
Office work 107 (28.7) 38 (37.3) 69 (25.5)
Light work 104 (27.9) 39 (38.2) 65 (24.0)
Heavy work 52 (13.9) 11 (10.8) 41 (15.1)
None 30 (8.0) 3 (2.9) 27 (10.0)
Type of accident (%) 0.146
Daily activity/at home 189 (50.7) 46 (45.1) 143 (52.8)
Sports accident 99 (26.5) 35 (34.3) 64 (23.6)
Traffic accident 56 (15.0) 11 (10.8) 45 (16.6)
Work accident 22 (5.9) 10 (9.8) 12 (4.4)
Other 7 (1.9) – 7 (2.6)
a Preoperative BMI was missing in 75 interventions (20.1%); percentages calculated on a total of n0298 interventionsb Fracture classification according to Weber was missing for 6 interventions (1.6%); percentages calculated on a total of 367 interventionsc All syndesmosis injuries were fixed
International Orthopaedics (SICOT) (2012) 36:1403–1410 1405
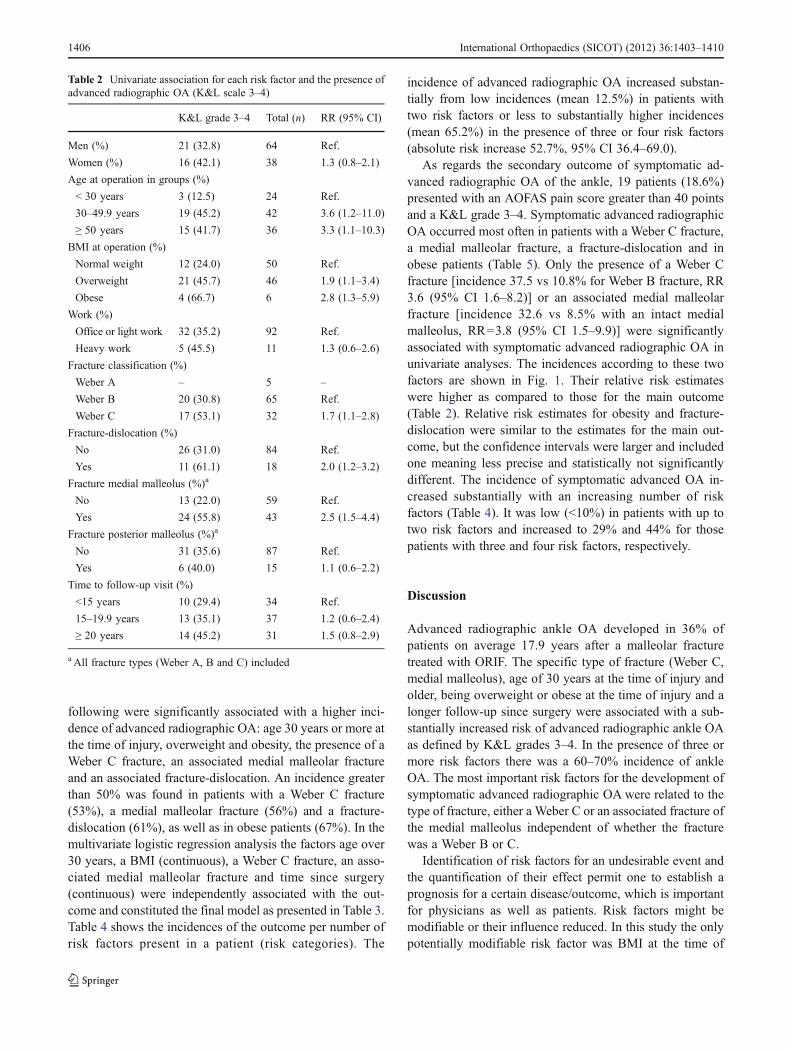
following were significantly associated with a higher inci-dence of advanced radiographic OA: age 30 years or more atthe time of injury, overweight and obesity, the presence of aWeber C fracture, an associated medial malleolar fractureand an associated fracture-dislocation. An incidence greaterthan 50% was found in patients with a Weber C fracture(53%), a medial malleolar fracture (56%) and a fracture-dislocation (61%), as well as in obese patients (67%). In themultivariate logistic regression analysis the factors age over30 years, a BMI (continuous), a Weber C fracture, an asso-ciated medial malleolar fracture and time since surgery(continuous) were independently associated with the out-come and constituted the final model as presented in Table 3.Table 4 shows the incidences of the outcome per number ofrisk factors present in a patient (risk categories). The
incidence of advanced radiographic OA increased substan-tially from low incidences (mean 12.5%) in patients withtwo risk factors or less to substantially higher incidences(mean 65.2%) in the presence of three or four risk factors(absolute risk increase 52.7%, 95% CI 36.4–69.0).
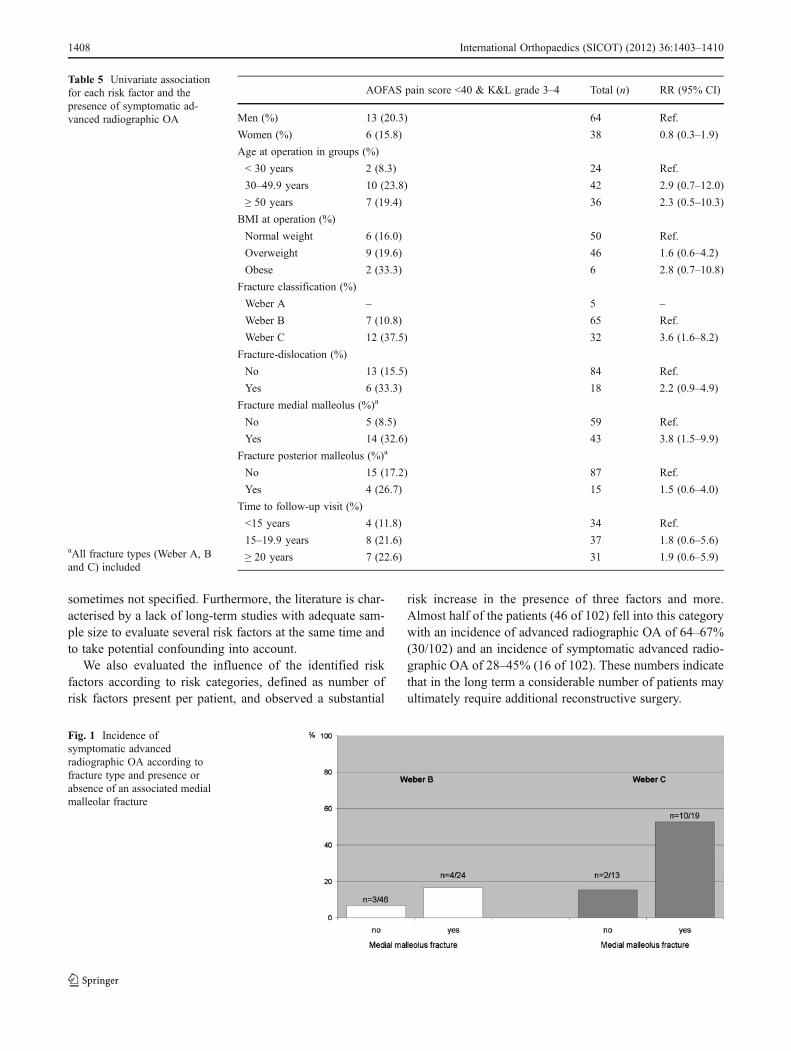
As regards the secondary outcome of symptomatic ad-vanced radiographic OA of the ankle, 19 patients (18.6%)presented with an AOFAS pain score greater than 40 pointsand a K&L grade 3–4. Symptomatic advanced radiographicOA occurred most often in patients with a Weber C fracture,a medial malleolar fracture, a fracture-dislocation and inobese patients (Table 5). Only the presence of a Weber Cfracture [incidence 37.5 vs 10.8% for Weber B fracture, RR3.6 (95% CI 1.6–8.2)] or an associated medial malleolarfracture [incidence 32.6 vs 8.5% with an intact medialmalleolus, RR03.8 (95% CI 1.5–9.9)] were significantlyassociated with symptomatic advanced radiographic OA inunivariate analyses. The incidences according to these twofactors are shown in Fig. 1. Their relative risk estimateswere higher as compared to those for the main outcome(Table 2). Relative risk estimates for obesity and fracture-dislocation were similar to the estimates for the main out-come, but the confidence intervals were larger and includedone meaning less precise and statistically not significantlydifferent. The incidence of symptomatic advanced OA in-creased substantially with an increasing number of riskfactors (Table 4). It was low (<10%) in patients with up totwo risk factors and increased to 29% and 44% for thosepatients with three and four risk factors, respectively.
Discussion
Advanced radiographic ankle OA developed in 36% ofpatients on average 17.9 years after a malleolar fracturetreated with ORIF. The specific type of fracture (Weber C,medial malleolus), age of 30 years at the time of injury andolder, being overweight or obese at the time of injury and alonger follow-up since surgery were associated with a sub-stantially increased risk of advanced radiographic ankle OAas defined by K&L grades 3–4. In the presence of three ormore risk factors there was a 60–70% incidence of ankleOA. The most important risk factors for the development ofsymptomatic advanced radiographic OA were related to thetype of fracture, either a Weber C or an associated fracture ofthe medial malleolus independent of whether the fracturewas a Weber B or C.
Identification of risk factors for an undesirable event andthe quantification of their effect permit one to establish aprognosis for a certain disease/outcome, which is importantfor physicians as well as patients. Risk factors might bemodifiable or their influence reduced. In this study the onlypotentially modifiable risk factor was BMI at the time of
Table 2 Univariate association for each risk factor and the presence ofadvanced radiographic OA (K&L scale 3–4)
K&L grade 3–4 Total (n) RR (95% CI)
Men (%) 21 (32.8) 64 Ref.
Women (%) 16 (42.1) 38 1.3 (0.8–2.1)
Age at operation in groups (%)
< 30 years 3 (12.5) 24 Ref.
30–49.9 years 19 (45.2) 42 3.6 (1.2–11.0)
≥ 50 years 15 (41.7) 36 3.3 (1.1–10.3)
BMI at operation (%)
Normal weight 12 (24.0) 50 Ref.
Overweight 21 (45.7) 46 1.9 (1.1–3.4)
Obese 4 (66.7) 6 2.8 (1.3–5.9)
Work (%)
Office or light work 32 (35.2) 92 Ref.
Heavy work 5 (45.5) 11 1.3 (0.6–2.6)
Fracture classification (%)
Weber A – 5 –
Weber B 20 (30.8) 65 Ref.
Weber C 17 (53.1) 32 1.7 (1.1–2.8)
Fracture-dislocation (%)
No 26 (31.0) 84 Ref.
Yes 11 (61.1) 18 2.0 (1.2–3.2)
Fracture medial malleolus (%)a
No 13 (22.0) 59 Ref.
Yes 24 (55.8) 43 2.5 (1.5–4.4)
Fracture posterior malleolus (%)a
No 31 (35.6) 87 Ref.
Yes 6 (40.0) 15 1.1 (0.6–2.2)
Time to follow-up visit (%)
<15 years 10 (29.4) 34 Ref.
15–19.9 years 13 (35.1) 37 1.2 (0.6–2.4)
≥ 20 years 14 (45.2) 31 1.5 (0.8–2.9)
a All fracture types (Weber A, B and C) included
1406 International Orthopaedics (SICOT) (2012) 36:1403–1410

surgery. Patients should be informed about this additionalrisk and counselled regarding weight reduction. Anotherimportant reason for risk factor identification is to informthe patient about future risk of OA (individual predictions)and adapt therapy to available treatment options to postponethe undesirable outcome. Our study allowed prediction forindividual factors as well as risk categories defined simplyby the number of risk factors present in a particular patient.We are not aware of any published study with long-termfollow-up that has assessed and quantified these issues inthe context of post-traumatic ankle OA.
Of the limited studies on long-term outcomes followingankle fractures with follow-up beyond ten years [5–8], three[5–7] reported on small numbers of patients (25, 32 and 45,respectively). The fourth [8] evaluated the influence oflocation and severity of cartilage damage in 109 patients13 years after ankle fracture. Deep lesions on the anteriorand lateral aspect of the talus were associated with clinicalsigns of OA, and deep lesions on the medial malleolus wereassociated with both clinical and radiographic signs of OA.This is in agreement with our findings of a higher incidenceof symptomatic advanced radiographic OA in the presenceof an associated medial malleolar fracture. Other studiesreporting on midterm results (less than ten years) found agreater incidence of post-traumatic ankle OA amongpatients classified with bimalleolar fractures as comparedto those with a single malleolar fracture [10, 11]. A fracture-dislocation has been identified as a risk factor for OA inprevious studies [6, 10, 11]. The greater risk of radiographicOA following a Weber C as compared to a Weber B fracturewas reported in some [12, 14, 22] but not all midtermfollow-up studies [10]. Müller et al. [12] reported an inci-dence of 38 (Weber C) vs 14% (Weber B) four to 12 years
after malleolar fracture, Fleischer and Warncke [22] anincidence of 46 vs 28% (Weber C vs Weber B, respectively)eight years postoperatively and Lindsjö [11] an incidence of33 (Weber C) vs 12% (Weber B) two to six years postoper-atively. These reported incidences are lower than ours (53after Weber C vs 31% following Weber B), which can beexplained by their much shorter follow-up and by use ofdifferent definitions of OA. With respect to the influence ofage, our results are in agreement with Lorez and Hintermann[13] who reported on better radiographic and clinical resultsin patients less than 30 years of age at the time of injury.Finally, we found a substantially increasing risk for radio-graphic post-traumatic ankle OA with rising BMI. To thebest of our knowledge BMI influence on midterm and long-term development of ankle OA has not been examined. Ingeneral, a higher risk for ankle fractures in overweight andobese persons has been suggested [23, 24]. Additionally,overweight and obese subjects seem to sustain more severetypes of ankle fractures [25–27]. We also found a higherproportion of displaced fractures in the obese group (datanot shown), but this does not entirely explain the higher OArisk in overweight and obese patients because a significantinfluence persisted even after adjusting for other risk factorsincluding fracture severity. Böstman [28] reported a greaterrisk for loss of reduction after closed and open treatment ofankle fractures in overweight and obese patients. However,the proportion of all patients experiencing this complicationwas small (3.6%).
The criteria to determine radiographic and clinical OA,judging from the sparse indications in some studies, weredifferent, which makes exact comparisons of incidencesdifficult. A variety of scores were used and whether authorsevaluated only radiographic or clinical OA or both was
Table 4 Incidence of radio-graphic and symptomatic ad-vanced OA according to thenumber of risk factors present
aTo categorise a patient as beingat risk or not, the continuous riskfactors were dichotomised: age<30 vs≥30 years, BMI normalweight vs overweight/obese,time since surgery<20 vs≥20 years
Riskfactors (n)a
Patients (n) per riskfactor category
Incidence of advancedradiographic OA
Incidence of symptomatic advancedradiographic OA
0 5 0 (0%) 0 (0%)
1 22 2 (9.1%) 1 (4.5%)
2 29 5 (17.2%) 2 (6.9%)
3 28 18 (64.3%) 8 (28.6%)
4 18 12 (66.7%) 8 (44.4%)
5 – – –
Table 3 Risk factors for ad-vanced radiographic ankle OA(univariate and multivariate lo-gistic regression models)
Crude OR (95% CI) Adjusted OR (95% CI)
Age ≥30 (01) vs <30 years 5.41 (1.49–19.65) 7.72 (1.82–32.78)
BMI, continuous 1.19 (1.04–1.36) 1.17 (1.01–1.37)
Fracture Weber C (01) vs B 2.83 (1.19–6.74) 3.19 (1.08–9.40)
Medial malleolar fracture (yes01) 4.47 (1.89–10.57) 3.97 (1.47–10.75)
Time since surgery, continuous 1.03 (0.91–1.17) 1.18 (1.00–1.38)
International Orthopaedics (SICOT) (2012) 36:1403–1410 1407
sometimes not specified. Furthermore, the literature is char-acterised by a lack of long-term studies with adequate sam-ple size to evaluate several risk factors at the same time andto take potential confounding into account.
We also evaluated the influence of the identified riskfactors according to risk categories, defined as number ofrisk factors present per patient, and observed a substantial
risk increase in the presence of three factors and more.Almost half of the patients (46 of 102) fell into this categorywith an incidence of advanced radiographic OA of 64–67%(30/102) and an incidence of symptomatic advanced radio-graphic OA of 28–45% (16 of 102). These numbers indicatethat in the long term a considerable number of patients mayultimately require additional reconstructive surgery.
Fig. 1 Incidence ofsymptomatic advancedradiographic OA according tofracture type and presence orabsence of an associated medialmalleolar fracture
Table 5 Univariate associationfor each risk factor and thepresence of symptomatic ad-vanced radiographic OA
aAll fracture types (Weber A, Band C) included
AOFAS pain score <40 & K&L grade 3–4 Total (n) RR (95% CI)
Men (%) 13 (20.3) 64 Ref.
Women (%) 6 (15.8) 38 0.8 (0.3–1.9)
Age at operation in groups (%)
< 30 years 2 (8.3) 24 Ref.
30–49.9 years 10 (23.8) 42 2.9 (0.7–12.0)
≥ 50 years 7 (19.4) 36 2.3 (0.5–10.3)
BMI at operation (%)
Normal weight 6 (16.0) 50 Ref.
Overweight 9 (19.6) 46 1.6 (0.6–4.2)
Obese 2 (33.3) 6 2.8 (0.7–10.8)
Fracture classification (%)
Weber A – 5 –
Weber B 7 (10.8) 65 Ref.
Weber C 12 (37.5) 32 3.6 (1.6–8.2)
Fracture-dislocation (%)
No 13 (15.5) 84 Ref.
Yes 6 (33.3) 18 2.2 (0.9–4.9)
Fracture medial malleolus (%)a
No 5 (8.5) 59 Ref.
Yes 14 (32.6) 43 3.8 (1.5–9.9)
Fracture posterior malleolus (%)a
No 15 (17.2) 87 Ref.
Yes 4 (26.7) 15 1.5 (0.6–4.0)
Time to follow-up visit (%)
<15 years 4 (11.8) 34 Ref.
15–19.9 years 8 (21.6) 37 1.8 (0.6–5.6)
≥ 20 years 7 (22.6) 31 1.9 (0.6–5.9)
1408 International Orthopaedics (SICOT) (2012) 36:1403–1410

Limitations
Our first limitation was that only 27% of patients operatedupon were available for follow-up visit 12–22 years post-operatively. The considerable number of patients lost tofollow-up (34%) is probably related to the fact that (1) atthe time of operation patients were relatively young, and asa consequence a larger proportion had moved out of thearea, and (2) our hospital is a reference trauma centre in atourist area. It seems unlikely that this patient group includ-ed a higher proportion of good or poor results than thoseavailable for follow-up. However, we acknowledge that ofpatients who had not died or were lost to follow-up (26%),the decision to participate or not might have been related totheir outcome which could have biased our results. Never-theless, at baseline the risk factor distribution did not sub-stantially differ between all patients who underwent ORIFand those eventually seen in follow-up.
Second, all fractures were classified only according toDanis-Weber, rather than any other classification systems(Lauge-Hansen, AO/OTA) [29, 30], which might have pro-vided a more detailed analysis. Third, determination of thequality of fracture reduction and fixation was not possiblebecause there was no systematic information available in theoperative report, and we did not have immediate postoper-ative radiographs. Fourth, the number of secondary outcomeevents was limited (n019) and multivariate analysis wasthus not suitable. However, similar risk factors were foundin univariate analyses for both primary and secondary out-come. Fifth, while it is a weakness that we do not haveinformation on preoperative OA, it has been noted that theprevalence of primary (not post-traumatic) OA in the ankleis very low [2, 31]. Moreover, about half of the patientpopulation was under the age of 40 years, an age group inwhich OA rarely occurs. Thus, the presumption that the OAseen at follow-up was related to the fracture should be valid.Lastly, the risk factors identified in our study require vali-dation in other patient populations (external validation).
Conclusion
Advanced radiographic ankle OA was common (36.3%)18 years after malleolar fractures, especially following We-ber C fractures and associated medial malleolar fractures.Risk is also increased with rising BMI, in patients over30 years of age at the time of injury and with increasinglength of time since surgery. The probability of developingpost-traumatic ankle OA among patients having three ormore risk factors was 60–70%. The most important riskfactors identified for the development of symptomatic ad-vanced radiographic OAwere related to the type of fracture,either a Weber C fracture or an associated fracture of the
medial malleolus independent of whether the fracture was aWeber B or C. Orthopaedic surgeons need to be aware ofthis information in order to clearly inform high-risk patients.
Acknowledgment We are indebted to Prof. Thomas Perneger for hisvaluable comments regarding data analysis.
Conflict of interest The authors declare that they have no conflict ofinterest.
References
1. Brown TD, Johnston RC, Saltzman CL, Marsh JL, Buckwalter JA(2006) Posttraumatic osteoarthritis: a first estimate of incidence,prevalence, and burden of disease. J Orthop Trauma 20(10):739–744
2. Saltzman CL, Salamon ML, Blanchard GM, Huff T, Hayes A,Buckwalter JA et al (2005) Epidemiology of ankle arthritis: reportof a consecutive series of 639 patients from a tertiary orthopaediccenter. Iowa Orthop J 25:44–46
3. Valderrabano V, Horisberger M, Russell I, Dougall H, HintermannB (2009) Etiology of ankle osteoarthritis. Clin Orthop Relat Res467(7):1800–1806
4. Horisberger M, Valderrabano V, Hintermann B (2009) Posttrau-matic ankle osteoarthritis after ankle-related fractures. J OrthopTrauma 23(1):60–67
5. Day GA, Swanson CE, Hulcombe BG (2001) Operative treatmentof ankle fractures: a minimum ten-year follow-up. Foot Ankle Int22(2):102–106
6. De Vries JS, Wijgman AJ, Sierevelt IN, Schaap GR (2005) Long-term results of ankle fractures with a posterior malleolar fragment.J Foot Ankle Surg 44(3):211–217
7. Jarde O, Vives P, Havet E, Gouron R, Meunier W (2000)Malleolar fractures. Predictive factors for secondary osteoar-thritis. Retrospective study of 32 cases. Acta Orthop Belg 66(4):382–388
8. Stufkens SA, Knupp M, Horisberger M, Lampert C, Hintermann B(2010) Cartilage lesions and the development of osteoarthritis afterinternal fixation of ankle fractures: a prospective study. J BoneJoint Surg Am 92(2):279–286
9. Stufkens SA, van den Bekerom MP, Kerkhoffs GM, HintermannB, van Dijk CN (2011) Long-term outcome after 1822 operativelytreated ankle fractures: a systematic review of the literature. Injury42:119–127
10. Beris AE, Kabbani KT, Xenakis TA, Mitsionis G, Soucacos PK,Soucacos PN (1997) Surgical treatment of malleolar fractures. Areview of 144 patients. Clin Orthop Relat Res 341:90–98
11. Lindsjö U (1981) Operative treatment of ankle fractures. ActaOrthop Scand Suppl 189:1–131
12. Müller J, Plaass U, Willenegger H (1971) Late results after surgi-cally treated malleolar fractures. Helv Chir Acta 38(3):329–337
13. Lorez LG, Hintermann B (1999) Significance of concomitantinjuries in malleolar fractures. A prospective study. Unfallchirurg102(12):949–954
14. Lindsjö U (1985) Operative treatment of ankle fracture-dislocations.A follow-up study of 306/321 consecutive cases. Clin Orthop RelatRes 199:28–38
15. Danis R (1949) Théorie et pratique de l'ostéosynthèse. Masson,Paris
16. Weber B (1966) Die Verletzungen des oberen Sprunggelenkes.Aktuelle Probleme in der Chirurgie. Huber, Stuttgart
17. Kellgren JH, Lawrence JS (1957) Radiological assessment ofosteo-arthrosis. Ann Rheum Dis 16(4):494–502
International Orthopaedics (SICOT) (2012) 36:1403–1410 1409

18. (2005) The atlas of standard radiographs of arthritis. Rheumatolo-gy (Oxford) 44 Suppl 4:iv46–iv72
19. Kessler S, Guenther KP, Puhl W (1998) Scoring prevalence andseverity in gonarthritis: the suitability of the Kellgren & Lawrencescale. Clin Rheumatol 17(3):205–209
20. LaValley MP, McAlindon TE, Chaisson CE, Levy D, Felson DT(2001) The validity of different definitions of radiographic wors-ening for longitudinal studies of knee osteoarthritis. J Clin Epide-miol 54(1):30–39
21. Kitaoka HB, Alexander IJ, Adelaar RS, Nunley JA, Myerson MS,Sanders M (1994) Clinical rating systems for the ankle-hindfoot,midfoot, hallux, and lesser toes. Foot Ankle Int 15(7):349–353
22. Fleischer GM, Warncke P (1989) Late results following ankle jointosteosyntheses. Zentralbl Chir 114(6):381–387
23. Bergkvist D, Hekmat K, Svensson T, Dahlberg L (2009) Obesity inorthopedic patients. Surg Obes Relat Dis 5(6):670–672
24. Valtola A, Honkanen R, Kröger H, Tuppurainen M, Saarikoski S,Alhava E (2002) Lifestyle and other factors predict ankle fracturesin perimenopausal women: a population-based prospective cohortstudy. Bone 30(1):238–242
25. Böstman OM (1994) Body mass index of patients with elbow andankle fractures requiring surgical treatment. J Trauma 37(1):62–65
26. Spaine LA, Bollen SR (1996) ‘The bigger they come …’: therelationship between body mass index and severity of ankle frac-tures. Injury 27(10):687–689
27. Strauss EJ, Frank JB, Walsh M, Koval KJ, Egol KA (2007) Doesobesity influence the outcome after the operative treatment ofankle fractures? J Bone Joint Surg Br 89(6):794–798
28. Böstman OM (1995) Body-weight related to loss of reduction offractures of the distal tibia and ankle. J Bone Joint Surg Br 77(1):101–103
29. Lauge-Hansen N (1950) Fractures of the ankle. II. Combinedexperimental-surgical and experimental-roentgenologic investiga-tions. Arch Surg 60(5):957–985
30. Marsh JL, Slongo TF, Agel J, Broderick JS, Creevey W, DeCosterTA et al (2007) Fracture and dislocation classification compendium -2007: Orthopaedic Trauma Association classification, database andoutcomes committee. J Orthop Trauma 21(10 Suppl):S1–S133
31. Huch K, Kuettner KE, Dieppe P (1997) Osteoarthritis in ankle andknee joints. Semin Arthritis Rheum 26(4):667–674
1410 International Orthopaedics (SICOT) (2012) 36:1403–1410

![103 Cox - c.ymcdn.comc.ymcdn.com/sites/ · PDF file• osteoarthritis of the foot or ankle ... serene mind, and an integrated spirit. ... Ear map[Photograph]](https://img.pdfslide.us/doc/110x75/5aa1bac27f8b9a1f6d8c51fd/103-cox-cymcdncomcymcdncomsites-osteoarthritis-of-the-foot-or-ankle-.jpg)