Embed Size (px)
Citation preview
pp

RISK DISCLOSURE STATEMENT / DISCLAIMER AGREEMENT
Trading any financial market involves risk. This report and all and any of its contents are neither a solicitation nor
an offer to Buy/Sell any financial market.
The contents of this material are for general information and educational purposes only [contents shall also mean
the website http://www.elliottwavedna.com or http://www.elliottwavelab.com or any website (“the sites”) the
content is hosted on, and any email correspondence or newsletters or postings related to such website]. Every
effort has been made to accurately represent this product and its potential. There is no guarantee that you will
earn any money using the techniques, ideas and software in these materials. Examples in these materials are not
to be interpreted as a promise or guarantee of earnings. Earning potential is entirely dependent on the person
using the product, ideas and techniques. We do not purport this to be a “get rich scheme.”
Although every attempt has been made to assure accuracy, we do not give any express or implied warranty as to
its accuracy. We do not accept any liability for error or omission. Examples are provided for illustrative purposes
only and should not be construed as investment advice or strategy.
No representation is being made that any account or trader will or is likely to achieve profits or losses similar to
those discussed in this report or on http://www.elliottwavedna.com or on the sites. Past performance is not
indicative of future results.
By purchasing any content, subscribing to our mailing list or using the website or contents of the website or
materials provided herewith, you will be deemed to have accepted these terms and conditions in full as appear
also on our site, as do our full earnings disclaimer and privacy policy and CFTC disclaimer and rule 4.41 to be
read here with. So too, all the materials contained within this course, including this manual, whether they appear
on our domain(s) or are in physical form, are protected by copyright. "Warning: The unauthorized reproduction or
distribution of this copyrighted work is illegal. Criminal copyright infringement, including infringement without
monetary gain, is investigated by the authorities and is punishable with imprisonment and a fine." We reserve all
our rights in this regard.
Alaziac Trading CC, in association with http://www.elliottwavedna.com, the sites, content, and its representatives
do not and cannot give investment advice or invite customers or readers to engage in investments through this
course or any part of it.
The information provided in this content is not intended for distribution to, or use by any person or entity in any
jurisdiction or country where such distribution or use would be contrary to law or regulation or which would
subject us to any registration requirement within such jurisdiction or country.
Hypothetical performance results have many inherent limitations, some of which are mentioned below. No
representation is being made that any account will or is likely to achieve profits or losses similar to those shown.
In fact, there are frequently sharp differences between hypothetical performance results and actual results
subsequently achieved by any particular trading program and method.
One of the limitations of hypothetical performance results is that they are generally prepared with the benefit of
hindsight. In addition, hypothetical trading does not involve financial risk and no hypothetical trading record can
completely account for the impact of financial risk in actual trading.
For example, the ability to withstand losses or to adhere to a particular trading program or system in spite of the
trading losses are material points that can also adversely affect trading results. There are numerous other factors
related to the market in general or to the implementation of any specific trading program, which cannot be fully
accounted for in the preparation of hypothetical performance results. All of which can adversely affect actual
trading results.
We reserve the right to change the set terms and conditions without notice. You can check for updates to this
disclaimer at any time by visiting http://www.elliottwavedna.com
Governing law: this policy and the use of this report / course / DVDs / eBook, provided in any form, and any
content on the website are governed by the laws of the Republic of South Africa. Further details on this are found
under the Terms and Conditions on our site. Please ensure you read and agree with all Terms and Conditions as
set out on our site before using any of the materials. Your use and reliance on the materials is based on your
acceptance of such Terms and Conditions and policies as appear on the site.
Nicola Delic Day Trade Profit Fusion System
www.elliottwavedna.com 3
Welcome to
Day Trade Profit Fusion System
Day Trade Profit Fusion System is fairly simple, yet still extremely
powerful part of Elliott Wave Theory. After spending years using Elliott
Wave as my only trading strategy, I wanted to share a few patterns that
everyone can find in very short amount of time and make profitable
trades every day. In this manual you are going to learn the technique
behind the Day Trade Profit Fusion System.
It consists of determining a trend and spotting a pullback pattern. Once
you spot the simple A-B-C pullback pattern, you will use Fibonacci
retracement tool to determine your target.
Nicola Delic Day Trade Profit Fusion System
www.elliottwavedna.com 4
Components of the system
For Day Trade Profit Fusion System you'll need two tools:
1. Trendlines
2. Fibonacci Retracements
1. Trendlines
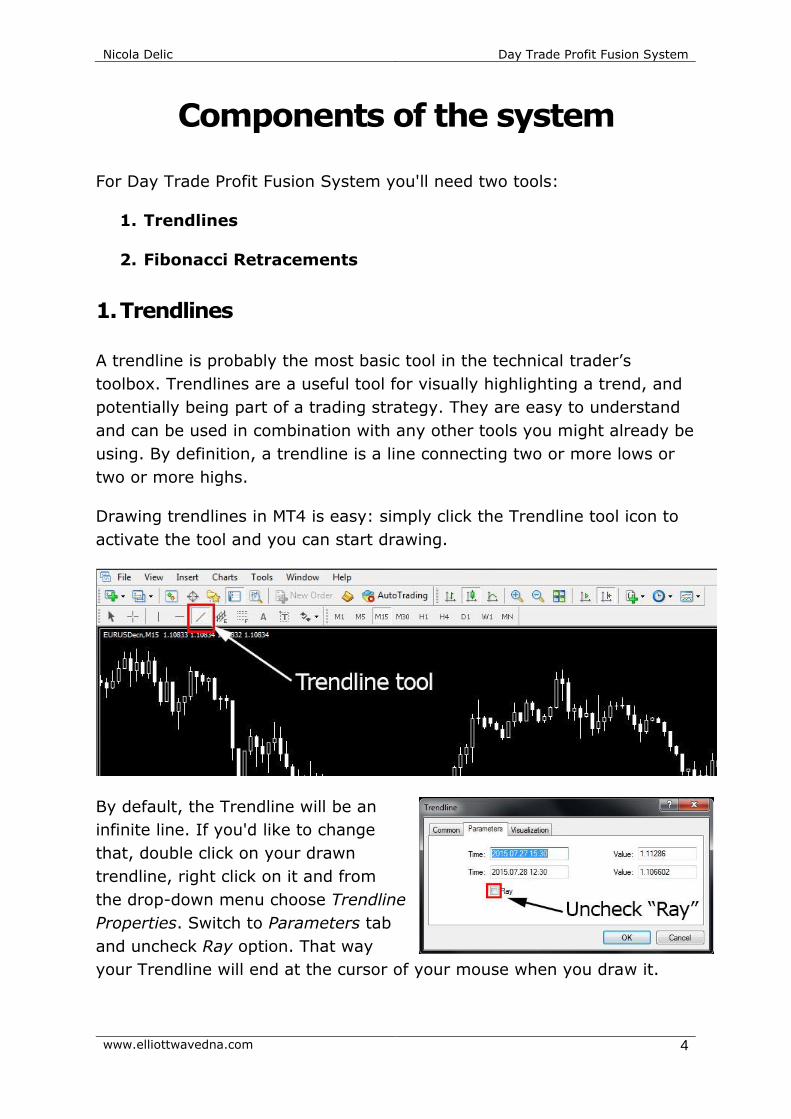
A trendline is probably the most basic tool in the technical trader’s
toolbox. Trendlines are a useful tool for visually highlighting a trend, and
potentially being part of a trading strategy. They are easy to understand
and can be used in combination with any other tools you might already be
using. By definition, a trendline is a line connecting two or more lows or
two or more highs.
Drawing trendlines in MT4 is easy: simply click the Trendline tool icon to
activate the tool and you can start drawing.
By default, the Trendline will be an
infinite line. If you'd like to change
that, double click on your drawn
trendline, right click on it and from
the drop-down menu choose Trendline
Properties. Switch to Parameters tab
and uncheck Ray option. That way
your Trendline will end at the cursor of your mouse when you draw it.
Nicola Delic Day Trade Profit Fusion System
www.elliottwavedna.com 5
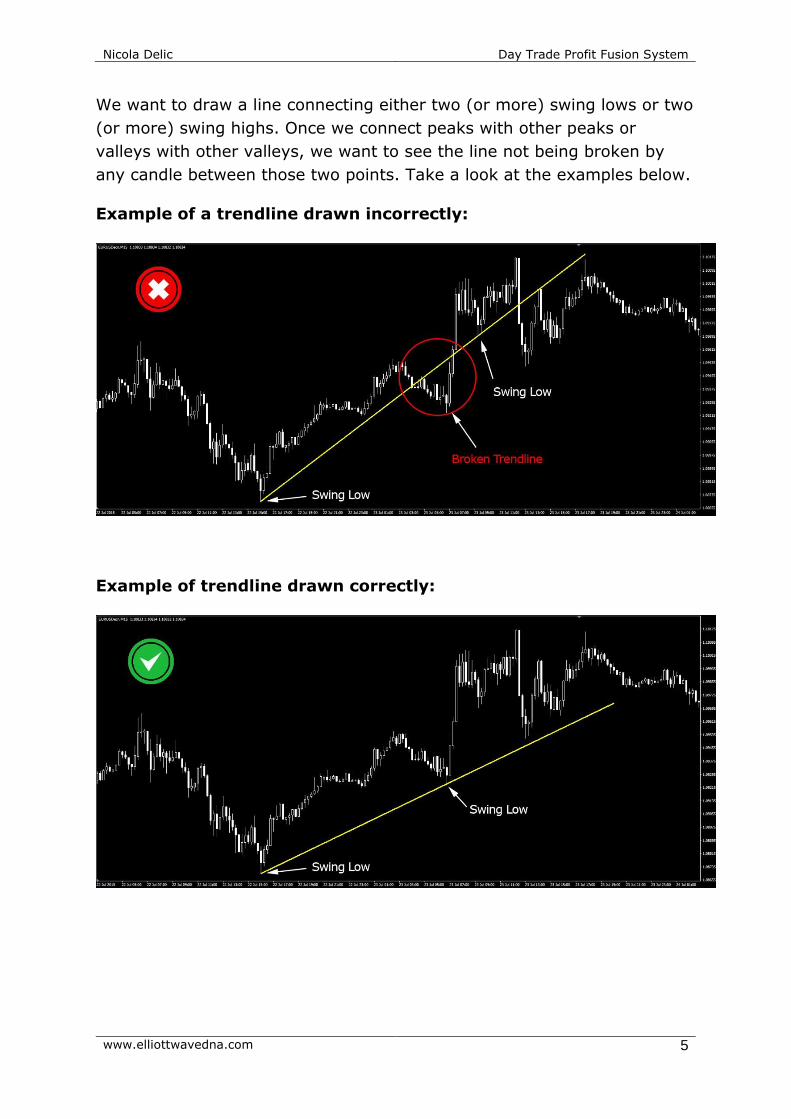
We want to draw a line connecting either two (or more) swing lows or two
(or more) swing highs. Once we connect peaks with other peaks or
valleys with other valleys, we want to see the line not being broken by
any candle between those two points. Take a look at the examples below.
Example of a trendline drawn incorrectly:
Example of trendline drawn correctly:
Nicola Delic Day Trade Profit Fusion System
www.elliottwavedna.com 6
In the first image, you will find that we successfully drew a line
connecting two swing lows. But, between those two points, the price
broke through the line that we drew. This invalidates the trendline.
What we want is what we see in the second image, two swing lows
connected together by a line unbroken by price. This is a valid trendline
that is ready to be projected out into the future.
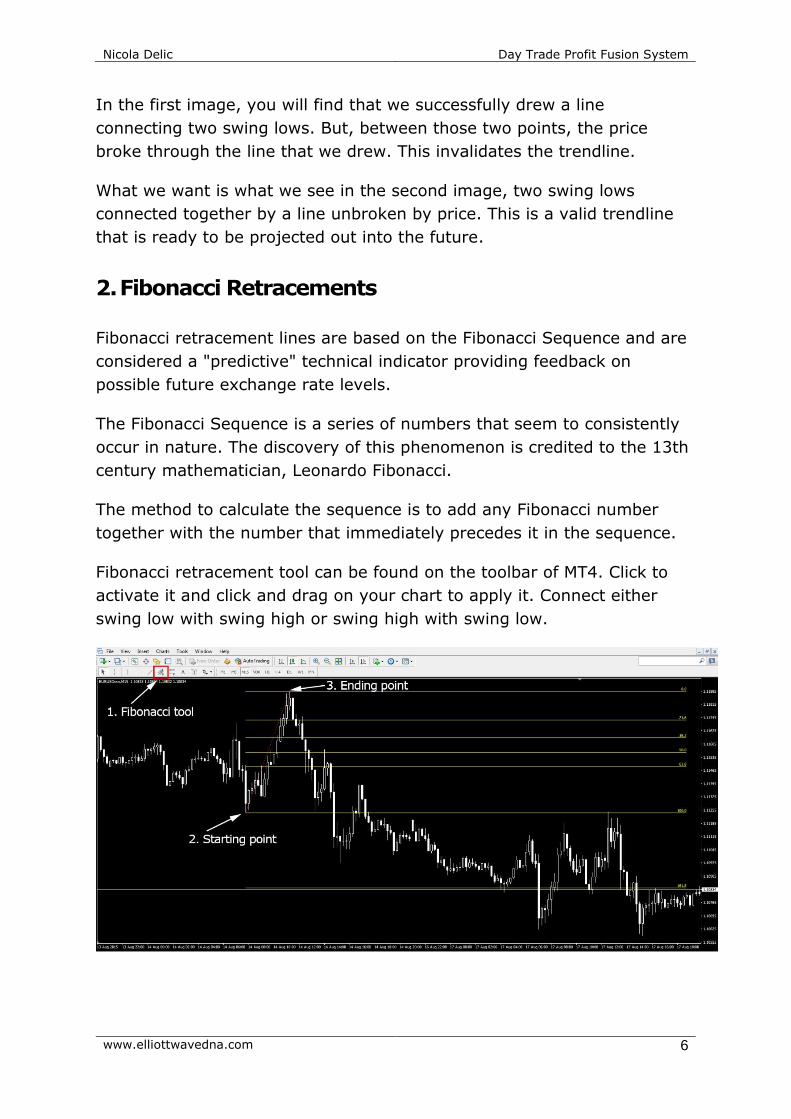
2. Fibonacci Retracements
Fibonacci retracement lines are based on the Fibonacci Sequence and are
considered a "predictive" technical indicator providing feedback on
possible future exchange rate levels.
The Fibonacci Sequence is a series of numbers that seem to consistently
occur in nature. The discovery of this phenomenon is credited to the 13th
century mathematician, Leonardo Fibonacci.
The method to calculate the sequence is to add any Fibonacci number
together with the number that immediately precedes it in the sequence.
Fibonacci retracement tool can be found on the toolbar of MT4. Click to
activate it and click and drag on your chart to apply it. Connect either
swing low with swing high or swing high with swing low.
Nicola Delic Day Trade Profit Fusion System
www.elliottwavedna.com 7
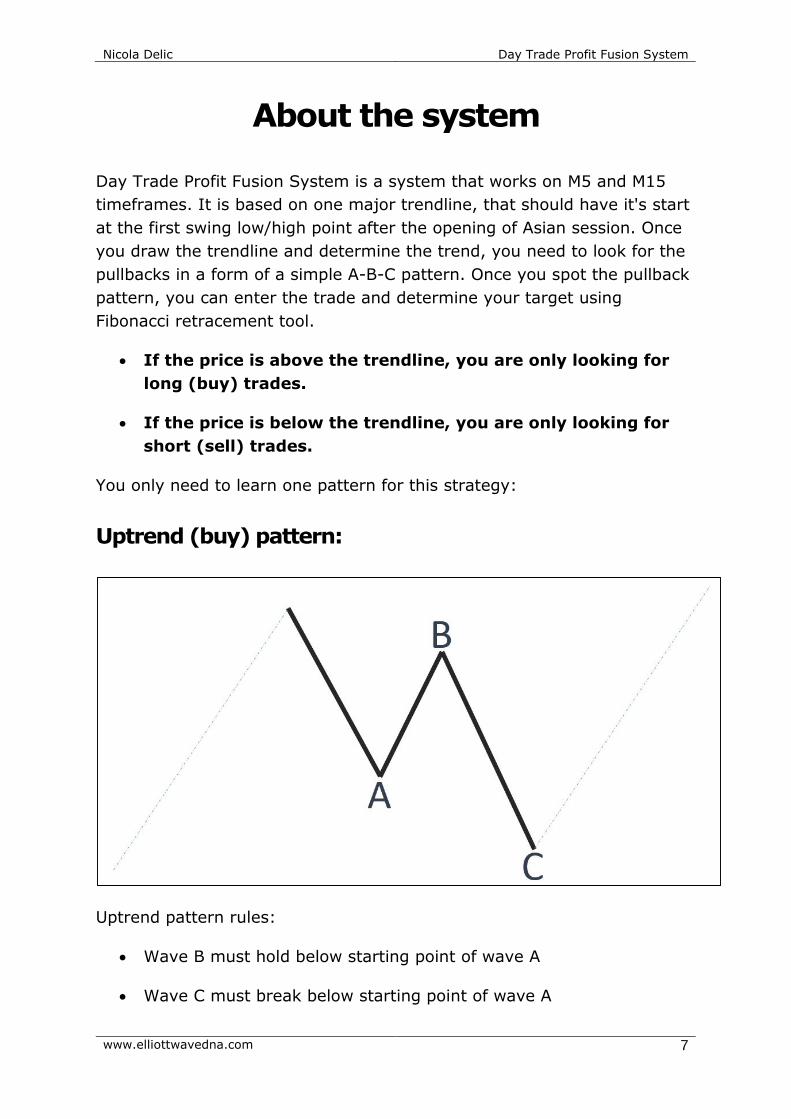
About the system
Day Trade Profit Fusion System is a system that works on M5 and M15
timeframes. It is based on one major trendline, that should have it's start
at the first swing low/high point after the opening of Asian session. Once
you draw the trendline and determine the trend, you need to look for the
pullbacks in a form of a simple A-B-C pattern. Once you spot the pullback
pattern, you can enter the trade and determine your target using
Fibonacci retracement tool.
If the price is above the trendline, you are only looking for
long (buy) trades.
If the price is below the trendline, you are only looking for
short (sell) trades.
You only need to learn one pattern for this strategy:
Uptrend (buy) pattern:
Uptrend pattern rules:
Wave B must hold below starting point of wave A
Wave C must break below starting point of wave A
Nicola Delic Day Trade Profit Fusion System
www.elliottwavedna.com 8
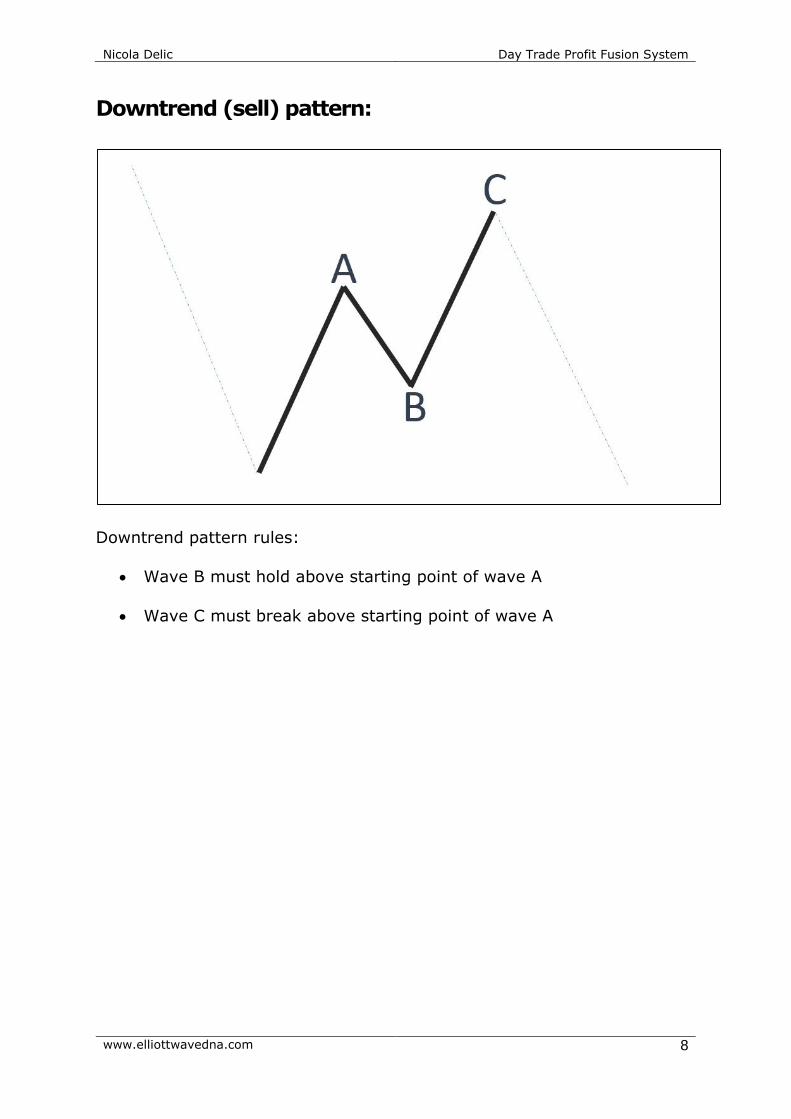
Downtrend (sell) pattern:
Downtrend pattern rules:
Wave B must hold above starting point of wave A
Wave C must break above starting point of wave A
Nicola Delic Day Trade Profit Fusion System
www.elliottwavedna.com 9
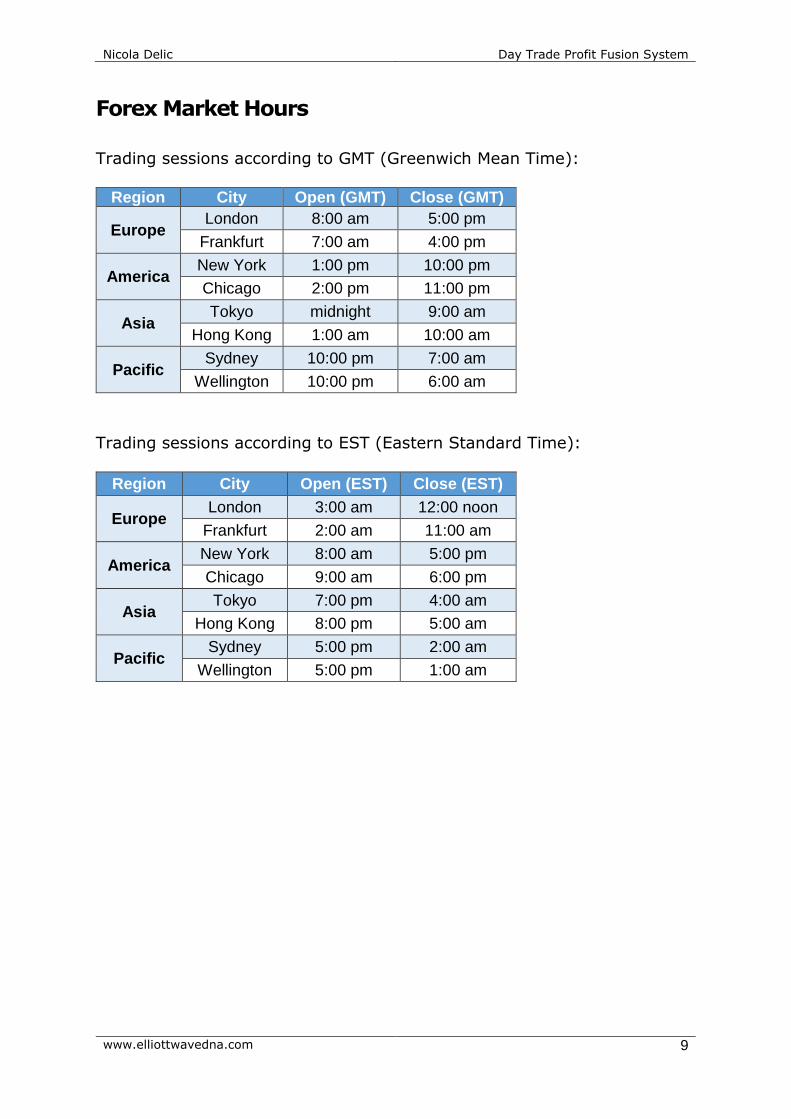
Forex Market Hours
Trading sessions according to GMT (Greenwich Mean Time):
Region City Open (GMT) Close (GMT)
Europe London 8:00 am 5:00 pm
Frankfurt 7:00 am 4:00 pm
America New York 1:00 pm 10:00 pm
Chicago 2:00 pm 11:00 pm
Asia Tokyo midnight 9:00 am
Hong Kong 1:00 am 10:00 am
Pacific Sydney 10:00 pm 7:00 am
Wellington 10:00 pm 6:00 am
Trading sessions according to EST (Eastern Standard Time):
Region City Open (EST) Close (EST)
Europe London 3:00 am 12:00 noon
Frankfurt 2:00 am 11:00 am
America New York 8:00 am 5:00 pm
Chicago 9:00 am 6:00 pm
Asia Tokyo 7:00 pm 4:00 am
Hong Kong 8:00 pm 5:00 am
Pacific Sydney 5:00 pm 2:00 am
Wellington 5:00 pm 1:00 am
Nicola Delic Day Trade Profit Fusion System
www.elliottwavedna.com 10
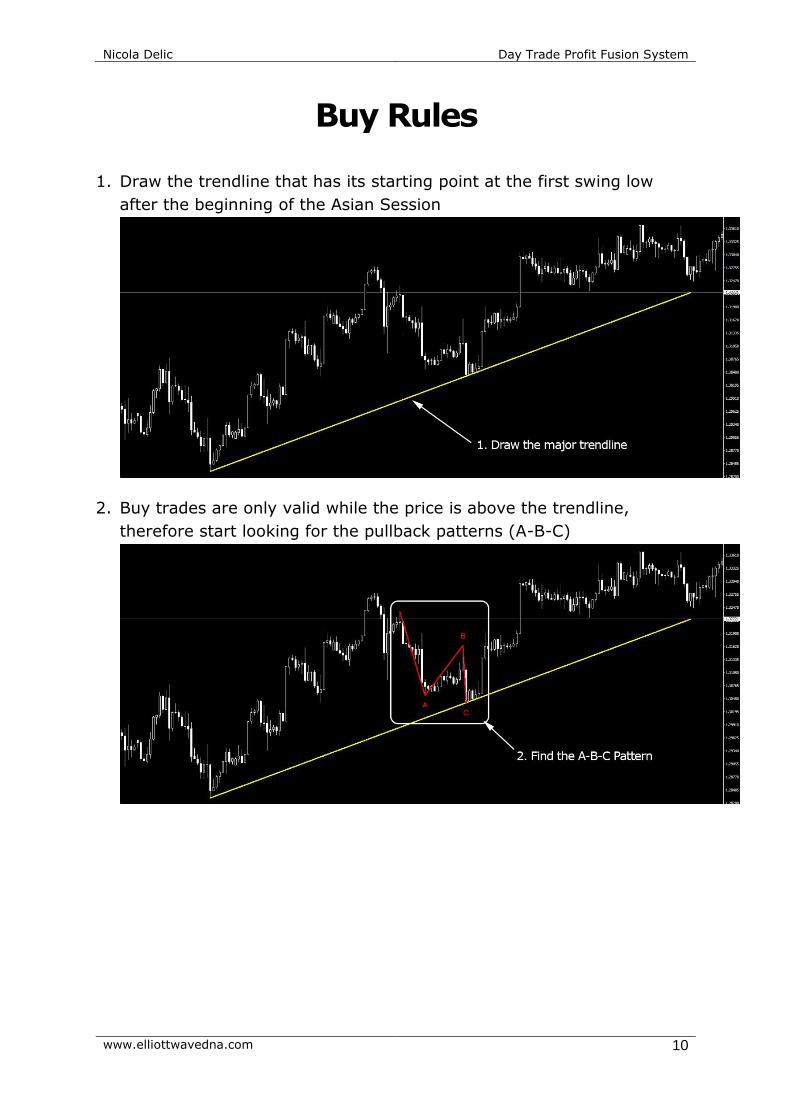
Buy Rules
1. Draw the trendline that has its starting point at the first swing low
after the beginning of the Asian Session
2. Buy trades are only valid while the price is above the trendline,
therefore start looking for the pullback patterns (A-B-C)
Nicola Delic Day Trade Profit Fusion System
www.elliottwavedna.com 11
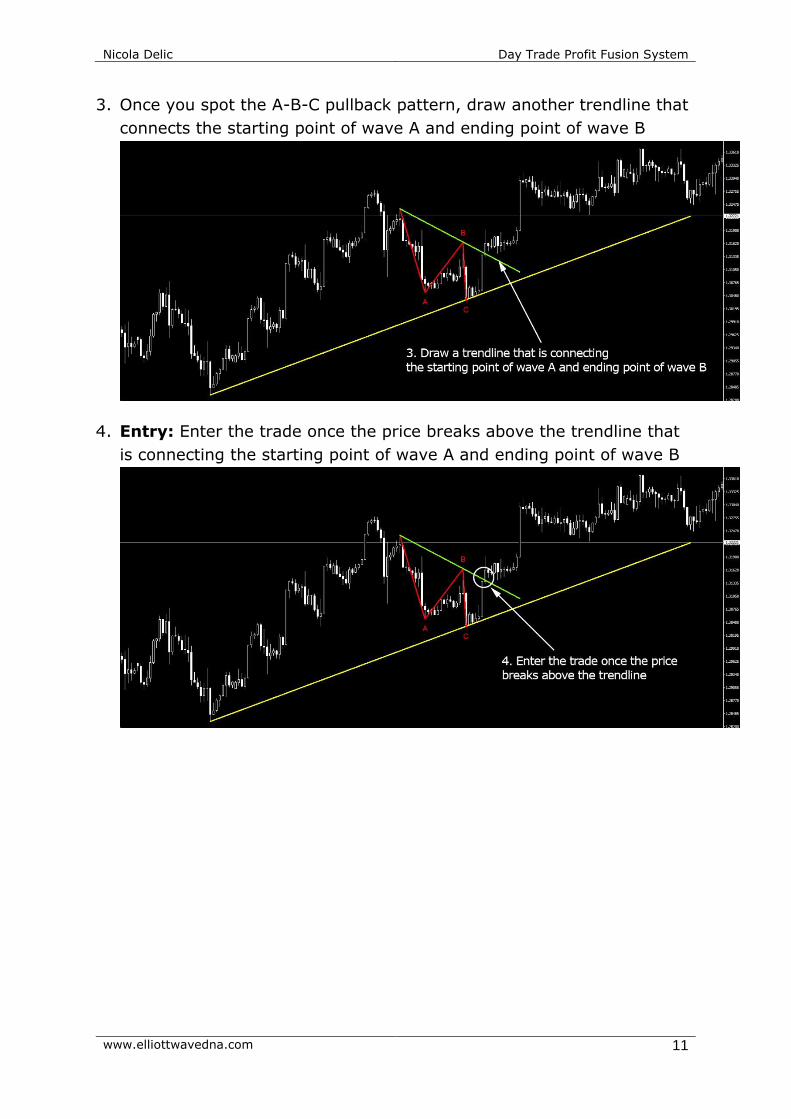
3. Once you spot the A-B-C pullback pattern, draw another trendline that
connects the starting point of wave A and ending point of wave B
4. Entry: Enter the trade once the price breaks above the trendline that
is connecting the starting point of wave A and ending point of wave B
Nicola Delic Day Trade Profit Fusion System
www.elliottwavedna.com 12
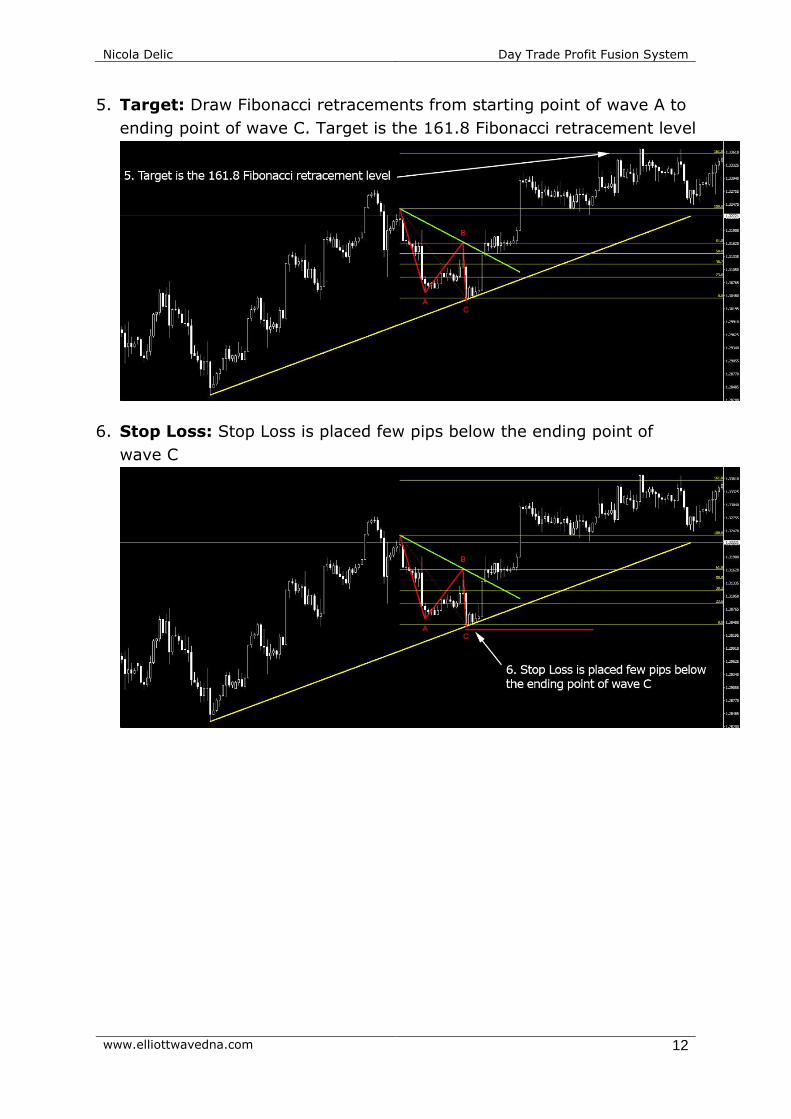
5. Target: Draw Fibonacci retracements from starting point of wave A to
ending point of wave C. Target is the 161.8 Fibonacci retracement level
6. Stop Loss: Stop Loss is placed few pips below the ending point of
wave C
Nicola Delic Day Trade Profit Fusion System
www.elliottwavedna.com 13
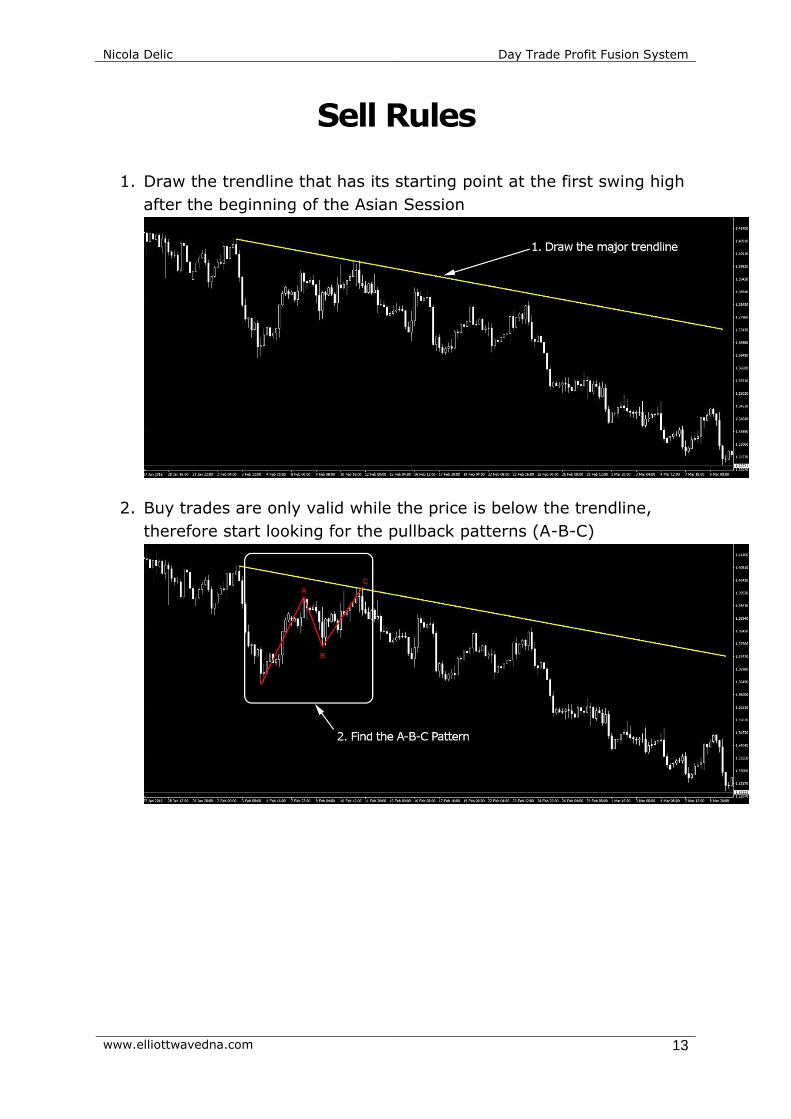
Sell Rules
1. Draw the trendline that has its starting point at the first swing high
after the beginning of the Asian Session
2. Buy trades are only valid while the price is below the trendline,
therefore start looking for the pullback patterns (A-B-C)
Nicola Delic Day Trade Profit Fusion System
www.elliottwavedna.com 14
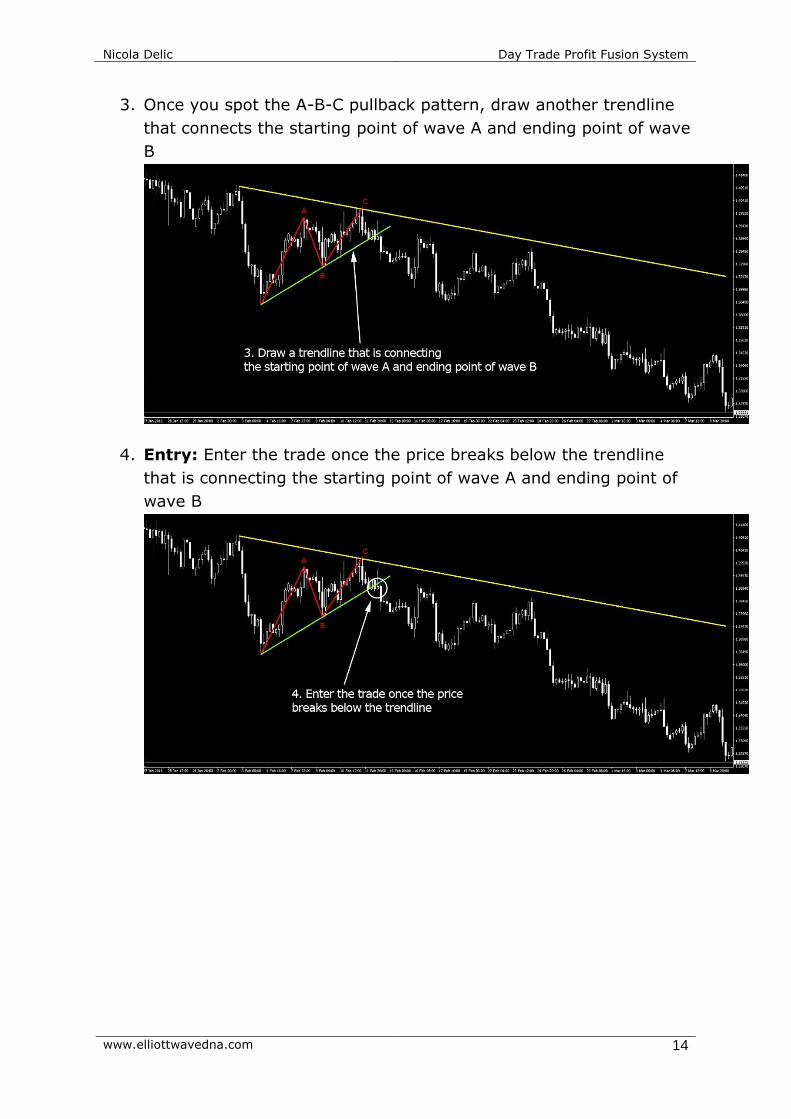
3. Once you spot the A-B-C pullback pattern, draw another trendline
that connects the starting point of wave A and ending point of wave
B
4. Entry: Enter the trade once the price breaks below the trendline
that is connecting the starting point of wave A and ending point of
wave B

Nicola Delic Day Trade Profit Fusion System
www.elliottwavedna.com 15
5. Target: Draw Fibonacci retracements from starting point of wave A
to ending point of wave C. Target is the 161.8 Fibonacci
retracement level
6. Stop Loss: Stop Loss is placed few pips above the ending point of
wave C
Nicola Delic Day Trade Profit Fusion System
www.elliottwavedna.com 16
Examples
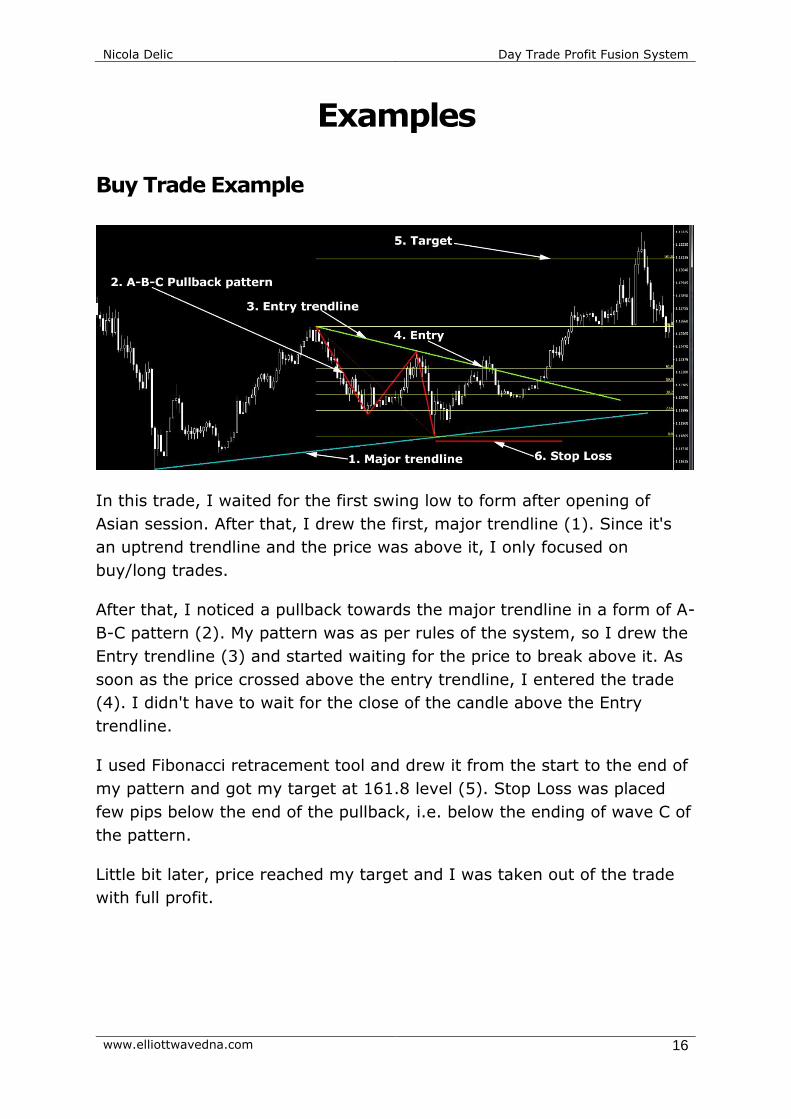
Buy Trade Example
In this trade, I waited for the first swing low to form after opening of
Asian session. After that, I drew the first, major trendline (1). Since it's
an uptrend trendline and the price was above it, I only focused on
buy/long trades.
After that, I noticed a pullback towards the major trendline in a form of A-
B-C pattern (2). My pattern was as per rules of the system, so I drew the
Entry trendline (3) and started waiting for the price to break above it. As
soon as the price crossed above the entry trendline, I entered the trade
(4). I didn't have to wait for the close of the candle above the Entry
trendline.
I used Fibonacci retracement tool and drew it from the start to the end of
my pattern and got my target at 161.8 level (5). Stop Loss was placed
few pips below the end of the pullback, i.e. below the ending of wave C of
the pattern.
Little bit later, price reached my target and I was taken out of the trade
with full profit.
Nicola Delic Day Trade Profit Fusion System
www.elliottwavedna.com 17
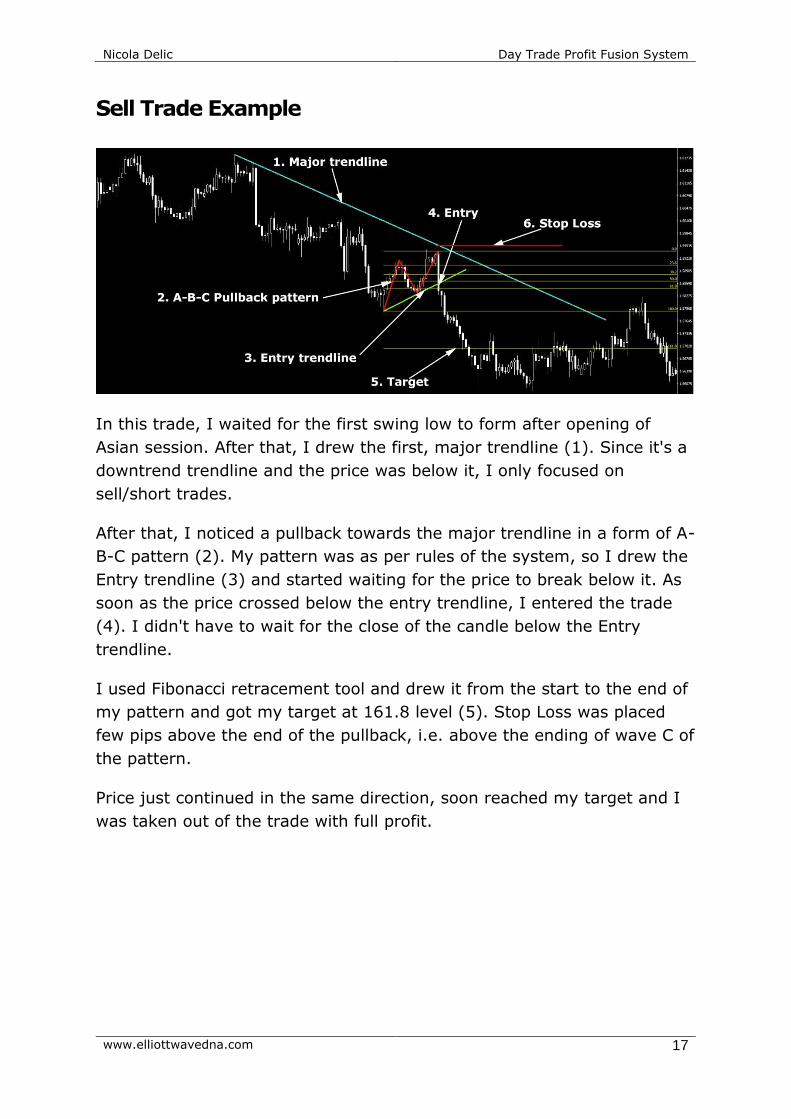
Sell Trade Example
In this trade, I waited for the first swing low to form after opening of
Asian session. After that, I drew the first, major trendline (1). Since it's a
downtrend trendline and the price was below it, I only focused on
sell/short trades.
After that, I noticed a pullback towards the major trendline in a form of A-
B-C pattern (2). My pattern was as per rules of the system, so I drew the
Entry trendline (3) and started waiting for the price to break below it. As
soon as the price crossed below the entry trendline, I entered the trade
(4). I didn't have to wait for the close of the candle below the Entry
trendline.
I used Fibonacci retracement tool and drew it from the start to the end of
my pattern and got my target at 161.8 level (5). Stop Loss was placed
few pips above the end of the pullback, i.e. above the ending of wave C of
the pattern.
Price just continued in the same direction, soon reached my target and I
was taken out of the trade with full profit.
Nicola Delic Day Trade Profit Fusion System
www.elliottwavedna.com 18
Conclusion
I would like to share a few powerful tips that will help you get the most
out of trading this system and give you the very best results.
It might be different for you and that’s all right, but I’m sure you’re
curious to know the pairs that I trade so here they are: EUR/USD,
GBP/USD, USD/CHF, USD/JPY, AUD/USD, USD/CAD, EUR/JPY and
GBP/JPY.
Tighten your Stop Losses around High Impact News Releases or avoid
trading at least 15 minutes before and after these events.
I have also found that the best results can be achieved on the 5 and 15
minute timeframes.
This system has served me very well and I know that you will enjoy
trading it too. If you can follow the rules and these simple guidelines you
are well on your way to success as a trader.
I wish you the very best in all your trading endeavors.