Embed Size (px)
Citation preview
Risk Decision Making for Buildings – From Owners to Society
Mary ComerioUniversity of California, Berkeley
PEER Summative Meeting 13 June 2007
PEER Summative Meeting
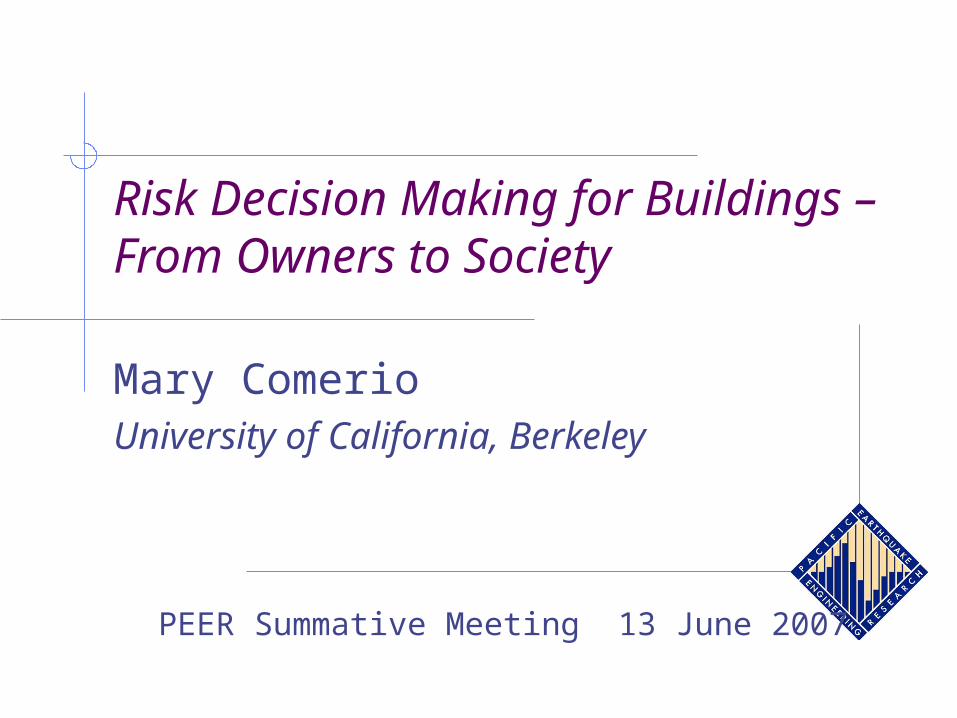
Defining Links Between Planning, Policy, Economics and Earthquake Engineering
Workshop in May 1998 Raised Questions: How to integrate disciplines and find a common
language? Can models from various disciplines be linked? What should performance standards look like? Can a standardized loss-accounting system
be developed? What are meaningful metrics? What are financial implications of performance
standards? What is known about adoption, implementation
and enforcement of performance based codes?
PEER Summative Meeting
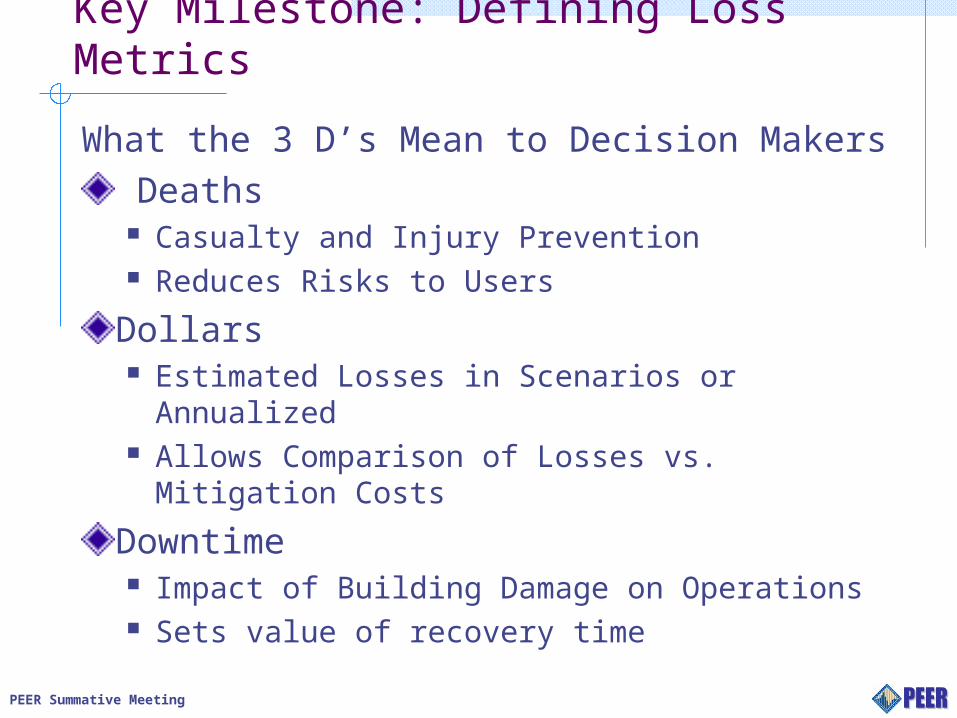
Key Milestone: Defining Loss Metrics
What the 3 D’s Mean to Decision Makers Deaths Casualty and Injury Prevention Reduces Risks to Users
Dollars Estimated Losses in Scenarios or Annualized Allows Comparison of Losses vs. Mitigation
Costs
Downtime Impact of Building Damage on Operations Sets value of recovery time
PEER Summative Meeting
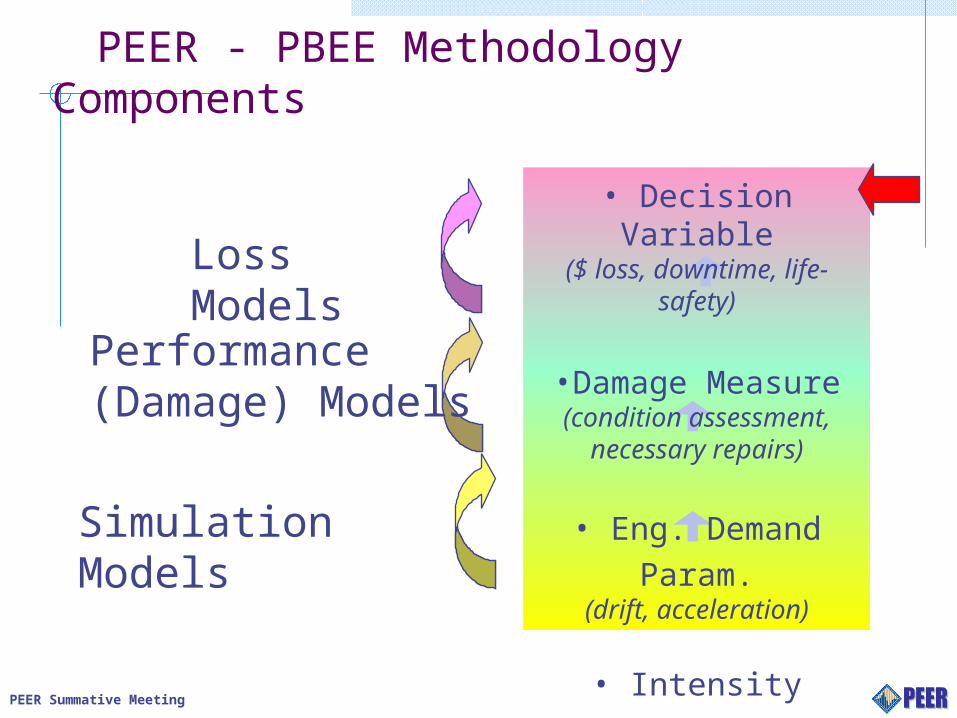
PEER - PBEE Methodology Components
• Decision Variable($ loss, downtime, life-safety)
•Damage Measure(condition assessment,
necessary repairs)
• Eng. Demand Param.(drift, acceleration)
• Intensity Measure (Sa, Sv, duration …)
Simulation Models
Performance (Damage) Models
Loss Models
PEER Summative Meeting
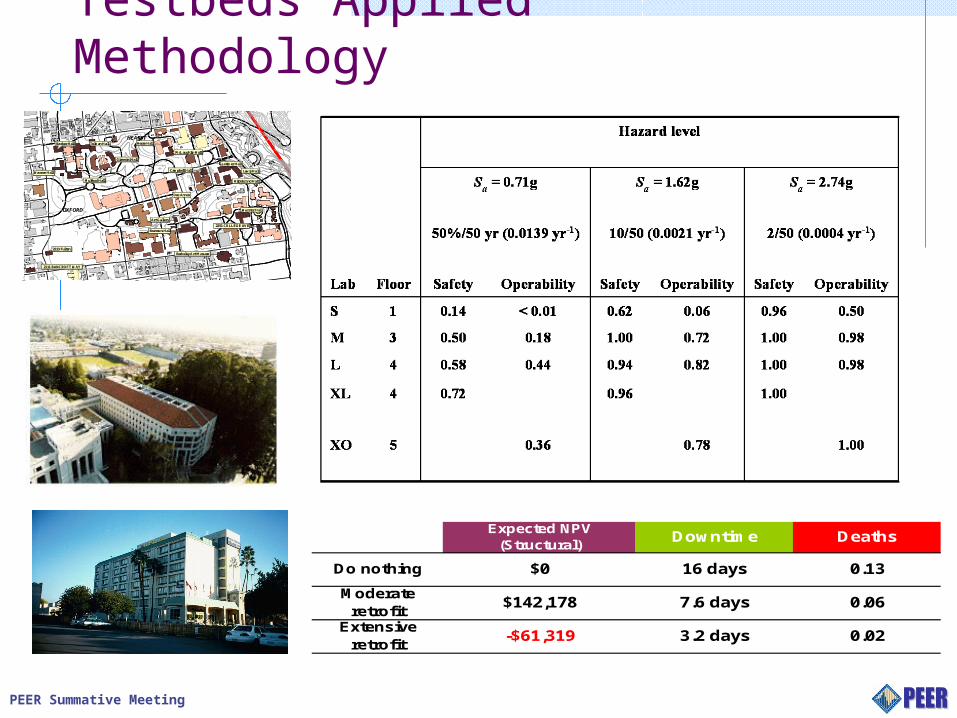
Testbeds Applied Methodology
0.2 0 0.2 0.4 0.6 Miles
Map 8.2Building Downtime in Months from a Rare Earthquake
StreetsHayward FaultTopo LinesNon-core Buildings
Downtime for Building in Months0 - 12 - 45 - 1213 - 2425 - 40
N
EW
S
#
OXFORD
#
HEARSTBarker Hall Tolman Hall
Giannini Hall
Hesse Hall
Warren Hall
Mulford Hall
Campbell Hall
McLaughlin Hall
Latimer Hall
Lewis Hall
Hildebrand Hall
Wurster Hall
2251 COLLEGE AVE
Berkeley Art Musuem
Art Gallery
Barrows Hall
2223 Fulton
2111 BANCROFT WAY
Doe Annex
0.06
Extensive retrofit
-$61,319 3.2 days 0.02
Moderate retrofit
$142,178 7.6 days
Deaths
Do nothing $0 16 days 0.13
Expected NPV (Structural)
Downtime
PEER Summative Meeting
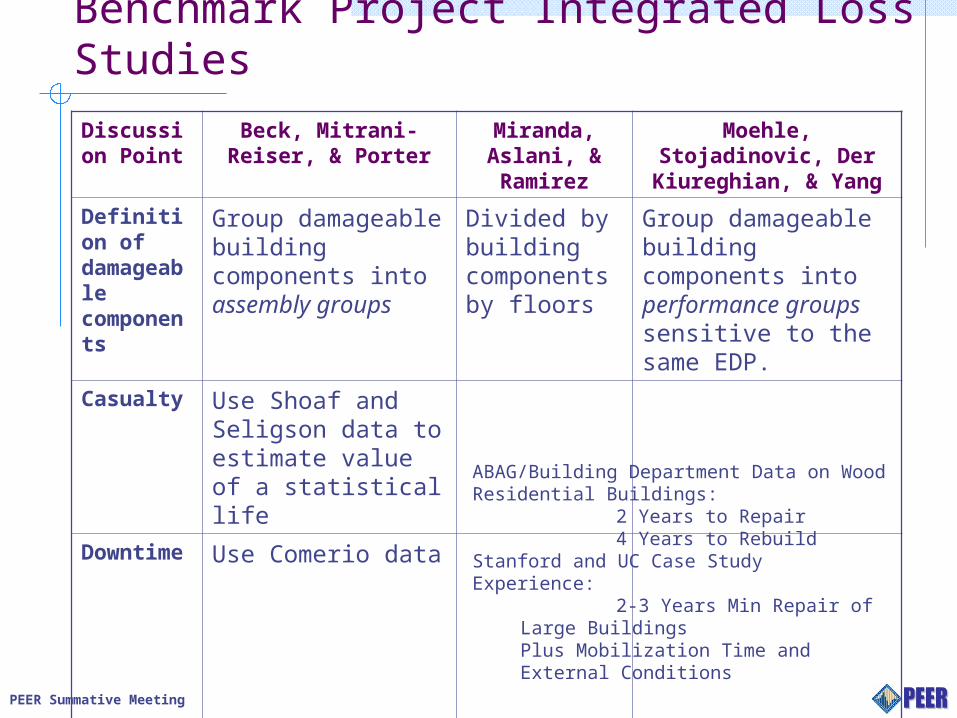
Benchmark Project Integrated Loss Studies
Discussion Point
Beck, Mitrani-Reiser, & Porter
Miranda, Aslani, & Ramirez
Moehle, Stojadinovic, Der Kiureghian, & Yang
Definition of damageable components
Group damageable building components into assembly groups
Divided by building components by floors
Group damageable building components into performance groups sensitive to the same EDP.
Casualty Use Shoaf and Seligson data to estimate value of a statistical life
Downtime Use Comerio data ABAG/Building Department Data on Wood Residential Buildings:
2 Years to Repair4 Years to Rebuild
Stanford and UC Case Study Experience:2-3 Years Min Repair of Large
BuildingsPlus Mobilization Time and External Conditions
PEER Summative Meeting
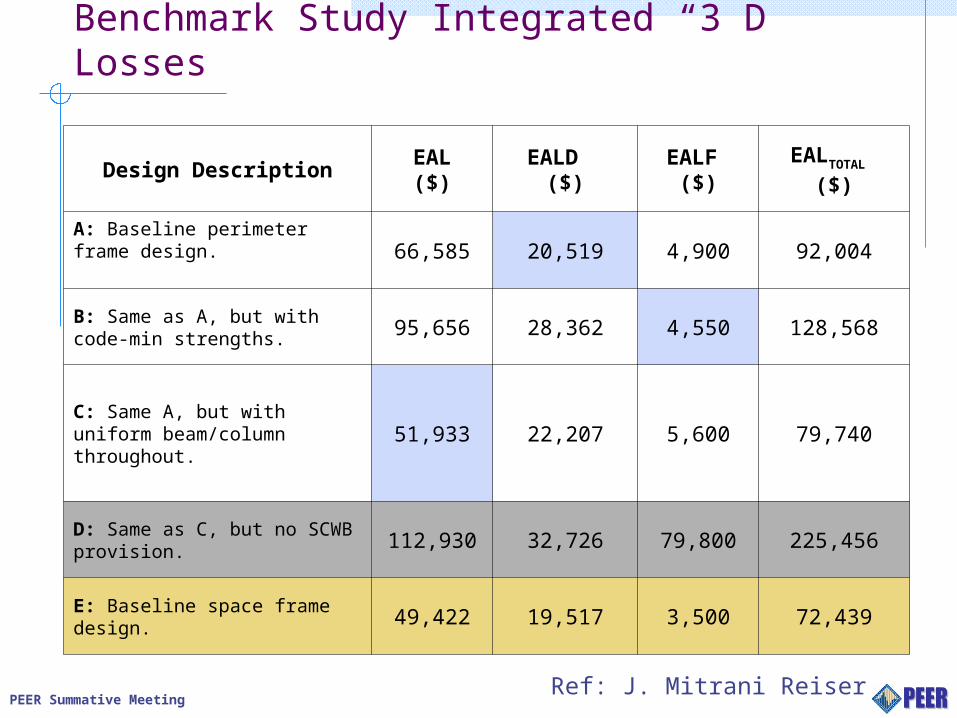
Design DescriptionEAL($)
EALD ($)EALF
($)EALTOTAL
($)
A: Baseline perimeter frame design. 66,585 20,519 4,900 92,004
B: Same as A, but with code-min strengths. 95,656 28,362 4,550 128,568
C: Same A, but with uniform beam/column throughout. 51,933 22,207 5,600 79,740
D: Same as C, but no SCWB provision. 112,930 32,726 79,800 225,456
E: Baseline space frame design. 49,422 19,517 3,500 72,439
Benchmark Study Integrated “3 D” Losses
Ref: J. Mitrani Reiser
PEER Summative Meeting
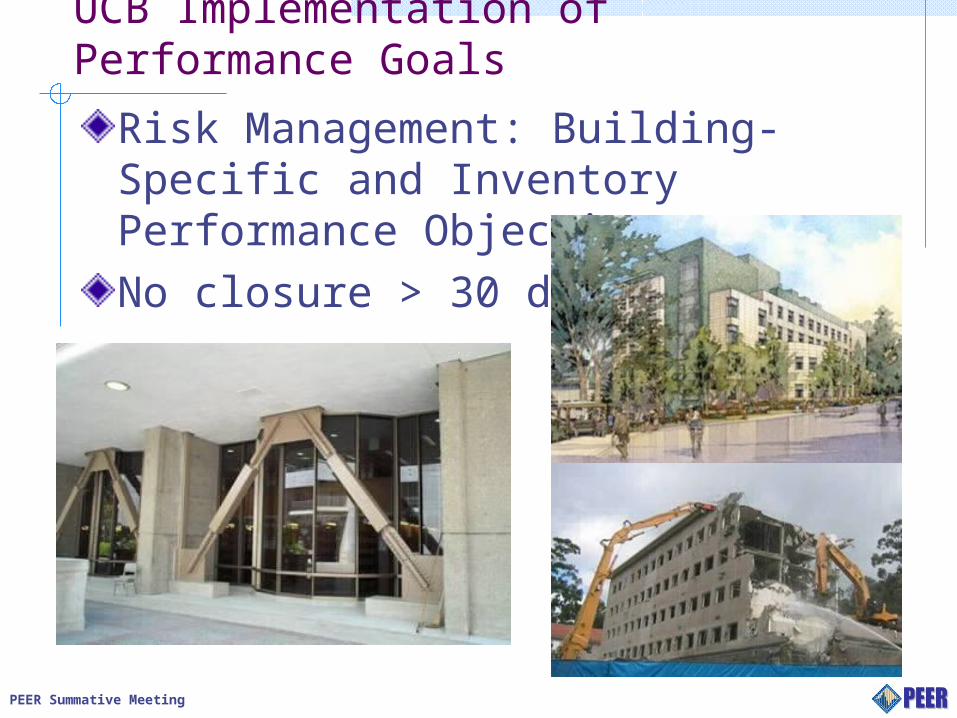
UCB Implementation of Performance Goals
Risk Management: Building-Specific and Inventory Performance ObjectivesNo closure > 30 days
PEER Summative Meeting
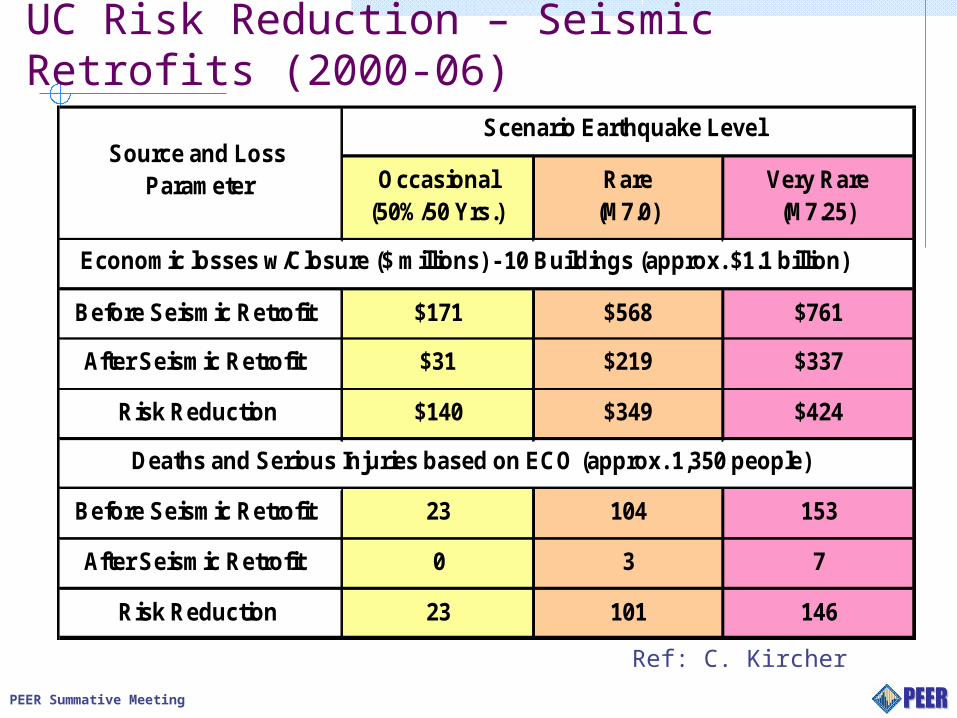
UC Risk Reduction – Seismic Retrofits (2000-06)
Occasional (50%/50 Yrs.)
Rare (M7.0)
Very Rare (M7.25)
Before Seismic Retrofit $171 $568 $761
After Seismic Retrofit $31 $219 $337
Risk Reduction $140 $349 $424
Before Seismic Retrofit 23 104 153
After Seismic Retrofit 0 3 7
Risk Reduction 23 101 146
Source and Loss Parameter
Scenario Earthquake Level
Economic losses w/Closure ($ millions) - 10 Buildings (approx. $1.1 billion)
Deaths and Serious Injuries based on ECO (approx. 1,350 people)
Ref: C. Kircher
PEER Summative Meeting
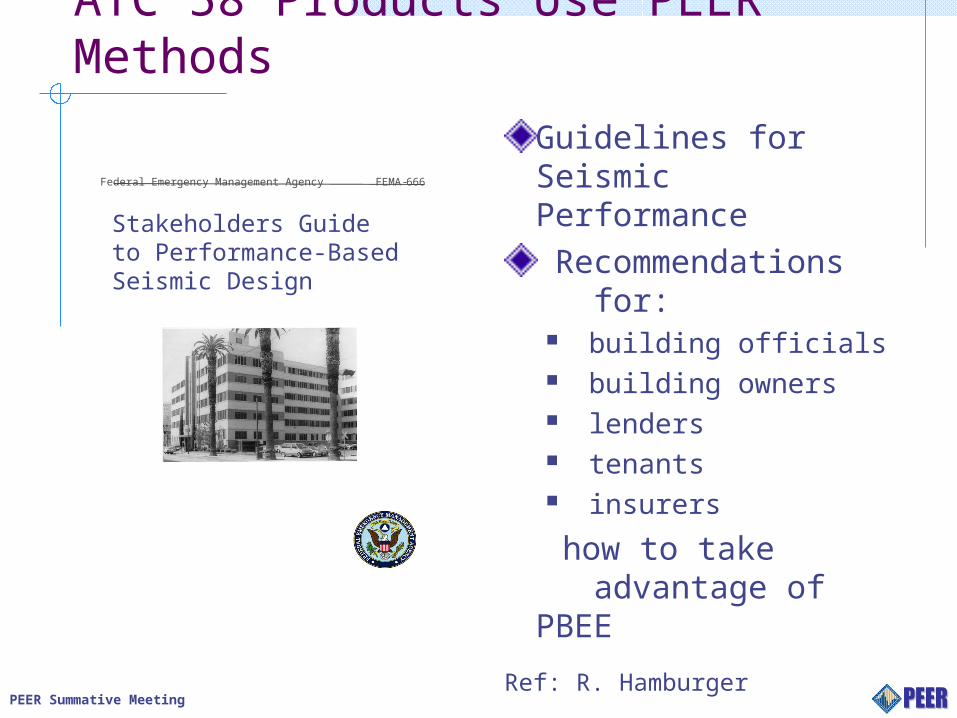
ATC 58 Products Use PEER Methods
Guidelines for Seismic Performance Recommendations for: building officials building owners lenders tenants insurers
how to take advantage of PBEE
FEMA-666Federal Emergency Management Agency
Stakeholders Guideto Performance-BasedSeismic Design
Ref: R. Hamburger
PEER Summative Meeting
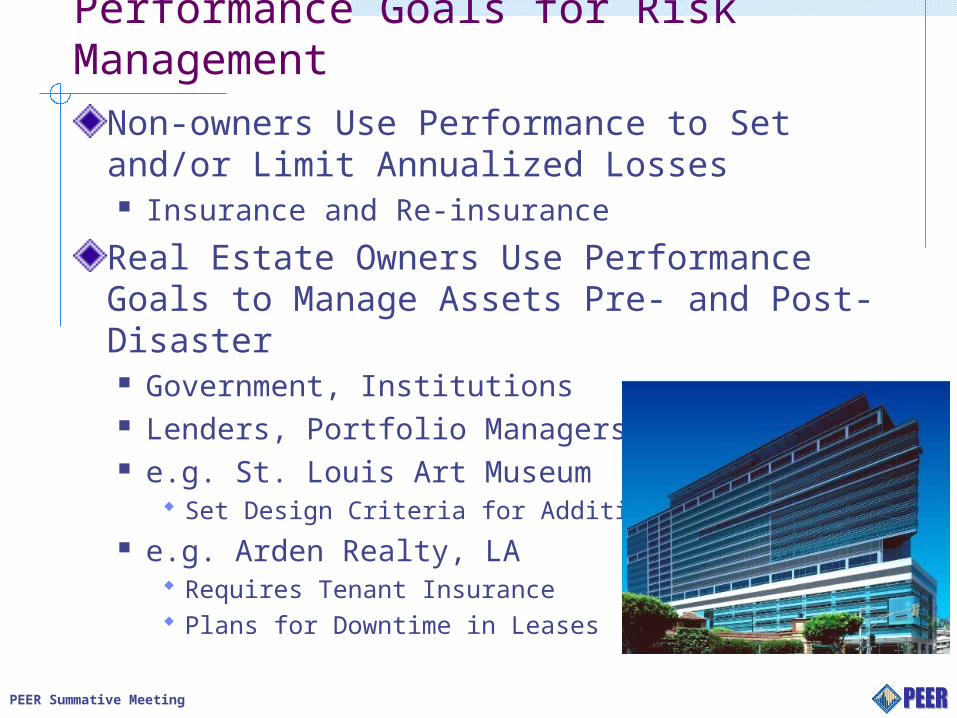
Performance Goals for Risk Management
Non-owners Use Performance to Set and/or Limit Annualized Losses Insurance and Re-insurance
Real Estate Owners Use Performance Goals to Manage Assets Pre- and Post-Disaster Government, Institutions Lenders, Portfolio Managers e.g. St. Louis Art Museum
Set Design Criteria for Addition e.g. Arden Realty, LA
Requires Tenant Insurance Plans for Downtime in Leases
PEER Summative Meeting
PEER Established a Performance Vocabulary
Defining and Costing Damage to Structural and Nonstructural Systems and ContentsDefining and Incorporating the Risk to Life in Financial TermsDefining Mobilization and Repair Time; Establishing Baseline DataUsed by Engineers, Owners, Insurance, Portfolio Managers, Government, etc.
![SUMMATIVE ASSESSMENT- I & II - stdavsuratgarh.orgstdavsuratgarh.org/documents/Publication_S.St16_46... · SOCIAL SCIENCE SUMMATIVE ASSESSMENT- I & II [264] SOCIAL SCIENCE Summative](https://img.pdfslide.us/doc/110x75/5b2f04f37f8b9a94168c482a/summative-assessment-i-ii-social-science-summative-assessment-i-ii-264.jpg)