Embed Size (px)
Citation preview

Hydrographic Authority
PACIFIC REGIONAL NAVIGATION INITIATIVE
TOKELAU Hydrographic Risk Assessment
Report Number: RNALZ17002
Version: V1.0
Date: 15 October 2017
TOKELAU Hydrographic Risk Assessment
_________________________________________________________________________________________
ii
Rod Nairn and Associates Pty Ltd
Hydrographic and Maritime Consultants
Supported by the New Zealand Aid Programme
PACIFIC REGIONAL NAVIGATION INITIATIVE
TOKELAU Hydrographic Risk Assessment
A joint production by: Land Information New Zealand
Level 7 Radio New Zealand House
155 The Terrace
Wellington
NEW ZEALAND
and
Rod Nairn & Associates Pty Ltd
Hydrographic and Maritime Consultants
ABN 50 163 730 58
42 Tamarind Drive
Cordeaux Heights NSW
AUSTRALIA
Authors: Rod Nairn, Michael Beard, Stuart Caie, Ian Harrison, James
O’Brien
Disclaimer: The views expressed in this publication do not necessarily
reflect those of the New Zealand Government.
Satellite AIS data under licence from ORBCOM (augmented by IHS Global Pte Ltd)
TOKELAU Hydrographic Risk Assessment _________________________________________________________________________________________
RNA 20171015_V1.0 iii
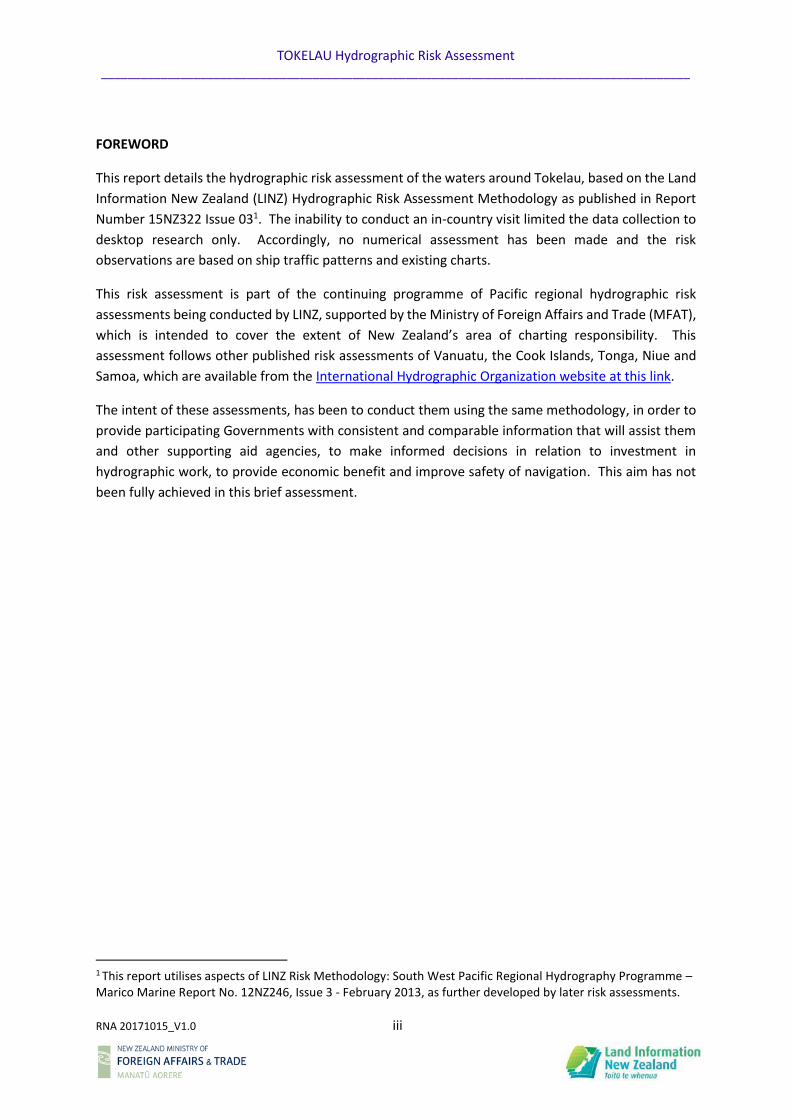
FOREWORD
This report details the hydrographic risk assessment of the waters around Tokelau, based on the Land
Information New Zealand (LINZ) Hydrographic Risk Assessment Methodology as published in Report
Number 15NZ322 Issue 031. The inability to conduct an in-country visit limited the data collection to
desktop research only. Accordingly, no numerical assessment has been made and the risk
observations are based on ship traffic patterns and existing charts.
This risk assessment is part of the continuing programme of Pacific regional hydrographic risk
assessments being conducted by LINZ, supported by the Ministry of Foreign Affairs and Trade (MFAT),
which is intended to cover the extent of New Zealand’s area of charting responsibility. This
assessment follows other published risk assessments of Vanuatu, the Cook Islands, Tonga, Niue and
Samoa, which are available from the International Hydrographic Organization website at this link.
The intent of these assessments, has been to conduct them using the same methodology, in order to
provide participating Governments with consistent and comparable information that will assist them
and other supporting aid agencies, to make informed decisions in relation to investment in
hydrographic work, to provide economic benefit and improve safety of navigation. This aim has not
been fully achieved in this brief assessment.
1 This report utilises aspects of LINZ Risk Methodology: South West Pacific Regional Hydrography Programme – Marico Marine Report No. 12NZ246, Issue 3 - February 2013, as further developed by later risk assessments.
TOKELAU Hydrographic Risk Assessment
_________________________________________________________________________________________
RNA 20171015_V1.0 iv
This page intentionally blank
TOKELAU Hydrographic Risk Assessment
_________________________________________________________________________________________
RNA 20171015_V1.0 v
EXECUTIVE SUMMARY
0.1 Tokelau is a group of three coral atolls of Atafu, Nukunonu, and Fakaofo. It has a total
land area of approximately 12km2 but an EEZ of 318,990km2. Tokelau is located in the southern
Pacific Ocean between latitude 8° and 10° South and longitude 171° and 173° West. Situated mid-
way between Hawaii and New Zealand, Tokelau is approximately 480km north of Samoa.
0.2 The current nautical charting consists of one 1:500,000 scale general chart, NZ 885
covering the three atolls and surrounding territorial seas. The three atolls of Tokelau are also
covered by larger 1:100,000 scale plans. The territorial seas and the route between the atolls has
been surveyed to a scale of either 1:50,000 or 1:100,000 but the remaining areas of the EEZ have
only been charted from reconnaissance scale survey or general passage soundings. The Tokelau
EEZ is charted on small scale ocean navigation charts NZ 14629 (INT 629) scale 1:1,500,000; NZ
14605 (INT 605) scale 1:3,500,000; NZ 14060 (INT 60) scale 1: 10,000,000; NZ 14061 (INT 61) scale
1: 10,000,000; and NZ 14052 (INT 52) scale 1: 10,000,000.
0.3 Hazards to navigation. The majority of the EEZ is very deep-water and there are no
offshore features and dangers apart from: a shoal patch reported (1977) some 190 km north east
of Fakaofo (in position 7° 43’.3 South, 170° 22.7 West), and reported breakers (1966) west of Atafu
towards the outer limits of the EEZ (in position 8° 46’.9 South, 176° 25’.8 West). Considering the
amount of fishing vessel traffic near these reported features, and the general depths of 5,000m,
neither of these are considered likely to exist or present dangers to surface navigation.
0.4 There is substantial maritime traffic that traverses the Tokelau EEZ, these vessels include
tankers, general cargo, fishing, passenger, and occasional recreational and military vessels,
however most of this traffic traverses in deep water, generally keeps well clear of the Tokelau
atolls and does not pass within Tokelau territorial seas. Occasionally a recreational vessel visits a
Tokelau atoll and the current charting is adequate to meet this requirement, especially given the
shallow draught of such vessels.
0.5 The only regular ships visiting Tokelau are: a Tokelauan Government general cargo and
passenger re-supply vessel on a two-weekly cycle, and a chartered resupply vessel from Apia,
operated by the Samoan Shipping Corporation. These vessels utilise local knowledge to augment
the charted information and are able to navigate safely with the existing chart coverage.
0.6 As no in-country visit was undertaken during this assessment, there was no opportunity
to assess the need for charting of the internal atoll lagoons to support domestic purposes.
However, as there are no navigable passages for international vessels into these lagoons there is
no international obligation to provide nautical charts of them.
TOKELAU Hydrographic Risk Assessment _________________________________________________________________________________________
RNA 20171015_V1.0 vi
TABLE OF CONTENTS
FOREWORD ............................................................................................................................................ iii
EXECUTIVE SUMMARY ............................................................................................................................ v
TABLE OF CONTENTS .............................................................................................................................. vi
List of Figures ................................................................................................................................... viii
List of Annexes ................................................................................................................................... ix
Glossary and Definitions ......................................................................................................................... x
1. INTRODUCTION ............................................................................................................................... 1
1.1 Aim .......................................................................................................................................... 1
1.2 Methodology ........................................................................................................................... 1
2. COUNTRY INFORMATION AND ECONOMY ..................................................................................... 3
2.1 Atafu, Nukunonu, and Fakaofo Atolls ..................................................................................... 3
2.2 Economic Overview............................................................................................................... 10
2.3 Economic Sectors .................................................................................................................. 11
2.3.1 Agriculture..................................................................................................................... 11
2.3.2 Fishing ........................................................................................................................... 12
2.3.3 Tourism ......................................................................................................................... 15
2.4 Energy/Fuel Security ............................................................................................................. 17
2.5 Economic Summary .............................................................................................................. 19
3 CULTURAL ASPECTS AND TRADITIONAL RESOURCE MANAGEMENT ........................................... 20
3.1 Cultural Aspects .................................................................................................................... 20
3.2 Culture and Resource Management ..................................................................................... 20
3.3 Cultural Summary ................................................................................................................. 21
4 Maritime Overview ....................................................................................................................... 22
4.1 Description of Atolls .............................................................................................................. 22
4.2 Nautical Charting and Navigation ......................................................................................... 24
4.3 Main Harbours, Ports and Anchorages ................................................................................. 25
4.4 Regional Shipping Movements ............................................................................................. 27
4.5 Inter-Island Movements........................................................................................................ 28
4.6 Other Maritime Assets .......................................................................................................... 29
4.7 Maritime Summary ............................................................................................................... 29
TOKELAU Hydrographic Risk Assessment _________________________________________________________________________________________
RNA 20171015_V1.0 vii
5. Key sites of Significance ................................................................................................................ 30
5.1 Sites of Environmental Significance – Overview ................................................................... 30
5.2 Sites of Cultural Significance – Marine Reserves .................................................................. 30
5.3 Significant Site Summary ...................................................................................................... 31
6. INTERNATIONAL SHIPPING TRAFFIC DATA (AIS) ........................................................................... 32
6.1 Introduction .......................................................................................................................... 32
6.2 Conclusion - International Shipping Traffic Data (AIS) .......................................................... 34
7. RISK ANALYSIS ............................................................................................................................... 35
7.1 Introduction .......................................................................................................................... 35
8. REFERENCES .................................................................................................................................. 36
TOKELAU Hydrographic Risk Assessment _________________________________________________________________________________________
RNA 20171015_V1.0 viii
List of Figures
Figure 1 South West Pacific (Source: Encyclopaedia Britannica) ............................................................ 3
Figure 2 The islands of Tokelau (Source: SPC) ........................................................................................ 4
Figure 3 Tokelau (Source: Encyclopaedia Britannica) ............................................................................ 5
Figure 4 Tokelau EEZ (Source: Marine Regions) ..................................................................................... 6
Figure 5 Ethnic groups in Tokelau (Source: The World Fact Book) ........................................................ 7
Figure 6 Population spread across Tokelau - by atoll (Source: Government of Tokelau) ...................... 8
Figure 7 Governance structure in Tokelau (Source: World Health Organization) .................................. 9
Figure 8 Tokelau GDP figures - FY 12/13 to FY 15/16 .......................................................................... 11
Figure 9 Fishing effort by method and atoll (%) ................................................................................... 13
Figure 10 Four new aluminium boats being delivered to one of the atolls in Tokelau (Source: SPC) .. 13
Figure 11 EEZ - Distribution of purse-seine catches by species (Source: SPC) ..................................... 14
Figure 12 EEZ - Distribution of longline catches by species (Source: SPC) ........................................... 14
Figure 13 Ship to shore - Fakaofo (Source: Government of Tokelau) ................................................... 16
Figure 14 Transporting passengers ashore in Tokelau (Source: Government of Tokelau) ................... 16
Figure 15 Nukunonu (Source: www.turkey-visit.com) ......................................................................... 17
Figure 16 Solar Array on Nukunonu atoll (Source: IPT Renewables) ................................................... 18
Figure 17 Landing petrol drums ashore in Tokelau .............................................................................. 18
Figure 18 Fakaofo (Source: LINZ and GoogleEarth) ............................................................................. 22
Figure 19 Nukunono (Source: LINZ and GoogleEarth) ......................................................................... 23
Figure 20 Atafu (Source: LINZ and GoogleEarth) ................................................................................. 24
Figure 21 MV Mataliki anchoring off Fakaofo (Source: Government of Tokelau)................................ 25
Figure 22 Barge operations on Nukunonu (Source: Government of Tokelau) .................................... 25
Figure 23 Off-loading cargo in Tokelau (Source: Government of Tokelau) .......................................... 26
Figure 24 Unloading cargo by truck (Source: Government of Tokelau) ............................................... 26
Figure 25 MV Mataliki (Source: Western Marine Shipyard Limited) .................................................... 27
Figure 26 MV Mataliki Schedule - Samoa to Tokelau - April to December 2017 (Source: Government
of Tokelau) ............................................................................................................................................ 28
Figure 27: All vessel tracks Tokelau EEZ to Samoa, for the analysis period.......................................... 32
Figure 28: Reported shoal area (1977) ................................................................................................ 33
Figure 29: All vessel tracks near Tokelau atolls, colour coded by type ................................................ 33
TOKELAU Hydrographic Risk Assessment _________________________________________________________________________________________
RNA 20171015_V1.0 ix
List of Annexes
A. Event Trees
B. GIS Track Creation and Processing
C. Not issued
D. Not issued
E. Hydrographic Risk Factor Weighting Matrix
F. Not issued
G. General Benefits of Hydrographic Surveys
TOKELAU Hydrographic Risk Assessment _________________________________________________________________________________________
RNA 20171015_V1.0 x
Glossary and Definitions2
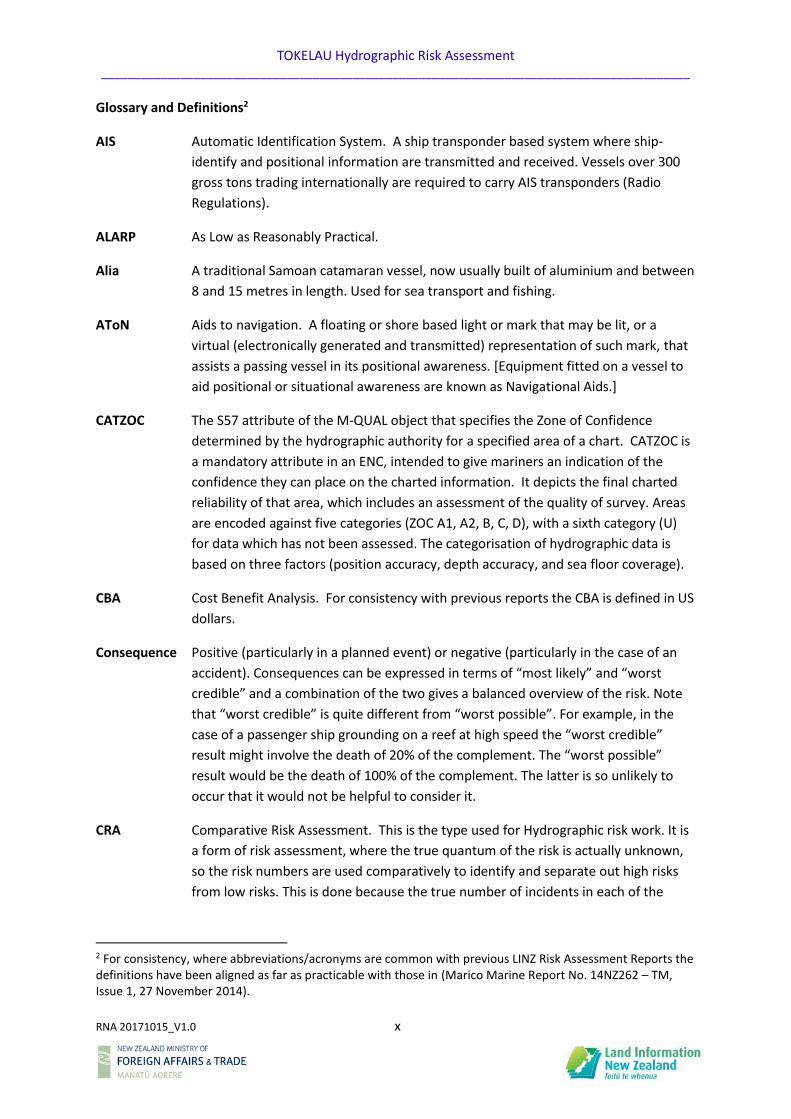
AIS Automatic Identification System. A ship transponder based system where ship-
identify and positional information are transmitted and received. Vessels over 300
gross tons trading internationally are required to carry AIS transponders (Radio
Regulations).
ALARP As Low as Reasonably Practical.
Alia A traditional Samoan catamaran vessel, now usually built of aluminium and between
8 and 15 metres in length. Used for sea transport and fishing.
AToN Aids to navigation. A floating or shore based light or mark that may be lit, or a
virtual (electronically generated and transmitted) representation of such mark, that
assists a passing vessel in its positional awareness. [Equipment fitted on a vessel to
aid positional or situational awareness are known as Navigational Aids.]
CATZOC The S57 attribute of the M-QUAL object that specifies the Zone of Confidence
determined by the hydrographic authority for a specified area of a chart. CATZOC is
a mandatory attribute in an ENC, intended to give mariners an indication of the
confidence they can place on the charted information. It depicts the final charted
reliability of that area, which includes an assessment of the quality of survey. Areas
are encoded against five categories (ZOC A1, A2, B, C, D), with a sixth category (U)
for data which has not been assessed. The categorisation of hydrographic data is
based on three factors (position accuracy, depth accuracy, and sea floor coverage).
CBA Cost Benefit Analysis. For consistency with previous reports the CBA is defined in US
dollars.
Consequence Positive (particularly in a planned event) or negative (particularly in the case of an
accident). Consequences can be expressed in terms of “most likely” and “worst
credible” and a combination of the two gives a balanced overview of the risk. Note
that “worst credible” is quite different from “worst possible”. For example, in the
case of a passenger ship grounding on a reef at high speed the “worst credible”
result might involve the death of 20% of the complement. The “worst possible”
result would be the death of 100% of the complement. The latter is so unlikely to
occur that it would not be helpful to consider it.
CRA Comparative Risk Assessment. This is the type used for Hydrographic risk work. It is
a form of risk assessment, where the true quantum of the risk is actually unknown,
so the risk numbers are used comparatively to identify and separate out high risks
from low risks. This is done because the true number of incidents in each of the
2 For consistency, where abbreviations/acronyms are common with previous LINZ Risk Assessment Reports the definitions have been aligned as far as practicable with those in (Marico Marine Report No. 14NZ262 – TM, Issue 1, 27 November 2014).
TOKELAU Hydrographic Risk Assessment _________________________________________________________________________________________
RNA 20171015_V1.0 xi
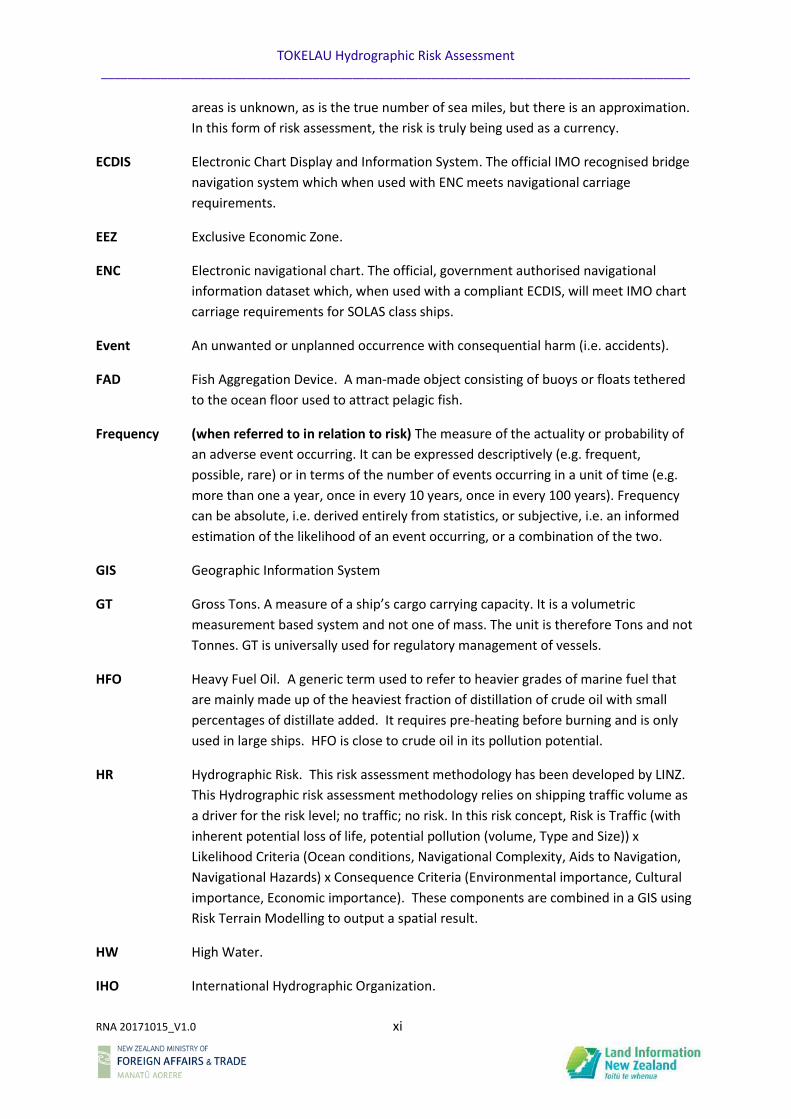
areas is unknown, as is the true number of sea miles, but there is an approximation.
In this form of risk assessment, the risk is truly being used as a currency.
ECDIS Electronic Chart Display and Information System. The official IMO recognised bridge
navigation system which when used with ENC meets navigational carriage
requirements.
EEZ Exclusive Economic Zone.
ENC Electronic navigational chart. The official, government authorised navigational
information dataset which, when used with a compliant ECDIS, will meet IMO chart
carriage requirements for SOLAS class ships.
Event An unwanted or unplanned occurrence with consequential harm (i.e. accidents).
FAD Fish Aggregation Device. A man-made object consisting of buoys or floats tethered
to the ocean floor used to attract pelagic fish.
Frequency (when referred to in relation to risk) The measure of the actuality or probability of
an adverse event occurring. It can be expressed descriptively (e.g. frequent,
possible, rare) or in terms of the number of events occurring in a unit of time (e.g.
more than one a year, once in every 10 years, once in every 100 years). Frequency
can be absolute, i.e. derived entirely from statistics, or subjective, i.e. an informed
estimation of the likelihood of an event occurring, or a combination of the two.
GIS Geographic Information System
GT Gross Tons. A measure of a ship’s cargo carrying capacity. It is a volumetric
measurement based system and not one of mass. The unit is therefore Tons and not
Tonnes. GT is universally used for regulatory management of vessels.
HFO Heavy Fuel Oil. A generic term used to refer to heavier grades of marine fuel that
are mainly made up of the heaviest fraction of distillation of crude oil with small
percentages of distillate added. It requires pre-heating before burning and is only
used in large ships. HFO is close to crude oil in its pollution potential.
HR Hydrographic Risk. This risk assessment methodology has been developed by LINZ.
This Hydrographic risk assessment methodology relies on shipping traffic volume as
a driver for the risk level; no traffic; no risk. In this risk concept, Risk is Traffic (with
inherent potential loss of life, potential pollution (volume, Type and Size)) x
Likelihood Criteria (Ocean conditions, Navigational Complexity, Aids to Navigation,
Navigational Hazards) x Consequence Criteria (Environmental importance, Cultural
importance, Economic importance). These components are combined in a GIS using
Risk Terrain Modelling to output a spatial result.
HW High Water.
IHO International Hydrographic Organization.
TOKELAU Hydrographic Risk Assessment _________________________________________________________________________________________
RNA 20171015_V1.0 xii
IMO International Maritime Organization.
“In-country” Refers to results displayed using colour band classification break values calculated
only from the local EEZ study area data, thus ensuring that the full colour range is
utilised in the heat map. These are relative results across the local EEZ.
IR Inherent Risk. The probability of loss arising out of circumstances or existing in an
environment, in the absence of any action to control or modify the circumstances.
Jenks Breaks (or Natural Breaks) is an algorithm for classification of statistical results that seeks
to partition data into classes based on natural groups in the data distribution. It
tries to maximize the similarity of numbers in groups, while maximizing the distance
between the groups. There are different implementations of the algorithm for
different software packages, so results can differ from one application to another.
The ESRI ArcMap implementation was used in this analysis.
km Kilometre.
kt Knot. One nautical mile per hour.
LiDAR An acronym referring to light detection and ranging. This is a remote sensing
technology that uses rapid pulses of laser light to make accurate measurements. It
can be used from aircraft to measure both terrain height and depth of water.
LINZ Land Information New Zealand. The national hydrographic authority of New
Zealand.
LW Low Water.
m Metre.
MFO Marine Fuel Oil. A generic term referring to lighter grades of fuel (such as marine
diesel oil (MDO) or marine gas oil MGO)) consisting of mainly distillate oil that is
normally used in bunkers of smaller commercial vessels or those that require
frequent manoeuvring.
MMSI Maritime Mobile Service Identity. A unique identifier for an AIS installation on a
ship, base station, aid to navigation SAR aircraft or handheld VHF radio with digital
select call that is allocated by the flag state (national maritime authority).
MSI Maritime Safety Information. Nautical information of a temporal or permanent
nature that impacts on safe navigation and needs to be communicated to mariners
and relevant nautical charting authorities.
MNZ Maritime New Zealand. The New Zealand maritime safety authority.
ML Most Likely (referring to an Event).
nm International Nautical Mile. A standard distance of 1852 metres.
TOKELAU Hydrographic Risk Assessment _________________________________________________________________________________________
RNA 20171015_V1.0 xiii
NPV Net Present Value.
QGIS Open source geographic information system software, useful for conducting spatial
analysis of data. QGIS stands for “Quantum Geographic Information System”, it is an
official project of the Open Source Geospatial Foundation and supports numerous
vector, raster, and database formats and functionalities.
QRA Quantified Risk Assessment (QRA). Undertaken for a safety case approach when
measuring specifics. Totally numerical: For shipping this would be ship miles
transited, divided by the number of incidents of, say, collision, contact, grounding, or
just expressed as the probability (or chance) of an incident occurring overall (e.g.
aircraft passenger miles).
“Regional” Results described as “regional” are those displayed using the same colour band
classification break values used in the regional risk diagrams of the previous South
West Pacific hydrographic risk assessments. “Regional” results are therefore
comparable to those previous assessments.
Risk A function of the combination of Frequency and Consequence of adverse events.
The value of the function is unknown, in exactly the same way that a monetary
currency has an unknown value. Risk is therefore a form of currency, used to
measure the importance of adverse events proactively before they happen.
Risk is often quantified as frequency x consequence to keep arithmetic simple.
RTM Risk Terrain Modelling.
S-AIS Satellite (received) Automatic Identification System.
Shapefile A popular geospatial vector data format for geographic information system (GIS)
software. It is developed and regulated by ESRI for data interoperability among ESRI
and other GIS software products.
SOLAS The United Nations Safety of Life at Sea Convention.
SOPAC Pacific Islands Applied Geoscience Commission. This commission was brought under the administration of SPC Pacific Regional Environment Program in 2010 and became part of the SPC Geoscience Division (GSD) in 2011.
SPC Secretariat of the Pacific Community. SPREP Secretariat of the Pacific Regional Environment Programme. This is an
intergovernmental organisation co-ordinating environmental projects across the Pacific region.
SWL Safe Working Load. The lifting capacity of a crane, derrick or other lifting
equipment.
TOKELAU Hydrographic Risk Assessment _________________________________________________________________________________________
RNA 20171015_V1.0 xiv
TEU Twenty-foot Equivalent Units. The standard reference size of a shipping container,
though many containers are up to twice that length. The capacity of a container ship
is measured in the number of TEU it can carry.
UNCLOS The United Nations Convention on Law of the Sea.
VHF Very High Frequency. This refers to a frequency band of radio often used for short
range marine voice communications.
WC Worst Credible (referring to an Event).
XML Stands for extensible markup language. It is a self-describing markup language
designed to assist with storing and transferring data.
ZOC Zone of Confidence. The charted representation of CATZOC.
$ Dollars. Unless otherwise specified $ refers to New Zealand dollars.
Tokelau Hydrographic Risk Assessment _________________________________________________________________________________________
RNA 20171015_V1.0 1
1. INTRODUCTION
1.0.1 In the South West Pacific, island nations have generally seen an increase in SOLAS traffic
transiting their waters as the volume of global maritime trade increases, and a resurgence of marine
tourism has spurred the cruise ship industry to find new destinations. These trends are likely to
continue.
1.0.2 Additionally, over the last twenty years, the development of the UNCLOS and the formal
recognition of the 200nm EEZ’s (and in some cases extended continental shelves to 350nm) has
brought with it additional responsibilities on nations of all sizes to ensure that there are adequate
charts to support safe navigation through their waters.
1.0.3 The report comments on the maritime and domestic circumstance of Tokelau and makes
observations in relation to hydrographic data and nautical chart coverage of Tokelauan waters,
based on existing chart coverage and an analysis of vessel traffic using geospatial techniques.
1.1 Aim
1.1.1 The aims of this report are:
a. to produce GIS derived plots showing the spatial distribution of shipping traffic that
enables the Government of Tokelau and LINZ to identify priority areas for focussing
hydrographic survey and charting improvements, and
b. to provide the Government of Tokelau with a GIS model that can be used to
contribute to the ongoing monitoring and management of hydrographic risk and
maritime areas.
1.2 Methodology3
1.2.1 The method employed uses risk assessment in a comparative way, to identify areas within
the Tokelau EEZ that are more susceptible to an incident involving either a large SOLAS vessel or
smaller cargo, fishing or recreational vessels.
1.2.2 The types of accident that can occur to vessels are related to the type of vessel transiting
Tokelauan waters, as well as their size and cargo/passenger capacity. Details of vessel transit
information is thus key to the methodology, and was supplied from satellite AIS data (S-AIS). As no
in-country data gathering visit to Tokelau has been undertaken, there is no additional information on
domestic, inter-island vessel movements.
1.2.3 Vessel traffic analysis was undertaken using satellite derived AIS data for January –
December 2016, to build a model of shipping movements through Tokelauan waters. Ship traffic
was analysed in a Geographic Information System (GIS), the details of how the tracks were created
3 This report applies the same methodology described in (Marico Marine Report No. 14NZ262 – TM, Issue 1, 27 November 2014), the text is reproduced here with minor adjustments to apply to Tokelau.
Tokelau Hydrographic Risk Assessment _________________________________________________________________________________________
RNA 20171015_V1.0 2
and processed to remove anomalies is provided at Annex B. As Tokelau has no domestic commercial
vessels of any significant GT, no additional non-AIS data was added to the ship traffic plot.
1.2.4 Event Trees (see Annex A) were generalised from the type of traffic and proximity to
navigational dangers of that traffic. These event trees could be further refined were an in-country
visit to take place and a numerical GIS-based risk assessment proceeded with. The expected types of
navigational incident that could occur include: grounding, foundering or collision, and their
consequences are driven by the vessel types and the size of those vessels. These outcomes
confirmed that the risk multipliers and the consequence criteria for a risk matrix (Annex E), were
valid for Tokelau.
1.2.4 There was little information available regarding tourist destinations, dive sites, biological or
cultural importance of specific areas in Tokelau. Therefore, it was not feasible to populate layers for
these data.
Tokelau Hydrographic Risk Assessment _________________________________________________________________________________________
RNA 20171015_V1.0 3
2. COUNTRY INFORMATION AND ECONOMY
2.1 Atafu, Nukunonu, and Fakaofo Atolls
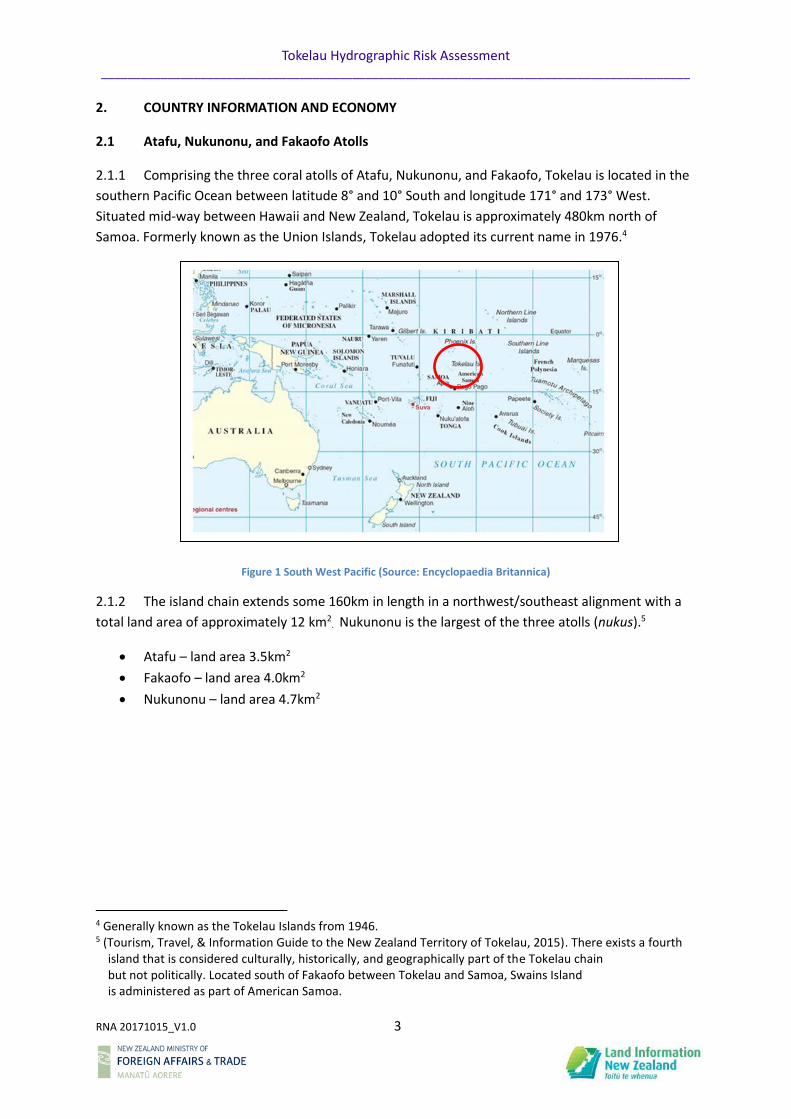
2.1.1 Comprising the three coral atolls of Atafu, Nukunonu, and Fakaofo, Tokelau is located in the
southern Pacific Ocean between latitude 8° and 10° South and longitude 171° and 173° West.
Situated mid-way between Hawaii and New Zealand, Tokelau is approximately 480km north of
Samoa. Formerly known as the Union Islands, Tokelau adopted its current name in 1976.4
Figure 1 South West Pacific (Source: Encyclopaedia Britannica)
2.1.2 The island chain extends some 160km in length in a northwest/southeast alignment with a
total land area of approximately 12 km2. Nukunonu is the largest of the three atolls (nukus).5
• Atafu – land area 3.5km2
• Fakaofo – land area 4.0km2
• Nukunonu – land area 4.7km2
4 Generally known as the Tokelau Islands from 1946. 5 (Tourism, Travel, & Information Guide to the New Zealand Territory of Tokelau, 2015). There exists a fourth island that is considered culturally, historically, and geographically part of the Tokelau chain but not politically. Located south of Fakaofo between Tokelau and Samoa, Swains Island is administered as part of American Samoa.
Tokelau Hydrographic Risk Assessment _________________________________________________________________________________________
RNA 20171015_V1.0 4
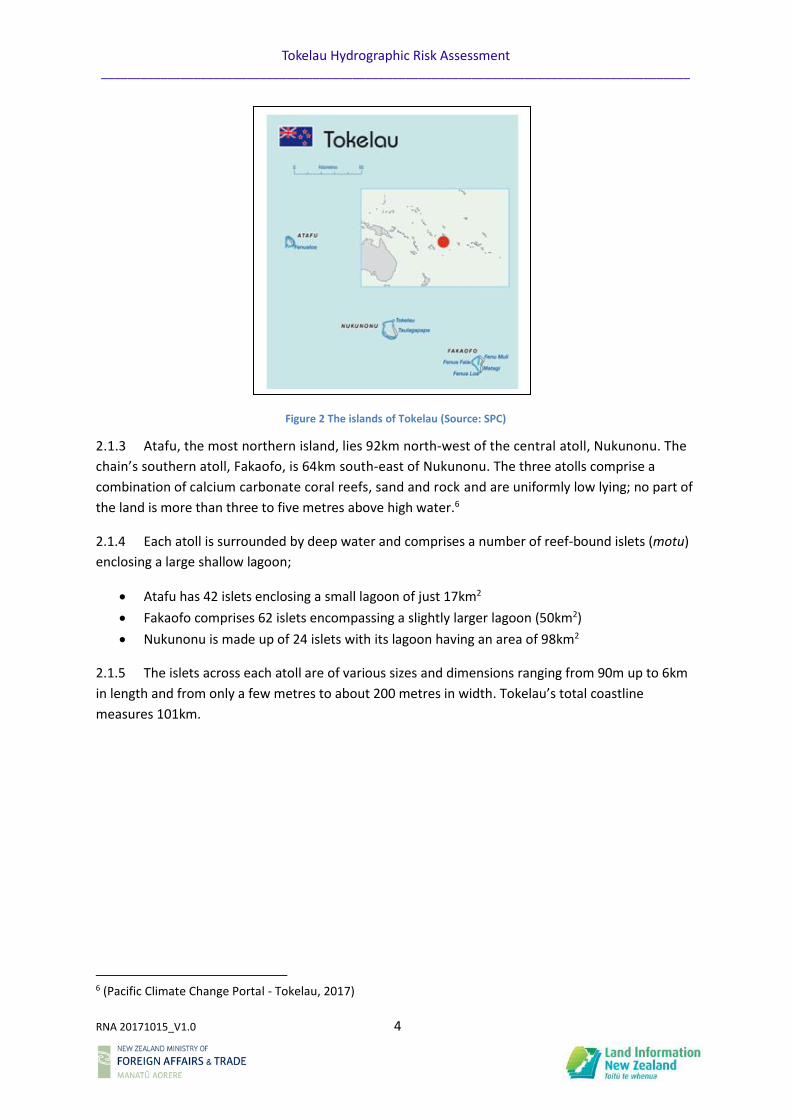
2.1.3 Atafu, the most northern island, lies 92km north-west of the central atoll, Nukunonu. The
chain’s southern atoll, Fakaofo, is 64km south-east of Nukunonu. The three atolls comprise a
combination of calcium carbonate coral reefs, sand and rock and are uniformly low lying; no part of
the land is more than three to five metres above high water.6
2.1.4 Each atoll is surrounded by deep water and comprises a number of reef-bound islets (motu)
enclosing a large shallow lagoon;
• Atafu has 42 islets enclosing a small lagoon of just 17km2
• Fakaofo comprises 62 islets encompassing a slightly larger lagoon (50km2)
• Nukunonu is made up of 24 islets with its lagoon having an area of 98km2
2.1.5 The islets across each atoll are of various sizes and dimensions ranging from 90m up to 6km
in length and from only a few metres to about 200 metres in width. Tokelau’s total coastline
measures 101km.
6 (Pacific Climate Change Portal - Tokelau, 2017)
Figure 2 The islands of Tokelau (Source: SPC)
Tokelau Hydrographic Risk Assessment _________________________________________________________________________________________
RNA 20171015_V1.0 5
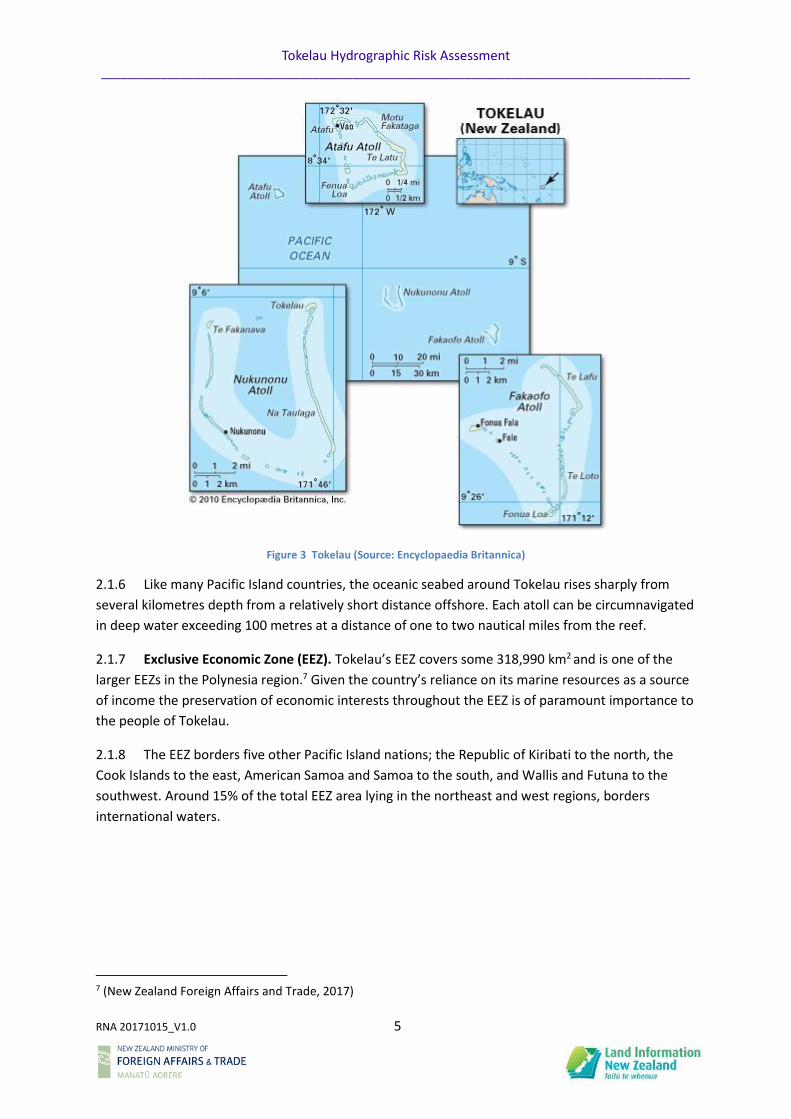
Figure 3 Tokelau (Source: Encyclopaedia Britannica)
2.1.6 Like many Pacific Island countries, the oceanic seabed around Tokelau rises sharply from
several kilometres depth from a relatively short distance offshore. Each atoll can be circumnavigated
in deep water exceeding 100 metres at a distance of one to two nautical miles from the reef.
2.1.7 Exclusive Economic Zone (EEZ). Tokelau’s EEZ covers some 318,990 km2 and is one of the
larger EEZs in the Polynesia region.7 Given the country’s reliance on its marine resources as a source
of income the preservation of economic interests throughout the EEZ is of paramount importance to
the people of Tokelau.
2.1.8 The EEZ borders five other Pacific Island nations; the Republic of Kiribati to the north, the
Cook Islands to the east, American Samoa and Samoa to the south, and Wallis and Futuna to the
southwest. Around 15% of the total EEZ area lying in the northeast and west regions, borders
international waters.
7 (New Zealand Foreign Affairs and Trade, 2017)
Tokelau Hydrographic Risk Assessment _________________________________________________________________________________________
RNA 20171015_V1.0 6
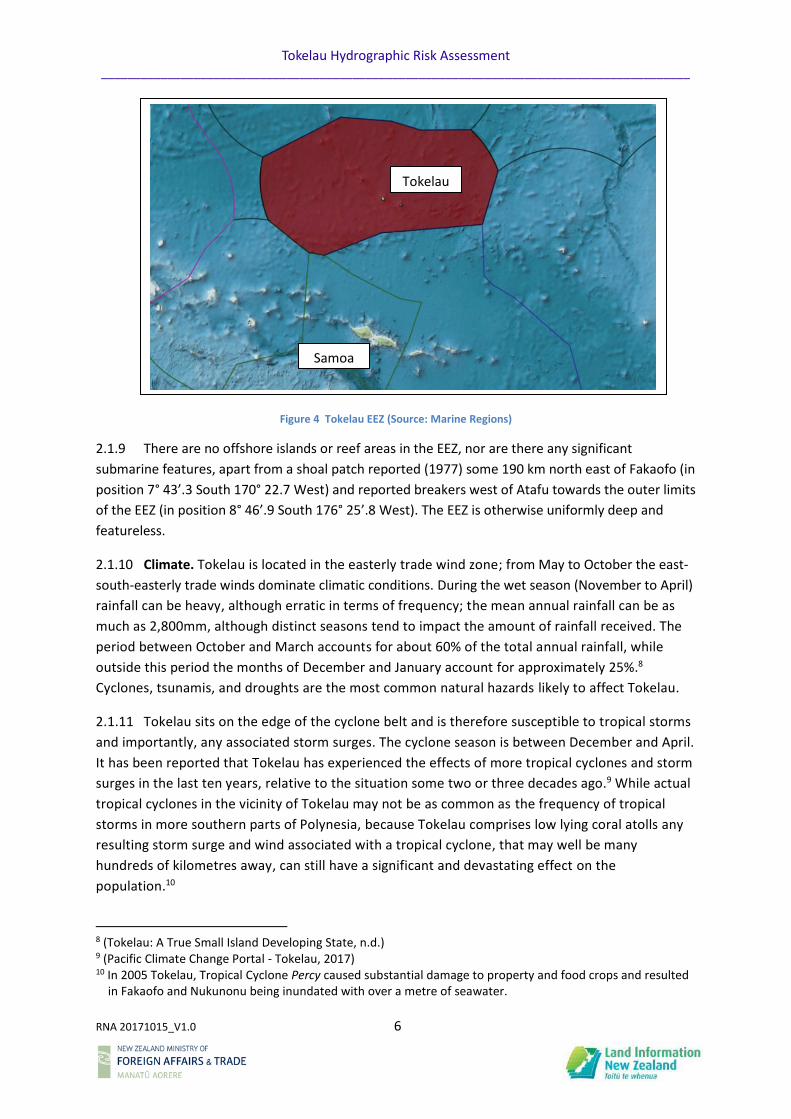
Figure 4 Tokelau EEZ (Source: Marine Regions)
2.1.9 There are no offshore islands or reef areas in the EEZ, nor are there any significant
submarine features, apart from a shoal patch reported (1977) some 190 km north east of Fakaofo (in
position 7° 43’.3 South 170° 22.7 West) and reported breakers west of Atafu towards the outer limits
of the EEZ (in position 8° 46’.9 South 176° 25’.8 West). The EEZ is otherwise uniformly deep and
featureless.
2.1.10 Climate. Tokelau is located in the easterly trade wind zone; from May to October the east-
south-easterly trade winds dominate climatic conditions. During the wet season (November to April)
rainfall can be heavy, although erratic in terms of frequency; the mean annual rainfall can be as
much as 2,800mm, although distinct seasons tend to impact the amount of rainfall received. The
period between October and March accounts for about 60% of the total annual rainfall, while
outside this period the months of December and January account for approximately 25%.8
Cyclones, tsunamis, and droughts are the most common natural hazards likely to affect Tokelau.
2.1.11 Tokelau sits on the edge of the cyclone belt and is therefore susceptible to tropical storms
and importantly, any associated storm surges. The cyclone season is between December and April.
It has been reported that Tokelau has experienced the effects of more tropical cyclones and storm
surges in the last ten years, relative to the situation some two or three decades ago.9 While actual
tropical cyclones in the vicinity of Tokelau may not be as common as the frequency of tropical
storms in more southern parts of Polynesia, because Tokelau comprises low lying coral atolls any
resulting storm surge and wind associated with a tropical cyclone, that may well be many
hundreds of kilometres away, can still have a significant and devastating effect on the
population.10
8 (Tokelau: A True Small Island Developing State, n.d.) 9 (Pacific Climate Change Portal - Tokelau, 2017) 10 In 2005 Tokelau, Tropical Cyclone Percy caused substantial damage to property and food crops and resulted in Fakaofo and Nukunonu being inundated with over a metre of seawater.
Tokelau
Samoa

Tokelau Hydrographic Risk Assessment _________________________________________________________________________________________
RNA 20171015_V1.0 7
2.1.12 Heritage. The islands were initially settled some 1,000 years ago, with the original
Polynesian settlers arriving from surrounding island groups including Samoa, the Cook Islands and
Tuvalu. While the people of Tokelau can relate to those communities in Tuvalu, culturally and
linguistically, Tokelau maintains strong links with Samoa.
2.1.13 The first contact with Europeans was during the mid-1700s. Christian missionaries started to
arrive between 1845 and 1860, resulting in a range of different denominations being embraced
across the atolls; Atafu for example, was converted primarily to Protestantism, Nukunonu to
Catholicism, while Fakaofo converted to both faiths. The religious situation on Atafu and Nukunonu
today remains largely unchanged, while on Fakaofo much of the population (approximately 70%) still
identifies with the Congregational Christian faith, with the remainder being aligned with
Catholicism.11
2.1.14 Peruvian slave traders arrived in Tokelau in 1863, kidnapping nearly all of the able-bodied
men to work as labourers. This was a defining moment from both a political and ethnic perspective.
Over subsequent years, immigrants from across Polynesia and from surrounding island groups, along
with American and European beachcombers, started to settle on Tokelau, filling this void by
marrying local women and gradually repopulating the atolls. While the people of Tokelau are
considered to be of Polynesian heritage, with virtually all residents being of Tokelauan ancestry, the
population comprises a degree of mixed ethnicity as a direct result of these historical interactions.
Figure 5 Ethnic groups in Tokelau (Source: The World Fact Book)12
2.1.15 Population. In terms of population, Tokelau is the second smallest country in the world. In
2013, the population count listed 1,383 inhabitants, while an estimate the following year recorded
approximately 1,337 people living across Tokelau’s atolls. Having experienced a general decline
11 (Government of Tokelau, 2014) 12 (CIA Factbook, 2017)
65.38.7
6.9
1.91
6
2.8 1.1 5.1
Tokelau - Ethnic Groups %
Tokelauan part Tokelauan/Samoan
part Tokelauan/Tuvaluan part Tokelauan/other Pacific islander
part Tokelauan/European Samoan
Tuvaluan other Pacific islander
other Pacific islander Unspecified
Tokelau Hydrographic Risk Assessment _________________________________________________________________________________________
RNA 20171015_V1.0 8
since 1961 when the population was at a high of 1,860, the population today remains in the order of
1,499 permanent residents.
2.1.16 The Tokelau Islands Act (1948) gave Tokelauans New Zealand citizenship and the
opportunity to migrate. More than 8,000 Tokelauans live elsewhere in the Pacific region, mainly in
Samoa and New Zealand. Increased migration to New Zealand was encouraged under the Tokelau
Islands Resettlement Scheme, which was introduced in 1966 to address increasing overpopulation
across Tokelau itself.13 While Tokelau’s population has stabilised in recent years it remains at risk of
further decline as people continue to emigrate ‘beyond the reef’.14
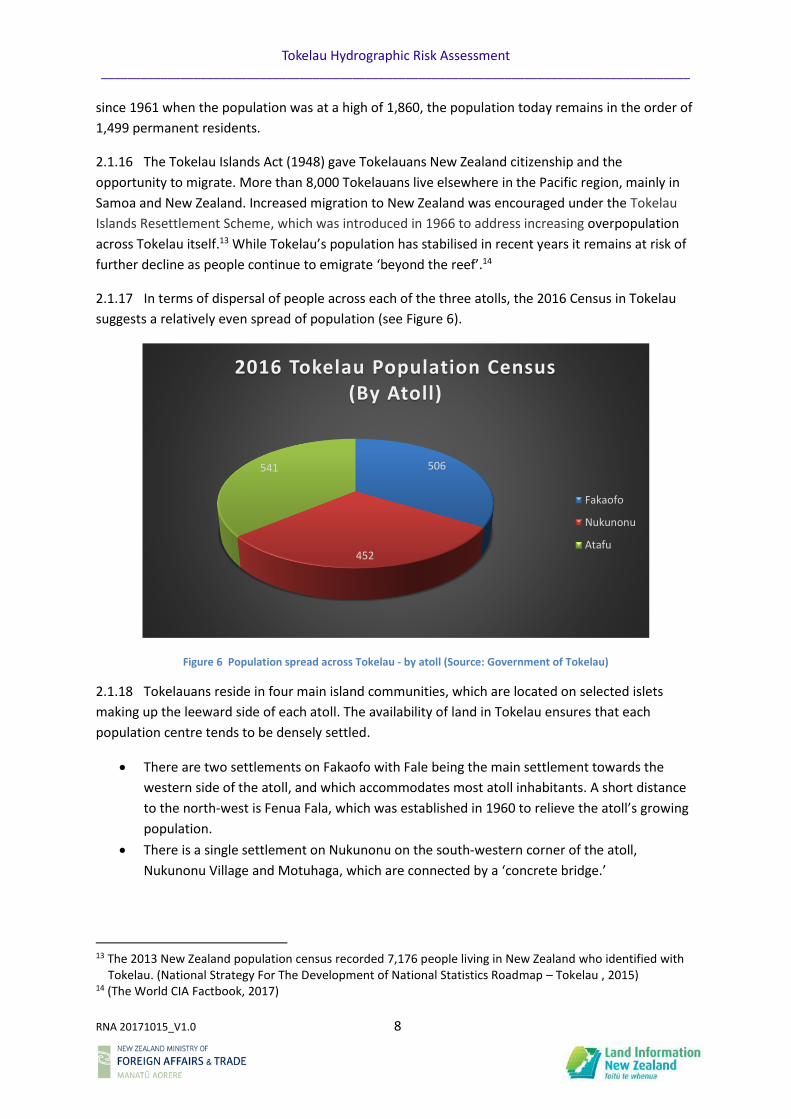
2.1.17 In terms of dispersal of people across each of the three atolls, the 2016 Census in Tokelau
suggests a relatively even spread of population (see Figure 6).
Figure 6 Population spread across Tokelau - by atoll (Source: Government of Tokelau)
2.1.18 Tokelauans reside in four main island communities, which are located on selected islets
making up the leeward side of each atoll. The availability of land in Tokelau ensures that each
population centre tends to be densely settled.
• There are two settlements on Fakaofo with Fale being the main settlement towards the
western side of the atoll, and which accommodates most atoll inhabitants. A short distance
to the north-west is Fenua Fala, which was established in 1960 to relieve the atoll’s growing
population.
• There is a single settlement on Nukunonu on the south-western corner of the atoll,
Nukunonu Village and Motuhaga, which are connected by a ‘concrete bridge.’
13 The 2013 New Zealand population census recorded 7,176 people living in New Zealand who identified with Tokelau. (National Strategy For The Development of National Statistics Roadmap – Tokelau , 2015) 14 (The World CIA Factbook, 2017)
506
452
541
2016 Tokelau Population Census (By Atoll)
Fakaofo
Nukunonu
Atafu
Tokelau Hydrographic Risk Assessment _________________________________________________________________________________________
RNA 20171015_V1.0 9
• The only community on Atafu is Atafu Village, which lies on the north-western corner of the
atoll.
2.1.19 Government. The most striking feature about the governance arrangements on Tokelau is
the adherence to traditional power (pule), which is exercised by village authorities. There is no
national capital in Tokelau; rather, each of the three atolls maintains its own administrative centre,
an arrangement that can be directly linked back to the South American slave trader period, which
resulted in the need to shift the manner in which the islands were governed. With the loss of island
chiefs and most of the able-bodied men, Tokelau was forced to adopt a governance system based
around a Council of Elders (Taupulega). Tokelau today, remains governed as a parliamentary
democratic dependency by this system that embraces village engagement and leadership.
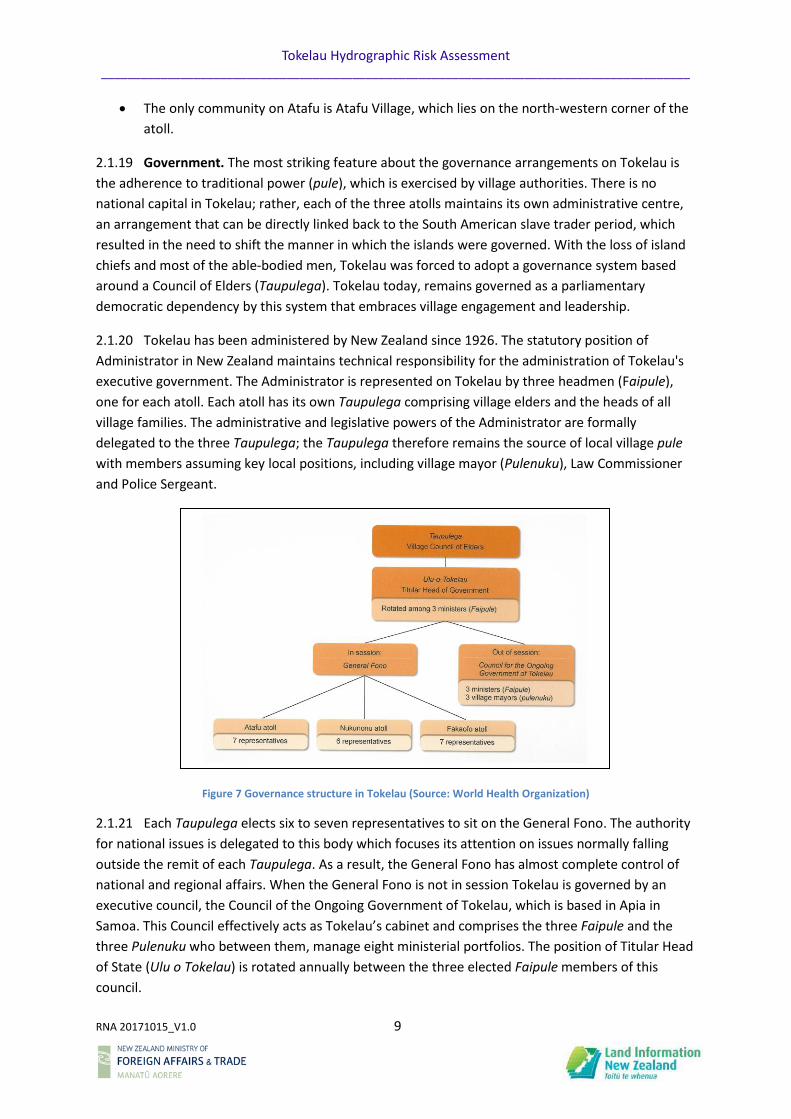
2.1.20 Tokelau has been administered by New Zealand since 1926. The statutory position of
Administrator in New Zealand maintains technical responsibility for the administration of Tokelau's
executive government. The Administrator is represented on Tokelau by three headmen (Faipule),
one for each atoll. Each atoll has its own Taupulega comprising village elders and the heads of all
village families. The administrative and legislative powers of the Administrator are formally
delegated to the three Taupulega; the Taupulega therefore remains the source of local village pule
with members assuming key local positions, including village mayor (Pulenuku), Law Commissioner
and Police Sergeant.
Figure 7 Governance structure in Tokelau (Source: World Health Organization)
2.1.21 Each Taupulega elects six to seven representatives to sit on the General Fono. The authority
for national issues is delegated to this body which focuses its attention on issues normally falling
outside the remit of each Taupulega. As a result, the General Fono has almost complete control of
national and regional affairs. When the General Fono is not in session Tokelau is governed by an
executive council, the Council of the Ongoing Government of Tokelau, which is based in Apia in
Samoa. This Council effectively acts as Tokelau’s cabinet and comprises the three Faipule and the
three Pulenuku who between them, manage eight ministerial portfolios. The position of Titular Head
of State (Ulu o Tokelau) is rotated annually between the three elected Faipule members of this
council.
Tokelau Hydrographic Risk Assessment _________________________________________________________________________________________
RNA 20171015_V1.0 10
2.2 Economic Overview
2.2.1 Tokelau is the fifth smallest country in the world, with its economy being the smallest. In
terms of development, the economy remains extremely vulnerable because of the country’s size, its
isolation, access to a limited resource base, a lack of infrastructure, and an inability to attract foreign
investment. Tokelau is therefore almost fully reliant on international development aid to prop up the
economy which remains susceptible to international currency and fiscal shock, along with the effects
of natural disasters.
2.2.2 Tokelau’s economy is largely one of subsistence agriculture and fishing; few attempts have
been made to date to implement meaningful economic initiatives.15 There is virtually no cash
economy operating in Tokelau although with the formation of the Tokelau Public Service, this is
starting to change. Tokelau’s main sources of national revenue come from exporting copra, the
management of international fishing licences, and the sale of stamps and coins and internet domain
registrations. Some revenue is also generated by locally imposed duties and taxes, freight and boat
fares, and a small market for handicrafts.16
2.2.3 Substantial revenue continues to be generated under the current US Tuna Treaty and from
the licensing of foreign vessels to fish Tokelau’s EEZ and offshore waters. The management of fishing
licences for example, generates 99% of the country’s revenue, with purse seine licences alone
accounting for 90% as part of the US Tuna Treaty. Revenue in 2016 from the fishing sector has been
estimated to be US$13.5 million.17
2.2.4 Notwithstanding, the country is still heavily dependent on foreign aid from countries like
New Zealand. Between 1999 and 2000 New Zealand financial aid accounted for 80% of Tokelau's
budgetary resources. Today, New Zealand provides about 60% of Tokelau's annual Government
budget.18 Similarly, Australian aid is based around contributions to the Tokelau International Trust
Fund, which supports the country’s long-term economic stability. Australia’s total contribution to
this fund since 2005 has been AS$8.8 million.19
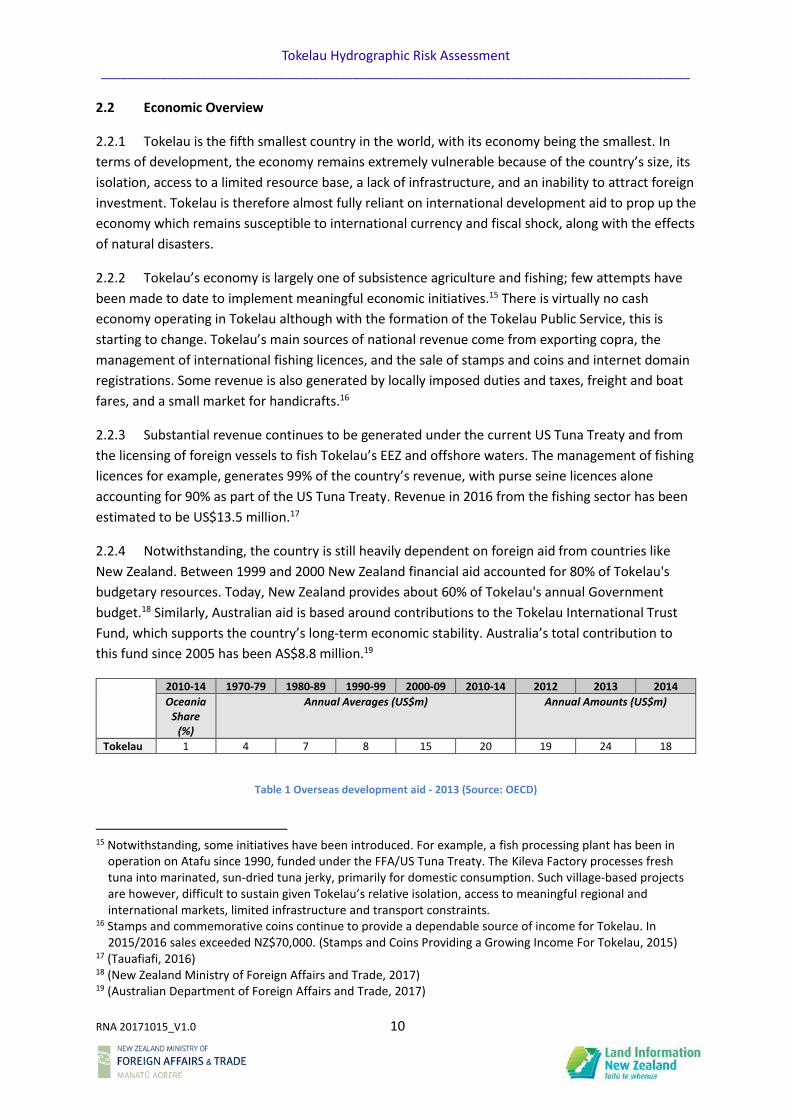
Table 1 Overseas development aid - 2013 (Source: OECD)
15 Notwithstanding, some initiatives have been introduced. For example, a fish processing plant has been in operation on Atafu since 1990, funded under the FFA/US Tuna Treaty. The Kileva Factory processes fresh tuna into marinated, sun-dried tuna jerky, primarily for domestic consumption. Such village-based projects are however, difficult to sustain given Tokelau’s relative isolation, access to meaningful regional and international markets, limited infrastructure and transport constraints. 16 Stamps and commemorative coins continue to provide a dependable source of income for Tokelau. In 2015/2016 sales exceeded NZ$70,000. (Stamps and Coins Providing a Growing Income For Tokelau, 2015) 17 (Tauafiafi, 2016) 18 (New Zealand Ministry of Foreign Affairs and Trade, 2017) 19 (Australian Department of Foreign Affairs and Trade, 2017)
2010-14 1970-79 1980-89 1990-99 2000-09 2010-14 2012 2013 2014
Oceania Share
(%)
Annual Averages (US$m) Annual Amounts (US$m)
Tokelau 1 4 7 8 15 20 19 24 18

Tokelau Hydrographic Risk Assessment _________________________________________________________________________________________
RNA 20171015_V1.0 11
2.2.5 An additional source of income for the economy are family remittances, which are sent back
from Tokelauans living abroad. Some 7,000 currently live in New Zealand20 while smaller
communities can be found in Samoa, American Samoa, Australia and Hawai'i. However, the
emergence of the Tokelau Public Service as a new source of income has reduced the importance of
remittances to helping sustain the economy.
2.2.6 GDP. The most recent GDP figure for Tokelau covers the 2015/16 Financial Year and has
been determined to be NZ$14 million. This equates to US$6,275 per capita.21
2012/2013 2013/2014 2014/2015 2015/2016
GDP (NZ$m) 10.38 11.24 11.97 14.04
Per Capita (US$) 5,678 6,224 6,116 6,275
Figure 8 Tokelau GDP figures - FY 12/13 to FY 15/16 22
2.2.7 Trade. Tokelau’s location and international standing, along with the size of the economy
means there are few established trade patterns associated with the country. To emphasise this
point, the lack of trade means there is little in the way of contemporary trade-related data to draw
on, particularly any information regarding Tokelau’s imports and exports and the extent of any
trading partners. Apart from exporting a small amount of copra, Tokelau does not have any
established export markets, since the country currently has no proper means for mass export. Nor
are there any internal market opportunities for local products. What trade that does exist is
primarily conducted with New Zealand and Samoa. In 2014 imports from Samoa, for example,
averaged NZ$432,000 per month or NZ$5.2 million per annum.23
2.2.8 The lack of regular and efficient transport to expedite delivery of fish to external markets,
for example, remains a key challenge which limits potential earnings and development in the
fisheries sector. On the other hand, Tokelau imports the vast majority of its household and
commercial goods, including foodstuffs, building materials, and fuel (petrol). Imported essentials
such as petrol, kerosene, soap, tobacco, cloth, flour, rice, and sugar tend to be purchased from the
cooperative village store located on each atoll.
2.3 Economic Sectors
2.3.1 Agriculture
2.3.1.1 The coral nature of each atoll means the land is generally alkaline, highly porous, and
nutrient-deficient. The soil is characterised as having low humus content, with a high surface salinity.
Poor soil characteristics, the lack of available land, and limited access to fresh water, remain
significant factors in Tokelau’s capacity to develop any sort of agricultural sector. Accordingly, what
agriculture there is remains restricted to supporting the local population at a basic subsistence level.
20 (Government of Tokelau, 2017) 21 (Tokelau’s Gross Domestic Product determined for first time this century, 2017) 22 (Tokelau’s Gross Domestic Product determined for first time this century, 2017) 23 (Jasperse, 2015)
Tokelau Hydrographic Risk Assessment _________________________________________________________________________________________
RNA 20171015_V1.0 12
2.3.1.2 In general, no fresh fruit and vegetables are grown; potatoes, onions and carrots for
example, are imported. Cultivated food crops are generally limited to breadfruit, various forms of
taro, two varieties of bananas, papaya, pandanus, pumpkins, and coconuts. The latter is harvested
both for subsistence purposes and to support Tokelau’s small commercial copra export industry.
Swamp taro is cultivated on Fakaofo, in the satellite village of Fenuafala, which does have access to
underground freshwater sources. Food imports tend to be cheap, which tends to negate any effort
to build competitive small-scale domestic agricultural production. This results in a situation where
even commodities that could probably be grown/cultivated locally, are also imported (eg. tinned
tuna, mackerel, and bananas).
2.3.1.3 Tokelauan communities also maintain some pigs, poultry, and goats.24
2.3.1.4 Initiatives. Beyond efforts to increase domestic marketing of agricultural products, no
broader commercial agricultural export-orientated initiatives were outlined in Tokelau’s National
Strategic Plan 2010-2015.25 However, the Government has recently launched ‘Small Garden’, a food
project that aims to supply every household across the three atolls with specially selected seeds
(assessed as having the best chance of success in the harsh island conditions) from which families
can grow their own vegetables. Launched in October 2015, the longer-term intent is to reduce
Tokelau’s dependence on imported fresh produce.
2.3.2 Fishing
2.3.2.1 The 2012 Tokelau Fisheries Policy characterises the country’s fisheries waters as follows:
• inshore fisheries – 0-12 nautical miles (territorial waters) – food security; and
• offshore waters – 12–200 nautical miles (EEZ) – revenue generation.26
2.3.2.2 The vast majority of households in Tokelau engage in fishing, primarily for subsistence
purposes. While there is no domestic commercial fishing industry in Tokelau, offshore fishing
activity provides a key opportunity for ongoing economic development.
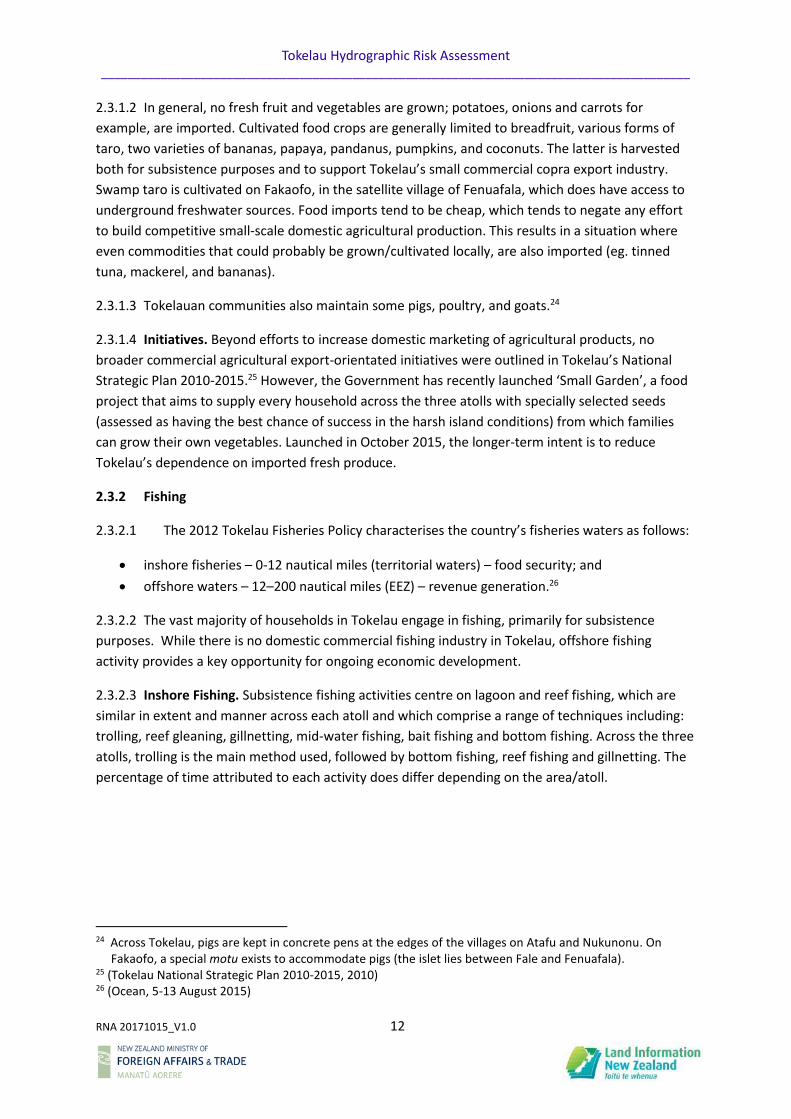
2.3.2.3 Inshore Fishing. Subsistence fishing activities centre on lagoon and reef fishing, which are
similar in extent and manner across each atoll and which comprise a range of techniques including:
trolling, reef gleaning, gillnetting, mid-water fishing, bait fishing and bottom fishing. Across the three
atolls, trolling is the main method used, followed by bottom fishing, reef fishing and gillnetting. The
percentage of time attributed to each activity does differ depending on the area/atoll.
24 Across Tokelau, pigs are kept in concrete pens at the edges of the villages on Atafu and Nukunonu. On Fakaofo, a special motu exists to accommodate pigs (the islet lies between Fale and Fenuafala). 25 (Tokelau National Strategic Plan 2010-2015, 2010) 26 (Ocean, 5-13 August 2015)
Tokelau Hydrographic Risk Assessment _________________________________________________________________________________________
RNA 20171015_V1.0 13
Figure 9 Fishing effort by method and atoll (%)27
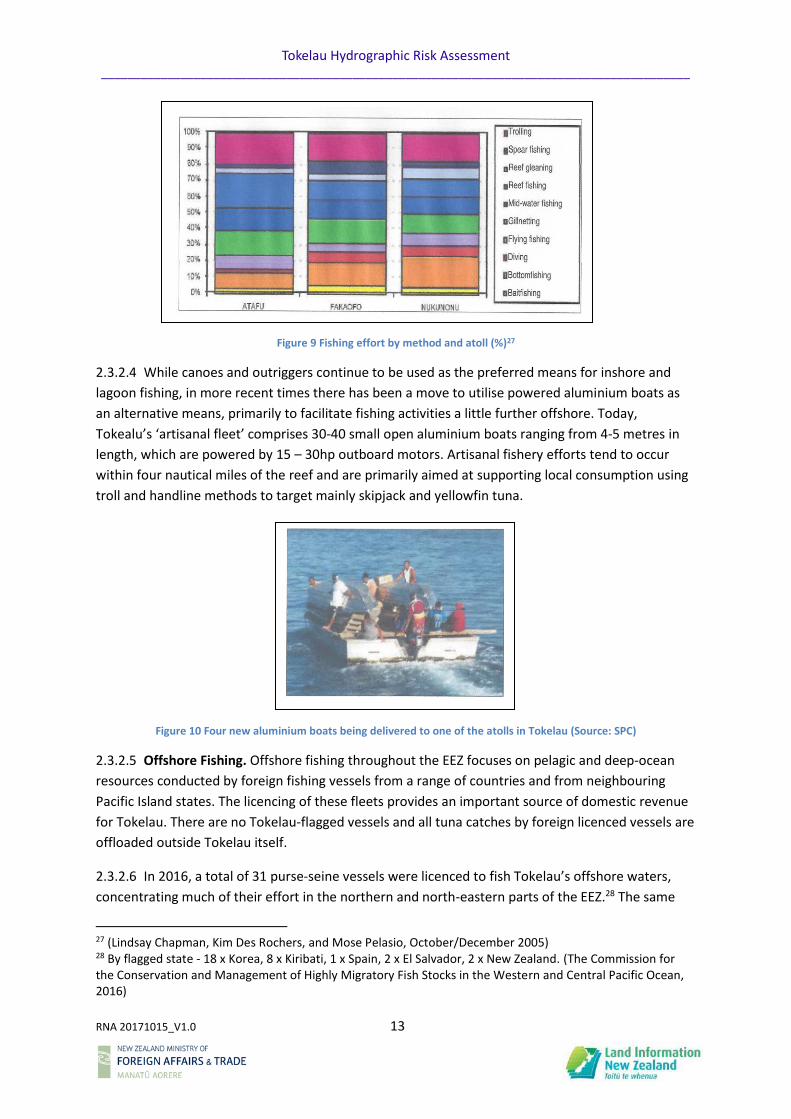
2.3.2.4 While canoes and outriggers continue to be used as the preferred means for inshore and
lagoon fishing, in more recent times there has been a move to utilise powered aluminium boats as
an alternative means, primarily to facilitate fishing activities a little further offshore. Today,
Tokealu’s ‘artisanal fleet’ comprises 30-40 small open aluminium boats ranging from 4-5 metres in
length, which are powered by 15 – 30hp outboard motors. Artisanal fishery efforts tend to occur
within four nautical miles of the reef and are primarily aimed at supporting local consumption using
troll and handline methods to target mainly skipjack and yellowfin tuna.
Figure 10 Four new aluminium boats being delivered to one of the atolls in Tokelau (Source: SPC)
2.3.2.5 Offshore Fishing. Offshore fishing throughout the EEZ focuses on pelagic and deep-ocean
resources conducted by foreign fishing vessels from a range of countries and from neighbouring
Pacific Island states. The licencing of these fleets provides an important source of domestic revenue
for Tokelau. There are no Tokelau-flagged vessels and all tuna catches by foreign licenced vessels are
offloaded outside Tokelau itself.
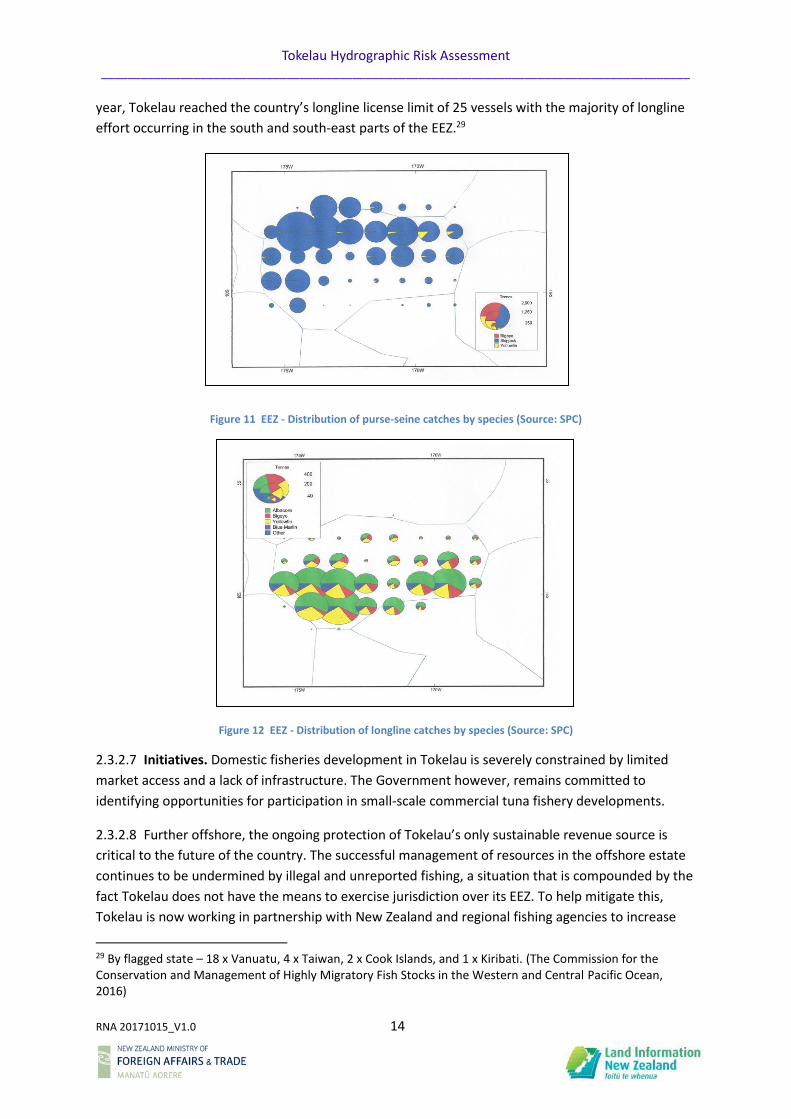
2.3.2.6 In 2016, a total of 31 purse-seine vessels were licenced to fish Tokelau’s offshore waters,
concentrating much of their effort in the northern and north-eastern parts of the EEZ.28 The same
27 (Lindsay Chapman, Kim Des Rochers, and Mose Pelasio, October/December 2005) 28 By flagged state - 18 x Korea, 8 x Kiribati, 1 x Spain, 2 x El Salvador, 2 x New Zealand. (The Commission for the Conservation and Management of Highly Migratory Fish Stocks in the Western and Central Pacific Ocean, 2016)
Tokelau Hydrographic Risk Assessment _________________________________________________________________________________________
RNA 20171015_V1.0 14
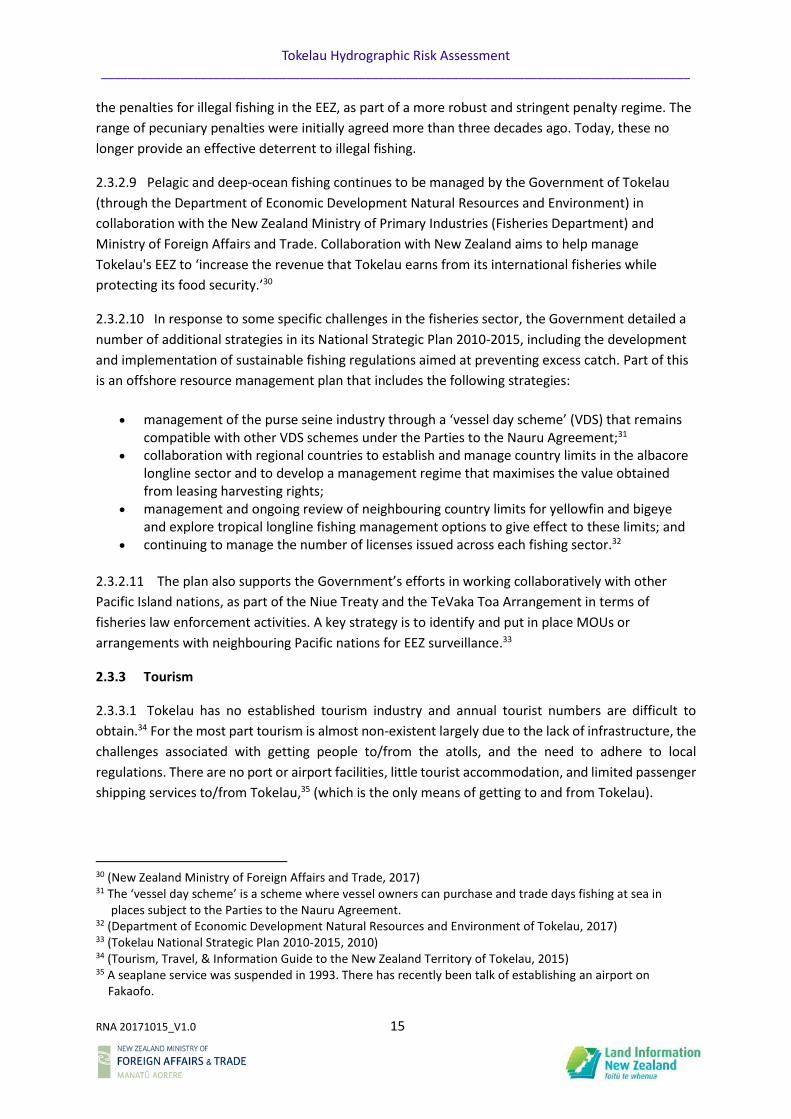
year, Tokelau reached the country’s longline license limit of 25 vessels with the majority of longline
effort occurring in the south and south-east parts of the EEZ.29
Figure 11 EEZ - Distribution of purse-seine catches by species (Source: SPC)
Figure 12 EEZ - Distribution of longline catches by species (Source: SPC)
2.3.2.7 Initiatives. Domestic fisheries development in Tokelau is severely constrained by limited
market access and a lack of infrastructure. The Government however, remains committed to
identifying opportunities for participation in small-scale commercial tuna fishery developments.
2.3.2.8 Further offshore, the ongoing protection of Tokelau’s only sustainable revenue source is
critical to the future of the country. The successful management of resources in the offshore estate
continues to be undermined by illegal and unreported fishing, a situation that is compounded by the
fact Tokelau does not have the means to exercise jurisdiction over its EEZ. To help mitigate this,
Tokelau is now working in partnership with New Zealand and regional fishing agencies to increase
29 By flagged state – 18 x Vanuatu, 4 x Taiwan, 2 x Cook Islands, and 1 x Kiribati. (The Commission for the Conservation and Management of Highly Migratory Fish Stocks in the Western and Central Pacific Ocean, 2016)
Tokelau Hydrographic Risk Assessment _________________________________________________________________________________________
RNA 20171015_V1.0 15
the penalties for illegal fishing in the EEZ, as part of a more robust and stringent penalty regime. The
range of pecuniary penalties were initially agreed more than three decades ago. Today, these no
longer provide an effective deterrent to illegal fishing.
2.3.2.9 Pelagic and deep-ocean fishing continues to be managed by the Government of Tokelau
(through the Department of Economic Development Natural Resources and Environment) in
collaboration with the New Zealand Ministry of Primary Industries (Fisheries Department) and
Ministry of Foreign Affairs and Trade. Collaboration with New Zealand aims to help manage
Tokelau's EEZ to ‘increase the revenue that Tokelau earns from its international fisheries while
protecting its food security.’30
2.3.2.10 In response to some specific challenges in the fisheries sector, the Government detailed a
number of additional strategies in its National Strategic Plan 2010-2015, including the development
and implementation of sustainable fishing regulations aimed at preventing excess catch. Part of this
is an offshore resource management plan that includes the following strategies:
• management of the purse seine industry through a ‘vessel day scheme’ (VDS) that remains compatible with other VDS schemes under the Parties to the Nauru Agreement;31
• collaboration with regional countries to establish and manage country limits in the albacore longline sector and to develop a management regime that maximises the value obtained from leasing harvesting rights;
• management and ongoing review of neighbouring country limits for yellowfin and bigeye and explore tropical longline fishing management options to give effect to these limits; and
• continuing to manage the number of licenses issued across each fishing sector.32
2.3.2.11 The plan also supports the Government’s efforts in working collaboratively with other
Pacific Island nations, as part of the Niue Treaty and the TeVaka Toa Arrangement in terms of
fisheries law enforcement activities. A key strategy is to identify and put in place MOUs or
arrangements with neighbouring Pacific nations for EEZ surveillance.33
2.3.3 Tourism
2.3.3.1 Tokelau has no established tourism industry and annual tourist numbers are difficult to
obtain.34 For the most part tourism is almost non-existent largely due to the lack of infrastructure, the
challenges associated with getting people to/from the atolls, and the need to adhere to local
regulations. There are no port or airport facilities, little tourist accommodation, and limited passenger
shipping services to/from Tokelau,35 (which is the only means of getting to and from Tokelau).
30 (New Zealand Ministry of Foreign Affairs and Trade, 2017) 31 The ‘vessel day scheme’ is a scheme where vessel owners can purchase and trade days fishing at sea in places subject to the Parties to the Nauru Agreement. 32 (Department of Economic Development Natural Resources and Environment of Tokelau, 2017) 33 (Tokelau National Strategic Plan 2010-2015, 2010) 34 (Tourism, Travel, & Information Guide to the New Zealand Territory of Tokelau, 2015) 35 A seaplane service was suspended in 1993. There has recently been talk of establishing an airport on Fakaofo.
Tokelau Hydrographic Risk Assessment _________________________________________________________________________________________
RNA 20171015_V1.0 16
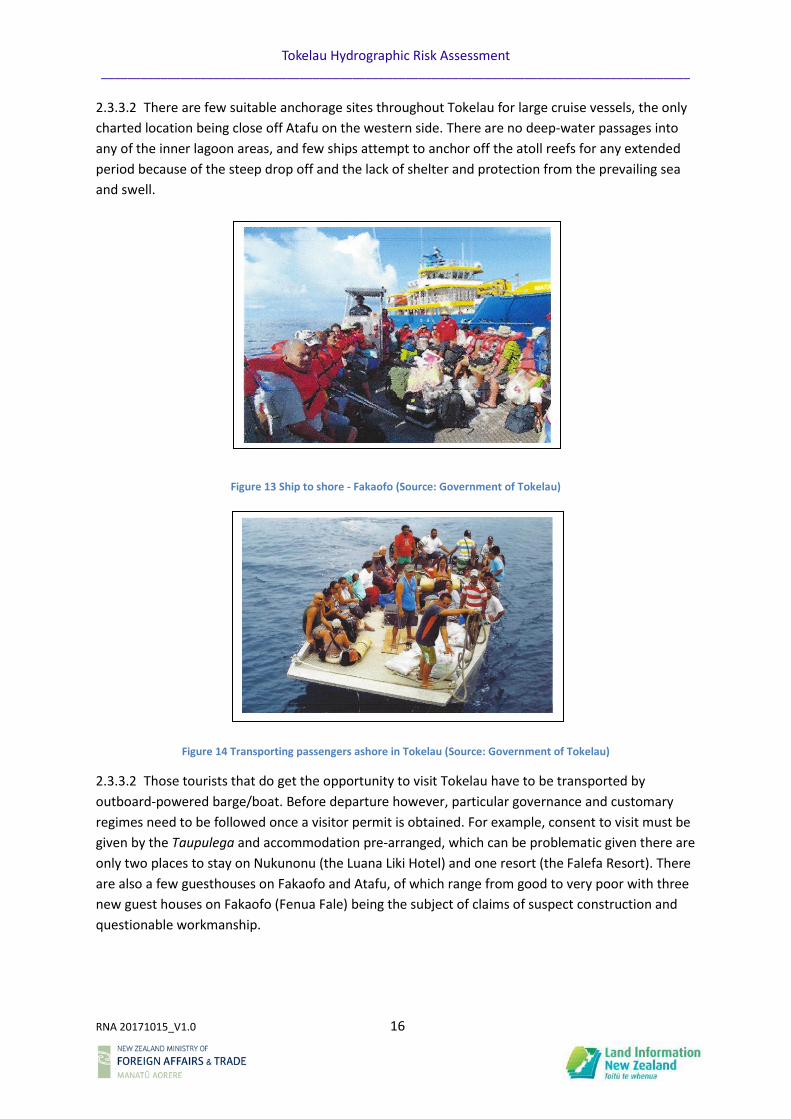
2.3.3.2 There are few suitable anchorage sites throughout Tokelau for large cruise vessels, the only
charted location being close off Atafu on the western side. There are no deep-water passages into
any of the inner lagoon areas, and few ships attempt to anchor off the atoll reefs for any extended
period because of the steep drop off and the lack of shelter and protection from the prevailing sea
and swell.
Figure 13 Ship to shore - Fakaofo (Source: Government of Tokelau)
Figure 14 Transporting passengers ashore in Tokelau (Source: Government of Tokelau)
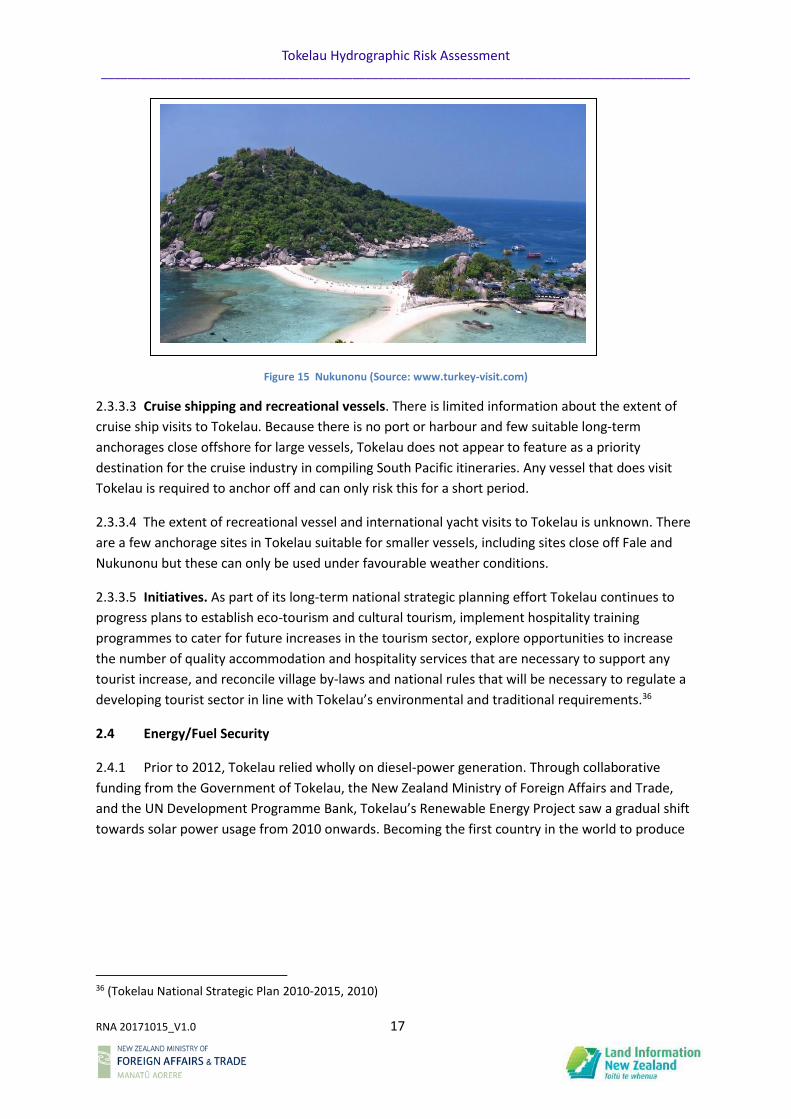
2.3.3.2 Those tourists that do get the opportunity to visit Tokelau have to be transported by
outboard-powered barge/boat. Before departure however, particular governance and customary
regimes need to be followed once a visitor permit is obtained. For example, consent to visit must be
given by the Taupulega and accommodation pre-arranged, which can be problematic given there are
only two places to stay on Nukunonu (the Luana Liki Hotel) and one resort (the Falefa Resort). There
are also a few guesthouses on Fakaofo and Atafu, of which range from good to very poor with three
new guest houses on Fakaofo (Fenua Fale) being the subject of claims of suspect construction and
questionable workmanship.
Tokelau Hydrographic Risk Assessment _________________________________________________________________________________________
RNA 20171015_V1.0 17
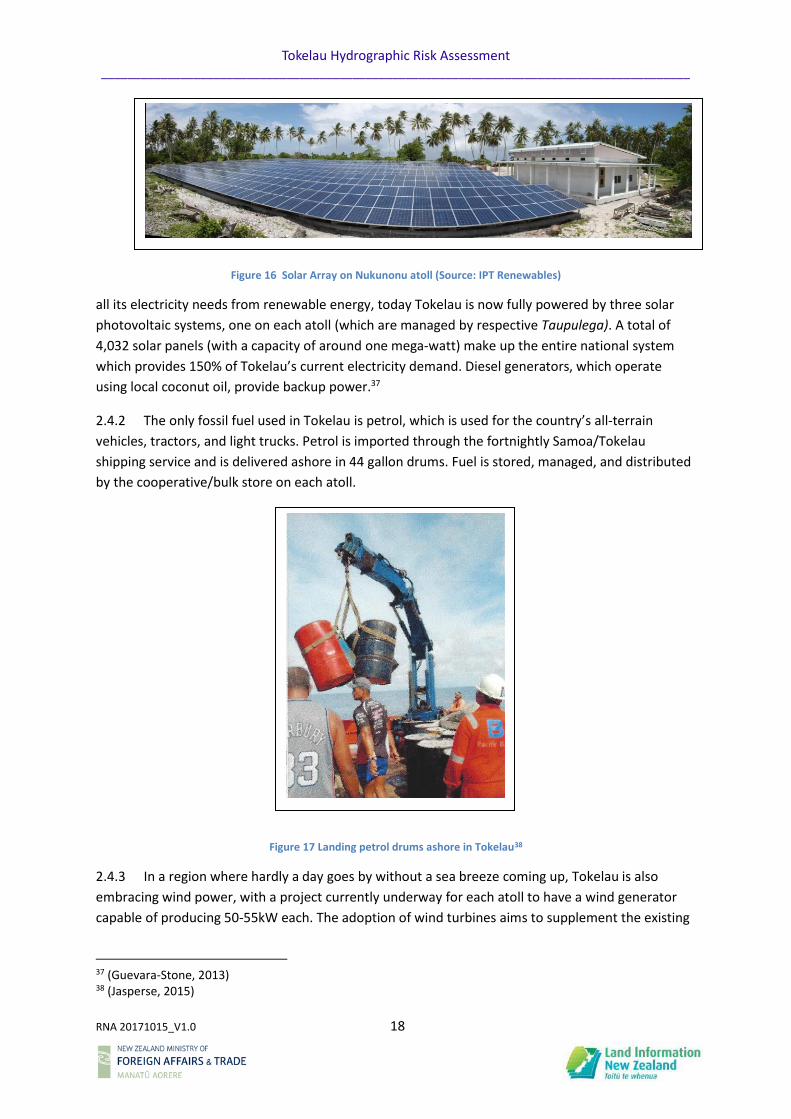
Figure 15 Nukunonu (Source: www.turkey-visit.com)
2.3.3.3 Cruise shipping and recreational vessels. There is limited information about the extent of
cruise ship visits to Tokelau. Because there is no port or harbour and few suitable long-term
anchorages close offshore for large vessels, Tokelau does not appear to feature as a priority
destination for the cruise industry in compiling South Pacific itineraries. Any vessel that does visit
Tokelau is required to anchor off and can only risk this for a short period.
2.3.3.4 The extent of recreational vessel and international yacht visits to Tokelau is unknown. There
are a few anchorage sites in Tokelau suitable for smaller vessels, including sites close off Fale and
Nukunonu but these can only be used under favourable weather conditions.
2.3.3.5 Initiatives. As part of its long-term national strategic planning effort Tokelau continues to
progress plans to establish eco-tourism and cultural tourism, implement hospitality training
programmes to cater for future increases in the tourism sector, explore opportunities to increase
the number of quality accommodation and hospitality services that are necessary to support any
tourist increase, and reconcile village by-laws and national rules that will be necessary to regulate a
developing tourist sector in line with Tokelau’s environmental and traditional requirements.36
2.4 Energy/Fuel Security
2.4.1 Prior to 2012, Tokelau relied wholly on diesel-power generation. Through collaborative
funding from the Government of Tokelau, the New Zealand Ministry of Foreign Affairs and Trade,
and the UN Development Programme Bank, Tokelau’s Renewable Energy Project saw a gradual shift
towards solar power usage from 2010 onwards. Becoming the first country in the world to produce
36 (Tokelau National Strategic Plan 2010-2015, 2010)
Tokelau Hydrographic Risk Assessment _________________________________________________________________________________________
RNA 20171015_V1.0 18
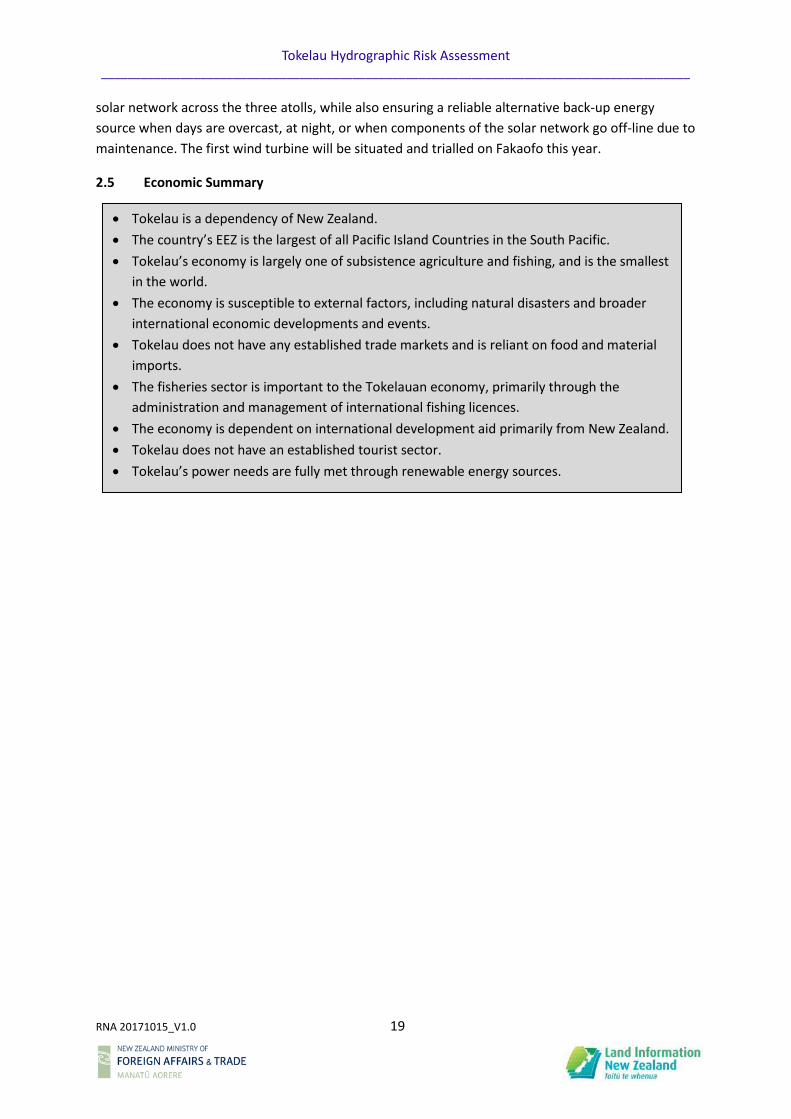
Figure 16 Solar Array on Nukunonu atoll (Source: IPT Renewables)
all its electricity needs from renewable energy, today Tokelau is now fully powered by three solar
photovoltaic systems, one on each atoll (which are managed by respective Taupulega). A total of
4,032 solar panels (with a capacity of around one mega-watt) make up the entire national system
which provides 150% of Tokelau’s current electricity demand. Diesel generators, which operate
using local coconut oil, provide backup power.37
2.4.2 The only fossil fuel used in Tokelau is petrol, which is used for the country’s all-terrain
vehicles, tractors, and light trucks. Petrol is imported through the fortnightly Samoa/Tokelau
shipping service and is delivered ashore in 44 gallon drums. Fuel is stored, managed, and distributed
by the cooperative/bulk store on each atoll.
Figure 17 Landing petrol drums ashore in Tokelau38
2.4.3 In a region where hardly a day goes by without a sea breeze coming up, Tokelau is also
embracing wind power, with a project currently underway for each atoll to have a wind generator
capable of producing 50-55kW each. The adoption of wind turbines aims to supplement the existing
37 (Guevara-Stone, 2013) 38 (Jasperse, 2015)
Tokelau Hydrographic Risk Assessment _________________________________________________________________________________________
RNA 20171015_V1.0 19
solar network across the three atolls, while also ensuring a reliable alternative back-up energy
source when days are overcast, at night, or when components of the solar network go off-line due to
maintenance. The first wind turbine will be situated and trialled on Fakaofo this year.
2.5 Economic Summary
• Tokelau is a dependency of New Zealand.
• The country’s EEZ is the largest of all Pacific Island Countries in the South Pacific.
• Tokelau’s economy is largely one of subsistence agriculture and fishing, and is the smallest
in the world.
• The economy is susceptible to external factors, including natural disasters and broader
international economic developments and events.
• Tokelau does not have any established trade markets and is reliant on food and material
imports.
• The fisheries sector is important to the Tokelauan economy, primarily through the
administration and management of international fishing licences.
• The economy is dependent on international development aid primarily from New Zealand.
• Tokelau does not have an established tourist sector.
• Tokelau’s power needs are fully met through renewable energy sources.
Tokelau Hydrographic Risk Assessment _________________________________________________________________________________________
RNA 20171015_V1.0 20
3 CULTURAL ASPECTS AND TRADITIONAL RESOURCE MANAGEMENT
3.1 Cultural Aspects
3.1.1 The guiding principal of Tokelau cultural values is Maopoopo (‘a unity of a common purpose
that encompasses both body and spirit.’) Maopoopo can be seen in the communal activities
Tokelauans participate in (including fishing expeditions, village construction, sports competitions,
music, and dance) and underpins the notion of Faka Tokelau.
3.1.2 Faka Tokelau (the traditional Tokelauan family and community-oriented way of life) is a
strong guiding influence in Tokelau and is centred on family and community. Respect for the land
and the sharing of resources according to need, together with respect for elders, are integral
characteristics of this Polynesian culture. The following aspects of Faka Tokelau are of particular
note:
• Families are very close and there is a system of sharing and obligation to care and assist all
family members.
• However, through the institutionalised system of sharing (inati), where each member of the
community receives equal shares or portions of harvested resources and where every
member of society has responsibilities and equal rights, the main responsibility is not to the
family but to one’s community (i.e. their village on their atoll).
• Villages are tightly controlled and egalitarian; order tends to be achieved by a dominating
age hierarchy based on the ‘precept that wisdom is acquired with years and therefore
elderly people should decide, direct, and supervise.’39
• Everyone in Tokelau has rights to land. Apart from parcels being given over to village
activities or assigned to the church, all land (nukus) in Tokelau is controlled by recognised
‘cognatic’ kin groups, who collaboratively engage in its management and harvest.
Emphasising the importance of what land there is and the role it plays in Tokelauan culture,
the Tokelau Amendment Act 1967 clearly laid out the rules of land ownership; land can be
transferred to other Tokelauans but it cannot be transferred to foreigners.
3.1.3 The church also plays a significant part in Faka Tokelau with Christianity having played a
central part of life in Tokelau since the latter half of the nineteenth century. While Tokelauans can
attend church several times a week, Sunday is traditionally devoted to church attendance, with all
work being forbidden.
3.2 Culture and Resource Management
3.2.1 Customary marine tenure is important in Tokelau and can be considered the primary and
enabling conservation strategy, most notably for marine areas. In a society where there exists a
strong traditional institution and resource-use ethic, a prohibition (fakahao or lafu) system where
reefs, lagoons or general fishing areas are closed off for certain lengths of time, has existed for
generations.
39 (Government of Tokelau, 2017)
Tokelau Hydrographic Risk Assessment _________________________________________________________________________________________
RNA 20171015_V1.0 21
3.2.2 Under Faka Tokelau and the concept of resource sharing, all marine resources in Tokelau
are generally accessible for community use. The management of each atoll’s marine and
corresponding land resources remains the responsibility of the respective Tapulega who, in
exercising their traditional powers, make rules on usage and exploitation as part of in-shore coastal
marine management plans.
3.2.3 Lafu over particular areas is sometimes implemented, particularly during periods of adverse
weather, while a Tapulega may decide to impose more enduring spatial or temporal prohibitions on
fishing on the outer reef slope or open ocean off the atoll for periods ranging from a few days to
several months for the purpose of marine conservation, to preserve resources for future community
fishing activities. The Tapulega on Nukunonu for example, prohibits the harvesting of elongated
giant clams for export during March to October each year, while on Atafu lafu exists over the
harvesting of clam. Importantly, anyone wishing to harvest reef resources for commercial purposes
must first seek the approval from the Tapulega.
3.3 Cultural Summary
• The guiding principal of Tokelau cultural values is maopoopo which means ‘a unity of a
common purpose that encompasses both body and spirit.’
• Faka Tokelau means the ‘Tokelauan Way’ and describes the socio-political and
traditional-customary way of life underpinning Tokelauan culture.
• The Tokelauan Way is centred on family and community along with respect for the land
and the sharing of resources.
• Tokelau is a deeply religious society.
• Tokelauans value their natural surroundings, not only because of what the natural
environment offers resource-wise but also because of its spiritual connections as part of
Faka Tokelau.
• Customary marine tenure is the primary and enabling marine conservation strategy.
• Each Tapulega maintain a strong cultural association with the land and with the sea,
primarily for subsistence and conservation reasons.
Tokelau Hydrographic Risk Assessment _________________________________________________________________________________________
RNA 20171015_V1.0 22
4 MARITIME OVERVIEW
4.1 Description of Atolls
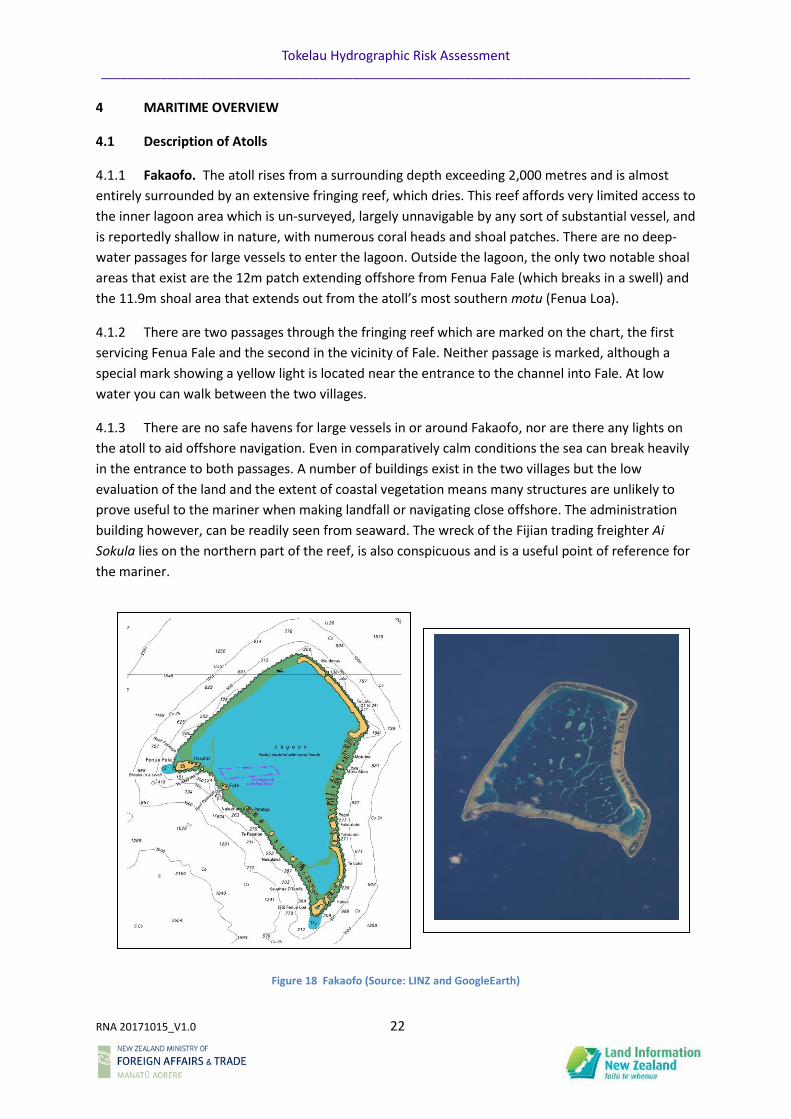
4.1.1 Fakaofo. The atoll rises from a surrounding depth exceeding 2,000 metres and is almost
entirely surrounded by an extensive fringing reef, which dries. This reef affords very limited access to
the inner lagoon area which is un-surveyed, largely unnavigable by any sort of substantial vessel, and
is reportedly shallow in nature, with numerous coral heads and shoal patches. There are no deep-
water passages for large vessels to enter the lagoon. Outside the lagoon, the only two notable shoal
areas that exist are the 12m patch extending offshore from Fenua Fale (which breaks in a swell) and
the 11.9m shoal area that extends out from the atoll’s most southern motu (Fenua Loa).
4.1.2 There are two passages through the fringing reef which are marked on the chart, the first
servicing Fenua Fale and the second in the vicinity of Fale. Neither passage is marked, although a
special mark showing a yellow light is located near the entrance to the channel into Fale. At low
water you can walk between the two villages.
4.1.3 There are no safe havens for large vessels in or around Fakaofo, nor are there any lights on
the atoll to aid offshore navigation. Even in comparatively calm conditions the sea can break heavily
in the entrance to both passages. A number of buildings exist in the two villages but the low
evaluation of the land and the extent of coastal vegetation means many structures are unlikely to
prove useful to the mariner when making landfall or navigating close offshore. The administration
building however, can be readily seen from seaward. The wreck of the Fijian trading freighter Ai
Sokula lies on the northern part of the reef, is also conspicuous and is a useful point of reference for
the mariner.
Figure 18 Fakaofo (Source: LINZ and GoogleEarth)
Tokelau Hydrographic Risk Assessment _________________________________________________________________________________________
RNA 20171015_V1.0 23
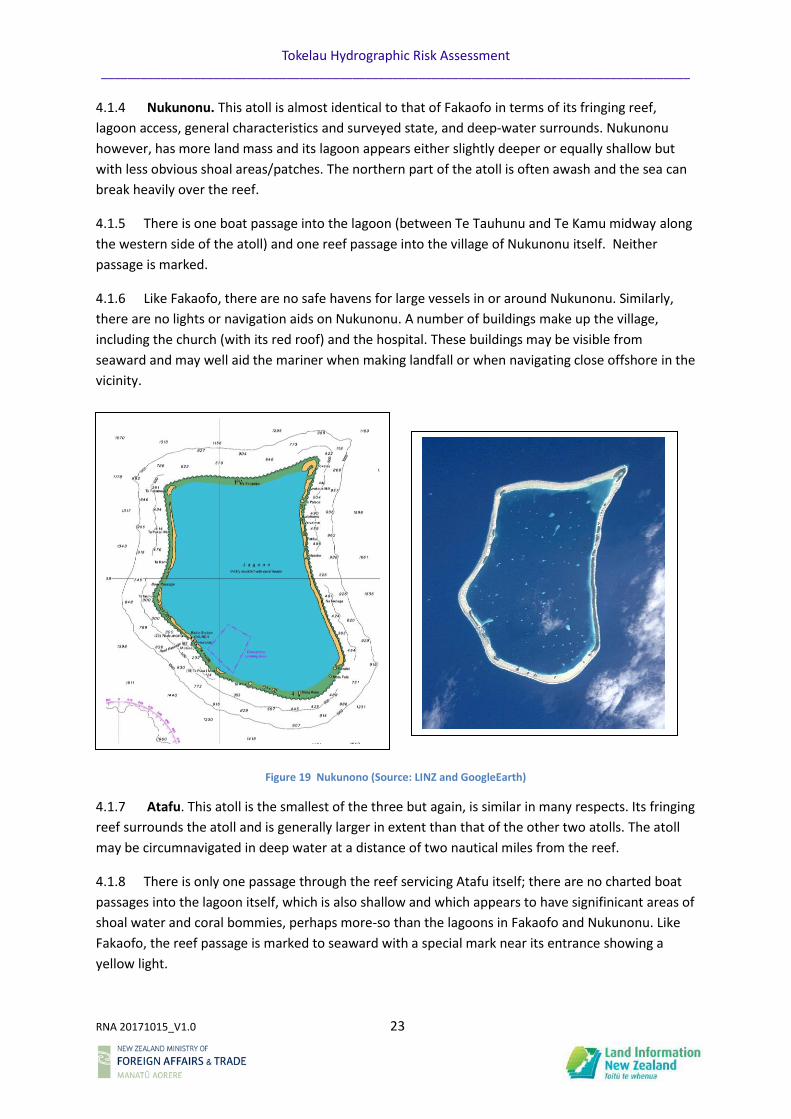
4.1.4 Nukunonu. This atoll is almost identical to that of Fakaofo in terms of its fringing reef,
lagoon access, general characteristics and surveyed state, and deep-water surrounds. Nukunonu
however, has more land mass and its lagoon appears either slightly deeper or equally shallow but
with less obvious shoal areas/patches. The northern part of the atoll is often awash and the sea can
break heavily over the reef.
4.1.5 There is one boat passage into the lagoon (between Te Tauhunu and Te Kamu midway along
the western side of the atoll) and one reef passage into the village of Nukunonu itself. Neither
passage is marked.
4.1.6 Like Fakaofo, there are no safe havens for large vessels in or around Nukunonu. Similarly,
there are no lights or navigation aids on Nukunonu. A number of buildings make up the village,
including the church (with its red roof) and the hospital. These buildings may be visible from
seaward and may well aid the mariner when making landfall or when navigating close offshore in the
vicinity.
Figure 19 Nukunono (Source: LINZ and GoogleEarth)
4.1.7 Atafu. This atoll is the smallest of the three but again, is similar in many respects. Its fringing
reef surrounds the atoll and is generally larger in extent than that of the other two atolls. The atoll
may be circumnavigated in deep water at a distance of two nautical miles from the reef.
4.1.8 There is only one passage through the reef servicing Atafu itself; there are no charted boat
passages into the lagoon itself, which is also shallow and which appears to have signifinicant areas of
shoal water and coral bommies, perhaps more-so than the lagoons in Fakaofo and Nukunonu. Like
Fakaofo, the reef passage is marked to seaward with a special mark near its entrance showing a
yellow light.
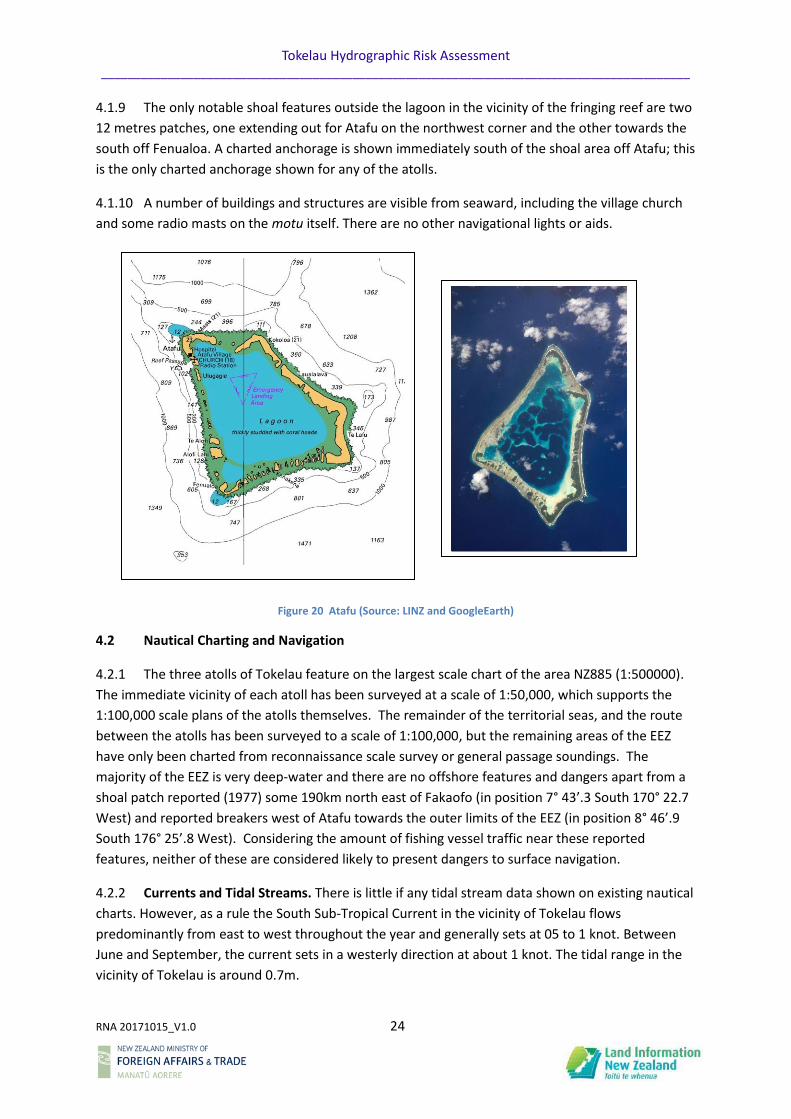
Tokelau Hydrographic Risk Assessment _________________________________________________________________________________________
RNA 20171015_V1.0 24
4.1.9 The only notable shoal features outside the lagoon in the vicinity of the fringing reef are two
12 metres patches, one extending out for Atafu on the northwest corner and the other towards the
south off Fenualoa. A charted anchorage is shown immediately south of the shoal area off Atafu; this
is the only charted anchorage shown for any of the atolls.
4.1.10 A number of buildings and structures are visible from seaward, including the village church
and some radio masts on the motu itself. There are no other navigational lights or aids.
Figure 20 Atafu (Source: LINZ and GoogleEarth)
4.2 Nautical Charting and Navigation
4.2.1 The three atolls of Tokelau feature on the largest scale chart of the area NZ885 (1:500000).
The immediate vicinity of each atoll has been surveyed at a scale of 1:50,000, which supports the
1:100,000 scale plans of the atolls themselves. The remainder of the territorial seas, and the route
between the atolls has been surveyed to a scale of 1:100,000, but the remaining areas of the EEZ
have only been charted from reconnaissance scale survey or general passage soundings. The
majority of the EEZ is very deep-water and there are no offshore features and dangers apart from a
shoal patch reported (1977) some 190km north east of Fakaofo (in position 7° 43’.3 South 170° 22.7
West) and reported breakers west of Atafu towards the outer limits of the EEZ (in position 8° 46’.9
South 176° 25’.8 West). Considering the amount of fishing vessel traffic near these reported
features, neither of these are considered likely to present dangers to surface navigation.
4.2.2 Currents and Tidal Streams. There is little if any tidal stream data shown on existing nautical
charts. However, as a rule the South Sub-Tropical Current in the vicinity of Tokelau flows
predominantly from east to west throughout the year and generally sets at 05 to 1 knot. Between
June and September, the current sets in a westerly direction at about 1 knot. The tidal range in the
vicinity of Tokelau is around 0.7m.

Tokelau Hydrographic Risk Assessment _________________________________________________________________________________________
RNA 20171015_V1.0 25
4.3 Main Harbours, Ports and Anchorages
4.3.1 There are no sea ports, harbours or permanent large vessel anchorage areas in Tokelau.
Each atoll has a small concrete hardstand area located at the end of an artificial passage through the
reef, which is used by each village to embark/disembark passengers and load/unload cargo. There
are no established wharves in the traditional sense, in Tokelau. When larger vessels do call in to
Tokelau they tend to anchor about 360 metres from the passage entrances to load and off-load
cargo by barge. These anchorages are exposed to both the sea and swell at the best of times and
afford little if any protection.
Figure 21 MV Mataliki anchoring off Fakaofo (Source: Government of Tokelau)
Figure 22 Barge operations on Nukunonu (Source: Government of Tokelau)
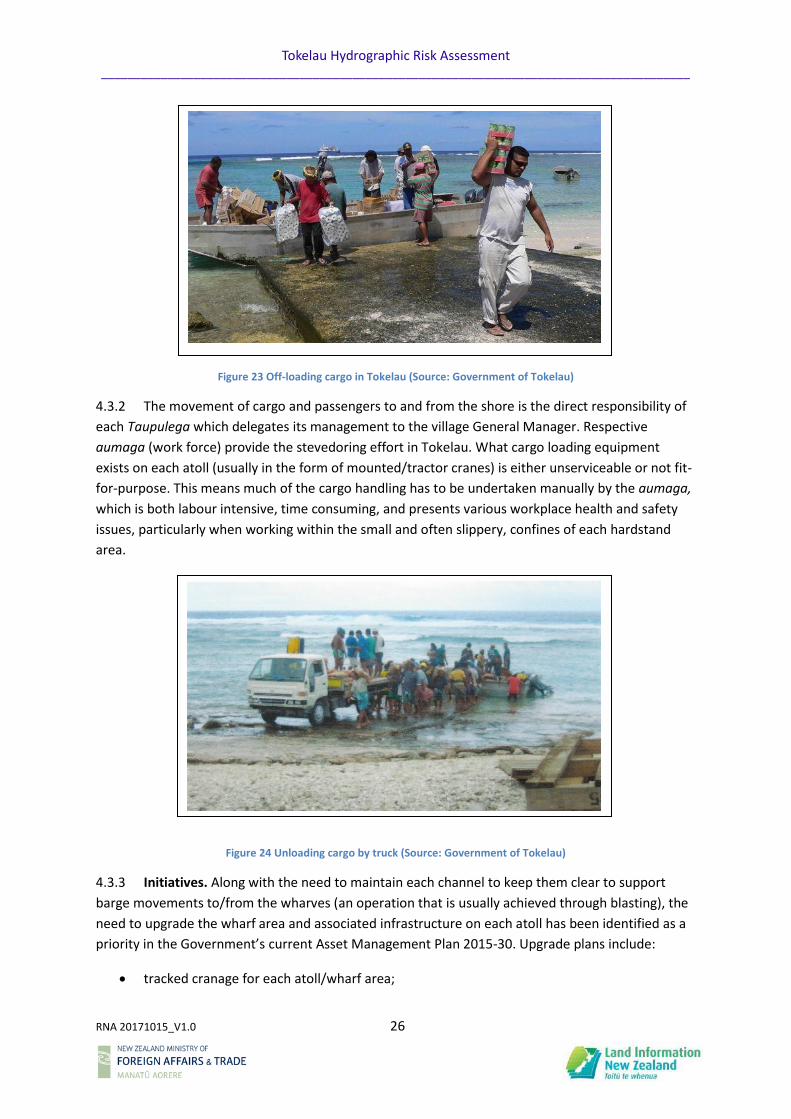
Tokelau Hydrographic Risk Assessment _________________________________________________________________________________________
RNA 20171015_V1.0 26
Figure 23 Off-loading cargo in Tokelau (Source: Government of Tokelau)
4.3.2 The movement of cargo and passengers to and from the shore is the direct responsibility of
each Taupulega which delegates its management to the village General Manager. Respective
aumaga (work force) provide the stevedoring effort in Tokelau. What cargo loading equipment
exists on each atoll (usually in the form of mounted/tractor cranes) is either unserviceable or not fit-
for-purpose. This means much of the cargo handling has to be undertaken manually by the aumaga,
which is both labour intensive, time consuming, and presents various workplace health and safety
issues, particularly when working within the small and often slippery, confines of each hardstand
area.
Figure 24 Unloading cargo by truck (Source: Government of Tokelau)
4.3.3 Initiatives. Along with the need to maintain each channel to keep them clear to support
barge movements to/from the wharves (an operation that is usually achieved through blasting), the
need to upgrade the wharf area and associated infrastructure on each atoll has been identified as a
priority in the Government’s current Asset Management Plan 2015-30. Upgrade plans include:
• tracked cranage for each atoll/wharf area;
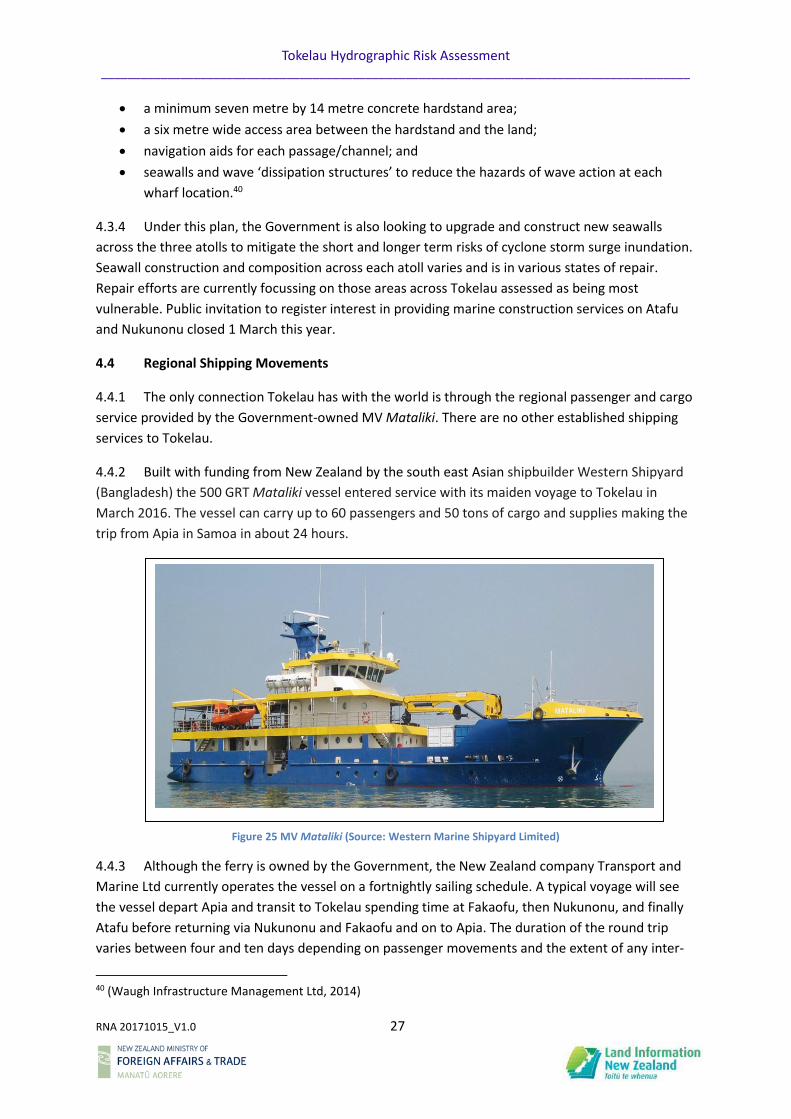
Tokelau Hydrographic Risk Assessment _________________________________________________________________________________________
RNA 20171015_V1.0 27
• a minimum seven metre by 14 metre concrete hardstand area;
• a six metre wide access area between the hardstand and the land;
• navigation aids for each passage/channel; and
• seawalls and wave ‘dissipation structures’ to reduce the hazards of wave action at each
wharf location.40
4.3.4 Under this plan, the Government is also looking to upgrade and construct new seawalls
across the three atolls to mitigate the short and longer term risks of cyclone storm surge inundation.
Seawall construction and composition across each atoll varies and is in various states of repair.
Repair efforts are currently focussing on those areas across Tokelau assessed as being most
vulnerable. Public invitation to register interest in providing marine construction services on Atafu
and Nukunonu closed 1 March this year.
4.4 Regional Shipping Movements
4.4.1 The only connection Tokelau has with the world is through the regional passenger and cargo
service provided by the Government-owned MV Mataliki. There are no other established shipping
services to Tokelau.
4.4.2 Built with funding from New Zealand by the south east Asian shipbuilder Western Shipyard
(Bangladesh) the 500 GRT Mataliki vessel entered service with its maiden voyage to Tokelau in
March 2016. The vessel can carry up to 60 passengers and 50 tons of cargo and supplies making the
trip from Apia in Samoa in about 24 hours.
Figure 25 MV Mataliki (Source: Western Marine Shipyard Limited)
4.4.3 Although the ferry is owned by the Government, the New Zealand company Transport and
Marine Ltd currently operates the vessel on a fortnightly sailing schedule. A typical voyage will see
the vessel depart Apia and transit to Tokelau spending time at Fakaofu, then Nukunonu, and finally
Atafu before returning via Nukunonu and Fakaofu and on to Apia. The duration of the round trip
varies between four and ten days depending on passenger movements and the extent of any inter-
40 (Waugh Infrastructure Management Ltd, 2014)
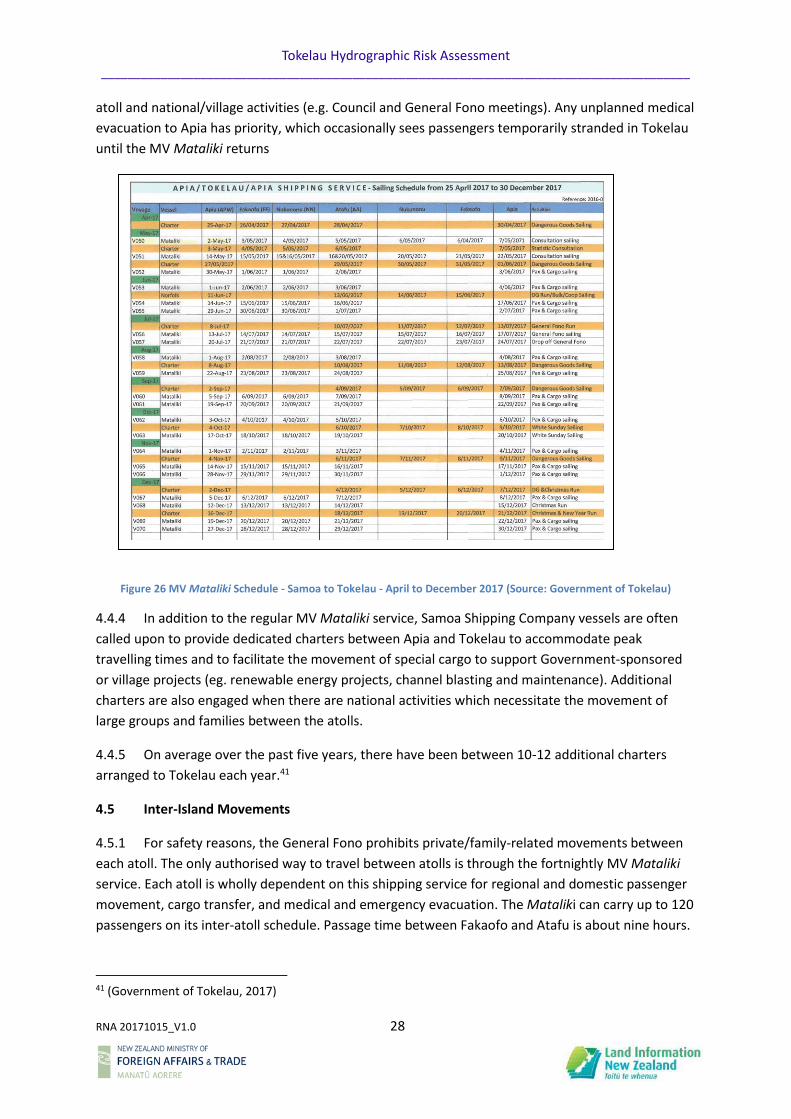
Tokelau Hydrographic Risk Assessment _________________________________________________________________________________________
RNA 20171015_V1.0 28
atoll and national/village activities (e.g. Council and General Fono meetings). Any unplanned medical
evacuation to Apia has priority, which occasionally sees passengers temporarily stranded in Tokelau
until the MV Mataliki returns
Figure 26 MV Mataliki Schedule - Samoa to Tokelau - April to December 2017 (Source: Government of Tokelau)
4.4.4 In addition to the regular MV Mataliki service, Samoa Shipping Company vessels are often
called upon to provide dedicated charters between Apia and Tokelau to accommodate peak
travelling times and to facilitate the movement of special cargo to support Government-sponsored
or village projects (eg. renewable energy projects, channel blasting and maintenance). Additional
charters are also engaged when there are national activities which necessitate the movement of
large groups and families between the atolls.
4.4.5 On average over the past five years, there have been between 10-12 additional charters
arranged to Tokelau each year.41
4.5 Inter-Island Movements
4.5.1 For safety reasons, the General Fono prohibits private/family-related movements between
each atoll. The only authorised way to travel between atolls is through the fortnightly MV Mataliki
service. Each atoll is wholly dependent on this shipping service for regional and domestic passenger
movement, cargo transfer, and medical and emergency evacuation. The Mataliki can carry up to 120
passengers on its inter-atoll schedule. Passage time between Fakaofo and Atafu is about nine hours.
41 (Government of Tokelau, 2017)
Tokelau Hydrographic Risk Assessment _________________________________________________________________________________________
RNA 20171015_V1.0 29
4.5.2 Each atoll has a number of small fishing craft, aluminium boats, and pontoons. Each atoll
also has a number of barges, powered by 40-60hp outboard engines, which are used to conduct ship
to shore passenger and cargo transfers. Fakaofo has a number of other barges, which are used for
solid waste management and hospital passenger services, and to transport school students, teaching
staff and residents between Fale and Fenua Fale.
4.6 Other Maritime Assets 4.6.1 There are no other significant maritime assets in Tokelau. In addition to providing Tokelau’s
cargo and passenger service, the MV Mataliki is used on occasion either by the Government of
Tokelau or by Samoan authorities, for dedicated search and rescue operations either off Tokelau
itself or in the waters between Tokelau and Samoa. The vessel is also available to support any
contingency activity or emergency event, including regional disaster relief and humanitarian
assistance efforts.
4.6.2 Surveillance operations in Tokelau’s EEZ are provided by New Zealand Defence Force air and
maritime platforms or through the Forum Fisheries Agency, with similar support also being provided
by New Zealand as part of New Zealand’s regional surveillance programme.
4.7 Maritime Summary
• Without an airport, Tokelau’s prosperity and economic future is fully dependent on
maritime transportation.
• There is only one regular passenger and freight service to Tokelau, this being the
fortnightly shipping service from Apia.
• There is no other dedicated international shipping that services Tokelau.
• There are no harbours in Tokelau nor are there any wharves or permanent
anchorage areas. All passenger and cargo movements to/from shore are conducted
over the shore by motorised barge.
• The atolls of Tokelau are considered ‘closed’; there is no deep-water passage
reaching into any of the lagoons.
• A priority for the Government of Tokelau is to upgrade existing wharf and channel
infrastructure across each atoll.
• Much of Tokelau’s surrounding waters appear to have been adequately surveyed
although the lagoon areas are either un-surveyed or are considered sufficiently
unnavigable to not warrant bathymetric detail being shown on the current chart.
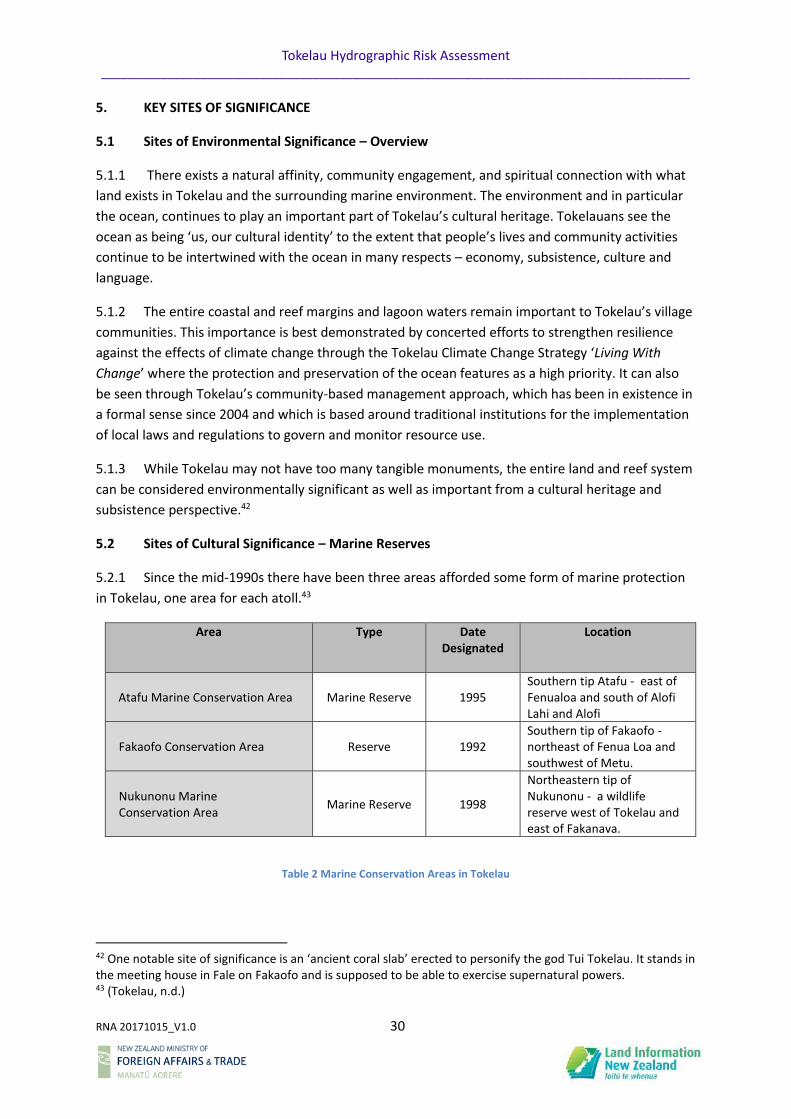
Tokelau Hydrographic Risk Assessment _________________________________________________________________________________________
RNA 20171015_V1.0 30
5. KEY SITES OF SIGNIFICANCE
5.1 Sites of Environmental Significance – Overview
5.1.1 There exists a natural affinity, community engagement, and spiritual connection with what
land exists in Tokelau and the surrounding marine environment. The environment and in particular
the ocean, continues to play an important part of Tokelau’s cultural heritage. Tokelauans see the
ocean as being ‘us, our cultural identity’ to the extent that people’s lives and community activities
continue to be intertwined with the ocean in many respects – economy, subsistence, culture and
language.
5.1.2 The entire coastal and reef margins and lagoon waters remain important to Tokelau’s village
communities. This importance is best demonstrated by concerted efforts to strengthen resilience
against the effects of climate change through the Tokelau Climate Change Strategy ‘Living With
Change’ where the protection and preservation of the ocean features as a high priority. It can also
be seen through Tokelau’s community-based management approach, which has been in existence in
a formal sense since 2004 and which is based around traditional institutions for the implementation
of local laws and regulations to govern and monitor resource use.
5.1.3 While Tokelau may not have too many tangible monuments, the entire land and reef system
can be considered environmentally significant as well as important from a cultural heritage and
subsistence perspective.42
5.2 Sites of Cultural Significance – Marine Reserves
5.2.1 Since the mid-1990s there have been three areas afforded some form of marine protection
in Tokelau, one area for each atoll.43
Area Type Date Designated
Location
Atafu Marine Conservation Area Marine Reserve 1995 Southern tip Atafu - east of Fenualoa and south of Alofi Lahi and Alofi
Fakaofo Conservation Area
Reserve 1992 Southern tip of Fakaofo - northeast of Fenua Loa and southwest of Metu.
Nukunonu Marine Conservation Area
Marine Reserve 1998
Northeastern tip of Nukunonu - a wildlife reserve west of Tokelau and east of Fakanava.
Table 2 Marine Conservation Areas in Tokelau
42 One notable site of significance is an ‘ancient coral slab’ erected to personify the god Tui Tokelau. It stands in the meeting house in Fale on Fakaofo and is supposed to be able to exercise supernatural powers. 43 (Tokelau, n.d.)
Tokelau Hydrographic Risk Assessment _________________________________________________________________________________________
RNA 20171015_V1.0 31
5.2.2 In these marine reserves there are no markers. However, people are familiar with any tabu
areas since the boundaries tend to be the islets themselves, along with the divide between the
ocean and lagoon sides of each motu and reef area.
5.2.3 Initiatives. A 2013 report by the Department of Economic Development, Natural Resources
and Environment of Tokelau and the Secretariat of the Pacific Community, recommended the
establishment of more enduring marine protected areas covering some 50 to 200 hectares to
mitigate the effects of climate change and fishing pressure and to improve the resilience of marine
resources:
• Nukunonu - the section of the reef/lagoon from the motu Te Afua to the motu Fala (including
the Te akau loa coral patch reef) and the south-east section of the reef/lagoon to the east
and south of the motu Tokelau, including motu Tokelau itself.
• Atafu - the reef/lagoon area around the motu Te Alofi to Ava o te Puka and the southern
section or reef/lagoon adjacent to the motu Na Utua (including all coral patch reefs in the
lagoon); and
• Fakaofo - the section of the reef/lagoon south of Nukutakia to Akegamatu, together with
one or two selected large coral patch reefs inside the lagoon itself.44
Whether there has been any movement to establish permanently protected areas across any of
these recommended areas is unknown.
5.3 Significant Site Summary
44 (The Status of Reef Invertebrate Resources and Recommendations for Management at Tokelau, 2013)
• All of Tokelau’s coastline and coastal and lagoon waters can be considered either
environmentally and culturally significant or considered important from a biodiversity
perspective.
• There are only three formally recognised marine areas of significance in Tokelau.
• The coastal and lagoon waters of each atoll are administered through community-based
management plans.
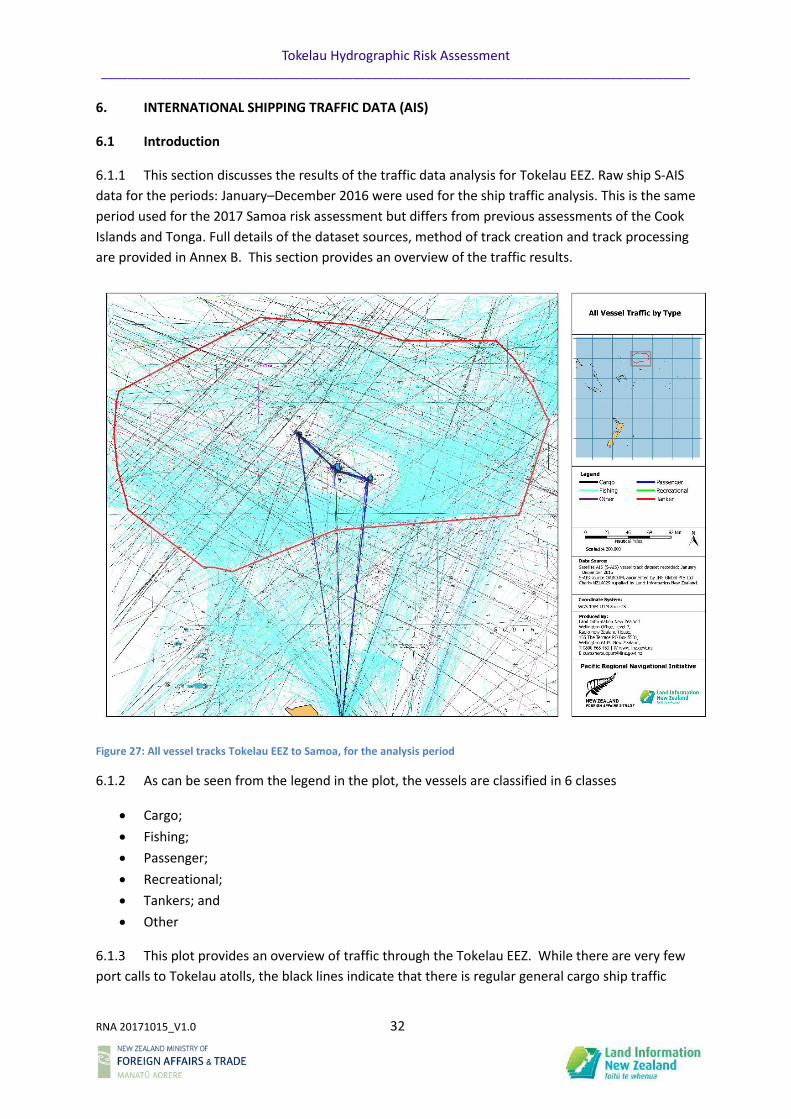
Tokelau Hydrographic Risk Assessment _________________________________________________________________________________________
RNA 20171015_V1.0 32
6. INTERNATIONAL SHIPPING TRAFFIC DATA (AIS)
6.1 Introduction
6.1.1 This section discusses the results of the traffic data analysis for Tokelau EEZ. Raw ship S-AIS
data for the periods: January–December 2016 were used for the ship traffic analysis. This is the same
period used for the 2017 Samoa risk assessment but differs from previous assessments of the Cook
Islands and Tonga. Full details of the dataset sources, method of track creation and track processing
are provided in Annex B. This section provides an overview of the traffic results.
Figure 27: All vessel tracks Tokelau EEZ to Samoa, for the analysis period
6.1.2 As can be seen from the legend in the plot, the vessels are classified in 6 classes
• Cargo;
• Fishing;
• Passenger;
• Recreational;
• Tankers; and
• Other
6.1.3 This plot provides an overview of traffic through the Tokelau EEZ. While there are very few
port calls to Tokelau atolls, the black lines indicate that there is regular general cargo ship traffic
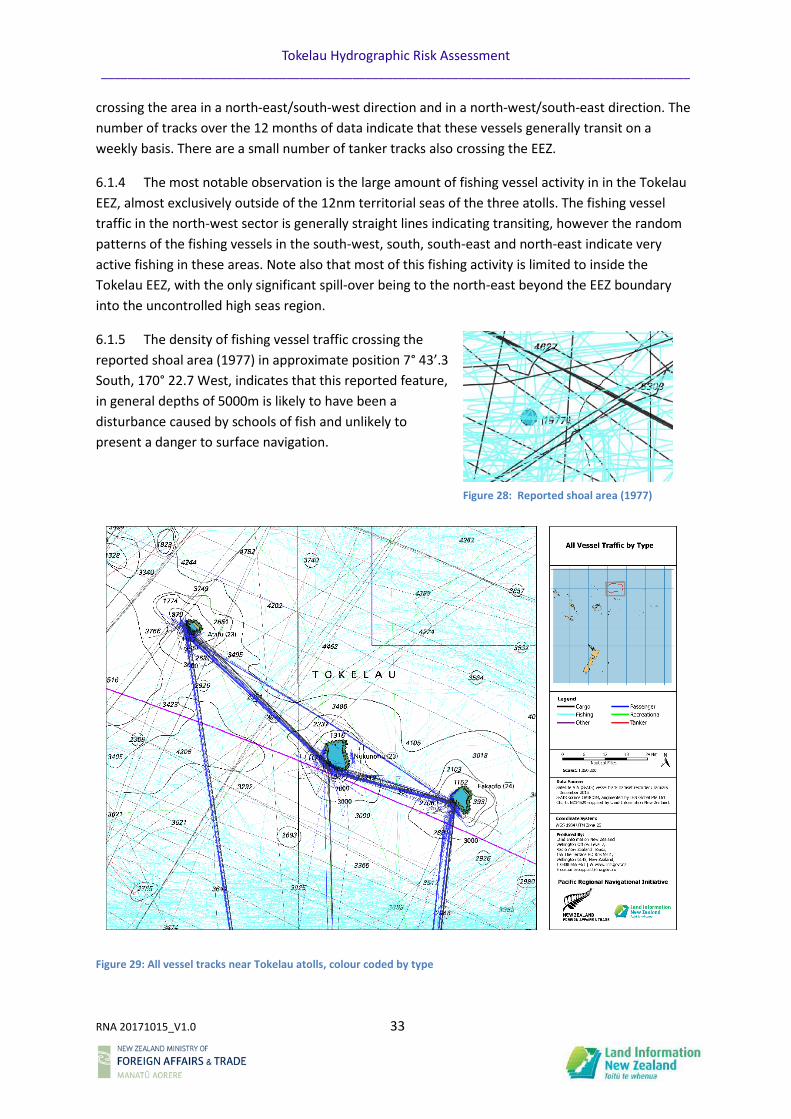
Tokelau Hydrographic Risk Assessment _________________________________________________________________________________________
RNA 20171015_V1.0 33
crossing the area in a north-east/south-west direction and in a north-west/south-east direction. The
number of tracks over the 12 months of data indicate that these vessels generally transit on a
weekly basis. There are a small number of tanker tracks also crossing the EEZ.
6.1.4 The most notable observation is the large amount of fishing vessel activity in in the Tokelau
EEZ, almost exclusively outside of the 12nm territorial seas of the three atolls. The fishing vessel
traffic in the north-west sector is generally straight lines indicating transiting, however the random
patterns of the fishing vessels in the south-west, south, south-east and north-east indicate very
active fishing in these areas. Note also that most of this fishing activity is limited to inside the
Tokelau EEZ, with the only significant spill-over being to the north-east beyond the EEZ boundary
into the uncontrolled high seas region.
6.1.5 The density of fishing vessel traffic crossing the
reported shoal area (1977) in approximate position 7° 43’.3
South, 170° 22.7 West, indicates that this reported feature,
in general depths of 5000m is likely to have been a
disturbance caused by schools of fish and unlikely to
present a danger to surface navigation.
Figure 29: All vessel tracks near Tokelau atolls, colour coded by type
Figure 28: Reported shoal area (1977)
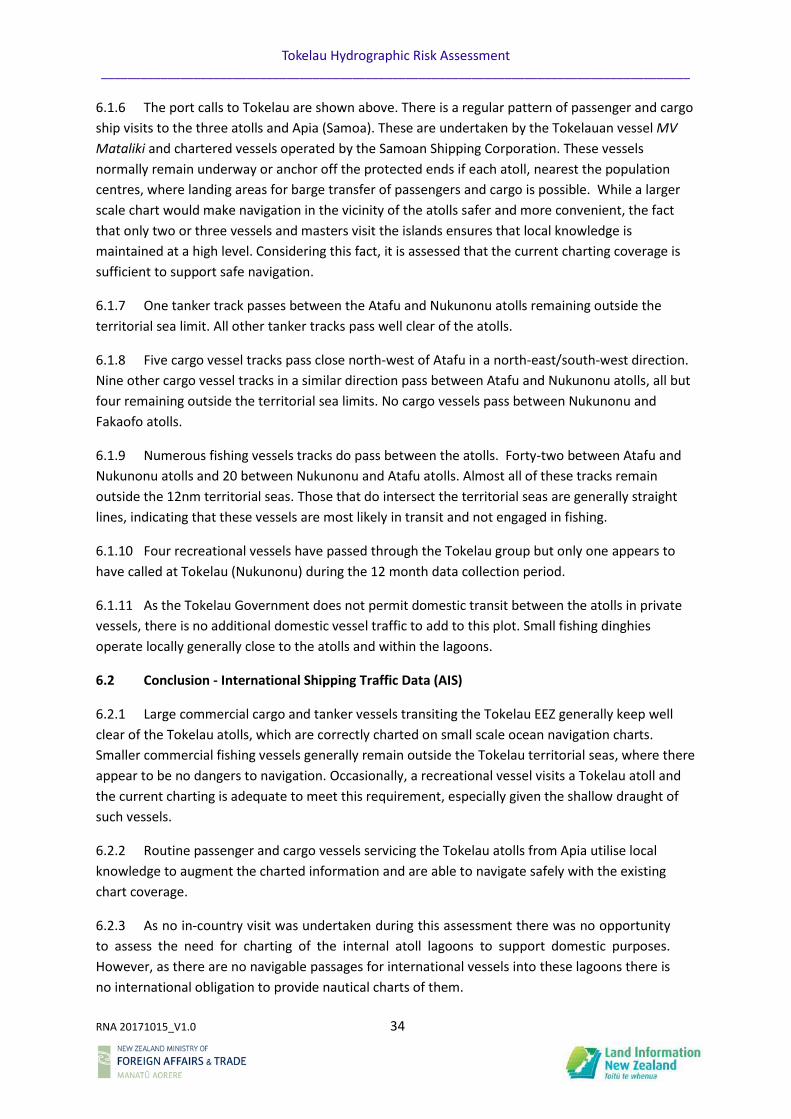
Tokelau Hydrographic Risk Assessment _________________________________________________________________________________________
RNA 20171015_V1.0 34
6.1.6 The port calls to Tokelau are shown above. There is a regular pattern of passenger and cargo
ship visits to the three atolls and Apia (Samoa). These are undertaken by the Tokelauan vessel MV
Mataliki and chartered vessels operated by the Samoan Shipping Corporation. These vessels
normally remain underway or anchor off the protected ends if each atoll, nearest the population
centres, where landing areas for barge transfer of passengers and cargo is possible. While a larger
scale chart would make navigation in the vicinity of the atolls safer and more convenient, the fact
that only two or three vessels and masters visit the islands ensures that local knowledge is
maintained at a high level. Considering this fact, it is assessed that the current charting coverage is
sufficient to support safe navigation.
6.1.7 One tanker track passes between the Atafu and Nukunonu atolls remaining outside the
territorial sea limit. All other tanker tracks pass well clear of the atolls.
6.1.8 Five cargo vessel tracks pass close north-west of Atafu in a north-east/south-west direction.
Nine other cargo vessel tracks in a similar direction pass between Atafu and Nukunonu atolls, all but
four remaining outside the territorial sea limits. No cargo vessels pass between Nukunonu and
Fakaofo atolls.
6.1.9 Numerous fishing vessels tracks do pass between the atolls. Forty-two between Atafu and
Nukunonu atolls and 20 between Nukunonu and Atafu atolls. Almost all of these tracks remain
outside the 12nm territorial seas. Those that do intersect the territorial seas are generally straight
lines, indicating that these vessels are most likely in transit and not engaged in fishing.
6.1.10 Four recreational vessels have passed through the Tokelau group but only one appears to
have called at Tokelau (Nukunonu) during the 12 month data collection period.
6.1.11 As the Tokelau Government does not permit domestic transit between the atolls in private
vessels, there is no additional domestic vessel traffic to add to this plot. Small fishing dinghies
operate locally generally close to the atolls and within the lagoons.
6.2 Conclusion - International Shipping Traffic Data (AIS)
6.2.1 Large commercial cargo and tanker vessels transiting the Tokelau EEZ generally keep well
clear of the Tokelau atolls, which are correctly charted on small scale ocean navigation charts.
Smaller commercial fishing vessels generally remain outside the Tokelau territorial seas, where there
appear to be no dangers to navigation. Occasionally, a recreational vessel visits a Tokelau atoll and
the current charting is adequate to meet this requirement, especially given the shallow draught of
such vessels.
6.2.2 Routine passenger and cargo vessels servicing the Tokelau atolls from Apia utilise local
knowledge to augment the charted information and are able to navigate safely with the existing
chart coverage.
6.2.3 As no in-country visit was undertaken during this assessment there was no opportunity
to assess the need for charting of the internal atoll lagoons to support domestic purposes.
However, as there are no navigable passages for international vessels into these lagoons there is
no international obligation to provide nautical charts of them.
Tokelau Hydrographic Risk Assessment _________________________________________________________________________________________
RNA 20171015_V1.0 35
7. RISK ANALYSIS
7.1 Introduction
7.1.1 No spatial or numeric risk assessment has yet been conducted for Tokelau. This may be
undertaken in the future if demand warrants.
Tokelau Hydrographic Risk Assessment _________________________________________________________________________________________
RNA 20171015_V1.0 36
8. REFERENCES
Australian Department of Foreign Affairs and Trade. (2017). Development Assistance in Tokelau.
Retrieved 06 12, 2017, from Australian Government - Department of Foreign Affairs and
Trade: http://dfat.gov.au/geo/tokelau/development-assistance/Pages/development-
assistance-in-tokelau.aspx
Calder, B. a. (2009). Traffic Analysis for the Calibration of Risk Assessment Methods, . Available at:
http://vislab-ccom.unh.edu/~schwehr/papers/2009ushydro-
calder_schwehr_AIS_Traffic_Analysis.pdf. US Hydro(May 11-14 2009). Retrieved from
http://vislab-ccom.unh.edu/~schwehr/papers/2009ushydro-
calder_schwehr_AIS_Traffic_Analysis.pdf
CIA Factbook. (2017). Ethnic Groups. Retrieved 06 12, 2017, from CIA - The World Fact Book:
https://www.cia.gov/library/publications/the-world-factbook/fields/2075.html
Department of Economic Development Natural Resources and Environment of Tokelau. (2017).
Retrieved from South Pacific Fisheries Cooperation:
http://www.tevakamoana.org/member/department-of-economic-development-natural-
resources-and-environment-of-tokelau
Government of Tokelau. (2014). History. Retrieved 06 12, 2017, from Government of Tokelau:
http://www.tokelau.org.nz/About+Us/History.html
Government of Tokelau. (2017). Culture & Society. Retrieved from Government of Tokelau:
http://www.tokelau.org.nz/About+Us/Culture.html
Government of Tokelau, D. o. (2017). Transport. Retrieved from Government of Tokelau:
http://www.tokelau.org.nz/Tokelau+Government/Government+Departments/Department+
of+Transport++Support+Services.html
Guevara-Stone, L. (2013, October 6). An Island (Tokelau) Powered 100% By Solar Energy. Retrieved
from CleanTechnica: https://cleantechnica.com/2013/10/06/an-island-tokelau-powered-
100-by-solar-energy/
Jasperse, J. (. (2015, September). Analysing 2014 imports from Samoa by Tokelau’s co‐
operative and bulk stores . Retrieved from Government of Tokelau:
http://www.tokelau.org.nz/site/tokelau/files/TokelauNSO/AnalysingTokelauStoresImports2
014w2.pdf
Land Information New Zealand and Rod Nairn & Associates Pty Ltd. (2016). RNAPL16002 - NIUE
Hydrographic Risk Assessment. Wellington.
Land Information New Zealand and Rod Nairn & Associates Pty Ltd. (2017). RNAPL17001 - SAMOA
Hydrographic Risk Assessment. Wellington.
Tokelau Hydrographic Risk Assessment _________________________________________________________________________________________
RNA 20171015_V1.0 37
Lindsay Chapman, Kim Des Rochers, and Mose Pelasio. (October/December 2005). Survey of Fishing
Activities in Tokelau. SPC Fisheries Newsletter #115, 36-40.
Marico Marine Report No 14NZ262CS Issue 02. (January 2015). LINZ South West Pacific Regional
Hydrography Programme Cook Islands Risk Assessement - Report Synopsis. Wellington.
Marico Marine Report No. 12NZ246-1. (January 2013). LINZ Pacific Regional Hydrography
Programme – Hydrographic Risk Assessment – Vanuatu.
Marico Marine Report No. 14NZ262 – TM, Issue 1. (27 November 2014). LINZ South West Pacific
Regional Hydrography Programme - Tonga Risk Assessment.
Marico Marine Report No. 14NZ262MR Issue 02. (20 January 2015). LINZ South West Pacific Regional
Hydrography Programme - Cook Islands Risk Assessment.
Marico Marine Report No. 15NZ322 Issue 03. (5 August 2015). LINZ Hydrography Risk Assessment
Methodology Update.
National Strategy For The Development of National Statistics Roadmap – Tokelau . (2015,
December). Retrieved from Partnership in Statistics for Development in the 21st Century:
http://www.paris21.org/sites/default/files/Tokelau%20NSDS%20Roadmap.pdf
New Zealand Foreign Affairs and Trade. (2017). Tokelau. Retrieved 2017, from New Zealand Foreign
Affairs and Trade: https://mfat.govt.nz/en/countries-and-regions/pacific/tokelau/
New Zealand Ministry of Foreign Affairs and Trade. (2017). Tokelau. Retrieved 06 12, 2017, from
New Zealand Foreign Affairs and Trade - Tokelau: https://www.mfat.govt.nz/en/countries-
and-regions/pacific/tokelau/
Ocean, C. f. (5-13 August 2015). Annual Report to the Commission Part 1: Information on Fisheries,
Research and Statistics - Tokelau. Federated States of Micronesia: Western and Central
Pacific Fisheries Commission. Retrieved from
https://spccfpstore1.blob.core.windows.net/digitallibrary-
docs/files/53/532d297ce3ce98a88da56c89c42bd646.pdf?sv=2015-12-
11&sr=b&sig=6LJ%2BshQS59ra1IK4ggekP6Pw8GPqOh2zz%2BsvSoSr0FM%3D&se=2017-08-
07T10%3A52%3A16Z&sp=r&rscc=public%2C%20max-age%3D864000%2C%20
Pacific Climate Change Portal. (2017). Tokelau. Retrieved from Pacific Climate Change Portal:
https://www.pacificclimatechange.net/country/tokelau
Pacific Environment Information Network. (2017, June). Pacific Climate Change Portal - Tokelau.
Retrieved 2017, from Pacific Climate Change Portal:
https://www.pacificclimatechange.net/country/tokelau
Stamps and Coins Providing a Growing Income For Tokelau. (2015, April 2). Retrieved from
Government of Tokelau:
http://www.tokelau.org.nz/Bulletin/April+2015/Stamps+and+Coins+Providing+a+Growing+I
ncome+for+Tokelau.html
Tokelau Hydrographic Risk Assessment _________________________________________________________________________________________
RNA 20171015_V1.0 38
Tauafiafi, L. A. (2016, December 7). Tokelau’s tuna success - testament to Pacific solidarity’s
multimillion dollar effect. Retrieved from PACIFIC GUARDIANS/PACNEWS:
http://www.pina.com.fj/?p=pacnews&m=read&o=17991291375848b92ede020ce92b07
The Commission for the Conservation and Management of Highly Migratory Fish Stocks in the
Western and Central Pacific Ocean. (2016). Annual Report to the Commission Part 1:
Information on Fisheries, Research and Statistiics - Tokelau. Bali, Indonesia: Western and
Central Pacific Fisheries Commission.
The Status of Reef Invertebrate Resources and Recommendations for Management at Tokelau.
(2013, July). Retrieved from Secretariat of the Pacific Community:
https://spccfpstore1.blob.core.windows.net/digitallibrary-
docs/files/3a/3a6bb2af7dfc0b9590af34bd272f104b.pdf?sv=2015-12-
11&sr=b&sig=SsQdBjMvOo7yemYGqOHyjRVwHt6R7v%2FiHWji56%2F16NM%3D&se=2017-
09-07T07%3A14%3A50Z&sp=r&rscc=public%2C%20max-age%3D864000%2C%20
The World CIA Factbook. (2017). Tokelau. Retrieved from CIA: The World Fact Book:
https://www.cia.gov/library/publications/resources/the-world-factbook/geos/tl.html
Tokelau. (n.d.). Retrieved from Mapcarta: https://mapcarta.com/Tokelau
Tokelau Census of Population and Dwellings. (n.d.). Retrieved from Government of Tokelau:
http://www.tokelau.org.nz/Tokelau+Government/Government+Departments/Office+of+the
+Council+for+the+Ongoing+Government+OCOG/Tokelau+National+Statistics+Office/census.
html
Tokelau National Strategic Plan 2010-2015. (2010, March). Retrieved from Government of Tokelau -
Council for Ongoing Government :
http://www.sprep.org/att/irc/ecopies/countries/tokelau/22.pdf
Tokelau National Strategic Plan 2010-2015. (2010, 03 04). Retrieved from Government of Tokelau:
http://www.tokelau.org.nz/Strategic+Plan.html#VISION
Tokelau: A True Small Island Developing State. (n.d.). Retrieved from Government of Tokelau:
http://www.tokelau.org.nz/About+Us.html
Tokelau’s Gross Domestic Product determined for first time this century. (2017, April 28). Retrieved
from Government of Tokelau:
http://www.tokelau.org.nz/Bulletin/April+2017/GDP+first.html
Tourism, Travel, & Information Guide to the New Zealand Territory of Tokelau. (2015). Retrieved
from Tokelau.com: http://www.tokelau.com/
Tourist Information. (n.d.). Retrieved from Government of Tokelau:
http://www.tokelau.org.nz/Tokelau+Government/Visiting+Tokelau/Tourist+Information.ht
ml
Tokelau Hydrographic Risk Assessment _________________________________________________________________________________________
RNA 20171015_V1.0 39
Villages. (n.d.). Retrieved from The Government of Tokelau:
http://www.tokelau.org.nz/About+Us/Villages.html
Vunisea, A. (2004). Community-Based Fisheries Management Plans for Tokelau. SPC Fisheries
Newsletter #108 - January/March 2004, 30-32.
Waugh Infrastructure Management Ltd. (2014, August). Asset Management Plan 2015-30. Retrieved
from Government of Tokelau:
http://www.tokelau.org.nz/site/tokelau/Asset%20Management%20Project.pdf

Tokelau Hydrographic Risk Assessment _________________________________________________________________________________________
RNA 20171015_V1.0
ANNEXES
NIUE Hydrographic Risk Assessment
_______________________________________________________________________________________
ANNEX A - Event Trees
RNA 20171015_V1.0 Page A-1
1. Event trees were used to determine the most likely and worst credible impacts of
defined unwanted navigation events. For consistency and commonality across the south-west
Pacific hydrographic risk assessment area, the event trees in this Annex are based on the generic
event trees in the Risk Assessment Methodology45 and those used in the Cook Islands46 and
Tonga,47 which were subsequently modified for Niue48 and Samoa.49 These have been further
adapted for the general risks to Tokelau.
2. Tokelau has no domestic cargo or passenger vessels of any recordable GT, all domestic
movements are undertaken by international vessels.
3. These event trees are for general information only and have not been used to amend
the generic South West Pacific risk consequence factors weightings which are included for
information at Annex E.
45 (Marico Marine Report No. 15NZ322 Issue 03, 5 August 2015) 46 (Marico Marine Report No. 14NZ262MR Issue 02, 20 January 2015) 47 (Marico Marine Report No. 14NZ262 – TM, Issue 1, 27 November 2014) 48 (RNAPL16002 - NIUE Hydrographic Risk Assessment, 2016) 49 (RNAPL17001 - SAMOA Hydrographic Risk Assessment, 2017)

TOKELAU Hydrographic Risk Assessment _________________________________________________________________________________________________________________________________________________________________________________________________________________
ANNEX A - Event Trees
RNA 20171015_V1.0 A-2
Marine Accident
Grounding Foundering
Recreational Vessel SOLAS Dry Cargo SOLAS Liquid Bulk
Most Likely Scenario
Vessel breaks mooring and is washed ashore on
to reef.
Most likely consequence impacts
People
Nil or minor injuries
Property
Vessel suffers some hull and propellor damage. Can be
refloated and make own way.
Environment
Minor physical damage to reef in
vicinity of grounding.
Possible spillage of 100 litres diesel.
Stakeholder/Economic
Cost of repairs by boatowner.
Minor local disruption to subsistence fishing.
Worst Credible Scenario
Vessel grounds at night or in bad weather on weather side of island
and breaks up
Worst Credible consequence impacts
People
Possibly 2 fatalities and serious injury
Property
Vessel a total loss.
Environment
Possible loss of 100 litres diesel fuel. Minor physical
damage to reef, debris field along
coast minor impact on fishing and
foreshore.
Economic/Stakeholder
Minor disruption to fishing. Diesel spill
insignificant.
SOLAS Passenger
Collision

TOKELAU Hydrographic Risk Assessment _________________________________________________________________________________________________________________________________________________________________________________________________________________
ANNEX A - Event Trees
RNA 20171015_V1.0 A-3
Marine Accident
Grounding Foundering
Recreational Vessel SOLAS Dry Cargo SOLAS Liquid Bulk
Most Likely Scenario
Vessel grounds at low speed after suffering
propulsion failure and drifting or breaking
anchor cable when re-supplying atoll.
Most likely consequence impacts
People
No injuries
Property
Vessel suffers minor damage as coast deep to steep-to
rocky shore. Vessel able to clear reef
under own power.
Environment
Possible release of 1 tonne MFO. Minor physical damage to reef ivo grounding.
Local pollution impact on
subsistence fishing.
Stakeholder/Economic
Schedule of island re-provisioning disrupted - sufficient reserves of
fuel held.
Some impact on tourism.
Worst Credible Scenario
Vessel grounds at high speed on Tokelau atoll due
cyclone, poor weather/visibility,
navigation equipment or engine failure - no landfall
light exists. Salvage tug and international cleanup effort
required
Worst Credible consequence impacts
People
Possibility of injuries or fatalities
particularly if ship strands and is
abandoned
Property
Serious hull and structural damage,
requires salvage and drydocking or may be
a total loss.
Environment
Possible loss of 300 tonnes MFO bunkers.
Massive damage to reef, breeding
grounds.
Economic/Stakeholder
Damage to local reef and fish stocks and
breeding areas. Interruption to
subsistence fishing.
International media interest.
SOLAS Passenger
Collision
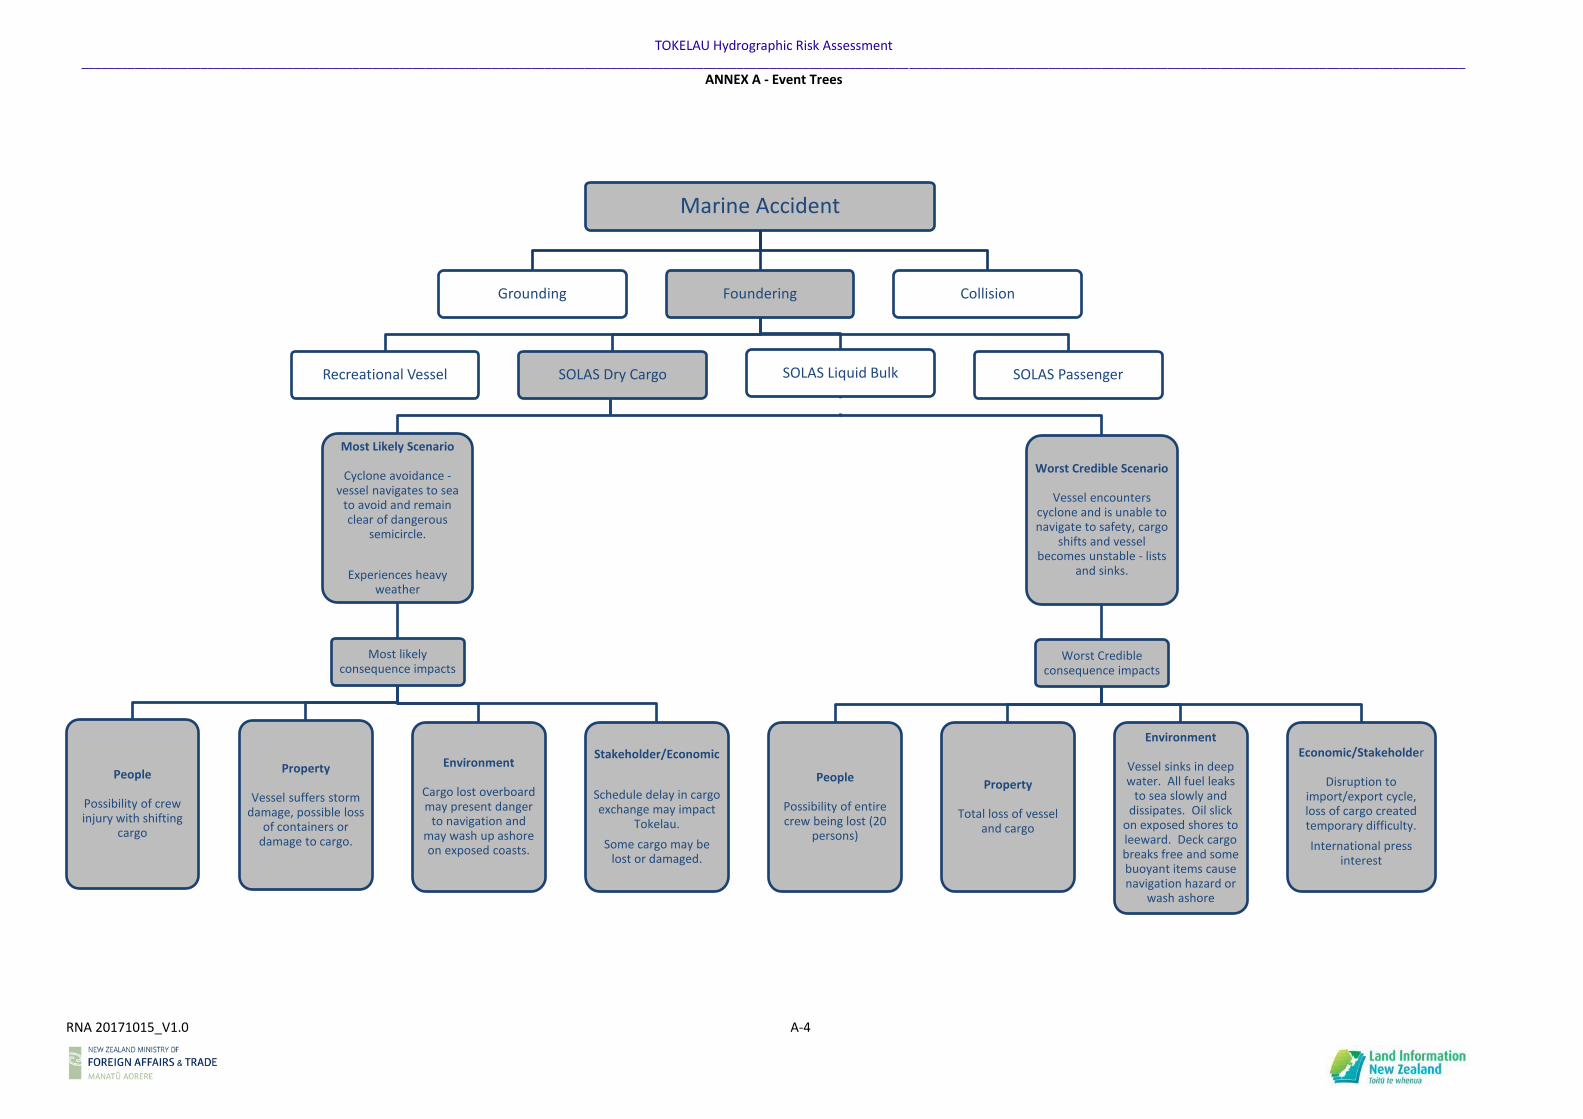
TOKELAU Hydrographic Risk Assessment _________________________________________________________________________________________________________________________________________________________________________________________________________________
ANNEX A - Event Trees
RNA 20171015_V1.0 A-4
Marine Accident
Grounding Foundering
Recreational Vessel SOLAS Dry Cargo SOLAS Liquid Bulk
Most Likely Scenario
Cyclone avoidance -vessel navigates to sea
to avoid and remain clear of dangerous
semicircle.
Experiences heavy weather
Most likely consequence impacts
People
Possibility of crew injury with shifting
cargo
Property
Vessel suffers storm damage, possible loss
of containers or damage to cargo.
Environment
Cargo lost overboard may present danger
to navigation and may wash up ashore on exposed coasts.
Stakeholder/Economic
Schedule delay in cargo exchange may impact
Tokelau.
Some cargo may be lost or damaged.
Worst Credible Scenario
Vessel encounters cyclone and is unable to navigate to safety, cargo
shifts and vessel becomes unstable - lists
and sinks.
Worst Credible consequence impacts
People
Possibility of entire crew being lost (20
persons)
Property
Total loss of vessel and cargo
Environment
Vessel sinks in deep water. All fuel leaks
to sea slowly and dissipates. Oil slick
on exposed shores to leeward. Deck cargo breaks free and some buoyant items cause navigation hazard or
wash ashore
Economic/Stakeholder
Disruption to import/export cycle, loss of cargo created temporary difficulty.
International press interest
SOLAS Passenger
Collision
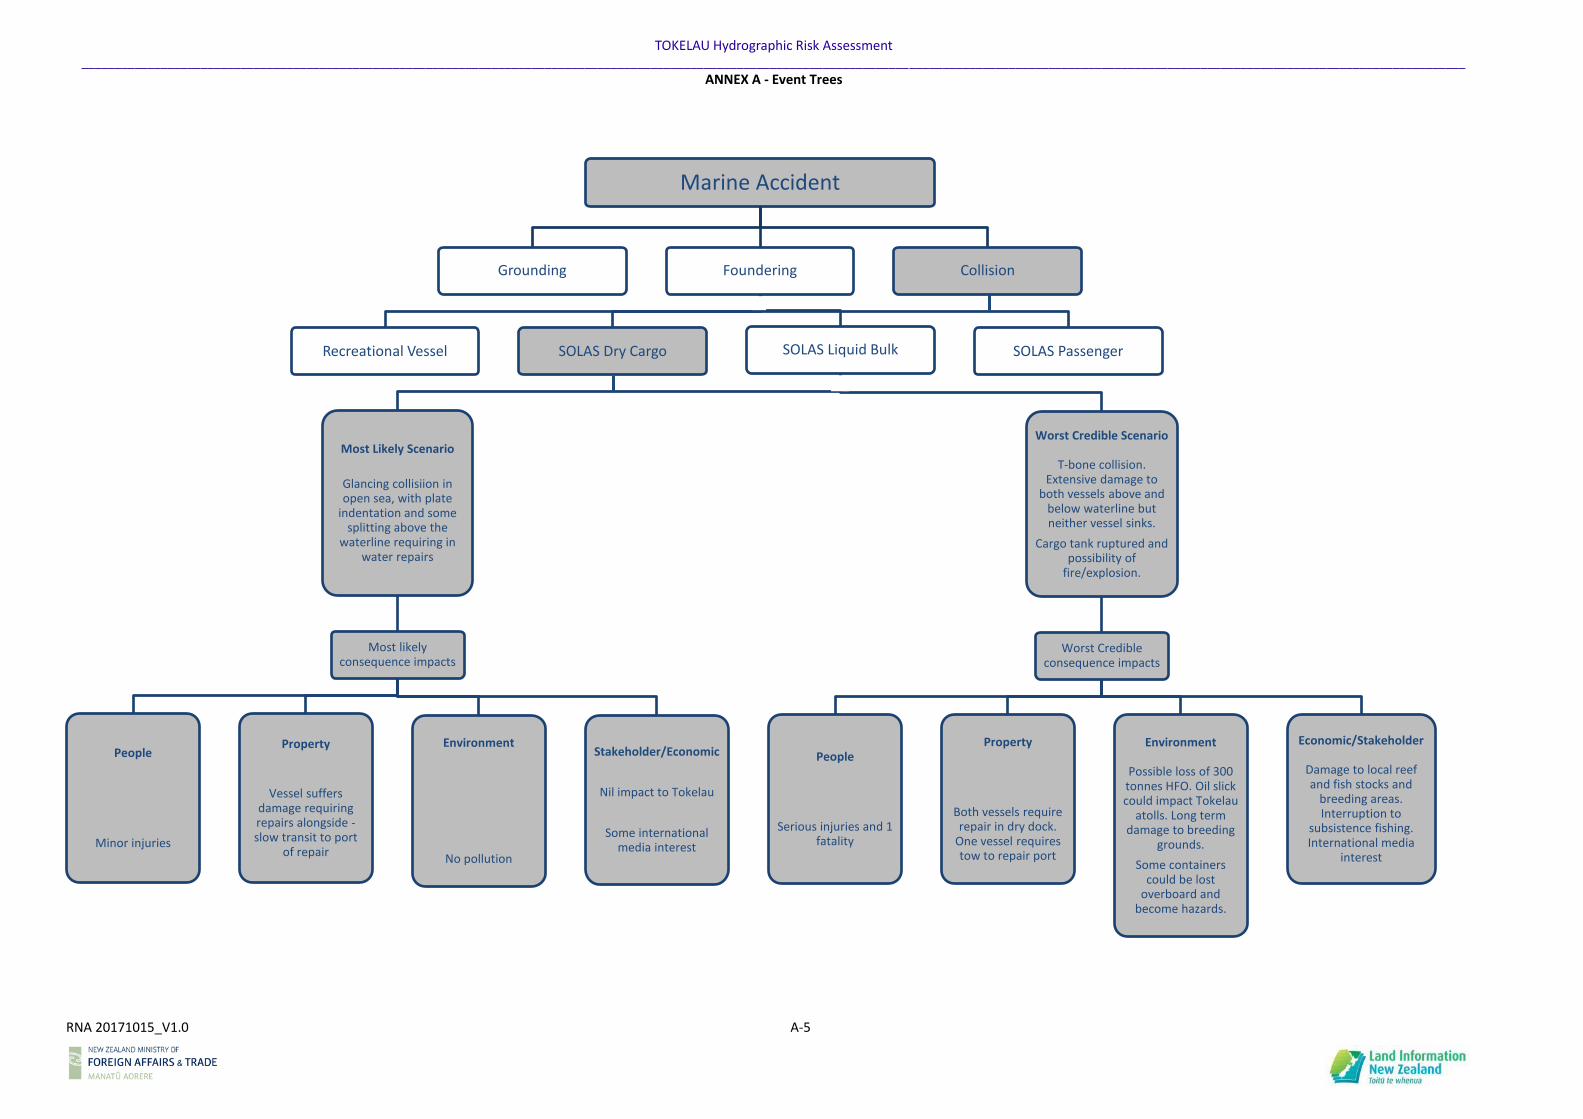
TOKELAU Hydrographic Risk Assessment _________________________________________________________________________________________________________________________________________________________________________________________________________________
ANNEX A - Event Trees
RNA 20171015_V1.0 A-5
Marine Accident
Grounding Foundering
Recreational Vessel SOLAS Dry Cargo SOLAS Liquid Bulk
Most Likely Scenario
Glancing collisiion in open sea, with plate
indentation and some splitting above the
waterline requiring in water repairs
Most likely consequence impacts
People
Minor injuries
Property
Vessel suffers damage requiring repairs alongside -slow transit to port
of repair
Environment
No pollution
Stakeholder/Economic
Nil impact to Tokelau
Some international media interest
Worst Credible Scenario
T-bone collision. Extensive damage to
both vessels above and below waterline but neither vessel sinks.
Cargo tank ruptured and possibility of
fire/explosion.
Worst Credible consequence impacts
People
Serious injuries and 1 fatality
Property
Both vessels require repair in dry dock.
One vessel requires tow to repair port
Environment
Possible loss of 300 tonnes HFO. Oil slick could impact Tokelau
atolls. Long term damage to breeding
grounds.
Some containers could be lost
overboard and become hazards.
Economic/Stakeholder
Damage to local reef and fish stocks and
breeding areas. Interruption to
subsistence fishing. International media
interest
SOLAS Passenger
Collision
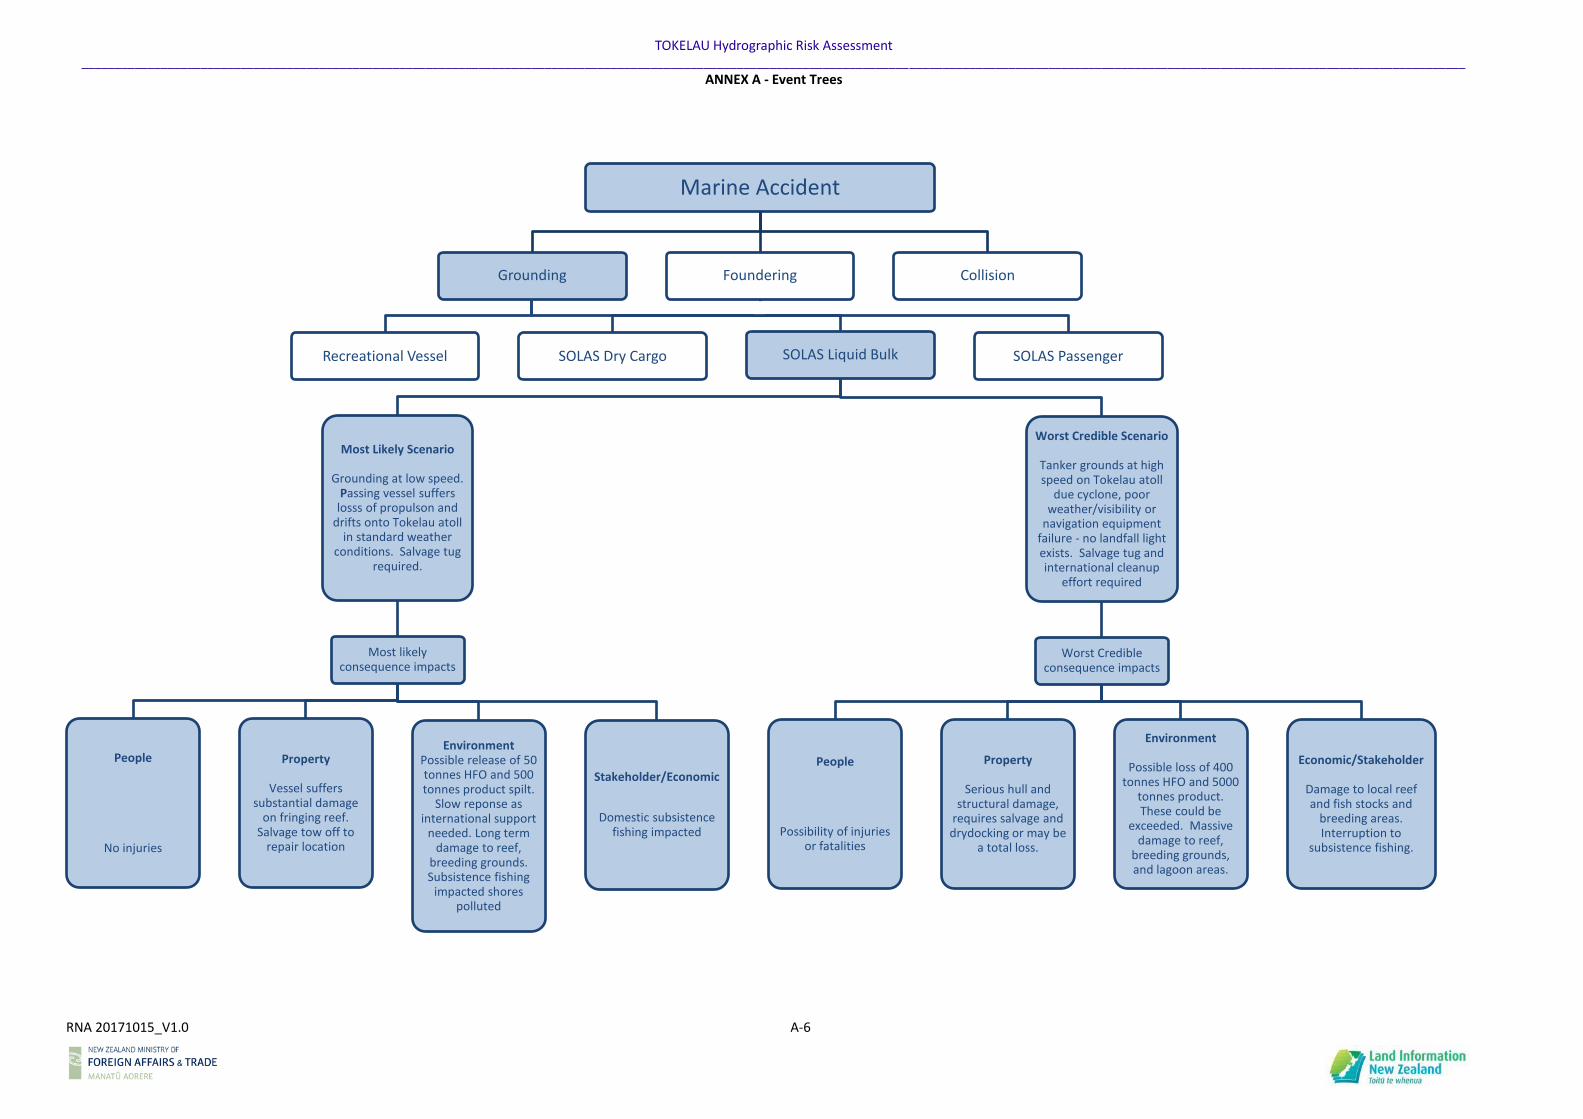
TOKELAU Hydrographic Risk Assessment _________________________________________________________________________________________________________________________________________________________________________________________________________________
ANNEX A - Event Trees
RNA 20171015_V1.0 A-6
Marine Accident
Grounding Foundering
Recreational Vessel SOLAS Dry Cargo SOLAS Liquid Bulk
Most Likely Scenario
Grounding at low speed. Passing vessel suffers
losss of propulson and drifts onto Tokelau atoll
in standard weather conditions. Salvage tug
required.
Most likely consequence impacts
People
No injuries
Property
Vessel suffers substantial damage
on fringing reef. Salvage tow off to
repair location
EnvironmentPossible release of 50 tonnes HFO and 500 tonnes product spilt.
Slow reponse as international support
needed. Long term damage to reef,
breeding grounds. Subsistence fishing
impacted shores polluted
Stakeholder/Economic
Domestic subsistence fishing impacted
Worst Credible Scenario
Tanker grounds at high speed on Tokelau atoll
due cyclone, poor weather/visibility or
navigation equipment failure - no landfall light exists. Salvage tug and international cleanup
effort required
Worst Credible consequence impacts
People
Possibility of injuries or fatalities
Property
Serious hull and structural damage,
requires salvage and drydocking or may be
a total loss.
Environment
Possible loss of 400 tonnes HFO and 5000
tonnes product. These could be
exceeded. Massive damage to reef,
breeding grounds, and lagoon areas.
Economic/Stakeholder
Damage to local reef and fish stocks and
breeding areas. Interruption to
subsistence fishing.
SOLAS Passenger
Collision
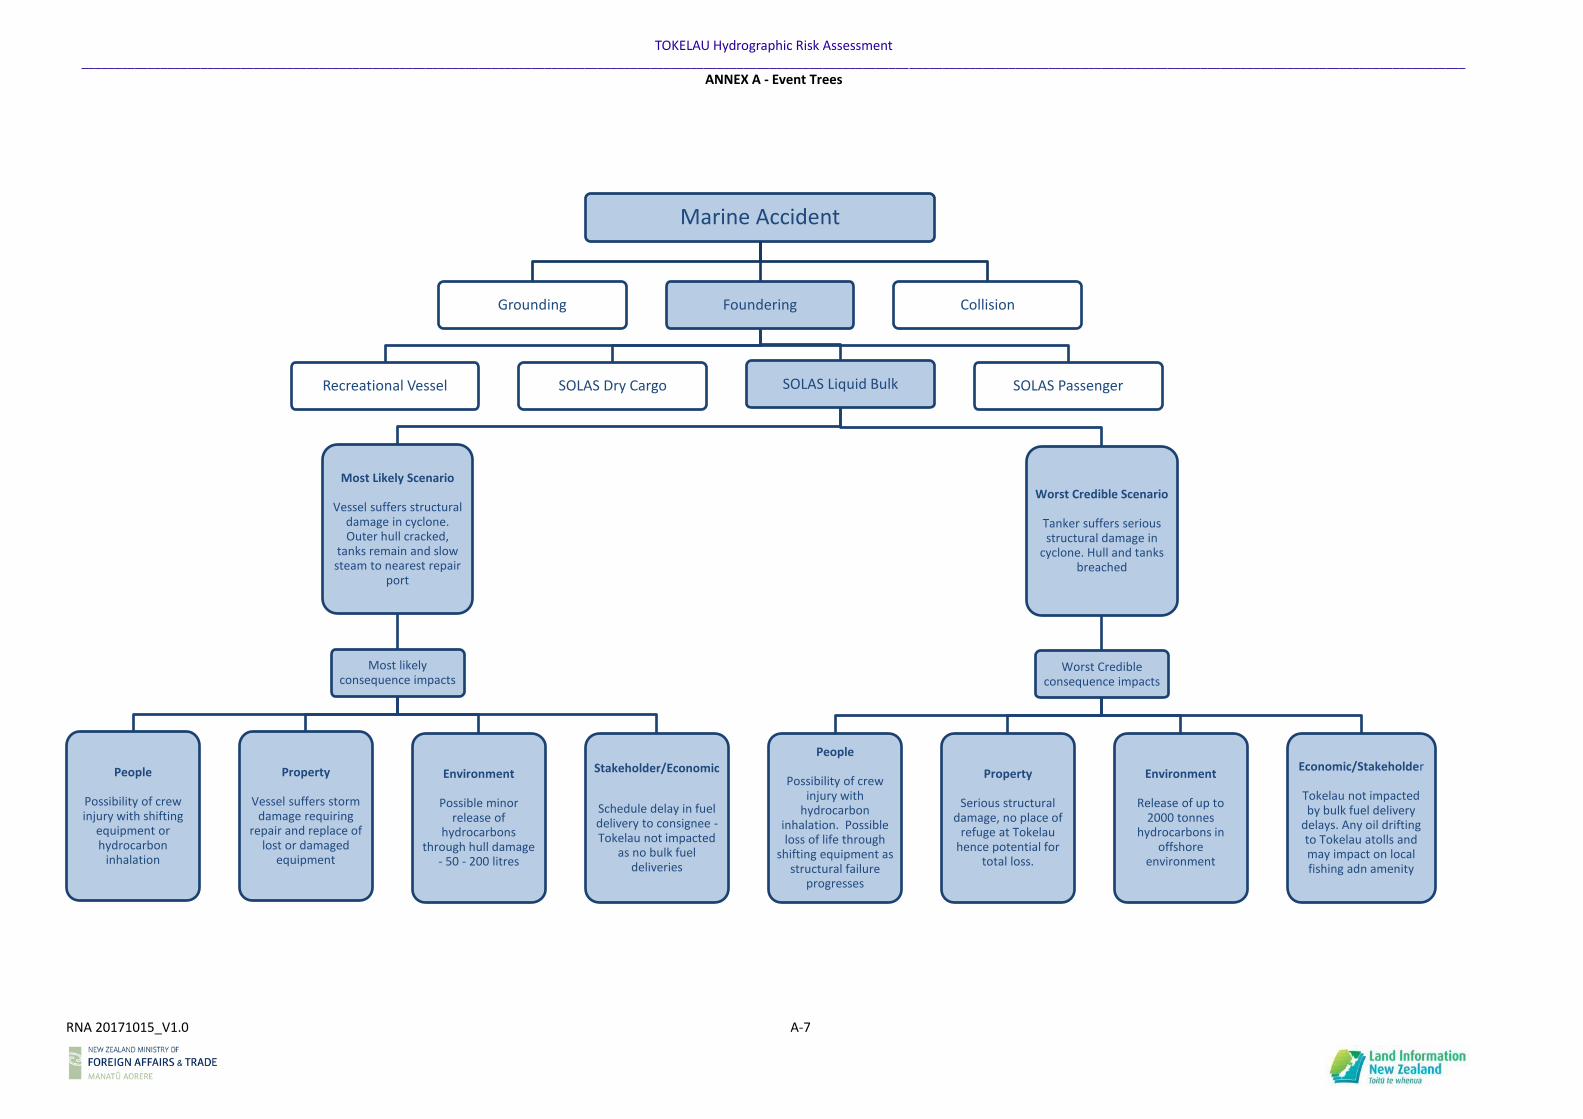
TOKELAU Hydrographic Risk Assessment _________________________________________________________________________________________________________________________________________________________________________________________________________________
ANNEX A - Event Trees
RNA 20171015_V1.0 A-7
Marine Accident
Grounding Foundering
Recreational Vessel SOLAS Dry Cargo SOLAS Liquid Bulk
Most Likely Scenario
Vessel suffers structural damage in cyclone. Outer hull cracked,
tanks remain and slow steam to nearest repair
port
Most likely consequence impacts
People
Possibility of crew injury with shifting
equipment or hydrocarbon
inhalation
Property
Vessel suffers storm damage requiring
repair and replace of lost or damaged
equipment
Environment
Possible minor release of
hydrocarbons through hull damage
- 50 - 200 litres
Stakeholder/Economic
Schedule delay in fuel delivery to consignee -Tokelau not impacted
as no bulk fuel deliveries
Worst Credible Scenario
Tanker suffers serious structural damage in
cyclone. Hull and tanks breached
Worst Credible consequence impacts
People
Possibility of crew injury with
hydrocarbon inhalation. Possible loss of life through
shifting equipment as structural failure
progresses
Property
Serious structural damage, no place of
refuge at Tokelau hence potential for
total loss.
Environment
Release of up to 2000 tonnes
hydrocarbons in offshore
environment
Economic/Stakeholder
Tokelau not impacted by bulk fuel delivery
delays. Any oil drifting to Tokelau atolls and may impact on local fishing adn amenity
SOLAS Passenger
Collision
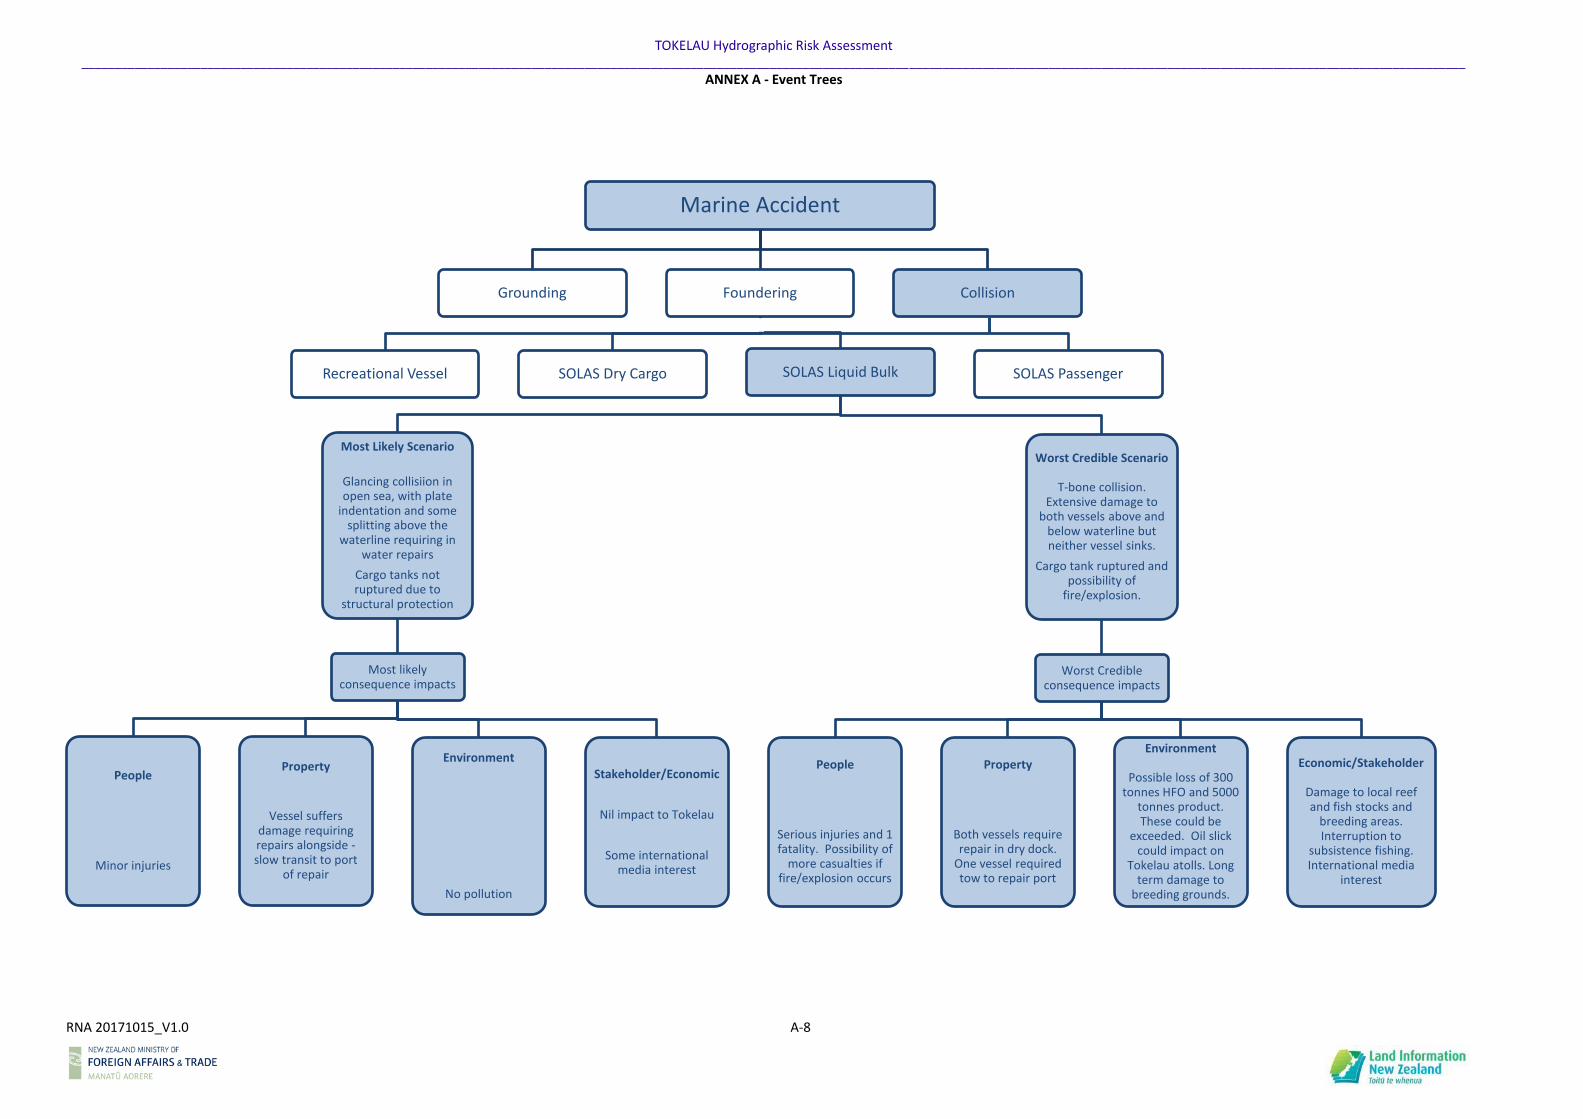
TOKELAU Hydrographic Risk Assessment _________________________________________________________________________________________________________________________________________________________________________________________________________________
ANNEX A - Event Trees
RNA 20171015_V1.0 A-8
Marine Accident
Grounding Foundering
Recreational Vessel SOLAS Dry Cargo SOLAS Liquid Bulk
Most Likely Scenario
Glancing collisiion in open sea, with plate
indentation and some splitting above the
waterline requiring in water repairs
Cargo tanks not ruptured due to
structural protection
Most likely consequence impacts
People
Minor injuries
Property
Vessel suffers damage requiring repairs alongside -slow transit to port
of repair
Environment
No pollution
Stakeholder/Economic
Nil impact to Tokelau
Some international media interest
Worst Credible Scenario
T-bone collision. Extensive damage to
both vessels above and below waterline but neither vessel sinks.
Cargo tank ruptured and possibility of
fire/explosion.
Worst Credible consequence impacts
People
Serious injuries and 1 fatality. Possibility of
more casualties if fire/explosion occurs
Property
Both vessels require repair in dry dock.
One vessel required tow to repair port
Environment
Possible loss of 300 tonnes HFO and 5000
tonnes product. These could be
exceeded. Oil slick could impact on
Tokelau atolls. Long term damage to
breeding grounds.
Economic/Stakeholder
Damage to local reef and fish stocks and
breeding areas. Interruption to
subsistence fishing. International media
interest
SOLAS Passenger
Collision
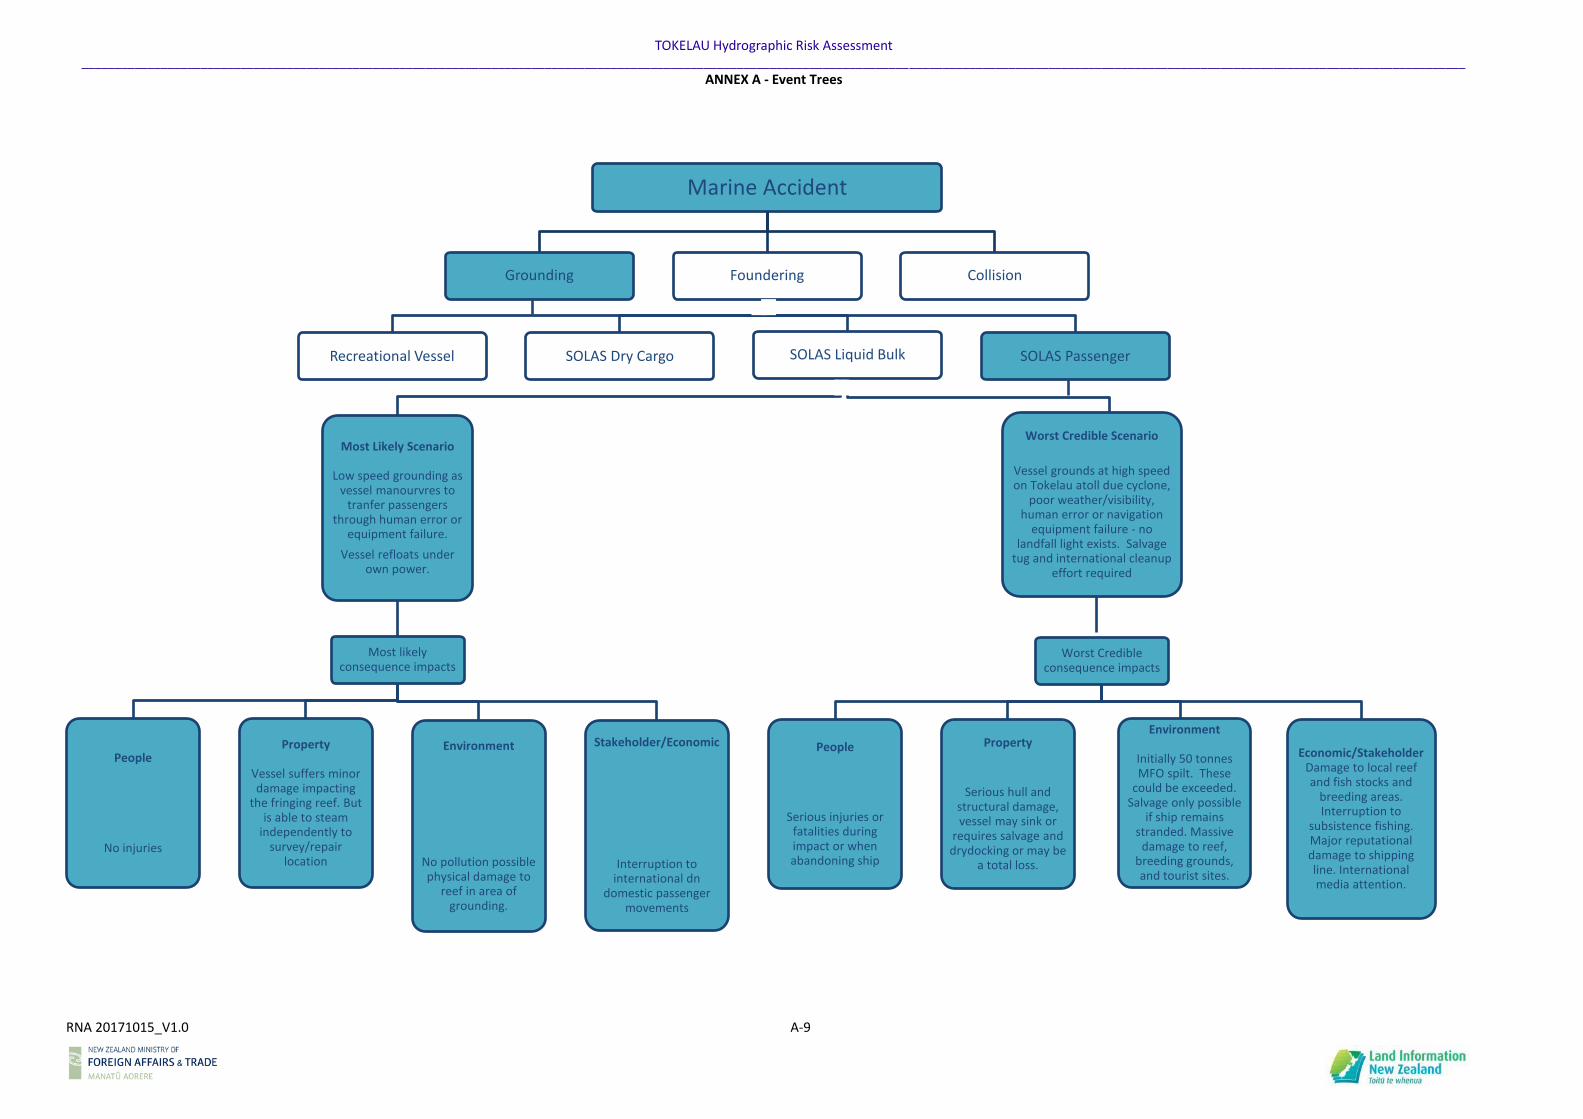
TOKELAU Hydrographic Risk Assessment _________________________________________________________________________________________________________________________________________________________________________________________________________________
ANNEX A - Event Trees
RNA 20171015_V1.0 A-9
Marine Accident
Grounding Foundering
Recreational Vessel SOLAS Dry Cargo SOLAS Liquid Bulk
Most Likely Scenario
Low speed grounding as vessel manourvres to
tranfer passengers through human error or
equipment failure.
Vessel refloats under own power.
Most likely consequence impacts
People
No injuries
Property
Vessel suffers minor damage impacting
the fringing reef. But is able to steam
independently to survey/repair
location
Environment
No pollution possible physical damage to
reef in area of grounding.
Stakeholder/Economic
Interruption to international dn
domestic passenger movements
Worst Credible Scenario
Vessel grounds at high speed on Tokelau atoll due cyclone,
poor weather/visibility, human error or navigation
equipment failure - no landfall light exists. Salvage
tug and international cleanup effort required
Worst Credible consequence impacts
People
Serious injuries or fatalities during impact or when abandoning ship
Property
Serious hull and structural damage, vessel may sink or
requires salvage and drydocking or may be
a total loss.
Environment
Initially 50 tonnes MFO spilt. These
could be exceeded. Salvage only possible
if ship remains stranded. Massive
damage to reef, breeding grounds, and tourist sites.
Economic/StakeholderDamage to local reef and fish stocks and
breeding areas. Interruption to
subsistence fishing. Major reputational damage to shipping line. International media attention.
SOLAS Passenger
Collision
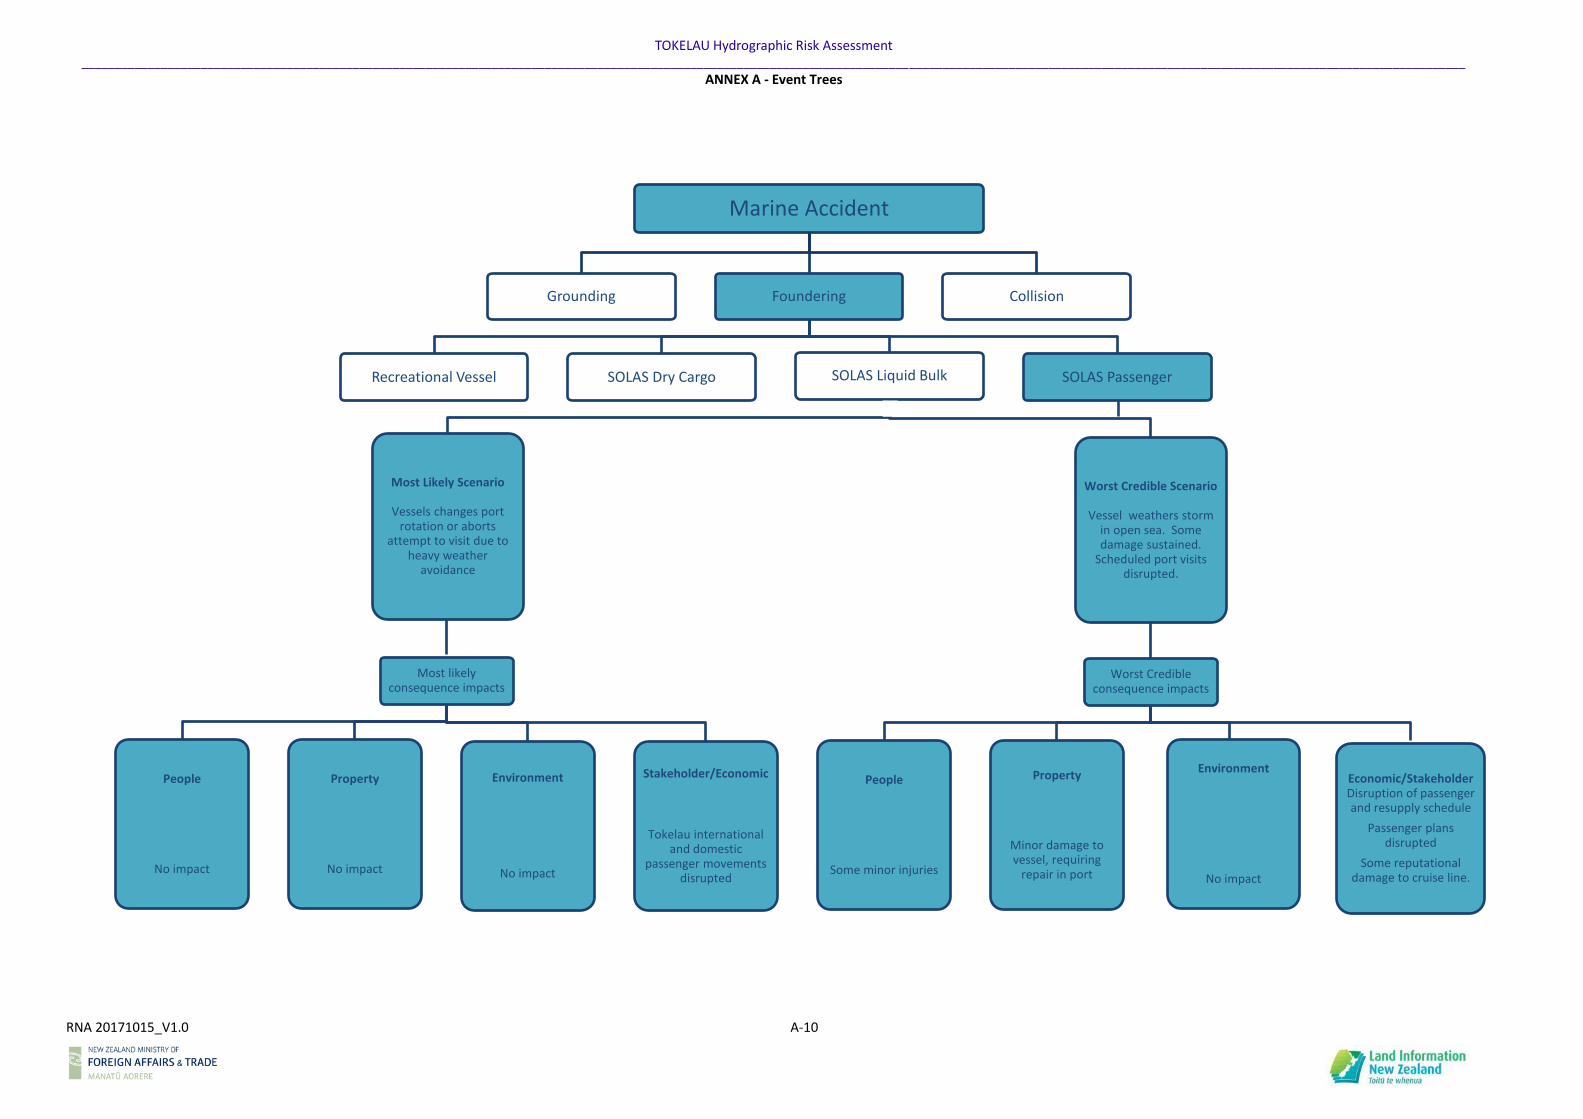
TOKELAU Hydrographic Risk Assessment _________________________________________________________________________________________________________________________________________________________________________________________________________________
ANNEX A - Event Trees
RNA 20171015_V1.0 A-10
Marine Accident
Grounding Foundering
Recreational Vessel SOLAS Dry Cargo SOLAS Liquid Bulk
Most Likely Scenario
Vessels changes port rotation or aborts
attempt to visit due to heavy weather
avoidance
Most likely consequence impacts
People
No impact
Property
No impact
Environment
No impact
Stakeholder/Economic
Tokelau international and domestic
passenger movements disrupted
Worst Credible Scenario
Vessel weathers storm in open sea. Some damage sustained.
Scheduled port visits disrupted.
Worst Credible consequence impacts
People
Some minor injuries
Property
Minor damage to vessel, requiring
repair in port
Environment
No impact
Economic/StakeholderDisruption of passenger and resupply schedule
Passenger plans disrupted
Some reputational damage to cruise line.
SOLAS Passenger
Collision
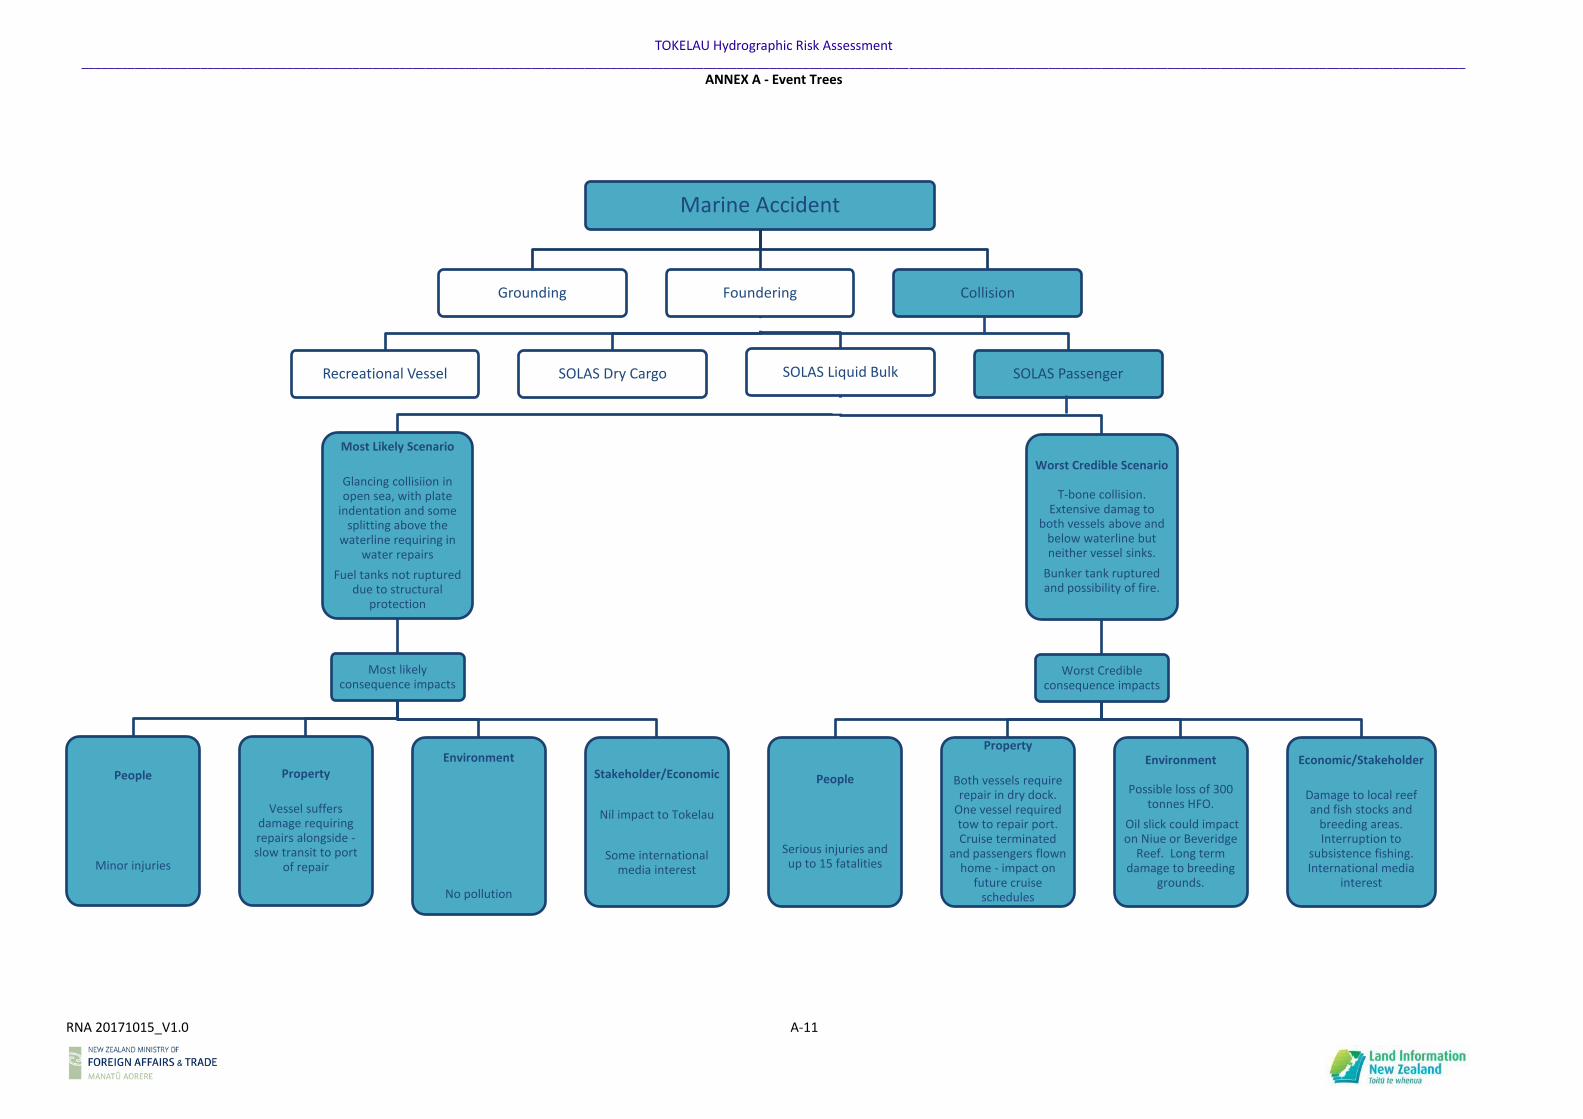
TOKELAU Hydrographic Risk Assessment _________________________________________________________________________________________________________________________________________________________________________________________________________________
ANNEX A - Event Trees
RNA 20171015_V1.0 A-11
Marine Accident
Grounding Foundering
Recreational Vessel SOLAS Dry Cargo SOLAS Liquid Bulk
Most Likely Scenario
Glancing collisiion in open sea, with plate
indentation and some splitting above the
waterline requiring in water repairs
Fuel tanks not ruptured due to structural
protection
Most likely consequence impacts
People
Minor injuries
Property
Vessel suffers damage requiring repairs alongside -slow transit to port
of repair
Environment
No pollution
Stakeholder/Economic
Nil impact to Tokelau
Some international media interest
Worst Credible Scenario
T-bone collision. Extensive damag to
both vessels above and below waterline but neither vessel sinks.
Bunker tank ruptured and possibility of fire.
Worst Credible consequence impacts
People
Serious injuries and up to 15 fatalities
Property
Both vessels require repair in dry dock.
One vessel required tow to repair port. Cruise terminated
and passengers flown home - impact on
future cruise schedules
Environment
Possible loss of 300 tonnes HFO.
Oil slick could impact on Niue or Beveridge
Reef. Long term damage to breeding
grounds.
Economic/Stakeholder
Damage to local reef and fish stocks and
breeding areas. Interruption to
subsistence fishing. International media
interest
SOLAS Passenger
Collision
TOKELAU Hydrographic Risk Assessment _______________________________________________________________________________________
ANNEX B - GIS Track Creation and Processing
RNA 20171015_V1.0 B-1
1 Track Creation50
1.1 Raw AIS data was acquired from ORBCOM for the contiguous 12 month period from
January–December 2016, this is the same period used for Samoa. While this varies from the periods
used for previous assessments of Vanuatu, the Cook Islands, Tonga and Niue, (January – March
2012; July – October 2013; and December 2013 – January 2014), the decision to update the source
AIS data was made on the following basis:
a. The AIS data from the previous assessments had become out dated and no longer
reflected the current traffic patterns which had changed over recent years, particularly with
the increase in cruise shipping activity.
b. The AIS data from the previous assessments had gaps for the months of April – June
and November, which may have resulted in the exclusion of certain maritime activities that
may have occurred in these periods.
c. ORBCOM has added additional satellites to its AIS network in recent years and was
now able to provide a contiguous dataset with a higher update rate and less gaps than
previously, thus providing a more comprehensive and reliable dataset.
d. The previous assessments showed that the substantial variations in volume of traffic
between national assessments and between differing regions within EEZs caused such a
variation of the final risk values that the “regional” risk plot was not a crucial output of the
assessment and that the “in-country” risk plot provided the most useful product for
hydrographic planning.
1.2 The raw AIS data was received in KML format and was converted to ESRI shape file using
QGIS. The full dataset was processed for track information and subsequently, the area for risk
assessment was limited to the EEZ boundaries of Samoa and Tokelau as provided by
marineregions.org. The geographic boundaries of this dataset acquired for use in the study of
Samoa and Tokelau were:
Northern Boundary: 06°05’ S
Eastern Boundary: 176° 30’ W
Western Boundary: 176° 00’ W
Southern Boundary: 16° 15’ S
1.3 Shapefiles were loaded into a PostgreSQL database for processing prior to line generation.
The MMSI attribution was converted from string format to integer, and the movement date field
50 The format of this Annex has been aligned as for Marico Marine Report No. 12NZ246-1, Issue 1, January 2013, D14 – D23. The content has been updated for Tokelau.
TOKELAU Hydrographic Risk Assessment _______________________________________________________________________________________
ANNEX B - GIS Track Creation and Processing
RNA 20171015_V1.0 B-2
was converted to a date time format and transferred to a new field labelled “ping_times.” The table
was then exported as a FileGeoDatabase.
1.4 NOAA’s Marine Cadastre Track Builder51 was used to convert these AIS points into a
network representing vessel movements based on the vessel’s MMSI number and a user specified
threshold of a maximum distance of 1200nm and a time factor of 48 hours between a pair of points.
These factors were selected by trial and error to provide the best overall result.
1.5 In QGIS, a non-spatial join was used to associate MMSI with IMO number, using the ancillary
xml dataset provided by ORBCOM, containing IMO vessel numbers and ship gross tonnage (GT). To
reduce the tracks to a more manageable dataset, PostgreSQL was used to create a new shapefile
where only tracks that intersected with the Samoan EEZ were used. Vessel attributes, such as type
and GT, were then attached to each vessel track from checking MMSI number against online
databases such as Marine Traffic and International Telecommunication Union (ITU).
1.6 Vessel track lines were created using NOAA’s Marine Cadastre Track Builder, such that each
line connects multiple points for an individual vessel. The raw nature of tracks lead to some
anomalies, in particular:
• At the extremities of the study area, vessel track lines did not reach the boundary of the EEZ.
The cause of this was that the track lines ended when the last transmission was received and
so it was possible that eight hours before a vessel reached the edge of the study area the
track would stop; and
• There were multiple vessels shown as transiting across land or the reef and lagoon areas.
These overland vessel tracks could not be simply discounted as this would skew the analysis
into suggesting that fewer vessels transited in areas of fine navigation and so manual track
processing was required to adjust the track to its likely route.
2 Track Processing
2.1 A number of techniques were used to improve the raw vessel traffic data for use in the
analysis of this study, these were:
• Extrapolating track lines to the edge of the study area. This processing was based on visual
assessment assuming that those vessels near the limits of the study area that have a steady
track will maintain that track to the boundary of the EEZ;
• All tracks that crossed land or drying reefs were manually routed around the coast along
their likely course based on:
51 National Oceanic and Atmospheric Administration. “Marine Cadastre Track Builder.” Office for Coastal
Management - National Oceanic and Atmospheric Administration. 2016.
https://coast.noaa.gov/digitalcoast/tools/track-builder (accessed May 13, 2016).
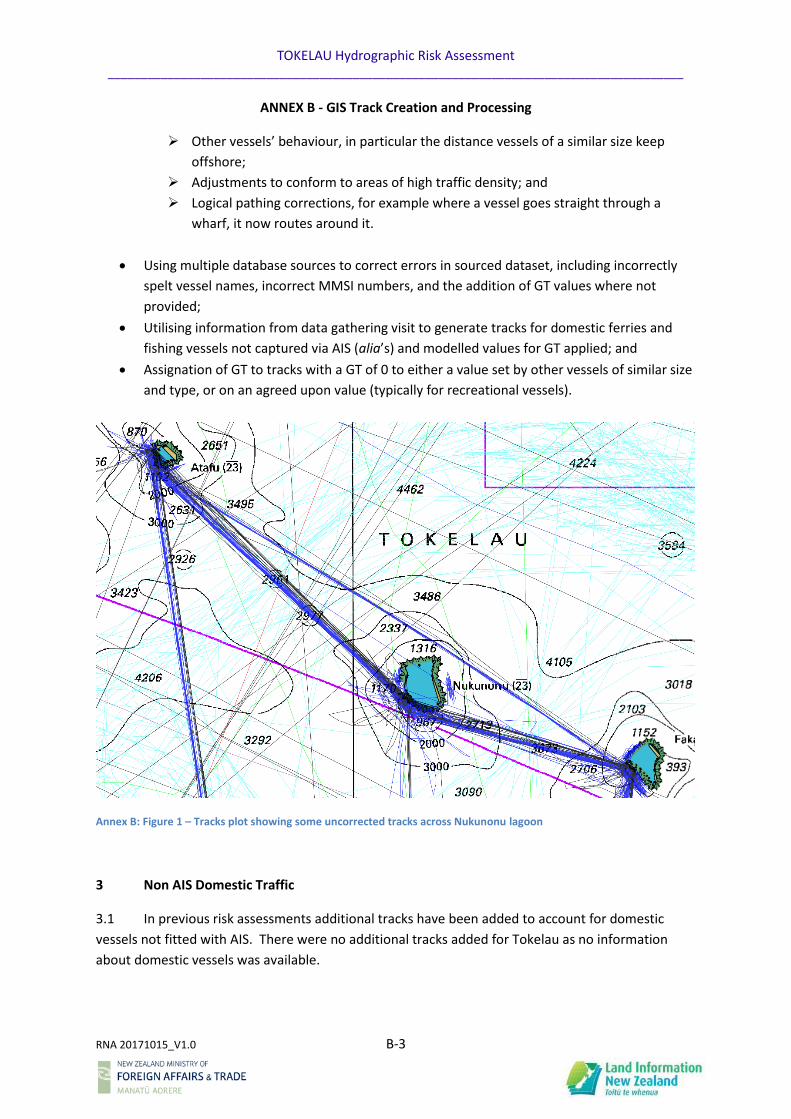
TOKELAU Hydrographic Risk Assessment _______________________________________________________________________________________
ANNEX B - GIS Track Creation and Processing
RNA 20171015_V1.0 B-3
➢ Other vessels’ behaviour, in particular the distance vessels of a similar size keep
offshore;
➢ Adjustments to conform to areas of high traffic density; and
➢ Logical pathing corrections, for example where a vessel goes straight through a
wharf, it now routes around it.
• Using multiple database sources to correct errors in sourced dataset, including incorrectly
spelt vessel names, incorrect MMSI numbers, and the addition of GT values where not
provided;
• Utilising information from data gathering visit to generate tracks for domestic ferries and
fishing vessels not captured via AIS (alia’s) and modelled values for GT applied; and
• Assignation of GT to tracks with a GT of 0 to either a value set by other vessels of similar size
and type, or on an agreed upon value (typically for recreational vessels).
Annex B: Figure 1 – Tracks plot showing some uncorrected tracks across Nukunonu lagoon
3 Non AIS Domestic Traffic
3.1 In previous risk assessments additional tracks have been added to account for domestic
vessels not fitted with AIS. There were no additional tracks added for Tokelau as no information
about domestic vessels was available.
TOKELAU Hydrographic Risk Assessment _______________________________________________________________________________________
ANNEX C – Traffic Risk Calculation
RNA 20171015_V1.0 C-1
1 Traffic Risk Calculation
1.1 This Annex has not been compiled for this report.
TOKELAU Hydrographic Risk Assessment _______________________________________________________________________________________
ANNEX D – Likelihood and Consequence Factors
RNA 20171015_V1.0 D-1
Overview
1.1 This Annex has not been compiled for this report
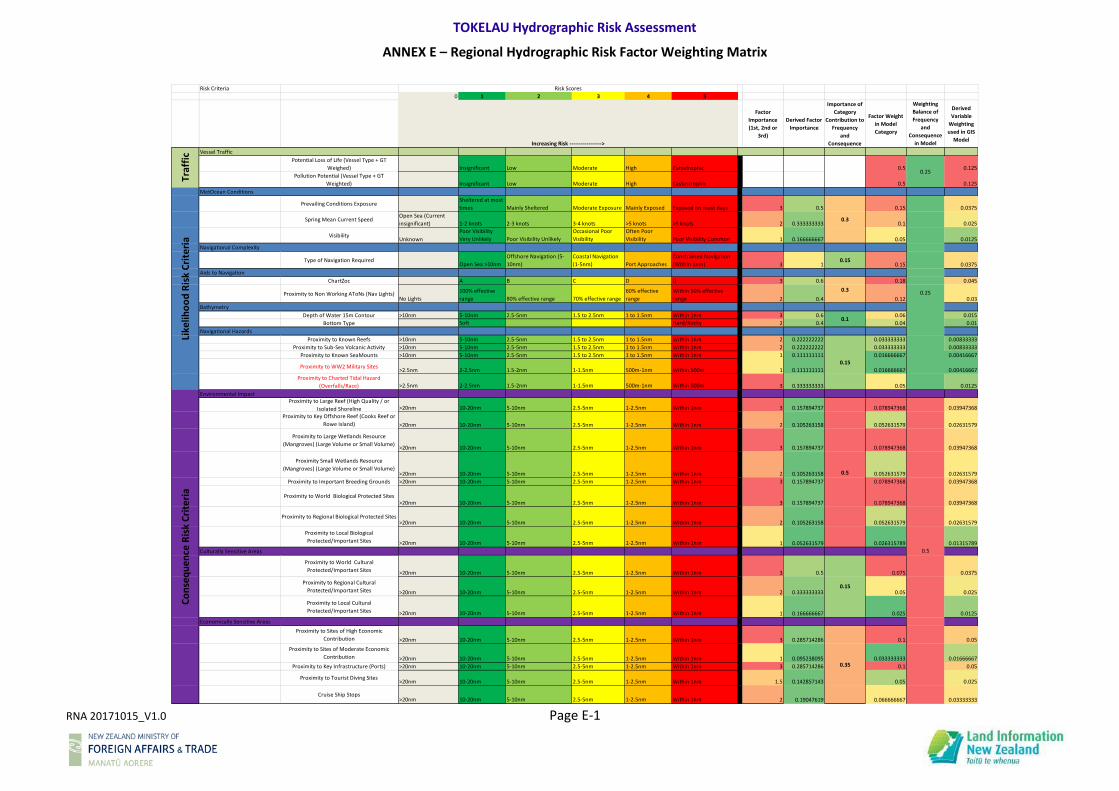
TOKELAU Hydrographic Risk Assessment
ANNEX E – Regional Hydrographic Risk Factor Weighting Matrix
RNA 20171015_V1.0 Page E-1
Risk Criteria
0 1 2 3 4 5
Factor
Importance
(1st, 2nd or
3rd)
Derived Factor
Importance
Importance of
Category
Contribution to
Frequency
and
Consequence
Factor Weight
in Model
Category
Weighting
Balance of
Frequency
and
Consequence
in Model
Derived
Variable
Weighting
used in GIS
Model
Vessel Traffic
Potential Loss of Life (Vessel Type + GT
Weighed) Insignificant Low Moderate High Catastrophic 0.5 0.125
Pollution Potential (Vessel Type + GT
Weighted) Insignificant Low Moderate High Castastrophic 0.5 0.125
MetOcean Conditions
Prevailing Conditions ExposureSheltered at most
times Mainly Sheltered Moderate Exposure Mainly Exposed Exposed on most days 3 0.5 0.15 0.0375
Spring Mean Current SpeedOpen Sea (Current
insignificant) 1-2 knots 2-3 knots 3-4 knots >5 knots >5 knots 2 0.333333333 0.1 0.025
VisibilityUnknown
Poor Visibility
Very Unlikely Poor Visibility Unlikely
Occasional Poor
Visibility
Often Poor
Visibility Poor Visibility Common 1 0.166666667 0.05 0.0125
Navigational Complexity
Type of Navigation RequiredOpen Sea >10nm
Offshore Navigation (5-
10nm)
Coastal Navigation
(1-5nm) Port Approaches
Constrained Navigation
(Within 1nm) 3 10.15
0.15 0.0375
Aids to Navigation
ChartZoc A B C D U 3 0.6 0.18 0.045
Proximity to Non Working AToNs (Nav Lights)No Lights
100% effective
range 80% effective range 70% effective range
60% effective
range
Within 50% effective
range 2 0.4 0.12 0.03
Bathymetry
Depth of Water 15m Contour >10nm 5-10nm 2.5-5nm 1.5 to 2.5nm 1 to 1.5nm Within 1nm 3 0.6 0.06 0.015
Bottom Type Soft Hard/Rocky 2 0.4 0.04 0.01
Navigational Hazards
Proximity to Known Reefs >10nm 5-10nm 2.5-5nm 1.5 to 2.5nm 1 to 1.5nm Within 1nm 2 0.222222222 0.033333333 0.00833333
Proximity to Sub-Sea Volcanic Activity >10nm 5-10nm 2.5-5nm 1.5 to 2.5nm 1 to 1.5nm Within 1nm 2 0.222222222 0.033333333 0.00833333
Proximity to Known SeaMounts >10nm 5-10nm 2.5-5nm 1.5 to 2.5nm 1 to 1.5nm Within 1nm 1 0.111111111 0.016666667 0.00416667
Proximity to WW2 Military Sites>2.5nm 2-2.5nm 1.5-2nm 1-1.5nm 500m-1nm Within 500m 1 0.111111111 0.016666667 0.00416667
Proximity to Charted Tidal Hazard
(Overfalls/Race) >2.5nm 2-2.5nm 1.5-2nm 1-1.5nm 500m-1nm Within 500m 3 0.333333333 0.05 0.0125
Environmental ImpactProximity to Large Reef (High Quality / or
Isolated Shoreline >20nm 10-20nm 5-10nm 2.5-5nm 1-2.5nm Within 1nm 3 0.157894737 0.078947368 0.03947368
Proximity to Key Offshore Reef (Cooks Reef or
Rowe Island) >20nm 10-20nm 5-10nm 2.5-5nm 1-2.5nm Within 1nm 2 0.105263158 0.052631579 0.02631579
Proximity to Large Wetlands Resource
(Mangroves) (Large Volume or Small Volume)>20nm 10-20nm 5-10nm 2.5-5nm 1-2.5nm Within 1nm 3 0.157894737 0.078947368 0.03947368
Proximity Small Wetlands Resource
(Mangroves) (Large Volume or Small Volume) >20nm 10-20nm 5-10nm 2.5-5nm 1-2.5nm Within 1nm 2 0.105263158 0.052631579 0.02631579
Proximity to Important Breeding Grounds >20nm 10-20nm 5-10nm 2.5-5nm 1-2.5nm Within 1nm 3 0.157894737 0.078947368 0.03947368
Proximity to World Biological Protected Sites>20nm 10-20nm 5-10nm 2.5-5nm 1-2.5nm Within 1nm 3 0.157894737 0.078947368 0.03947368
Proximity to Regional Biological Protected Sites>20nm 10-20nm 5-10nm 2.5-5nm 1-2.5nm Within 1nm 2 0.105263158 0.052631579 0.02631579
Proximity to Local Biological
Protected/Important Sites >20nm 10-20nm 5-10nm 2.5-5nm 1-2.5nm Within 1nm 1 0.052631579 0.026315789 0.01315789
Culturally Sensitive Areas
Proximity to World Cultural
Protected/Important Sites >20nm 10-20nm 5-10nm 2.5-5nm 1-2.5nm Within 1nm 3 0.5 0.075 0.0375
Proximity to Regional Cultural
Protected/Important Sites >20nm 10-20nm 5-10nm 2.5-5nm 1-2.5nm Within 1nm 2 0.333333333 0.05 0.025
Proximity to Local Cultural
Protected/Important Sites >20nm 10-20nm 5-10nm 2.5-5nm 1-2.5nm Within 1nm 1 0.166666667 0.025 0.0125
Economically Sensitive Areas
Proximity to Sites of High Economic
Contribution >20nm 10-20nm 5-10nm 2.5-5nm 1-2.5nm Within 1nm 3 0.285714286 0.1 0.05
Proximity to Sites of Moderate Economic
Contribution >20nm 10-20nm 5-10nm 2.5-5nm 1-2.5nm Within 1nm 1 0.095238095 0.033333333 0.01666667
Proximity to Key Infrastructure (Ports) >20nm 10-20nm 5-10nm 2.5-5nm 1-2.5nm Within 1nm 3 0.285714286 0.1 0.05
Proximity to Tourist Diving Sites>20nm 10-20nm 5-10nm 2.5-5nm 1-2.5nm Within 1nm 1.5 0.142857143 0.05 0.025
Cruise Ship Stops>20nm 10-20nm 5-10nm 2.5-5nm 1-2.5nm Within 1nm 2 0.19047619 0.066666667 0.03333333
Risk Scores
Increasing Risk ----------------->
Traf
fic
Like
liho
od
Ris
k C
rite
ria
0.3
0.3
0.25
0.5
0.1
0.15
Co
nse
qu
ence
Ris
k C
rite
ria
0.5
0.15
0.35
0.25

TOKELAU Hydrographic Risk Assessment _______________________________________________________________________________________
ANNEX F – Hydrographic Risk Calculations
RNA 20171015_V1.0 F-1
Overview
1.1 This Annex has not been compiled for this report.
TOKELAU Hydrographic Risk Assessment _______________________________________________________________________________________
Annex G – General Benefits of Hydrographic Surveys
Total Pages: 74 RNA 20171015_V1.0 G-1
General Benefits of Hydrographic Surveys52
1. Hydrographic survey data is an enabler that underpins all maritime activities. Classically, the
data is integrated into ships’ charts to enable the safe planning and execution of a voyage. The
quality of hydrographic charts is an important factor in determining the risk of undertaking voyages
and the cost of insurance to underwrite that risk. It influences decisions on the cost effectiveness of
providing essential transportation services. If the hydrographic data and, in the modern context, the
relevant ENCs are of high quality, there is an increased likelihood the service will be of high quality as
well, with competition ensuring no excess freight rates. Conversely, poor quality data brings with it
the risk of higher costs or substandard shipping.
2. With the advent of Geographical Information Systems (GIS) underpinned by powerful
computer processing, and integration with satellite and other remote sensing technologies,
hydrographic data delivers a wide range of additional benefits to multiple marine stakeholders,
notably planning, management and development in the maritime domain. It is widely accepted that
these benefits of hydrographic survey data, difficult to quantify in financial terms, outweigh those
derived from its classic application, hence the common assessment that hydrographic data should be
viewed as a public good53. It is relatively expensive to acquire because it requires ships or aircraft to
transit the ocean and cannot be properly obtained by satellite remote sensing, but the overall
benefits of hydrographic survey from a national perspective are considered to outweigh the costs.
3. Hydrographic survey data delivers benefits to different sectors in different ways. For the
international shipping of freight, the principal benefit is to enable safe and efficient navigation to
minimise risk and provide reductions in transportation costs. For the Tokelau economy it may
support the safe access to the growing cruise tourism market, and for good governance it provides
the underpinning data and framework for the effective management of marine resources and
environmental monitoring.
4. Commercial shipping relies on current hydrographic survey data. A hydrographic survey
undertaken to the latest International Hydrographic Organization (IHO) standards54 provides the
following benefits:
a. Accurate and reliable full bottom coverage allows for more flexible route planning,
more precise navigation and more flexibility to utilise the increased loading of ships, thus
increasing the economic efficiency of shipping.
b. Critical new shallows or water depth, less than previously charted, may be identified
and appropriate action taken.
52 This Annex is a modified reproduction of previous published work (Marico Marine Report No 14NZ262CS Issue 02, January 2015, pp. A1-A3) 53 Public good – a good or service in the public interest which would not be supplied at optimal levels by
market forces alone. 54 IHO S-44 Standards for Hydrographic Survey
TOKELAU Hydrographic Risk Assessment _______________________________________________________________________________________
Annex G – General Benefits of Hydrographic Surveys
Total Pages: 74 RNA 20171015_V1.0 G-2
c. Facilitate revisions of fairways or routes, and planning of modified or new Traffic
Separation Schemes or sea management areas (which could be applicable to Beveridge
Reef).
d. Enabling modern practices in navigation with new ECDIS functionality (e.g. 3D
navigation with real time dynamic water level in formation, precise warnings), with
consequential reduction in potential environmental harm and insurance premiums.
e. Provision of quality information for training purposes.
5. These factors have been identified as causal to shipping companies using less efficient or less
capable vessels that are more likely to be involved in a maritime accident in areas with poor
hydrographic data.
6. Further, the International Convention for the Safety of Life at Sea55 requires signatory states
to facilitate the production of ENCs for ships navigating their coastal waters, including ports. Should
a member state not fulfil this obligation, insurers have the option to decline cover, or charge an
additional risk premium, to vessels wishing to navigate its waters.
7. Beyond shipping, hydrographic survey data delivers a wide range of additional benefits to
maritime stakeholders. Indeed, the largest users of hydrographic data are typically port developers,
planners and environment managers. Hydrographic data is an essential enabler for everything that
takes place on, under or near the sea, it should be considered as vital infrastructure, servicing similar
purposes as three-dimensional land mapping.
55 SOLAS Chapter 5, Regulation 9


![IHO S-100: The New IHO Hydrographic Geospatial … hydrographic review may 2009 →iho s-100) iho s-100 [] .Published in: International Hydrographic Review · 2009Authors: Robert Ward](https://img.pdfslide.us/doc/110x75/5ae4a48c7f8b9a495c8ed661/iho-s-100-the-new-iho-hydrographic-geospatial-hydrographic-review-may-2009.jpg)


![RISK ASSESSMENT [ASSESSMENT]](https://img.pdfslide.us/doc/110x75/6212412fca52115ed803cf10/risk-assessment-assessment.jpg)