Embed Size (px)
Citation preview
Risk assessment of radioisotope contamination foraquatic living resources in and around JapanHiroshi Okamuraa,1, Shiro Ikedab, Takami Moritac, and Shinto Eguchib
aResearch Center for Fisheries Management, National Research Institute of Fisheries Science, Fisheries Research Agency, Kanagawa 236-8648, Japan;bDepartment of Mathematical Analysis and Statistical Inference, The Institute of Statistical Mathematics, Tokyo 190-8562, Japan; and cResearch Center forFisheries Oceanography and Marine Ecosystem, National Research Institute of Fisheries Science, Fisheries Research Agency, Kanagawa 236-8648, Japan
Edited by David Cox, Nuffield College, Oxford, United Kingdom, and approved January 26, 2016 (received for review October 6, 2015)
Food contamination caused by radioisotopes released from theFukushima Dai-ichi nuclear power plant is of great public concern.The contamination risk for food items should be estimated depend-ing on the characteristics and geographic environments of eachitem. However, evaluating current and future risk for food items isgenerally difficult because of small sample sizes, high detectionlimits, and insufficient survey periods. We evaluated the risk foraquatic food items exceeding a threshold of the radioactive cesiumin each species and location using a statistical model. Here we showthat the overall contamination risk for aquatic food items is verylow. Some freshwater biota, however, are still highly contaminated,particularly in Fukushima. Highly contaminated fish generally tendto have large body size and high trophic levels.
detection limit | radiocesium | random effects | statistical risk assessment |Weibull distribution
The Fukushima Dai-ichi Nuclear Power Plant (FDNPP) acci-dent caused by the catastrophic earthquake and tsunami on
11 March 2011 caused immense damage to human society in andaround Japan by releasing large amounts of radioisotopes to theenvironment (1–5). This accident has raised great public concernabout food safety. The government of Japan has therefore beenmonitoring intensively the γ-emitting radioisotopes in variousfoods since March 2011, to prevent highly contaminated foodsfrom being distributed in the market. The current monitoringtargets are two cesium isotopes (radiocesiums), 134Cs and 137Cs,which were the main radioisotopes released from FDNPP, withlong physical half-lives of 2.0652 and 30.167 y, respectively (4).Because of the continual leakage of contaminated water with
traces of radioisotopes into the ocean from FDNPP after theaccident, as reported by the Tokyo Electric Power Company(TEPCO) in August 2013 (6), concerns about radioisotopecontamination of aquatic foods are being raised. Some reportshave indicated that demersal fish off Fukushima are at the highestrisk of all aquatic foods. Some researchers have reported thatcontamination levels in demersal fish had not decreased even ayear after the accident (7), and the decrease was much slower thanpredicted at the end of 2012 (8). In contrast, others have reportedthat the concentration in most marine organisms, even includingdemersal fish in the Fukushima coastal waters, had decreased ex-ponentially, although the radiocesium introduced into the oceanwas rapidly transferred to marine organisms (9). These contra-dictory statements must confuse the general public.The Ministry of Health, Labor, and Welfare (MHLW) in Japan
has reported the inspection results of radioisotope contamination invarious foods every month since the FDNPP accident (10). Weextracted radiocesium measurement data for aquatic foods fromthe MHLW database. In addition to pairs of 134Cs and 137Csmeasurements, each observation has species name, prefecture,and date of official announcement of measurement (see Mate-rials and Methods for details). We used the data collected from1April 2011 to 31 March 2015. Overall, we have 1,646 combi-nations of species and prefectures. However, the analysis of theradiocesium measurement data is not straightforward. Manymeasurement results have “N.D.” (not detected). This N.D.information does not mean that the item is free from contamination
but that any radiocesium concentration is below the detectionlimit. The limit depends on the measurement conditions but istypically defined as the concentration that gives counts within 3SDs of the counting error (9). These N.D. measurements are, infact, missing data and do not occur at random. Therefore, whenthe contamination is low, they not only reduce precision, but alsocause bias (11). In the most extreme case, all measurements for aspecific species in a specific prefecture are N.D. Then it is moredifficult to evaluate the contamination risk.We developed a statistical method for quantifying the spatial
and temporal contamination risk for foods. This method can handlemissing data caused by detection limits. When parameter estimationwas difficult because of small sample size, missing data, and short-age of data contrasts, a random-effects model was used, in whichthe data of similar species with similar sample locations (i.e., pre-fectures) are used to increase the amount of information available.The risk is defined as the probability that the sum of 134Cs and 137Csis greater than the thresholdD Bq/kg (D = 20, 50, and 100)—that is,Prð134Cs+ 137Cs>D Bq=kgÞ, on a specific date—and it is calcu-lated for each combination of species and prefecture. When all ofthe data were below detection limits, we used a minimum re-placement method, which is a kind of worst-case scenario. In thismethod, the minimum detection limit is treated as if it was theobserved value (not the detection limit). The contamination riskmap classified into species and prefecture categories is generatedusing a binomial regression model with random effects. See Mate-rials and Methods for a full exposition of methods.
Results and DiscussionThe simple regression analysis for the difference between logð137CsÞand logð134CsÞ indicates that the observed contamination levels ofthe last few years are almost completely explained by the explosionof FDNPP and that the influence of other disasters such as the
Significance
Quantification of contamination risk caused by radioisotopes re-leased from the Fukushima Dai-ichi nuclear power plant is usefulfor excluding or reducing groundless rumors about food safety.Our new statistical approach made it possible to evaluate the riskfor aquatic food and showed that the present contamination levelsof radiocesiums are low overall. However, some freshwater speciesstill have relatively high risks. We also suggest the necessity ofrefining data collection plans to reduce detection limits in the fu-ture, because a small number of precise measurements are morevaluable thanmanymeasurements that are below detection limits.
Author contributions: H.O. designed research; H.O. performed research; H.O., S.I., T.M.,and S.E. contributed new reagents/analytic tools; H.O. analyzed data; and H.O., S.I., T.M.,and S.E. wrote the paper.
The authors declare no conflict of interest.
This article is a PNAS Direct Submission.
Freely available online through the PNAS open access option.
See Commentary on page 3720.1To whom correspondence should be addressed. Email: [email protected].
This article contains supporting information online at www.pnas.org/lookup/suppl/doi:10.1073/pnas.1519792113/-/DCSupplemental.
3838–3843 | PNAS | April 5, 2016 | vol. 113 | no. 14 www.pnas.org/cgi/doi/10.1073/pnas.1519792113
Dow
nloa
ded
by g
uest
on
July
27,
202
0
Chernobyl nuclear power plant accident (12) would be relativelyvery small (Materials and Methods and Fig. S1). Our statisticalmodel generally fitted the data quite well (Dataset S1). The pre-dicted species-specific and prefecture-specific risks [i.e.,Prð134Cs+ 137Cs>D Bq=kgÞ] on 1 September 2015 were very smalloverall (Datasets S1 and S2). When the risks were evaluated withthe minimum replacement method, sometimes overly high andunreasonable risks even for probably safe aquatic foods were pre-dicted (Datasets S1 and S2). This unreasonably high risk indicatesthat the detection limit should be set as low as possible. For sta-tistical risk analysis, one value above the detection limit is muchmore informative than many values below the detection limit. Thecurrent monitoring program should be refined with lowerdetection limits.The risk of cesium contamination in Fukushima has steadily
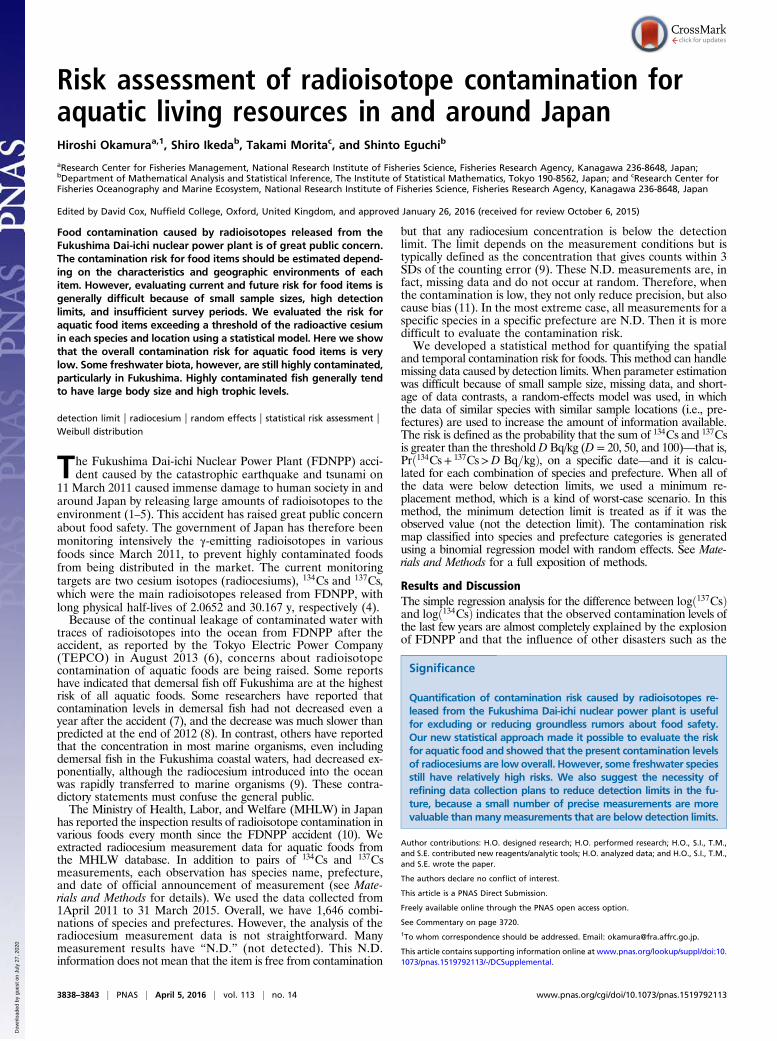
decreased from 1 April 2011 to 1 September 2015 (Fig. 1). Thecontamination risks of marine species are much smaller thanthose of freshwater species. The median Prð134Cs+ 137Cs>100 Bq=kgÞ for recent days is almost zero for both marine andfreshwater species, whereas the median Prð134Cs+ 137Cs> 20 Bq=kgÞof freshwater species is still greater than zero and that of marinespecies is almost zero. Similar trends are observed in other pre-fectures; that is, higher contamination risks for freshwater species(Figs. S2 and S3). It is well known that freshwater fish have longerbiological half-lives of radiocesium than marine fish because ofdifferences in osmoregulation systems (13, 14). This characteristicwould have caused the long-term contamination of radiocesium infreshwater biota as with the Chernobyl accident (15).
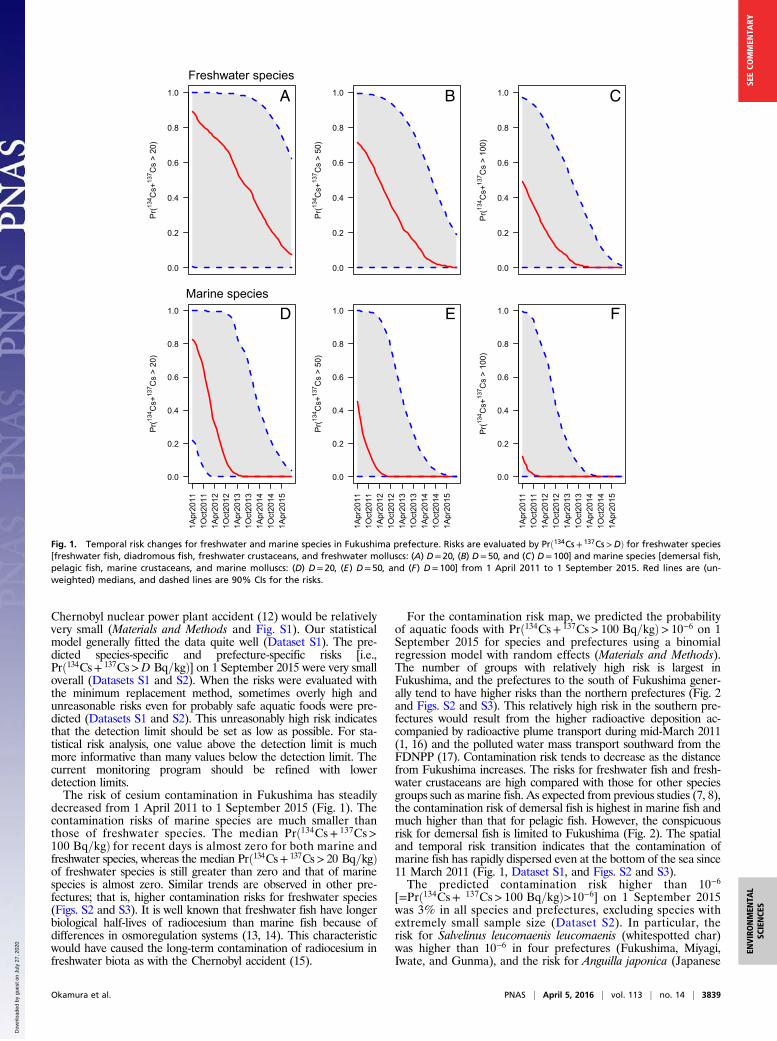
For the contamination risk map, we predicted the probabilityof aquatic foods with Prð134Cs+ 137Cs> 100 Bq=kgÞ> 10−6 on 1September 2015 for species and prefectures using a binomialregression model with random effects (Materials and Methods).The number of groups with relatively high risk is largest inFukushima, and the prefectures to the south of Fukushima gener-ally tend to have higher risks than the northern prefectures (Fig. 2and Figs. S2 and S3). This relatively high risk in the southern pre-fectures would result from the higher radioactive deposition ac-companied by radioactive plume transport during mid-March 2011(1, 16) and the polluted water mass transport southward from theFDNPP (17). Contamination risk tends to decrease as the distancefrom Fukushima increases. The risks for freshwater fish and fresh-water crustaceans are high compared with those for other speciesgroups such as marine fish. As expected from previous studies (7, 8),the contamination risk of demersal fish is highest in marine fish andmuch higher than that for pelagic fish. However, the conspicuousrisk for demersal fish is limited to Fukushima (Fig. 2). The spatialand temporal risk transition indicates that the contamination ofmarine fish has rapidly dispersed even at the bottom of the sea since11 March 2011 (Fig. 1, Dataset S1, and Figs. S2 and S3).The predicted contamination risk higher than 10−6
[=Prð134Cs+ 137Cs> 100 Bq=kgÞ>10−6] on 1 September 2015was 3% in all species and prefectures, excluding species withextremely small sample size (Dataset S2). In particular, therisk for Salvelinus leucomaenis leucomaenis (whitespotted char)was higher than 10−6 in four prefectures (Fukushima, Miyagi,Iwate, and Gunma), and the risk for Anguilla japonica (Japanese
0.0
0.2
0.4
0.6
0.8
1.0
Pr(
134 C
s+13
7 Cs
> 20
)
Freshwater species
A
0.0
0.2
0.4
0.6
0.8
1.0
Pr(
134 C
s+13
7 Cs
> 50
)
B
0.0
0.2
0.4
0.6
0.8
1.0
Pr(13
4 Cs+
137 C
s >
100)
C
0.0
0.2
0.4
0.6
0.8
1.0
Pr(
134 C
s+13
7 Cs
> 20
)
1Apr
2011
1Oct
2011
1Apr
2012
1Oct
2012
1Apr
2013
1Oct
2013
1Apr
2014
1Oct
2014
1Apr
2015
Marine species
D
0.0
0.2
0.4
0.6
0.8
1.0P
r(13
4 Cs+
137 C
s >
50)
1Apr
2011
1Oct
2011
1Apr
2012
1Oct
2012
1Apr
2013
1Oct
2013
1Apr
2014
1Oct
2014
1Apr
2015
E
0.0
0.2
0.4
0.6
0.8
1.0
Pr(13
4 Cs+
137 C
s >
100)
1Apr
2011
1Oct
2011
1Apr
2012
1Oct
2012
1Apr
2013
1Oct
2013
1Apr
2014
1Oct
2014
1Apr
2015
F
Fig. 1. Temporal risk changes for freshwater and marine species in Fukushima prefecture. Risks are evaluated by Prð134Cs+ 137Cs>DÞ for freshwater species[freshwater fish, diadromous fish, freshwater crustaceans, and freshwater molluscs: (A) D= 20, (B) D=50, and (C) D= 100] and marine species [demersal fish,pelagic fish, marine crustaceans, and marine molluscs: (D) D= 20, (E) D= 50, and (F) D= 100] from 1 April 2011 to 1 September 2015. Red lines are (un-weighted) medians, and dashed lines are 90% CIs for the risks.
Okamura et al. PNAS | April 5, 2016 | vol. 113 | no. 14 | 3839
ENVIRONMEN
TAL
SCIENCE
SSE
ECO
MMEN
TARY
Dow
nloa
ded
by g
uest
on
July
27,
202
0
eel) was higher than 10−6 in three prefectures (Fukushima, Ibar-aki, and Chiba). Although seaweed in Fukushima has relativelyhigh risk (Fig. 2), this is because one of six samples (Eiseniabicyclis) showed slightly higher risk (1.48× 10⁻⁶) than the criterion.Table 1 shows the risks for representative fish in Fukushima.
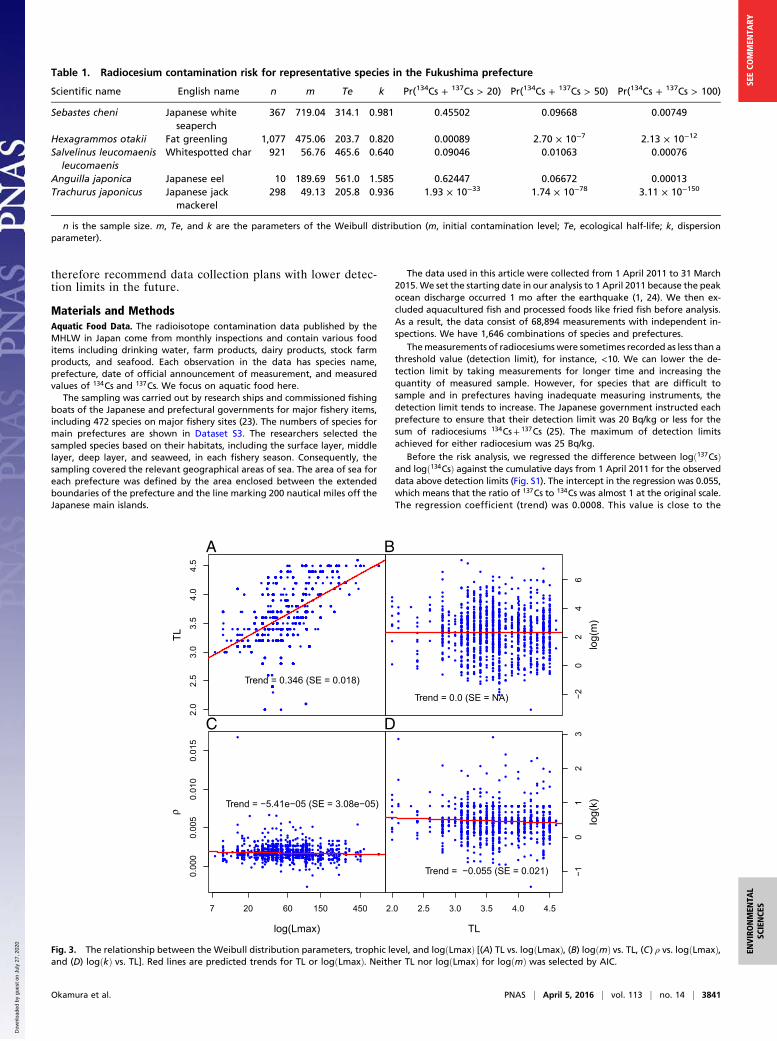
We selected those species somewhat subjectively. Sebastes cheni(Japanese white seaperch) and Hexagrammos otakii (fat green-ling) are well known as highly contaminated demersal fish (7, 9,18). Salvelinus leucomaenis leucomaenis and Anguilla japonicaare highly contaminated freshwater and diadromous fish fromour analysis. Salvelinus leucomaenis leucomaenis and Anguillajaponica in Fukushima have high risks compared with the highlycontaminated demersal fish in Fukushima. Finally, Trachurusjaponicus (Japanese jack mackerel) is a typical pelagic fish andselected as a reference. The information for all species in allprefectures is provided in Dataset S2.We conducted multiple regression for the parameters [logðmÞ,
ρ, and logðkÞ] of the Weibull distribution (Materials and Meth-ods). We used trophic level (TL), the logarithm of asymptoticlength [logðLmaxÞ], which is usually related to trophic level (19),species group, and prefecture group as explanatory variables.Because TL and Lmax are consistently collected only for fishspecies, the analysis was limited to fish species. All parameterskept species group and prefecture group as explanatory variablesafter model selection using the Akaike information criterion(AIC) (20). The AIC best model of logðmÞ did not include TLand logðLmaxÞ, whereas the AIC best models of ρ and logðkÞincluded negative trends for logðLmaxÞ and TL, respectively(Fig. 3). Because TL and logðLmaxÞ have a positive correlation(Fig. 3A), this suggests that the initial contamination was notsignificantly different among fish with different TLs, althoughthere are differences in the species and prefectures probably
caused by the massive explosion. The dispersion rates are dif-ferent for different TLs or body sizes, probably because of bio-accumulation (13, 21). In fact, S. leucomaenis leucomaenis andA. japonica have relatively large asymptotic body sizes and hightrophic levels (Dataset S2). We also performed the model se-lection using the Bayesian information criterion (BIC) and theAIC with small-sample bias adjustment (AICc) (20). In eithercase, the two variables, logðLmaxÞ for ρ and TL for logðkÞ, wereselected as the significant variables.The contamination risks of freshwater fish, freshwater crusta-
ceans, and diadromous fish are relatively high, as indicated in ear-lier studies (22). However, freshwater fish used as food in Japan areusually not wild but cultured. Thus, because the radiocesium con-centration of cultured fish tends to be low (10), the high contami-nation risk of wild freshwater fish around Fukushima should not bea serious food concern but is a vital problem for recreational fish-eries and tourism industries because even leisure fishing is restrictedor prohibited if a fish exceeding the limit (100 Bq/kg) is caught.Although the Japanese freshwater system is very complex withmany short rivers with small flows, continuing careful monitoringand increasing sample sizes for these species is important as anindicator of environmental contamination (22).In conclusion, our analysis showed that the present contamina-
tion levels of radiocesiums were low overall, even for demersal fish,although some freshwater species still have relatively high risks.Although many N.D. data have made radiocesium risk assessmentof foods difficult, our method made it possible to evaluate the riskfor each food item and to produce a big picture of contaminationrisk. Our methodology could contribute greatly to decision-makingfor quick and effective recovery from the FDNPP accident.Whereas our method can quantify risks even when all data areN.D., high detection limits tend to cause biased results. We
Fres
hwat
er fi
shD
iadr
omou
s fis
hD
emer
sal f
ish
Pela
gic
fish
Sha
rks
& R
ays
Fres
hwat
er c
rust
acea
nsS
ea w
eed
0.0
0.2
0.4
0.6
0.8
1.0
0.0 0.2 0.4 0.6 0.8 1.0
Aomori
Iwate
Miyagi
Fukushima
Ibaraki
Chiba
TochigiGunma
SaitamaTokyo
Fig. 2. Spatial radioisotope contamination risks for species groups and prefecture groups around Fukushima. Risk is evaluated by Prð134Cs+ 137Cs> 100 Bq=kgÞ> 10−6.
3840 | www.pnas.org/cgi/doi/10.1073/pnas.1519792113 Okamura et al.
Dow
nloa
ded
by g
uest
on
July
27,
202
0
therefore recommend data collection plans with lower detec-tion limits in the future.
Materials and MethodsAquatic Food Data. The radioisotope contamination data published by theMHLW in Japan come from monthly inspections and contain various fooditems including drinking water, farm products, dairy products, stock farmproducts, and seafood. Each observation in the data has species name,prefecture, date of official announcement of measurement, and measuredvalues of 134Cs and 137Cs. We focus on aquatic food here.
The sampling was carried out by research ships and commissioned fishingboats of the Japanese and prefectural governments for major fishery items,including 472 species on major fishery sites (23). The numbers of species formain prefectures are shown in Dataset S3. The researchers selected thesampled species based on their habitats, including the surface layer, middlelayer, deep layer, and seaweed, in each fishery season. Consequently, thesampling covered the relevant geographical areas of sea. The area of sea foreach prefecture was defined by the area enclosed between the extendedboundaries of the prefecture and the line marking 200 nautical miles off theJapanese main islands.
The data used in this article were collected from 1 April 2011 to 31 March2015.We set the starting date in our analysis to 1 April 2011 because the peakocean discharge occurred 1 mo after the earthquake (1, 24). We then ex-cluded aquacultured fish and processed foods like fried fish before analysis.As a result, the data consist of 68,894 measurements with independent in-spections. We have 1,646 combinations of species and prefectures.
Themeasurements of radiocesiumswere sometimes recorded as less than athreshold value (detection limit), for instance, <10. We can lower the de-tection limit by taking measurements for longer time and increasing thequantity of measured sample. However, for species that are difficult tosample and in prefectures having inadequate measuring instruments, thedetection limit tends to increase. The Japanese government instructed eachprefecture to ensure that their detection limit was 20 Bq/kg or less for thesum of radiocesiums 134Cs+ 137Cs (25). The maximum of detection limitsachieved for either radiocesium was 25 Bq/kg.
Before the risk analysis, we regressed the difference between logð137CsÞand logð134CsÞ against the cumulative days from 1 April 2011 for the observeddata above detection limits (Fig. S1). The intercept in the regression was 0.055,which means that the ratio of 137Cs to 134Cs was almost 1 at the original scale.The regression coefficient (trend) was 0.0008. This value is close to the
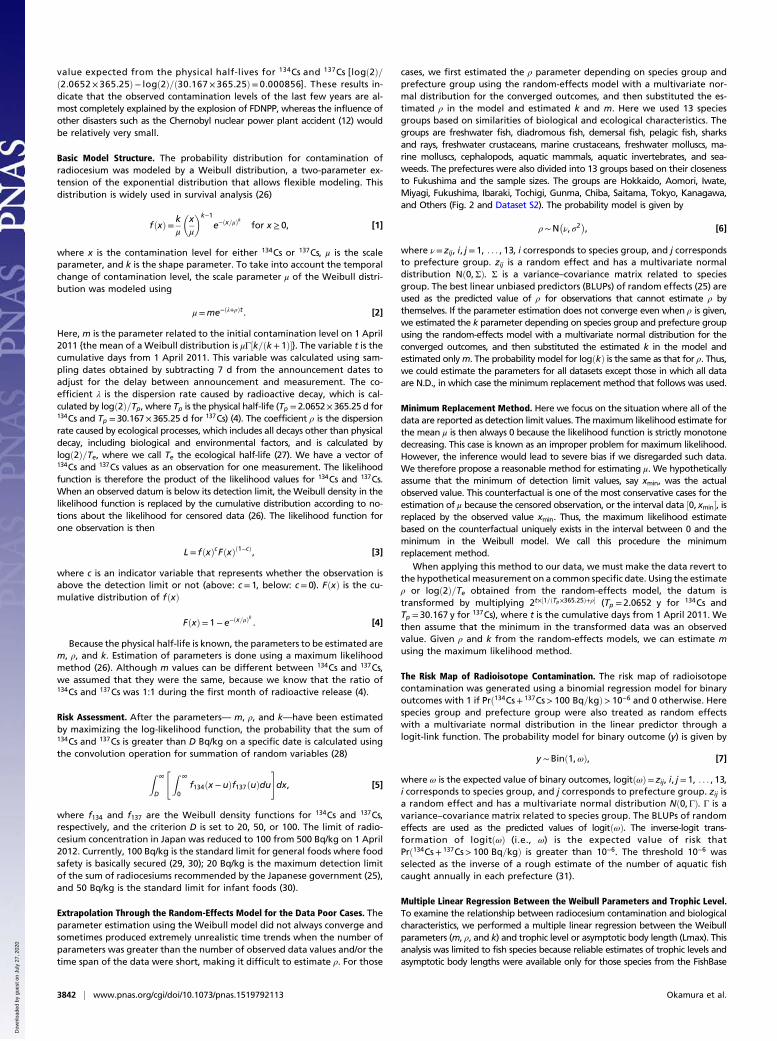
Table 1. Radiocesium contamination risk for representative species in the Fukushima prefecture
Scientific name English name n m Te k Pr(134Cs + 137Cs > 20) Pr(134Cs + 137Cs > 50) Pr(134Cs + 137Cs > 100)
Sebastes cheni Japanese whiteseaperch
367 719.04 314.1 0.981 0.45502 0.09668 0.00749
Hexagrammos otakii Fat greenling 1,077 475.06 203.7 0.820 0.00089 2.70 × 10⁻⁷ 2.13 × 10⁻¹²
Salvelinus leucomaenisleucomaenis
Whitespotted char 921 56.76 465.6 0.640 0.09046 0.01063 0.00076
Anguilla japonica Japanese eel 10 189.69 561.0 1.585 0.62447 0.06672 0.00013Trachurus japonicus Japanese jack
mackerel298 49.13 205.8 0.936 1.93 × 10⁻³³ 1.74 × 10−78 3.11 × 10−150
n is the sample size. m, Te, and k are the parameters of the Weibull distribution (m, initial contamination level; Te, ecological half-life; k, dispersionparameter).
A B
C D
Fig. 3. The relationship between the Weibull distribution parameters, trophic level, and logðLmaxÞ [(A) TL vs. logðLmaxÞ, (B) logðmÞ vs. TL, (C) ρ vs. logðLmaxÞ,and (D) logðkÞ vs. TL]. Red lines are predicted trends for TL or logðLmaxÞ. Neither TL nor logðLmaxÞ for logðmÞ was selected by AIC.
Okamura et al. PNAS | April 5, 2016 | vol. 113 | no. 14 | 3841
ENVIRONMEN
TAL
SCIENCE
SSE
ECO
MMEN
TARY
Dow
nloa
ded
by g
uest
on
July
27,
202
0
value expected from the physical half-lives for 134Cs and 137Cs [logð2Þ=ð2.0652×365.25Þ− logð2Þ=ð30.167×365.25Þ= 0.000856]. These results in-dicate that the observed contamination levels of the last few years are al-most completely explained by the explosion of FDNPP, whereas the influence ofother disasters such as the Chernobyl nuclear power plant accident (12) wouldbe relatively very small.
Basic Model Structure. The probability distribution for contamination ofradiocesium was modeled by a Weibull distribution, a two-parameter ex-tension of the exponential distribution that allows flexible modeling. Thisdistribution is widely used in survival analysis (26)
fðxÞ= kμ
�xμ
�k−1
e−ðx=μÞk
for x ≥ 0, [1]
where x is the contamination level for either 134Cs or 137Cs, μ is the scaleparameter, and k is the shape parameter. To take into account the temporalchange of contamination level, the scale parameter μ of the Weibull distri-bution was modeled using
μ=me−ðλ+ρÞt . [2]
Here, m is the parameter related to the initial contamination level on 1 April2011 {the mean of a Weibull distribution is μΓ½k=ðk+ 1Þ�}. The variable t is thecumulative days from 1 April 2011. This variable was calculated using sam-pling dates obtained by subtracting 7 d from the announcement dates toadjust for the delay between announcement and measurement. The co-efficient λ is the dispersion rate caused by radioactive decay, which is cal-culated by logð2Þ=Tp, where Tp is the physical half-life (Tp = 2.0652× 365.25 d for134Cs and Tp = 30.167× 365.25 d for 137Cs) (4). The coefficient ρ is the dispersionrate caused by ecological processes, which includes all decays other than physicaldecay, including biological and environmental factors, and is calculated bylogð2Þ=Te, where we call Te the ecological half-life (27). We have a vector of134Cs and 137Cs values as an observation for one measurement. The likelihoodfunction is therefore the product of the likelihood values for 134Cs and 137Cs.When an observed datum is below its detection limit, the Weibull density in thelikelihood function is replaced by the cumulative distribution according to no-tions about the likelihood for censored data (26). The likelihood function forone observation is then
L= fðxÞcFðxÞð1−cÞ, [3]
where c is an indicator variable that represents whether the observation isabove the detection limit or not (above: c= 1, below: c= 0). FðxÞ is the cu-mulative distribution of fðxÞ
FðxÞ= 1− e−ðx=μÞk
. [4]
Because the physical half-life is known, the parameters to be estimated arem, ρ, and k. Estimation of parameters is done using a maximum likelihoodmethod (26). Although m values can be different between 134Cs and 137Cs,we assumed that they were the same, because we know that the ratio of134Cs and 137Cs was 1:1 during the first month of radioactive release (4).
Risk Assessment. After the parameters— m, ρ, and k—have been estimatedby maximizing the log-likelihood function, the probability that the sum of134Cs and 137Cs is greater than D Bq/kg on a specific date is calculated usingthe convolution operation for summation of random variables (28)
Z ∞
D
"Z ∞
0f134ðx −uÞf137ðuÞdu
#dx, [5]
where f134 and f137 are the Weibull density functions for 134Cs and 137Cs,respectively, and the criterion D is set to 20, 50, or 100. The limit of radio-cesium concentration in Japan was reduced to 100 from 500 Bq/kg on 1 April2012. Currently, 100 Bq/kg is the standard limit for general foods where foodsafety is basically secured (29, 30); 20 Bq/kg is the maximum detection limitof the sum of radiocesiums recommended by the Japanese government (25),and 50 Bq/kg is the standard limit for infant foods (30).
Extrapolation Through the Random-Effects Model for the Data Poor Cases. Theparameter estimation using the Weibull model did not always converge andsometimes produced extremely unrealistic time trends when the number ofparameters was greater than the number of observed data values and/or thetime span of the data were short, making it difficult to estimate ρ. For those
cases, we first estimated the ρ parameter depending on species group andprefecture group using the random-effects model with a multivariate nor-mal distribution for the converged outcomes, and then substituted the es-timated ρ in the model and estimated k and m. Here we used 13 speciesgroups based on similarities of biological and ecological characteristics. Thegroups are freshwater fish, diadromous fish, demersal fish, pelagic fish, sharksand rays, freshwater crustaceans, marine crustaceans, freshwater molluscs, ma-rine molluscs, cephalopods, aquatic mammals, aquatic invertebrates, and sea-weeds. The prefectures were also divided into 13 groups based on their closenessto Fukushima and the sample sizes. The groups are Hokkaido, Aomori, Iwate,Miyagi, Fukushima, Ibaraki, Tochigi, Gunma, Chiba, Saitama, Tokyo, Kanagawa,and Others (Fig. 2 and Dataset S2). The probability model is given by
ρ∼N�ν, σ2
�, [6]
where ν= zij, i, j= 1, . . . , 13, i corresponds to species group, and j correspondsto prefecture group. zij is a random effect and has a multivariate normaldistribution Nð0,ΣÞ. Σ is a variance–covariance matrix related to speciesgroup. The best linear unbiased predictors (BLUPs) of random effects (25) areused as the predicted value of ρ for observations that cannot estimate ρ bythemselves. If the parameter estimation does not converge even when ρ is given,we estimated the k parameter depending on species group and prefecture groupusing the random-effects model with a multivariate normal distribution for theconverged outcomes, and then substituted the estimated k in the model andestimated onlym. The probability model for logðkÞ is the same as that for ρ. Thus,we could estimate the parameters for all datasets except those in which all dataare N.D., in which case the minimum replacement method that follows was used.
Minimum Replacement Method. Here we focus on the situation where all of thedata are reported as detection limit values. Themaximum likelihood estimate forthe mean μ is then always 0 because the likelihood function is strictly monotonedecreasing. This case is known as an improper problem for maximum likelihood.However, the inference would lead to severe bias if we disregarded such data.We therefore propose a reasonable method for estimating μ. We hypotheticallyassume that the minimum of detection limit values, say xmin, was the actualobserved value. This counterfactual is one of the most conservative cases for theestimation of μ because the censored observation, or the interval data ½0, xmin�, isreplaced by the observed value xmin. Thus, the maximum likelihood estimatebased on the counterfactual uniquely exists in the interval between 0 and theminimum in the Weibull model. We call this procedure the minimumreplacement method.
When applying this method to our data, we must make the data revert tothe hypothetical measurement on a common specific date. Using the estimateρ or logð2Þ=Te obtained from the random-effects model, the datum istransformed by multiplying 2t×½1=ðTp×365.25Þ+ρ� (Tp = 2.0652 y for 134Cs andTp = 30.167 y for 137Cs), where t is the cumulative days from 1 April 2011. Wethen assume that the minimum in the transformed data was an observedvalue. Given ρ and k from the random-effects models, we can estimate musing the maximum likelihood method.
The Risk Map of Radioisotope Contamination. The risk map of radioisotopecontamination was generated using a binomial regression model for binaryoutcomes with 1 if Prð134Cs+ 137Cs> 100 Bq=kgÞ> 10−6 and 0 otherwise. Herespecies group and prefecture group were also treated as random effectswith a multivariate normal distribution in the linear predictor through alogit-link function. The probability model for binary outcome (y) is given by
y ∼Binð1,ωÞ, [7]
where ω is the expected value of binary outcomes, logitðωÞ= zij, i, j= 1, . . . , 13,i corresponds to species group, and j corresponds to prefecture group. zij isa random effect and has a multivariate normal distribution Nð0,ΓÞ. Γ is avariance–covariance matrix related to species group. The BLUPs of randomeffects are used as the predicted values of logitðωÞ. The inverse-logit trans-formation of logitðωÞ (i.e., ω) is the expected value of risk thatPrð134Cs+ 137Cs> 100 Bq=kgÞ is greater than 10−6. The threshold 10−6 wasselected as the inverse of a rough estimate of the number of aquatic fishcaught annually in each prefecture (31).
Multiple Linear Regression Between the Weibull Parameters and Trophic Level.To examine the relationship between radiocesium contamination and biologicalcharacteristics, we performed a multiple linear regression between the Weibullparameters (m, ρ, and k) and trophic level or asymptotic body length (Lmax). Thisanalysis was limited to fish species because reliable estimates of trophic levels andasymptotic body lengths were available only for those species from the FishBase
3842 | www.pnas.org/cgi/doi/10.1073/pnas.1519792113 Okamura et al.
Dow
nloa
ded
by g
uest
on
July
27,
202
0
website (www.fishbase.org/). We used the Weibull parameters as response vari-ables and trophic level (TL), the logarithm of the asymptotic body length[logðLmaxÞ], species group [four levels for fish groups (freshwater fish, diadromousfish, demersal fish, pelagic fish, and sharks and rays)], and prefecture group (13levels) as explanatory variables. The expected value for logðmÞ is given by
E½logðmÞ�= α0 + α1TL+ α2 logðLmaxÞ+X
αkSp+X
αjPref, [8]
where αs are regression parameters, and Sp and Pref are indicator variablesthat represent species group and prefecture group, respectively. Similarly,the expected values for ρ= logð2Þ=Te and logðkÞ are respectively given by
EðρÞ= β0 + β1TL+ β2 logðLmaxÞ+X
βkSp+X
βjPref, [9]
and
EðlogðkÞÞ= γ0 + γ1TL+ γ2 logðLmaxÞ+X
γkSp+X
γjPref. [10]
The variable selection for each model was done using AIC (20). As a sensitivitytest, we also used BIC or AICc. When the coefficients for TL and logðLmaxÞare selected, the predicted values are calculated using partial dependenceplots (32).
All statistical analyses and figures were made using the programs R(version 3.20) and ADModel Builder, version 2.11.1 (33, 34). We provided theSEs for the risks when we could estimate all three parameters—m, ρ, and k—from data without depending on the random-effects model. The SEs wereevaluated using the Hessian matrix and the delta method (26) wheneverpossible (Dataset S2). However, when we could not estimate ρ and/or kwithout the random-effects model, we were not able to evaluate the SEsfor the risks. Because we put more importance on the overall assessmentof radiocesium contamination, estimation uncertainty was ignored in theoverall assessment of contamination risk because most estimations are basedon extrapolation and the minimum replacement method. In fact, estimationuncertainty has been ignored in many post hoc analyses; nevertheless, suchanalyses have continued to provide important knowledge for us (35).However, ignoring estimation errors can result in an inadequate recognitionof the uncertainty and may compromise the soundness of results and con-fidence in them (36). Therefore, developing a new approach to incorporateestimation uncertainty into our method appropriately will be a first priorityin the future.
ACKNOWLEDGMENTS. We thank Drs. Fumihito Muto and Kouichi Hoshinofor advice on scientific names. This research was partly supported by JapanScience and Technology Agency (JST), CREST.
1. Yoshida N, Kanda J (2012) Geochemistry. Tracking the Fukushima radionuclides.Science 336(6085):1115–1116.
2. Schiermeier Q (2011) Radiation release will hit marine life. Nature 472(7342):145–146.3. Brumfiel G (2012) Fukushima’s doses tallied. Nature 485(7399):423–424.4. Buesseler KO, et al. (2012) Fukushima-derived radionuclides in the ocean and biota
off Japan. Proc Natl Acad Sci USA 109(16):5984–5988.5. Smith JN, et al. (2015) Arrival of the Fukushima radioactivity plume in North American
continental waters. Proc Natl Acad Sci USA 112(5):1310–1315.6. TEPCO (2013) Current situations concerning contaminated water. Available at www.
tepco.co.jp/en/decommision/planaction/images/130826_01.pdf. Accessed February 12,2016.
7. Buesseler KO (2012) Ecology. Fishing for answers off Fukushima. Science 338(6106):480–482.
8. Buesseler KO (2014) Fukushima and ocean radioactivity. Oceanography (Wash DC)27(1):92–105.
9. Wada T, et al. (2013) Effects of the nuclear disaster on marine products in Fukushima.J Environ Radioact 124:246–254.
10. Ministry of Health, Labour, andWelfare (2015) Monthly inspection result. Available atwww.mhlw.go.jp/stf/kinkyu/0000045250.html. Accessed February 12, 2016.
11. McKnight PE, McKnight KM, Sidani S, Figueredo AJ (2007) Missing Data: A GentleIntroduction (Guilford, New York).
12. Anspaugh LR, Catlin RJ, Goldman M (1988) The global impact of the Chernobyl re-actor accident. Science 242(4885):1513–1519.
13. Ugedal O, Jonsson B, Njåstad O, Næuman�n R (1992) Effects of temperature and bodysize on radiocesium retention in brown trout, Salmo trutta. Freshw Biol 28(2):165–171.
14. Vives i Batlle J, Wilson RC, McDonald P (2007) Allometric methodology for the calculationof biokinetic parameters for marine biota. Sci Total Environ 388(1-3):256–269.
15. Bulgakov AA, et al. (2002) Modelling the long-term dynamics of radiocaesium inclosed lakes. J Environ Radioact 61(1):41–53.
16. Mikami S, et al. (2015) Spatial distributions of radionuclides deposited onto groundsoil around the Fukushima Dai-ichi Nuclear Power Plant and their temporal changeuntil December 2012. J Environ Radioact 139:320–343.
17. Masumoto Y, et al. (2012) Oceanic dispersion simulations of 137Cs released from theFukushima Daiichi Nuclear Power Plant. Elements (Quebec) 8(3):207–212.
18. Shigenobu Y, et al. (2014) Radiocesium contamination of greenlings (Hexagrammosotakii) off the coast of Fukushima. Sci Rep 4:6851.
19. Romanuk TN, Hayward A, Hutchings JA (2011) Trophic level scales positively withbody size in fishes. Glob Ecol Biogeogr 20(2):231–240.
20. Burnham KP, Anderson DR (2002) Model Selection and Multimodel Inference: APractical Information-Theoretic Approach (Springer, Berlin).
21. Rowan DJ, Rasmussen JB (1994) Bioaccumulation of radiocesium by fish: The influ-ence of physicochemical factors and trophic structure. Can J Fish Aquat Sci 51(11):2388–2410.
22. Mizuno T, Kubo H (2013) Overview of active cesium contamination of freshwater fishin Fukushima and Eastern Japan. Sci Rep 3:1742.
23. Minisry of Health, Labor, and Welfare (2015) Concepts of inspection planning and theestablishment and cancellation of items and areas to which restriction on distributionand/or consumption of foods concerned applies. Attachment 4. Available at www.mhlw.go.jp/english/topics/2011eq/dl/food_revision_20_March_2015.pdf. Accessed February 12,2016.
24. Buesseler K, Aoyama M, Fukasawa M (2011) Impacts of the Fukushima nuclear powerplants on marine radioactivity. Environ Sci Technol 45(23):9931–9935.
25. Minisry of Health, Labor, and Welfare (2012) Testing methods for radioactivesubstances in food. Available at www.mhlw.go.jp/english/topics/2011eq/dl/food-120821_2.pdf. Accessed February 12, 2016.
26. Pawitan Y (2001) In All Likelihood: Statistical Modelling and Inference UsingLikelihood (Oxford Univ Press, Oxford, UK).
27. Morita T, Yoshida K (2005) Effective ecological half-lives of Cs-137 for fishes controlledby their surrounding sea-waters. Radioprotection 40(Suppl 1):S635–S640.
28. Casella G, Berger RL (2001) Statistical Inference (Duxbury Press, Pacific Grove, CA).29. Fisheries Agency of Japan (2015) Report on the monitoring of radionuclides in
fishery products (March 2011–January 2015). Available at www.jfa.maff.go.jp/e/inspection/pdf/report_on_the_monitoring_of_radionuclides_in_fishery_products.pdf. Accessed February 12, 2016.
30. Ministry of Health, Labor, and Welfare (2012) New standard limits for radionuclidesin foods. Available at www.mhlw.go.jp/english/topics/2011eq/dl/new_standard.pdf.Accessed February 12, 2016.
31. Fisheries Agency of Japan (2015) Fisheries stock assessment reports in 2014. Availableat abchan.fra.go.jp/digests26/index.html. Accessed February 12, 2016.
32. Hastie T, Tibshirani R, Friedman J (2009) Elements of Statistical Learning (Springer, New York).33. R Core Team (2015) R: A Language and Environment for Statistical Computing.
R Foundation for Statistical Computing (R Core Team, Vienna).34. Fournier DA, et al. (2012) AD model builder: Using automatic differentiation for
statistical inference of highly parameterized complex nonlinear models. OptimMethods Softw 27(2):233–249.
35. Worm B, et al. (2009) Rebuilding global fisheries. Science 325(5940):578–585.36. Brooks EN, Deroba JJ (2015) When “data” are not data: The pitfalls of post hoc
analyses that use stock assessment model output. Can J Fish Aquat Sci 72(4):634–641.
Okamura et al. PNAS | April 5, 2016 | vol. 113 | no. 14 | 3843
ENVIRONMEN
TAL
SCIENCE
SSE
ECO
MMEN
TARY
Dow
nloa
ded
by g
uest
on
July
27,
202
0


![Boku wa Kimi no Shiro - [batoto]](https://img.pdfslide.us/doc/110x75/613ca8ac9cc893456e1e92a9/boku-wa-kimi-no-shiro-batoto.jpg)