Embed Size (px)
Citation preview
Article
Risk Assessment of Deoxynivalenol by Revisiting ItsBioavailability in Pig and Rat Models to EstablishWhich Is More SuitableManuel Jimmy Saint-Cyr 1,*, Agnès Perrin-Guyomard 1, Jacqueline Manceau 2, Paméla Houée 1,Jean-Michel Delmas 3, Jean-Guy Rolland 2 and Michel Laurentie 2
Received: 16 August 2015; Accepted: 18 November 2015; Published: 1 December 2015Academic Editor: Marc Maresca
1 ANSES, Fougères Laboratory, Antibiotics, Biocides, Residues and Resistance Unit, 10B rue ClaudeBourgelat, Javené, CS 40608, Fougères 35306, France; [email protected] (A.P.-G.);[email protected] (P.H.)
2 ANSES, Fougères Laboratory, Scientific Support Unit, 10B rue Claude Bourgelat, Javené, CS 40608,Fougères 35306, France; [email protected] (J.M.); [email protected] (J.-G.R.);[email protected] (M.L.)
3 ANSES, Fougères Laboratory, Analysis of Residues and Contaminants Unit, 10B rue Claude Bourgelat,Javené, CS 40608, Fougères 35306, France; [email protected]
* Correspondence: [email protected]; Tel.: +33-296-010-168
Abstract: Due to its toxic properties, high stability, and prevalence, the presence of deoxynivalenol(DON) in the food chain is a major threat to food safety and therefore a health risk for bothhumans and animals. In this study, experiments were carried out with sows and female rats toexamine the kinetics of DON after intravenous and oral administration at 100 µg/kg of body weight.After intravenous administration of DON in pigs, a two-compartment model with rapid initialdistribution (0.030 ˘ 0.019 h) followed by a slower terminal elimination phase (1.53 ˘ 0.54 h) wasfitted to the concentration profile of DON in pig plasma. In rats, a short elimination half-life (0.46 h)and a clearance of 2.59 L/h/kg were estimated by sparse sampling non-compartmental analysis.Following oral exposure, DON was rapidly absorbed and reached maximal plasma concentrations(Cmax) of 42.07 ˘ 8.48 and 10.44 ˘ 5.87 µg/L plasma after (tmax) 1.44 ˘ 0.52 and 0.17 h in pigs andrats, respectively. The mean bioavailability of DON was 70.5% ˘ 25.6% for pigs and 47.3% for rats.In the framework of DON risk assessment, these two animal models could be useful in an exposurescenario in two different ways because of their different bioavailability.
Keywords: deoxynivalenol; bioavailability; toxicokinetic; risk assessment
1. Introduction
Deoxynivalenol (DON) is a secondary fungal metabolite of the trichothecene family. Producedby Fusarium species, it is one of the most prevalent mycotoxins in cereal crops worldwide, andthe most frequently occurring type B trichothecene in Europe. A large-scale data survey indicatedthat DON is present in 43.5% of food and 75.2% of feed samples collected in the EuropeanUnion [1]. Epidemiological studies linking DON exposure to adverse health effects in humans havebeen reported in China, India, Japan, and Korea [2–4]. DON-contaminated foods cause humangastroenteritis with nausea, diarrhea, and vomiting. In addition to the symptoms described inhumans, DON toxicity in animals leads them to refuse feed, with consequent growth retardation [5].At the cellular level, even though DON poses no genotoxic or mutagenic risk [6,7], it has been shownto inhibit protein synthesis and modulate immune responses [8,9]. Due to its toxic properties, highstability, and prevalence, the presence of DON in the food chain is a major threat to food safety,
Toxins 2015, 7, 5167–5181; doi:10.3390/toxins7124873 www.mdpi.com/journal/toxins
Toxins 2015, 7, 5167–5181
representing a health risk for both humans and animals [10–12]. This risk was characterized inanimals by toxicological, epidemiological and kinetic studies reviewed by Pestka (2007) [5]. A NoObservable Adverse Effect Level (NOAEL) has been established at 100 µg/kg of body weight (bw)based on a decreased body weight gain reported in a two-year feeding study in mice [13].
Despite its well-known toxicological effects and established epidemiological data, informationon DON kinetics is more limited, although knowledge of the kinetic parameters of a toxic agent likeDON is essential for evaluating animal and human health risks. In addition, oral bioavailability—amajor parameter—has rarely been defined, despite DON being an orally-ingested food contaminant.Furthermore, the few kinetic studies that are available have focused on farm animals such as chickens,pigs, or sheep [14–18], whereas toxicological studies have focused on rodents [19] in order to link doseand effects. Moreover, the parameters defined could be misused and/or unsuitable for two reasons:first, the use of data below the limit of quantification for kinetic analysis, and second, the use of anunsuitable approach to estimating kinetic parameters by misuse of the mean and conventional kineticapproach through sparse sampling. In addition, these studies are not recent, and new insights needto be sought.
The aim of this study was to assess DON toxicokinetics in two animal models after intravenous(IV) and oral gavage at the NOAEL dose. We used pigs because their vascular anatomy andphysiology are similar to humans, and rats because they are conventionally used for toxicologicalstudies. The parameters thus obtained may help to improve knowledge on DON kinetics at NOAEL.
2. Results
2.1. Clinical Signs
Deoxynivalenol was tolerated by all animals, but there was an obvious difference in themanifestation of side effects when comparing species or ways of administration. All pigsadministered intravenously with 100 µg DON/kg bw showed signs of acute DON toxicosis,salivation, retching, and emesis within a few minutes (8–15 min). In contrast, at the same dose,no signs of toxicity were observed in pigs following oral administration, or in rats irrespective of theroute of administration.
2.2. Concentration Profile after IV Administration of DON
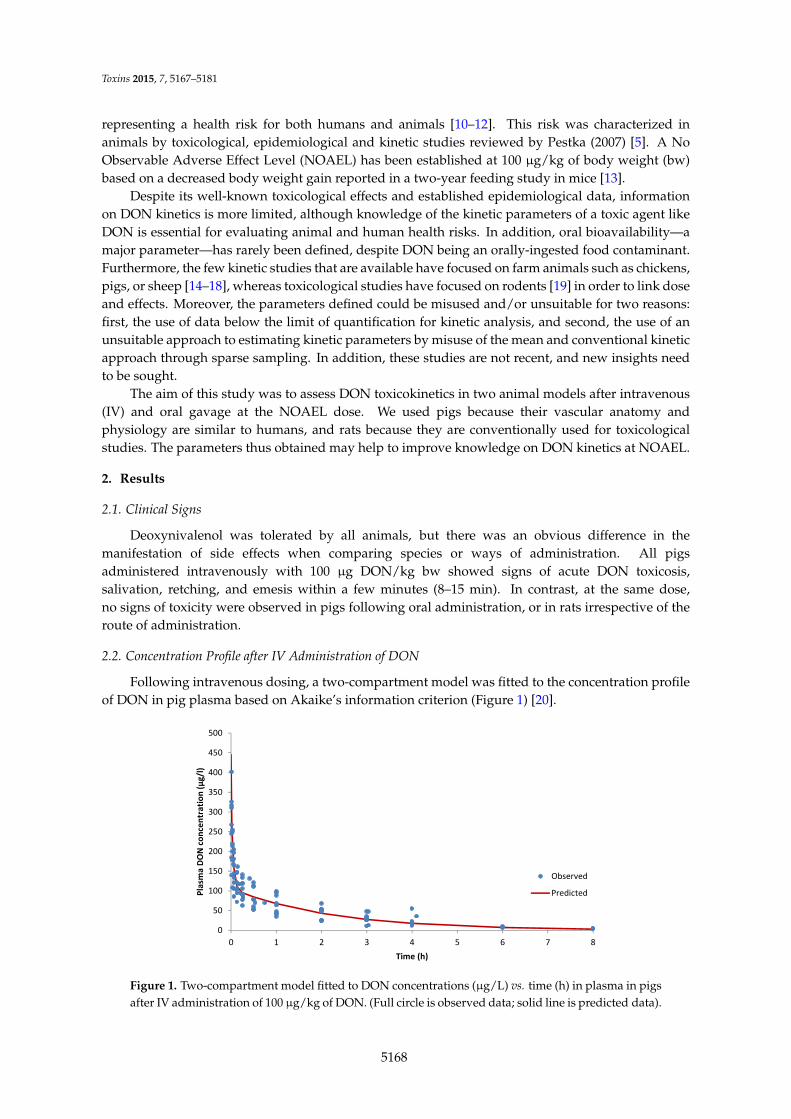
Following intravenous dosing, a two-compartment model was fitted to the concentration profileof DON in pig plasma based on Akaike’s information criterion (Figure 1) [20].
Toxins 2015, 7 3
with 100 µg DON/kg bw showed signs of acute DON toxicosis, salivation, retching, and emesis within
a few minutes (8–15 min). In contrast, at the same dose, no signs of toxicity were observed in pigs
following oral administration, or in rats irrespective of the route of administration.
2.2. Concentration Profile after IV Administration of DON
Following intravenous dosing, a two-compartment model was fitted to the concentration profile of
DON in pig plasma based on Akaike’s information criterion (Figure 1) [20].
Figure 1. Two-compartment model fitted to DON concentrations (µg/L) vs. time (h) in
plasma in pigs after IV administration of 100 µg/kg of DON. (Full circle is observed data;
solid line is predicted data).
This two-compartment model is described by the bi-exponential equation below:
(1)
where C(t) is the DON concentration at time t; A and B the extrapolated values to time 0 of the first and
second phases of DON concentration disposition and α, β the rate constant of distribution and elimination
phases, respectively. From Equation (4), kinetic parameters were calculated and reported in Table 1.
Initial distribution was rapid, with a mean half-life (t1/2α) of 0.030 ± 0.019 h, followed by a slower
terminal elimination phase (t1/2β) of 1.53 ± 0.54 h (Table 1). The total plasma clearance (Cl) of DON
calculated from the equation described by Toutain and Bousquet-Mélou (2004) [21] was 0.42 ± 0.17 L/h/kg
(Table 1). The volume of distribution at steady state was equal to 0.88 ± 0.17 L/kg.
The non-compartmental analysis (NCA) (Table 2) confirmed the results obtained with the
compartmental analysis for the different estimated parameters. No statistical differences were observed
between parameters. MRT was estimated at 2.24 ± 1.15 h.
0
50
100
150
200
250
300
350
400
450
500
0 1 2 3 4 5 6 7 8
Plasm
a DON concentration (µg/l)
Time (h)
Observed
Predicted
Figure 1. Two-compartment model fitted to DON concentrations (µg/L) vs. time (h) in plasma in pigsafter IV administration of 100 µg/kg of DON. (Full circle is observed data; solid line is predicted data).
5168
Toxins 2015, 7, 5167–5181
This two-compartment model is described by the bi-exponential equation below:
C ptq “ Ae´αt ` Be´βt (1)
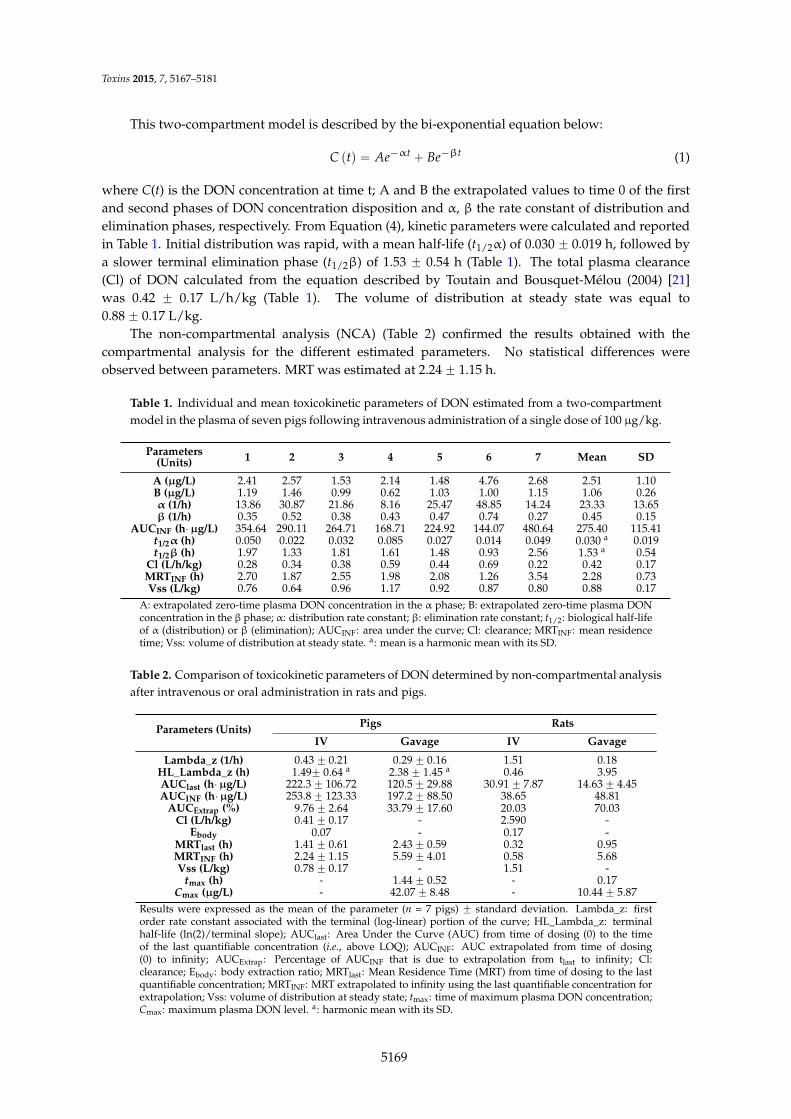
where C(t) is the DON concentration at time t; A and B the extrapolated values to time 0 of the firstand second phases of DON concentration disposition and α, β the rate constant of distribution andelimination phases, respectively. From Equation (4), kinetic parameters were calculated and reportedin Table 1. Initial distribution was rapid, with a mean half-life (t1/2α) of 0.030 ˘ 0.019 h, followed bya slower terminal elimination phase (t1/2β) of 1.53 ˘ 0.54 h (Table 1). The total plasma clearance(Cl) of DON calculated from the equation described by Toutain and Bousquet-Mélou (2004) [21]was 0.42 ˘ 0.17 L/h/kg (Table 1). The volume of distribution at steady state was equal to0.88 ˘ 0.17 L/kg.
The non-compartmental analysis (NCA) (Table 2) confirmed the results obtained with thecompartmental analysis for the different estimated parameters. No statistical differences wereobserved between parameters. MRT was estimated at 2.24 ˘ 1.15 h.
Table 1. Individual and mean toxicokinetic parameters of DON estimated from a two-compartmentmodel in the plasma of seven pigs following intravenous administration of a single dose of 100 µg/kg.
Parameters(Units) 1 2 3 4 5 6 7 Mean SD
A (µg/L) 2.41 2.57 1.53 2.14 1.48 4.76 2.68 2.51 1.10B (µg/L) 1.19 1.46 0.99 0.62 1.03 1.00 1.15 1.06 0.26α (1/h) 13.86 30.87 21.86 8.16 25.47 48.85 14.24 23.33 13.65β (1/h) 0.35 0.52 0.38 0.43 0.47 0.74 0.27 0.45 0.15
AUCINF (h¨µg/L) 354.64 290.11 264.71 168.71 224.92 144.07 480.64 275.40 115.41t1/2α (h) 0.050 0.022 0.032 0.085 0.027 0.014 0.049 0.030 a 0.019t1/2β (h) 1.97 1.33 1.81 1.61 1.48 0.93 2.56 1.53 a 0.54
Cl (L/h/kg) 0.28 0.34 0.38 0.59 0.44 0.69 0.22 0.42 0.17MRTINF (h) 2.70 1.87 2.55 1.98 2.08 1.26 3.54 2.28 0.73Vss (L/kg) 0.76 0.64 0.96 1.17 0.92 0.87 0.80 0.88 0.17
A: extrapolated zero-time plasma DON concentration in the α phase; B: extrapolated zero-time plasma DONconcentration in the β phase; α: distribution rate constant; β: elimination rate constant; t1/2: biological half-lifeof α (distribution) or β (elimination); AUCINF: area under the curve; Cl: clearance; MRTINF: mean residencetime; Vss: volume of distribution at steady state. a: mean is a harmonic mean with its SD.
Table 2. Comparison of toxicokinetic parameters of DON determined by non-compartmental analysisafter intravenous or oral administration in rats and pigs.
Parameters (Units) Pigs Rats
IV Gavage IV Gavage
Lambda_z (1/h) 0.43 ˘ 0.21 0.29 ˘ 0.16 1.51 0.18HL_Lambda_z (h) 1.49˘ 0.64 a 2.38 ˘ 1.45 a 0.46 3.95AUClast (h¨µg/L) 222.3 ˘ 106.72 120.5 ˘ 29.88 30.91 ˘ 7.87 14.63 ˘ 4.45AUCINF (h¨µg/L) 253.8 ˘ 123.33 197.2 ˘ 88.50 38.65 48.81
AUCExtrap (%) 9.76 ˘ 2.64 33.79 ˘ 17.60 20.03 70.03Cl (L/h/kg) 0.41 ˘ 0.17 - 2.590 -
Ebody 0.07 - 0.17 -MRTlast (h) 1.41 ˘ 0.61 2.43 ˘ 0.59 0.32 0.95MRTINF (h) 2.24 ˘ 1.15 5.59 ˘ 4.01 0.58 5.68Vss (L/kg) 0.78 ˘ 0.17 - 1.51 -
tmax (h) - 1.44 ˘ 0.52 - 0.17Cmax (µg/L) - 42.07 ˘ 8.48 - 10.44 ˘ 5.87
Results were expressed as the mean of the parameter (n = 7 pigs) ˘ standard deviation. Lambda_z: firstorder rate constant associated with the terminal (log-linear) portion of the curve; HL_Lambda_z: terminalhalf-life (ln(2)/terminal slope); AUClast: Area Under the Curve (AUC) from time of dosing (0) to the timeof the last quantifiable concentration (i.e., above LOQ); AUCINF: AUC extrapolated from time of dosing(0) to infinity; AUCExtrap: Percentage of AUCINF that is due to extrapolation from tlast to infinity; Cl:clearance; Ebody: body extraction ratio; MRTlast: Mean Residence Time (MRT) from time of dosing to the lastquantifiable concentration; MRTINF: MRT extrapolated to infinity using the last quantifiable concentration forextrapolation; Vss: volume of distribution at steady state; tmax: time of maximum plasma DON concentration;Cmax: maximum plasma DON level. a: harmonic mean with its SD.
5169

Toxins 2015, 7, 5167–5181
In rats, we assessed the kinetic parameters of DON after IV administration by sparse samplingNCA. The results obtained are presented in Table 2 and the time course evolution of mean DONconcentrations in plasma is illustrated in Figure 2.
Toxins 2015, 7 5
In rats, we assessed the kinetic parameters of DON after IV administration by sparse sampling NCA.
The results obtained are presented in Table 2 and the time course evolution of mean DON concentrations
in plasma is illustrated in Figure 2.
Figure 2. Time course evolution of mean DON concentrations (µg/L) vs. time (h) in rat plasma
after IV or oral administration of 100 µg/kg of DON (n = 3 per sampling time).
A short elimination half-life (0.46 h), clearance of 2.59 L/h/kg and Vss of 1.5 L/kg were estimated.
The MRT was also short, with values of 0.32 h to 0.58 h for MRTlast and MRTINF, respectively. It was
also observed that the extrapolated area makes a major contribution (20%) to the total area (AUCINF).
To compare clearance of rat and pigs, the body extraction ratio (Ebody) was determined from cardiac
output. Ebody and cardiac output were calculated with equations classically described [21] with a hepatic
and renal extraction ratio equal to 1. Under these conditions, we estimated that Ebody was 0.07 for pigs
and 0.17 for rats. From the reference values provided for Ebody, a value close to 0.05 indicates poor
clearance and a value close to 0.15 moderate clearance. Consequently, the clearance of DON in pigs is
poor, whereas in rats it is moderate. Furthermore, clearance is three times higher in rats than in pigs.
2.3. Concentration Profile after Oral Administration of DON
After oral administration of DON, the plasma concentration vs. time curves in pigs were best
described by a one-compartment model with first order absorption and elimination without a lag time
(Figure 3) based on the following equation:
(2)
where F is the bioavailability, D the dose; K01 the rate of absorption, V the apparent volume of distribution
and K10 the rate of elimination. Table 3 presents the kinetic parameters obtained from Equation (5).
0
20
40
60
80
100
120
140
0 1 2 3 4 5 6
Plasm
a DON concentration (µg/l)
Time (h)
IV
Gavage
Figure 2. Time course evolution of mean DON concentrations (µg/L) vs. time (h) in rat plasma afterIV or oral administration of 100 µg/kg of DON (n = 3 per sampling time).
A short elimination half-life (0.46 h), clearance of 2.59 L/h/kg and Vss of 1.5 L/kg wereestimated. The MRT was also short, with values of 0.32 h to 0.58 h for MRTlast and MRTINF,respectively. It was also observed that the extrapolated area makes a major contribution (20%) tothe total area (AUCINF).
To compare clearance of rat and pigs, the body extraction ratio (Ebody) was determined fromcardiac output. Ebody and cardiac output were calculated with equations classically described [21]with a hepatic and renal extraction ratio equal to 1. Under these conditions, we estimated that Ebodywas 0.07 for pigs and 0.17 for rats. From the reference values provided for Ebody, a value close to 0.05indicates poor clearance and a value close to 0.15 moderate clearance. Consequently, the clearance ofDON in pigs is poor, whereas in rats it is moderate. Furthermore, clearance is three times higher inrats than in pigs.
2.3. Concentration Profile after Oral Administration of DON
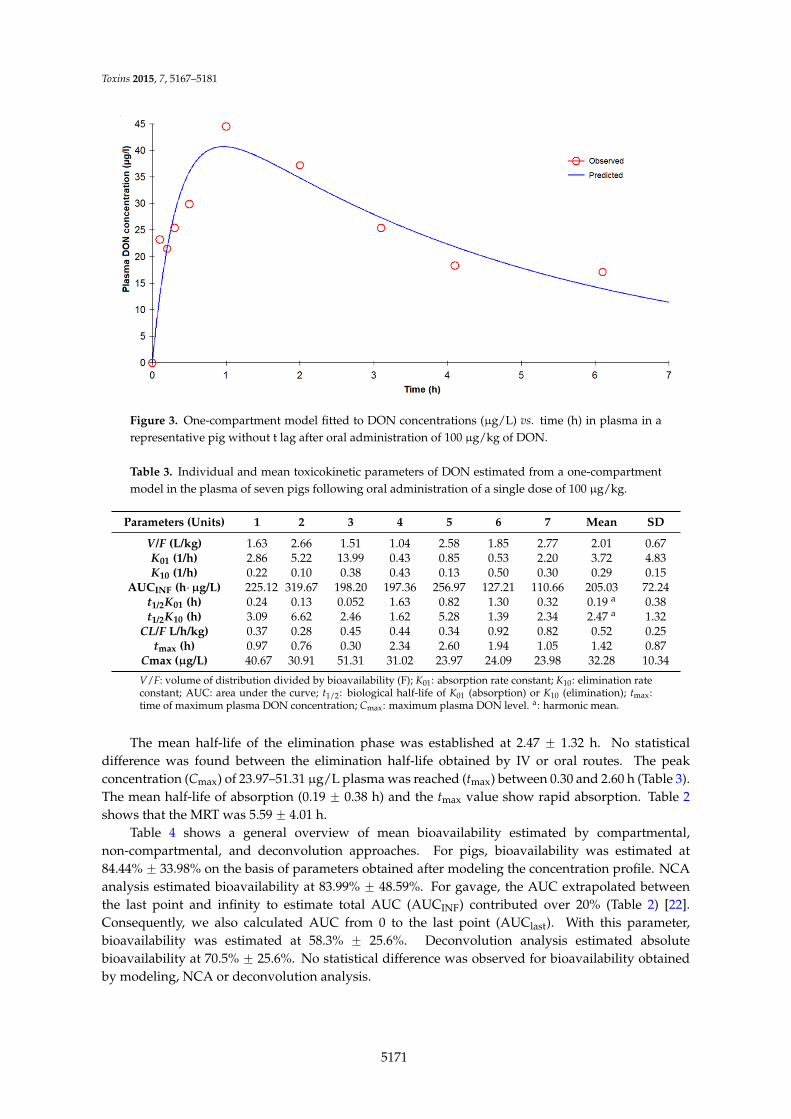
After oral administration of DON, the plasma concentration vs. time curves in pigs were bestdescribed by a one-compartment model with first order absorption and elimination without a lagtime (Figure 3) based on the following equation:
C ptq “FDK01
V pK01 ´ K10qre´K10ptq ´ e´K01ptq (2)
where F is the bioavailability, D the dose; K01 the rate of absorption, V the apparent volumeof distribution and K10 the rate of elimination. Table 3 presents the kinetic parameters obtainedfrom Equation (5).
5170
Toxins 2015, 7, 5167–5181Toxins 2015, 7 6
Figure 3. One-compartment model fitted to DON concentrations (µg/L) vs. time (h) in
plasma in a representative pig without t lag after oral administration of 100 µg/kg of DON.
Table 3. Individual and mean toxicokinetic parameters of DON estimated from a
one-compartment model in the plasma of seven pigs following oral administration of a single
dose of 100 µg/kg.
Parameters (Units) 1 2 3 4 5 6 7 Mean SD
V/F (L/kg) 1.63 2.66 1.51 1.04 2.58 1.85 2.77 2.01 0.67 K01 (1/h) 2.86 5.22 13.99 0.43 0.85 0.53 2.20 3.72 4.83 K10 (1/h) 0.22 0.10 0.38 0.43 0.13 0.50 0.30 0.29 0.15
AUCINF (h·µg/L) 225.12 319.67 198.20 197.36 256.97 127.21 110.66 205.03 72.24t1/2K01 (h) 0.24 0.13 0.052 1.63 0.82 1.30 0.32 0.19 a 0.38 t1/2K10 (h) 3.09 6.62 2.46 1.62 5.28 1.39 2.34 2.47 a 1.32
CL/F (L/h/kg) 0.37 0.28 0.45 0.44 0.34 0.92 0.82 0.52 0.25 tmax (h) 0.97 0.76 0.30 2.34 2.60 1.94 1.05 1.42 0.87
Cmax (µg/L) 40.67 30.91 51.31 31.02 23.97 24.09 23.98 32.28 10.34
V/F: volume of distribution divided by bioavailability (F); K01: absorption rate constant; K10: elimination
rate constant; AUC: area under the curve; t1/2: biological half-life of K01 (absorption) or K10 (elimination);
tmax: time of maximum plasma DON concentration; Cmax: maximum plasma DON level. a: harmonic mean.
The mean half-life of the elimination phase was established at 2.47 ± 1.32 h. No statistical difference
was found between the elimination half-life obtained by IV or oral routes. The peak concentration (Cmax)
of 23.97–51.31 µg/L plasma was reached (tmax) between 0.30 and 2.60 h (Table 3). The mean half-life
of absorption (0.19 ± 0.38 h) and the tmax value show rapid absorption. Table 2 shows that the MRT was
5.59 ± 4.01 h.
Table 4 shows a general overview of mean bioavailability estimated by compartmental,
non-compartmental, and deconvolution approaches. For pigs, bioavailability was estimated at
84.44% ± 33.98% on the basis of parameters obtained after modeling the concentration profile. NCA
analysis estimated bioavailability at 83.99% ± 48.59%. For gavage, the AUC extrapolated between the
last point and infinity to estimate total AUC (AUCINF) contributed over 20% (Table 2) [22]. Consequently,
Figure 3. One-compartment model fitted to DON concentrations (µg/L) vs. time (h) in plasma in arepresentative pig without t lag after oral administration of 100 µg/kg of DON.
Table 3. Individual and mean toxicokinetic parameters of DON estimated from a one-compartmentmodel in the plasma of seven pigs following oral administration of a single dose of 100 µg/kg.
Parameters (Units) 1 2 3 4 5 6 7 Mean SD
V/F (L/kg) 1.63 2.66 1.51 1.04 2.58 1.85 2.77 2.01 0.67K01 (1/h) 2.86 5.22 13.99 0.43 0.85 0.53 2.20 3.72 4.83K10 (1/h) 0.22 0.10 0.38 0.43 0.13 0.50 0.30 0.29 0.15
AUCINF (h¨µg/L) 225.12 319.67 198.20 197.36 256.97 127.21 110.66 205.03 72.24t1/2K01 (h) 0.24 0.13 0.052 1.63 0.82 1.30 0.32 0.19 a 0.38t1/2K10 (h) 3.09 6.62 2.46 1.62 5.28 1.39 2.34 2.47 a 1.32
CL/F L/h/kg) 0.37 0.28 0.45 0.44 0.34 0.92 0.82 0.52 0.25tmax (h) 0.97 0.76 0.30 2.34 2.60 1.94 1.05 1.42 0.87
Cmax (µg/L) 40.67 30.91 51.31 31.02 23.97 24.09 23.98 32.28 10.34
V/F: volume of distribution divided by bioavailability (F); K01: absorption rate constant; K10: elimination rateconstant; AUC: area under the curve; t1/2: biological half-life of K01 (absorption) or K10 (elimination); tmax:time of maximum plasma DON concentration; Cmax: maximum plasma DON level. a: harmonic mean.
The mean half-life of the elimination phase was established at 2.47 ˘ 1.32 h. No statisticaldifference was found between the elimination half-life obtained by IV or oral routes. The peakconcentration (Cmax) of 23.97–51.31 µg/L plasma was reached (tmax) between 0.30 and 2.60 h (Table 3).The mean half-life of absorption (0.19 ˘ 0.38 h) and the tmax value show rapid absorption. Table 2shows that the MRT was 5.59 ˘ 4.01 h.
Table 4 shows a general overview of mean bioavailability estimated by compartmental,non-compartmental, and deconvolution approaches. For pigs, bioavailability was estimated at84.44% ˘ 33.98% on the basis of parameters obtained after modeling the concentration profile. NCAanalysis estimated bioavailability at 83.99% ˘ 48.59%. For gavage, the AUC extrapolated betweenthe last point and infinity to estimate total AUC (AUCINF) contributed over 20% (Table 2) [22].Consequently, we also calculated AUC from 0 to the last point (AUClast). With this parameter,bioavailability was estimated at 58.3% ˘ 25.6%. Deconvolution analysis estimated absolutebioavailability at 70.5% ˘ 25.6%. No statistical difference was observed for bioavailability obtainedby modeling, NCA or deconvolution analysis.
5171
Toxins 2015, 7, 5167–5181
Table 4. Comparison of mean bioavailability of DON in rats (n = 3 by sampling time) and pigs (n = 7)after modeling, NCA, and deconvolution.
Animal modelBioavailability (%)
Modeling NCADeconvolution
INF a Last b
Pigs 84.4 ˘ 34.0 84.0 ˘ 48.6 58.3 ˘ 25.6 70.5 ˘ 25.6Rats - 126.3 47.3 -
a bioavailability calculated with AUCINF; b bioavailability calculated with AUClast.
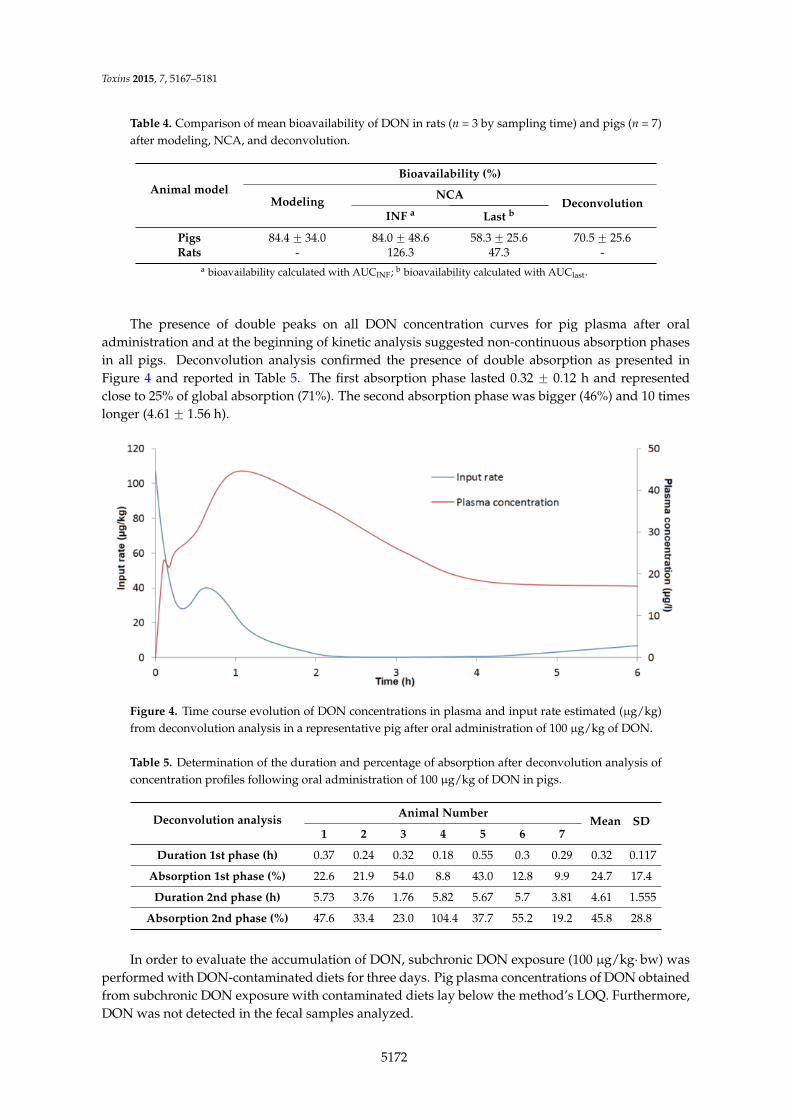
The presence of double peaks on all DON concentration curves for pig plasma after oraladministration and at the beginning of kinetic analysis suggested non-continuous absorption phasesin all pigs. Deconvolution analysis confirmed the presence of double absorption as presented inFigure 4 and reported in Table 5. The first absorption phase lasted 0.32 ˘ 0.12 h and representedclose to 25% of global absorption (71%). The second absorption phase was bigger (46%) and 10 timeslonger (4.61 ˘ 1.56 h).
Toxins 2015, 7 7
we also calculated AUC from 0 to the last point (AUClast). With this parameter, bioavailability
was estimated at 58.3% ± 25.6%. Deconvolution analysis estimated absolute bioavailability at
70.5% ± 25.6%. No statistical difference was observed for bioavailability obtained by modeling, NCA
or deconvolution analysis.
Table 4. Comparison of mean bioavailability of DON in rats (n = 3 by sampling time) and
pigs (n = 7) after modeling, NCA, and deconvolution.
Animal model
Bioavailability (%)
Modeling NCA
Deconvolution INF a Last b
Pigs 84.4 ± 34.0 84.0 ± 48.6 58.3 ± 25.6 70.5 ± 25.6 Rats - 126.3 47.3 -
a bioavailability calculated with AUCINF; b bioavailability calculated with AUClast.
The presence of double peaks on all DON concentration curves for pig plasma after oral administration
and at the beginning of kinetic analysis suggested non-continuous absorption phases in all pigs.
Deconvolution analysis confirmed the presence of double absorption as presented in Figure 4 and
reported in Table 5. The first absorption phase lasted 0.32 ± 0.12 h and represented close to 25% of global
absorption (71%). The second absorption phase was bigger (46%) and 10 times longer (4.61 ± 1.56 h).
Figure 4. Time course evolution of DON concentrations in plasma and input rate estimated
(µg/kg) from deconvolution analysis in a representative pig after oral administration of
100 µg/kg of DON.
Figure 4. Time course evolution of DON concentrations in plasma and input rate estimated (µg/kg)from deconvolution analysis in a representative pig after oral administration of 100 µg/kg of DON.
Table 5. Determination of the duration and percentage of absorption after deconvolution analysis ofconcentration profiles following oral administration of 100 µg/kg of DON in pigs.
Deconvolution analysis Animal NumberMean SD
1 2 3 4 5 6 7
Duration 1st phase (h) 0.37 0.24 0.32 0.18 0.55 0.3 0.29 0.32 0.117
Absorption 1st phase (%) 22.6 21.9 54.0 8.8 43.0 12.8 9.9 24.7 17.4
Duration 2nd phase (h) 5.73 3.76 1.76 5.82 5.67 5.7 3.81 4.61 1.555
Absorption 2nd phase (%) 47.6 33.4 23.0 104.4 37.7 55.2 19.2 45.8 28.8
In order to evaluate the accumulation of DON, subchronic DON exposure (100 µg/kg¨ bw) wasperformed with DON-contaminated diets for three days. Pig plasma concentrations of DON obtainedfrom subchronic DON exposure with contaminated diets lay below the method’s LOQ. Furthermore,DON was not detected in the fecal samples analyzed.
5172
Toxins 2015, 7, 5167–5181
For gavage of rats, 70% of AUCINF was extrapolated for gavage, so the value of bioavailabilityto retain is the value estimated from AUClast. The AUClast value was 14.63 ˘ 4.45 h¨µg/L andthe corresponding bioavailability was estimated at 47.3%, ranging from 45.1% to 49.2%. Peakconcentrations (Cmax) of 10.44 ˘ 3.39 µg/L of DON were reached (tmax) at 0.17 h, indicating rapidabsorption. MRTlast was established at 0.95 h.
3. Discussion
This study assessed DON toxicokinetics in two animal models after intravenous (IV)administration and oral gavage at the NOAEL.
Our clinical observations were in accordance with Pestka et al. (1987), who reportedthat 50 µg/kg live weight of DON was the minimum effective dose that provoked emesis inpigs [23]. Only IV administration provokes emesis due to the rapid distribution of DON and ahigh concentration in the brain, leading to a central action by major neurotransmitters such asnoradrenaline, dopamine, or serotonin [14,24].
For the toxicokinetic study, we only focused on plasma concentrations of DON because not asmany metabolites of DON are present in pigs as the parent molecule [25], although glucuronideshould not be neglected [26]. However, DON toxicity is mainly due to the parent molecule. Indeed,in most cases, metabolites are a detoxification product of DON and appear less harmful [27–29].They are unable to give DON back into the organism, unlike DON-3-Glucoside [30]. After IVadministration of DON in pigs, Prelusky et al. (1988) adapted a two- and three-compartment model,whereas Goyarts and Danicke (2006) described a two-compartment model as shown in the currentstudy [17,25]. From our results and these observations, it could be suggested that the model’s fitdepends on the frequency of blood sampling during the initial minutes after dosing as well as theperformance of the analytical methods used, and in particular the limit of quantification. Prelusky etal. (1988) analyzed the disappearance of radioactivity in plasma after application of 14C-labelledDON, but revised this method because of inaccuracy at low doses [16,17]. The toxicokineticparameters determined in our study indicate that DON was not widely distributed and was rapidlyeliminated from plasma. These observations suggest that there is no accumulation in tissues asproposed by Prelusky et al. (1988) [17]. However, a comparison with the results from previous studiesis not possible because not all sample results had levels above the LOQ of the method used.
In contrast to pigs, information on the IV toxicokinetic parameters of DON in rats is scarce.Following the IV administration to rats, we observed through a sparse sampling procedure thatextrapolated data made a large contribution to the estimation of AUCINF. Consequently, only theparameters estimated between 0 and the last point above the LOQ were considered. Taking this pointinto account, the two animal species showed major differences, as AUClast was seven-fold higher inpigs than in rats. After the administration of 100 µg/kg¨ bw of DON, the plasma concentrations weremuch higher in pigs than in rats. This observation may be explained by different metabolizationvelocities that have been described earlier. Maul et al. (2015) investigated DON metabolism usingliver microsomes from various animal species [31]. They highlighted that liver microsomes fromrats led to relatively rapid apparent intrinsic clearance of DON by glucuronidation, while livermicrosomes from pigs showed more moderate activity.
After oral administration in pigs, the elimination rate (2.47 h) is fairly similar to the eliminationrate following IV administration (1.53 h). This result is not in accordance with Goyarts and Danicke(2006) [14], but could be explained by the difference in DON administration route (diet vs. oralgavage). Furthermore, mean half-life should be calculated using a harmonic mean as recommendedby Lam et al. (1985) and not the classic arithmetic mean used by Goyarts and Danicke (2006) [14,32].By using a harmonic mean on Goyarts’ data, no difference was observed. Absorption is very rapid(half-life close to 15 min) and in accordance with the rapid appearance (tmax 0.3 to 2.6 h) of theplasma’s peak DON concentration (Cmax). These results lie within the same range reported in theliterature. Following an intragastric application of 600 µg/kg of DON, Prelusky et al. reported
5173
Toxins 2015, 7, 5167–5181
(1988) a peak concentration within 15–30 min with a maximal plasma concentration range for DON of63–325 ng/mL) [17]. In another toxicokinetic study in pigs, Prelusky et al. (1990) measured maximalDON concentrations (Cmax) of 367 ˘ 37 µg/L after 3.75 ˘ 1.26 h (tmax) following intragastricadministration of 1000 µg/kg of DON [16].
DON was also rapidly absorbed by rats, with maximal plasma concentration 0.17 h after oraladministration. In mice, Pestka et al. (2008) reported two-compartment toxicokinetics with a Cmax of12 µg/mL within 5–15 min following oral administration of 25 mg/kg¨ bw of DON [19]. These resultsare in agreement with our toxicokinetic study of DON in rats. The latter exhibited a lower Cmax thanpigs (1:4) while the AUClast was eight times lower.
To our knowledge, this is the first study comparing oral bioavailability of DON in two differentanimal models at the same dose. The bioavailability of DON appeared higher in pigs than inrats. However, in rats, the absolute bioavailability value could not be taken into considerationbecause of the major contribution of extrapolation in AUCINF calculation. The low bioavailabilityof rats was estimated at 47%, suggesting that more than half the DON dose remained in the rats’intestines. When compared to the bioavailability of DON in pigs calculated with AUClast (58%),this difference could indicate that DON has a larger impact on the intestinal microbiota of ratsthan pigs, as already reported in the literature [33,34]. The data of the present study may also beinterpreted as it being the fast metabolism which may cause low bioavailability of free DON. Forexample, Schwartz-Zimmermann et al. (2014) have recently highlighted the whole spectrum of DONmetabolites in rats in a feeding trial. The quantitation of DON and its sulfonates in rat feces revealedthat DON sulfonates accounted for approximately 50% of the total amount of DON administered [35].These rat trial results notably revealed the near exclusive occurrence of DON sulfonates in feces andindicated formation of sulfonates in the gut intestinal tract. DON sulfonate formation could lowerthe absorption of DON and explain the difference in bioavailability between rats and pigs.
The absolute bioavailability of DON in pigs (70%) estimated in this study was in accordance withthe results of Prelusky et al. (1988) and Goyarts and Danicke (2006), who found a bioavailability valueof 54.8% ˘ 8.6% and 54.1% ˘ 17.5%, respectively [14,17]. As absolute bioavailability was determinedafter data modelling, values may be incorrectly estimated because the model did not fit the data well.Our study, for instance, did not take into account the presence of the double peak. This hypothesisis supported by the fact that the bioavailability reported by the abovementioned authors is closer tothe value we obtained from AUClast calculation than from our deconvolution analysis. In contrast, nodouble peak was observed during the absorption phase in rats, which could be due to the frequencyof blood sampling during the initial minutes after dosing. This double peak, systematically observedin all pigs during the absorption phase, indicates that absorption could start in the stomach or upperpart of the duodenum (first peak) as suggested by Goyarts et al. (2006) and assumed by the findingsof Eriksen et al. (2003) and Danicke et al. (2004) [14,25,27]. A second, larger portion of the dosepasses into the blood (second peak) from the intestine. The presence of these discontinuous biphasicabsorption patterns could not be related to a food effect because the pigs were fed at least 4 h afterDON administration. Further studies are needed to assess the clinical significance of these findings.In addition, the double absorption peak observed could explain the capacity of DON to induce emesisafter oral exposure. The minimum emetic plasma concentration of DON can be reached with a rapid,high initial absorption peak.
From a biological point of view, the absence of DON in pig feces could be explained by its highabsorption in the small intestine and the greater excretion of free DON and its derivatives in urine(68%) than in feces (20%) [14,25,36]. Moreover, some bacteria belonging to the gut microbiota arealso known to play a role in the detoxification of native DON in the colon, inducing a lower amountof DON in fecal samples [37]. From an analytical point of view, the level of DON in feces could beundetectable by the method used.
It would have been advantageous to obtain a full excretion profile of DON and its metabolites(DOM-1, DON-3/15-Glucuronide and DON sulfonates) to evaluate the behavior of DON in both
5174
Toxins 2015, 7, 5167–5181
animal species and compare it in humans. This is especially important as systemic exposure does notonly relate to the absorption phase: DON metabolism could be equally important, and should thusbe taken into consideration in further experiments. A good animal model should resemble humans interms of both bioavailability and metabolic profile. From our findings, the two animal models couldbe useful in two different ways in the framework of DON risk assessment with a high-exposurescenario. On the one hand, the high bioavailability of pigs could make them a better experimentalmodel for toxicological studies than rats. On the other, the low bioavailability of rats makes them abetter model for studying the impact of DON on intestinal microbiota considering that a higher part ofthe dose ingested may remain in the intestine, as observed in rats and in human microbiota-associatedrats [33,38].
4. Experimental Section
4.1. Animals
All animal procedures were carried out in strict accordance with the recommendations of theFrench Ministry of Agriculture. The protocol was approved by ANSES’s Committee for EthicalStandards and performed in our approved animal breeding facility (Permit Number: D35-137-26).
Female Sprague-Dawley rats catheterized in the jugular vein were obtained from the breedingfacility of Janvier Labs (Saint Berthevin, France). Pelleted feed free of mycotoxin contamination(SAFE, Scientific Animal Food and Engineering, Augy, France) and water were provided adlibitum. Twenty-one catheterized rats (eight weeks old, 120–150 g¨ bw) were housed by three in apolycarbonate cage. Large White Landrace Pietrain sows were obtained from the breeding facilityof INRA, France’s national institute for agricultural research (INRA, Saint-Gilles, France). Pelletedfeed free of mycotoxin contamination (Cooperl Arc Atlantique, Vitré, France) was distributed twicedaily in two equal meals (600 g), while water was provided ad libitum. Seven pigs (26–28 kg¨ bw) werehoused individually. Animals were acclimatized for one week.
4.2. Surgery
To facilitate blood collection, the pigs were cannulated at the jugular vein. This surgerywas performed under sterile conditions. The pigs were pre-anesthetized by an intramuscularapplication of a mixture of xylazin (0.1 mL/kg¨ bw) (Rompunr 2%, 20 mg/mL, Bayer HealthCare,Monheim, Germany) and ketamin (0.1 mL/kg bw) (Imalgèner 1000, 50 mg/mL, Merial, Lyon,France). Pre-anesthetized pigs received 0.04 mL/kg¨ bw of atropine (atropine sulfate aguettantr,1 mg/mL, Aguettant, Lyon, France) subcutaneously. Endotracheal intubation was performed andthe tube (2 mm diameter) was then connected to a large animal anesthetic circle system equippedwith a mechanical ventilator (Parker Hannifin, Contamine-sur-Arve, France). The anesthesia wasmaintained by administration of isofluran (Aerraner, Baxter S.A., Maurepas, France) in pure oxygen(2 L/min) during surgery. Two sterile catheters purchased from VWR (Strasbourg, France) wereused for cannulation of the jugular vein. One was for collecting blood samples (1.02 mm ˆ 2.16 mm,80 cm, No. 28-0148) and the other for administering DON (0.76 mm ˆ 1.65 mm, 80 cm, No. 28-0147).The catheters were fixed with ligatures in the jugular vein and tunneled subcutaneously, exteriorizeddorsally in the neck and fixed at the skin. A heparinized physiological saline solution (B. BraunAvitumr, Gradignan, France) was used to maintain catheter patency. Animals were allowed torecover for at least three days before the kinetic study was initiated.
4.3. Chemicals, Products, and Reagents
Deoxynivalenol was purchased from Sigma-Aldrich (Saint-Quentin Fallavier, France) anddissolved in acetonitrile HPLC grade (Sigma-Aldrich) at 1 mg/mL. This solution was stored for amaximum of one year at ´18 ˝C according to the manufacturer’s instructions. The administrationsolutions used in the kinetic studies were diluted in physiological saline solution (B. Braun Avitum)
5175
Toxins 2015, 7, 5167–5181
on the day of the experiment. Methanol (analytical reagent grade) was purchased from FisherScientific (Illkirch, France). Oasisr HLB 30 mg and Sep-Pakr C18 100 mg cartridges were obtainedfrom Waters (St Quentin-en-Yvelines, France). Mycosep 227 Trich + columns were purchased fromRomer Labsr Diagnostic (Tulln, Austria). The Millex-HV syringe filter, PVDF, 0.45 µm came fromMillipore (Molsheim, France).
4.4. Study Design
4.4.1. Pigs
The animal experiments were performed as per a two-way cross-over design. DON solutionswere administered at 100 µg/kg¨ bw intravenously (IV) or orally (PO). Four animals were given anoral bolus and three received the mycotoxin intravenously. After a wash-out period of one week,animals that had previously been given an oral DON bolus received an intravenous bolus and viceversa. Blood samples were collected from each pig before then at 1 min, 2 min, 4 min, 8 min,15 min, 30 min, 1 h, 2 h, 3 h, 4 h, 6 h, 8 h, 10 h, and 24 h after IV administration; and before thenat 5 min, 10 min, 15 min, 30 min, 1 h, 2 h, 3 h, 4 h, 6 h, 10 h, and 24 h after oral administrationin heparinized tubes (10 UI of heparin per mL). In order to evaluate the accumulation of DON,subchronic DON exposure (100 µg/kg¨ bw) was performed with DON-contaminated diets for threedays. Blood samples were collected from each pig on day 1 before and at 5 min, 15 min, 30 min, 1 h,2 h, 3 h, 4 h, 6 h, 10 h, 24 h; on day 2 at 15 min, 1 h, 2 h, 4 h, 6 h, 24 h; and on day 3 at 15 min, 1 h,2 h, 3 h, 4 h, 6 h, 10 h, 24 h, and 48 h after administration. Individual fecal samples were collected 6 hafter DON administration every day for three days and stored at ´20 ˝C until analysis.
The blood samples (approximately 5 mL) collected were centrifuged (3000ˆ g for 10 min) andthe plasma stored at ´20 ˝C until analysis.
4.4.2. Rats
As a smaller amount of blood can be collected from rodents than pigs, the kinetic study wascarried out according to a sparse sampling protocol, in which each rat was sampled only once perroute of administration. Three animals were sampled per time point. A solution of DON wasadministered at the dose of 100 µg/kg bw intravenously (IV) and orally (PO) after a wash-out periodof one week. Blood samples were collected at 0 min, 1 min, 4 min, 8 min, 30 min, 1 h, 3 h, 6 hafter IV administration, and at 0 min, 10 min, 30 min, 1 h, 2 h, 3 h, 6 h after oral administrationin heparinized tubes (10 UI of heparin per mL). The blood samples (approximately 1 mL) collectedwere centrifuged (3000ˆ g for 10 min) and the plasma stored at ´20 ˝C until analysis. Individualrectal fecal samples were collected at 6 h and 24 h after DON administration. Samples were stored at´20 ˝C until analysis.
4.5. Determination of DON Concentration
4.5.1. Plasma Analysis
Plasma samples were analyzed for DON by an in-house high-performance liquidchromatography (HPLC) method with ultraviolet detection (UV).
Sample Preparation
For pig plasma, 0.5 mL of sample was directly applied on an SPE Oasisr HLB cartridge.The column was washed once with 1 mL of water, then once with 0.5 mL of water/methanol(80/20, v/v). Once the cartridge was dried, DON was eluted using 0.5 mL of acetonitrile. The eluatewas evaporated using a gentle nitrogen (N2) stream (~45 ˝C). The dry residue was reconstituted in0.25 mL of ultra-pure water (Milli-Q system, Millipore, Molsheim, France).
5176
Toxins 2015, 7, 5167–5181
For rat plasma, proteins were first precipitated by adding two volumes of a water/methanolmixture (80/20, v/v) to one volume of plasma. The samples were stored for 15 min at +4 ˝C, followedby a centrifugation step (3000ˆ g for 10 min). The supernatant was then applied to an SPE cartridgeand prepared as described previously for pig plasma.
After vortex mixing, samples were transferred to autosampler vials and injected into theHPLC instrument.
Chromatography Conditions
The HPLC system consisted of an Agilent Technologies series 1100 (Les Ulis, France), equippedwith a diode array detector. Chromatographic separation was performed on a Lichrospherr 100RP-18 endcapped (5 µm) column (125ˆ 4 mm) (Merck Millipore, Molsheim, France) with detectionset at 219 nm. The mobile phase consisted of a linear gradient of water (A) and acetonitrile (B). Theproportion of B was increased from 2% (0 min) to 15% (3 min), kept steady for 7.5 min, then thecolumn was re-equilibrated for 5 min under initial conditions. All separations were carried out at25 ˝C with a flow rate of 0.8 mL/min.
4.5.2. Fecal Analysis
HPLC-UV was insufficient to detect and quantify DON in feces, so fecal samples were furtheranalyzed by a liquid chromatography-tandem mass spectrometry (LC-MS/MS) method adaptedfrom laboratory LDA 22 (Ploufragan, France).
Sample Preparation
For pig feces, DON was extracted by adding 1 mL of water and 8.4 mL of acetonitrile to 1 g ofsample. After stirring (15 min) and centrifugation (5000ˆ g for 10 min), the supernatant was purifiedwith a Mycosep column according to the manufacturer’s instructions, then 2 mL was evaporatedunder a nitrogen stream (~45 ˝C). Dry residue was reconstituted in 0.2 mL of ultra-pure water andfiltered with a Millexr unit (Merck Millipore) before being injected into the LC instrument.
For rat feces, 5 mL of water was added to 0.5 g of sample. After stirring (15 min) andcentrifugation (20,000ˆ g for 10 min), the supernatant was purified using a C18 Sep-Pack cartridge.After washing with 2 mL of water, DON was eluted with 1 mL of acetonitrile. The residue wasevaporated under a nitrogen stream, then dissolved in 0.2 mL of water and filtered with a Millexr
unit before being injected into the LC instrument. A volume of 100 µL of sample was injected into thechromatography system.
Chromatography Conditions
Liquid chromatography was performed using an Ultimate 3000 LC (Thermo Fisher Scientific,Villebon-sur-Yvette, France). DON was separated using a Zorbax Eclipse XDB C8 column(150ˆ 2 mm, 5 µm particle size) at a flow rate of 0.2 mL/min. A volume of 10 µL was injected.The mobile phase consisted of a linear gradient of acetic acid 0.1% and acetonitrile. The proportionof acetonitrile increased from 2% (0 min) to 50% (5 min), and then the column was re-equilibrated for5 min under initial conditions. The retention time of the analyte was 4.9 min.
The HPLC system was coupled to a Triple Stage Quadrupole (TSQ) Vantage massspectrometer (Thermo Scientific) with the electrospray ionization (ESI) source set to negative mode.Two SRM transitions (m/z) were monitored for DON i.e., m/z [M + CH3COO]-: 355.0 > 295.1 and355.0 > 265.1. The following settings were used: ion spray voltage 3500 V, collision energy 10 eV,vaporizer temperature 300 ˝C, tube lens voltage at 60 V, sheath and auxiliary gas pressure 40 and35 psi, respectively. The XCalibur v2.1 software (Thermo Scientific) was used for system control anddata processing.
5177
Toxins 2015, 7, 5167–5181
4.5.3. In-House Method Validation
Validation studies were performed using calibration curves and matrix-matched validationsamples. For pigs, five levels of concentration were used, repeated three times and for three runsi.e., a total number of 45 spiked samples. For rats, four levels of concentration were used, repeatedthree times and for two runs i.e., a total number of 24 spiked samples. Methods were validated usingan approach based on accuracy profiles, composed of trueness and precision. The validation datawere processed by e-noval v3 (Arlenda, Liege, Belgium).
For plasma, trueness was expressed in terms of recovery and the method’s mean recovery was90.5% in pigs and 97.9% in rats. Precision was evaluated by repeatability and intermediate precisionat each concentration level. Repeatability and intermediate precision values were acceptable fortoxicokinetic studies since they lay between 3.3% and 7.6% for pig plasma and between 1.8% and11.1% for rat plasma.
The dosage range to determine the upper and lower limits of quantification went from 5 to250 ng/mL for pig plasma and from 5 to 100 ng/mL for rat plasma. DON limits of quantification(LOQs) were established at 6.7–247.5 ng/mL and 5.2–99 ng/mL in pig and rat plasma, respectively.
For pig feces, the dosage range used went from 10 to 500 ng/g and defined the lowest andhighest LOQs. The method’s mean recovery was 97.92% and 88.75% for mass transition 1 (295) and2 (265), respectively. Repeatability and intermediate precision values lay between 2.0% and 5.4% fortransition 1% and 0.7% and 3.8% for transition 2.
For rat feces, it was not possible to validate the method because precision was unacceptable.
4.6. Kinetic Analysis
For all the studies involved, concentrations under the LOQ were not retained for calculations.Both compartmental and non-compartmental approaches were used to determine the kineticparameters. All plasma concentration vs. time curve analyses were performed with PhoenixWinNonlin 6.3 software (Certara, Saint Louis, MO, USA).
4.6.1. Compartmental Analysis
For pigs, two- and three-compartment models were tested for the intravenous route, whereasone- and two-compartment models (with and without a lag time) were compared for oraladministration. Models were compared and evaluated by application of Akaike’s InformationCriterion [20].
4.6.2. Non-Compartmental Analysis (NCA)
The total area under the plasma vs. time curve (AUC) for DON was determined using thelinear trapezoidal rule with extrapolation to infinity. Extrapolation AUCplast´INFq was based on thefollowing equation:
AUCplast´INFq “Clastλz
(3)
where Clast is the last quantifiable plasma concentration and λz the slope of the terminal phase. Theterminal slope was estimated from the linear part of the terminal phase by at least three points andwas accepted with a coefficient of determination (r2 > 0.95). The Mean Residence Time (MRT) wascalculated using the linear trapezoidal rule between 0 and Clast or with extrapolation to infinity.Clearance and Vss i.e., the volume of distribution at steady state, were also estimated.
For oral administration (po), the observed maximum concentration (Cmax) and thecorresponding time (tmax) were obtained from the concentration vs. time profile and compared to
5178
Toxins 2015, 7, 5167–5181
those obtained from compartmental analysis. The bioavailability factor was defined according to theformula below:
F “pAUCqp.o. ˆ pDoseqi.v.
pAUCqi.v. ˆ pDoseqp.o.ˆ 100 (4)
where AUCp.o. or i.v. represents the area under concentration vs. time curve 0 to the last quantifiableconcentration (AUClast) or 0 to infinity (AUCINF) after oral or intravenous administration of DON.Dosep.o. or i.v. represents the actual dose administered by oral or intravenous routes.
For rats, sparse data analysis was chosen because we only had one point per animal and threeanimals per time point. In this kind of study, it was not possible to distinguish inter-individual fromintra-individual variability, and consequently the present analysis focused on mean parameters andnot on inter-individual variability.
4.6.3. Deconvolution Analysis
To assess absolute bioavailability and the in vivo input rate of DON, we undertook deconvolutionanalysis. This tool has been widely used to assess the gastrointestinal absorption of prodrugs inpigs [39] or the secretory profile of hormones [40]. Briefly, deconvolution gives an estimation of thedrug input rate over time using the unit impulse response function (UIR) by a convolution equation:
c ptq “ż t
0f pt´ uq cB puq du ” f ptq ˚ cB ptq (5)
where * denotes the convolution operator, f (t) is the UIR i.e., the disposition function and cδ(t) thedrug input rate.
By deconvolving c(t) with f (t), an in vivo DON input rate can be determined. The dispositionfunction was obtained from the toxicokinetic parameters of DON after IV administration.
4.7. Statistical Analysis
Toxicokinetic parameters are expressed as an arithmetic mean and its standard deviation, exceptfor half-lives where harmonic mean and its standard deviation were calculated [32]. The toxicokineticparameters of rats and pigs (AUC, Cmax) were compared after IV and oral administration by a t testor a non-parametric test (Mann-Whitney test) when the variance was not homogeneous. For pigs,the elimination half-life obtained after IV and oral administration was also compared by a t test. Forbioavailability obtained from compartmental, non-compartmental, and deconvolution approaches,a Levene’s test was used to verify the homogeneity of variance followed by a one-way ANOVA.A level of significance of 0.05 was retained. All statistical analyses were carried out using SYSTATv13 software (Systat Software, Chicago, IL, USA).
5. Conclusions
In this work, by using deconvolution analysis to assess the absolute bioavailability of DON,we were able to provide more reliable and recent data on this important kinetic parameter.We also showed important differences between pigs and rats that should be taken into account forrisk assessment.
Acknowledgments: This study was supported by a research grant from ANSES (French agency for Food,Environmental and Occupational Health & Safety).
Author Contributions: Manuel Jimmy Saint-Cyr, Agnès Perrin-Guyomard and Michel Laurentie conceivedand designed the experiments. Manuel Jimmy Saint-Cyr, Agnès Perrin-Guyomard, Jacqueline Manceau,Jean-Guy Rolland and Michel Laurentie performed the experiments. Manuel Jimmy Saint-Cyr andMichel Laurentie analyzed the data. Jacqueline Manceau, Paméla Houée, Jean-Michel Delmas andJean-Guy Rolland contributed reagents/materials/analysis tools. Manuel Jimmy Saint-Cyr, AgnèsPerrin-Guyomard and Michel Laurentie wrote the paper.
Conflicts of Interest: The authors declare no conflict of interest.
5179
Toxins 2015, 7, 5167–5181
References
1. EFSA. Deoxynivalenol in food and feed: Occurrence and exposure. EFSA J. 2013, 11, 3379–3435.2. Bhat, R.; Ramakrishna, Y.; Beedu, S.; Munshi, K. Outbreak of trichothecene mycotoxicosis associated
with consumption of mould-damaged wheat products in Kashmir valley, India. Lancet 1989, 333, 35–37.[CrossRef]
3. Luo, X. Outbreaks of moldy cereals poisoning in China. In Issues Food Safety; Toxicology Forum: Reston,VA, USA, 1988; pp. 56–63.
4. Ramakrishna, Y.; Bhat, R.; Ravindranath, V. Production of deoxynivalenol by fusarium isolates fromsamples of wheat associated with a human mycotoxicosis outbreak and from sorghum cultivars.Appl. Environ. Microbiol. 1989, 55, 2619–2620. [PubMed]
5. Pestka, J.J. Deoxynivalenol: Toxicity, mechanisms and animal health risks. Anim. Feed Sci. Technol. 2007,137, 283–298. [CrossRef]
6. Le Hegarat, L.; Takakura, N.; Simar, S.; Nesslany, F.; Fessard, V. Investigation of the genotoxicityof the mycotoxins nivalenol and deoxynivalenol through a multiendpoint assay in mouse combiningmicronucleus and comet assays in multiple organs and Pig-A assay. Toxicol. Lett. 2015, 238. [CrossRef]
7. Takakura, N.; Nesslany, F.; Fessard, V.; le Hegarat, L. Absence of in vitro genotoxicity potential of themycotoxin deoxynivalenol in bacteria and in human TK6 and HepaRG cell lines. Food Chem. Toxicol. 2014,66, 113–121. [CrossRef] [PubMed]
8. Maresca, M. From the gut to the brain: Journey and pathophysiological effects of the food-associatedtrichothecene mycotoxin deoxynivalenol. Toxins 2013, 5, 784–820. [CrossRef] [PubMed]
9. Pestka, J.J. Deoxynivalenol: Mechanisms of action, human exposure, and toxicological relevance. Arch.Toxicol. 2010, 84, 663–679. [CrossRef] [PubMed]
10. Gratz, S.W.; Richardson, A.J.; Duncan, G.; Holtrop, G. Annual variation of dietary deoxynivalenol exposureduring years of different fusarium prevalence: A pilot biomonitoring study. Food Addit. Contam. 2014, 31,1579–1585. [CrossRef] [PubMed]
11. Nagl, V.; Schatzmayr, G. Deoxynivalenol and its masked forms in food and feed. Curr. Opin. Food Sci. 2015,5, 43–49. [CrossRef]
12. Richard, J.; Payne, G.; Desjardins, A.; Maragos, C.; Norred, W.; Pestka, J. Mycotoxins: Risks in plant, animaland human systems. CAST Task Force Rep. 2003, 139, 101–103.
13. Iverson, F.; Armstrong, C.; Nera, E.; Truelove, J.; Fernie, S.; Scott, P.; Stapley, R.; Hayward, S.; Gunner, S.Chronic feeding study of deoxynivalenol in B6C3F1 male and female mice. Teratog. Carcinog. Mutag. 1995,15, 283–306. [CrossRef]
14. Goyarts, T.; Dänicke, S. Bioavailability of the fusarium toxin deoxynivalenol (DON) from naturallycontaminated wheat for the pig. Toxicol. Lett. 2006, 163, 171–182. [CrossRef] [PubMed]
15. Osselaere, A.; Devreese, M.; Goossens, J.; Vandenbroucke, V.; de Baere, S.; de Backer, P.; Croubels, S.Toxicokinetic study and absolute oral bioavailability of deoxynivalenol, T-2 toxin and zearalenone in broilerchickens. Food Chem. Toxicol. 2013, 51, 350–355. [CrossRef] [PubMed]
16. Prelusky, D.; Hartin, K.; Trenholm, H. Distribution of deoxynivalenol in cerebral spinal fluid followingadministration to swine and sheep 1. J. Environ. Sci. Health Part B 1990, 25, 395–413. [CrossRef] [PubMed]
17. Prelusky, D.; Hartin, K.; Trenholm, H.; Miller, J. Pharmacokinetic fate of 14C-labeled deoxynivalenol inswine. Toxicol. Sci. 1988, 10, 276–286. [CrossRef]
18. Prelusky, D.; Veira, D.; Trenholm, H. Plasma pharmacokinetics of the mycotoxin deoxynivalenol followingoral and intravenous administration to sheep. J. Environ. Sci. Health Part B 1985, 20, 603–624. [CrossRef][PubMed]
19. Pestka, J.J.; Islam, Z.; Amuzie, C.J. Immunochemical assessment of deoxynivalenol tissue distributionfollowing oral exposure in the mouse. Toxicol. Lett. 2008, 178, 83–87. [CrossRef] [PubMed]
20. Yamaoka, K.; Nakagawa, T.; Uno, T. Application of akaike’s information criterion (AIC) in the evaluationof linear pharmacokinetic equations. J. Pharm. Biopharm. 1978, 6, 165–175. [CrossRef]
21. Toutain, P.-L.; Bousquet-Mélou, A. Plasma clearance. J. Vet. Pharmacol. Ther. 2004, 27, 415–425. [CrossRef][PubMed]
22. Toutain, P.-L.; Bousquet-Mélou, A. Bioavailability and its assessment. J. Vet. Pharmacol. Ther. 2004, 27,455–466. [CrossRef] [PubMed]
5180

Toxins 2015, 7, 5167–5181
23. Pestka, J.; Lin, W.-S.; Miller, E. Emetic activity of the trichothecene 15-acetyldeoxynivalenol in swine.Food Chem. Toxicol. 1987, 25, 855–858. [CrossRef]
24. Prelusky, D.B.; Trenholm, H.L. The efficacy of various classes of anti-emetics in preventingdeoxynivalenol-induced vomiting in swine. Nat. Toxins 1993, 1, 296–302. [CrossRef] [PubMed]
25. Dänicke, S.; Valenta, H.; Döll, S. On the toxicokinetics and the metabolism of deoxynivalenol (DON) in thepig. Arch. Anim. Nutr. 2004, 58, 169–180. [CrossRef] [PubMed]
26. Warth, B.; Sulyok, M.; Berthiller, F.; Schuhmacher, R.; Krska, R. New insights into the human metabolismof the fusarium mycotoxins deoxynivalenol and zearalenone. Toxicol. Lett. 2013, 220, 88–94. [CrossRef][PubMed]
27. Eriksen, G.S.; Pettersson, H.; Lindberg, J. Absorption, metabolism and excretion of 3-acetyl DON in pigs.Arch. Anim. Nutr. 2003, 57, 335–345. [CrossRef]
28. Eriksen, G.S.; Pettersson, H.; Lundh, T. Comparative cytotoxicity of deoxynivalenol, nivalenol, theiracetylated derivatives and de-epoxy metabolites. Food Chem. Toxicol. 2004, 42, 619–624. [CrossRef][PubMed]
29. Wu, X.; Murphy, P.; Cunnick, J.; Hendrich, S. Synthesis and characterization of deoxynivalenol glucuronide:Its comparative immunotoxicity with deoxynivalenol. Food Chem. Toxicol. 2007, 45, 1846–1855. [CrossRef][PubMed]
30. Nagl, V.; Schwartz, H.; Krska, R.; Moll, W.-D.; Knasmüller, S.; Ritzmann, M.; Adam, G.; Berthiller, F.Metabolism of the masked mycotoxin deoxynivalenol-3-glucoside in rats. Toxicol. Lett. 2012, 213, 367–373.[CrossRef] [PubMed]
31. Maul, R.; Warth, B.; Schebb, N.H.; Krska, R.; Koch, M.; Sulyok, M. In vitro glucuronidation kinetics ofdeoxynivalenol by human and animal microsomes and recombinant human UGT enzymes. Arch. Toxicol.2014, 89, 949–960. [CrossRef] [PubMed]
32. Lam, F.C.; Hung, C.T.; Perrier, D.G. Estimation of variance for harmonic mean half-lives. J. Pharm. Sci. 1985,74, 229–231. [CrossRef] [PubMed]
33. Saint-Cyr, M.J.; Perrin-Guyomard, A.; Houée, P.; Rolland, J.-G.; Laurentie, M. Evaluation of an oralsubchronic exposure of deoxynivalenol on the composition of human gut microbiota in a model of humanmicrobiota-associated rats. PLoS ONE 2013, 8. [CrossRef] [PubMed]
34. Waché, Y.J.; Valat, C.; Postollec, G.; Bougeard, S.; Burel, C.; Oswald, I.P.; Fravalo, P. Impact of deoxynivalenolon the intestinal microflora of pigs. Int. J. Mol. Sci. 2008, 10, 1–17. [CrossRef] [PubMed]
35. Schwartz-Zimmermann, H.E.; Hametner, C.; Nagl, V.; Slavik, V.; Moll, W.-D.; Berthiller, F. Deoxynivalenol(DON) sulfonates as major DON metabolites in rats: From identification to biomarker methoddevelopment, validation and application. Anal. Bioanal. Chem. 2014, 406, 7911–7924. [CrossRef] [PubMed]
36. Dänicke, S.; Goyarts, T.; Valenta, H.; Razzazi, E.; Bohm, J. On the effects of deoxynivalenol (DON) in pig feedon growth performance, nutrients utilization and DON metabolism. J. Anim. Feed Sci. 2004, 13, 539–556.
37. Kollarczik, B.; Gareis, M.; Hanelt, M. In vitro transformation of the fusarium mycotoxins deoxynivalenoland zearalenone by the normal gut microflora of pigs. Nat. Toxins 1994, 2, 105–110. [CrossRef] [PubMed]
38. Lake, B.; Phillips, J.; Walters, D.; Bayley, D.; Cook, M.; Thomas, L.; Gilbert, J.; Startin, J.; Baldwin, N.;Bycroft, B. Studies on the metabolism of deoxynivalenol in the rat. Food Chem. Toxicol. 1987, 25, 589–592.[CrossRef]
39. Larsen, F.; Jensen, B.H.; Olesen, H.P.; Larsen, C. Multiple oral administration of a ketoprofen-dextran esterprodrug in pigs: Assessment of gastrointestinal unavailability by deconvolution. Pharm. Res. 1992, 9,915–919. [CrossRef] [PubMed]
40. Laurentie, M.-P.; Garcia-Villar, R.; Toutain, P.-L.; Pelletier, J. Pulsatile secretion of LH in the ram:A re-evaluation using a discrete deconvolution analysis. J. Endocrinol. 1992, 133, 75–85. [CrossRef][PubMed]
© 2015 by the authors; licensee MDPI, Basel, Switzerland. This article is an openaccess article distributed under the terms and conditions of the Creative Commons byAttribution (CC-BY) license (http://creativecommons.org/licenses/by/4.0/).
5181