Embed Size (px)
Citation preview

Risk Assessment Codes: Problem or Solution? Tom Pfi'er

T-‐‑14-‐‑00100 | 2
“I abhor the use of RACs and even worse, the misuse of RACs. But until we come up with something beIer, it is the best thing we have.” ~ Pat Clemens Systems Safety Society Convention, 2006
» It is time for us to move to beIer tools.
Summary

T-‐‑14-‐‑00100 | 3
Guidance in Developing Mishap Risk Assessment Matrices All systems have unique risks. A mishap risk assessment matrix will be used to characterize these risks. A pre-‐‑existing matrix may be used or a uniquely tailored matrix may be developed. In developing and tailoring the risk matrix, these elements must be considered: a. Tailor mishap risk assessment matrices to each system or class of
systems based on the expected range of severity of potential mishaps and the range of probability or frequency of these mishaps.
b. Orient the severity and probability (or frequency) axes so that one axis increases upward and the other increases to the right in accordance with the Cartesian coordinate system.
c. Use logarithmic scales on each axis with logical and proportional ranges for mishap severity categories and mishap probability categories.
d. Assign the four levels of risk acceptance authority (high, serious, medium, low) to each cell of the matrix.
Desired Features of RAC

T-‐‑14-‐‑00100 | 4
What Do RACs Do?
PURPOSES » Classify individual hazard into predefined bins by severity and probability.
» Define thresholds for risk acceptance. » Education: communicate risk concept and expected risks from individual hazards.

T-‐‑14-‐‑00100 | 5
Purpose 1 Classify Hazards by Severity and Probability
PRO » Helps point toward needed mitigations
» Educational
CON » Highly subjective » Highly granular (typical range of risk is factor of 100 – 10,000)
» Hazards can be defined in a way to alter the classification

T-‐‑14-‐‑00100 | 6
Purpose 2 Define Risk Acceptance Thresholds for Individual Hazards
PRO » Somewhat educational (gives decision maker notion of risk)
» Gives agency evidence of informed decision process
CON » Does not consider correct metric (total risk)
» Highly granular (typical range is factor of 100 – 10,000 in risk)
» Thresholds move in directions of probability or severity, not risk

T-‐‑14-‐‑00100 | 7
Purpose 3 Education
PRO » Identifies and categorizes components of risk
» Some use Cartesian Coordinates
» Gives notion of individual risk level
CON » Very granular » Does not focus on risk » Does not address how safe is safe enough
» One size does not fit all
T-‐‑14-‐‑00100 | 8
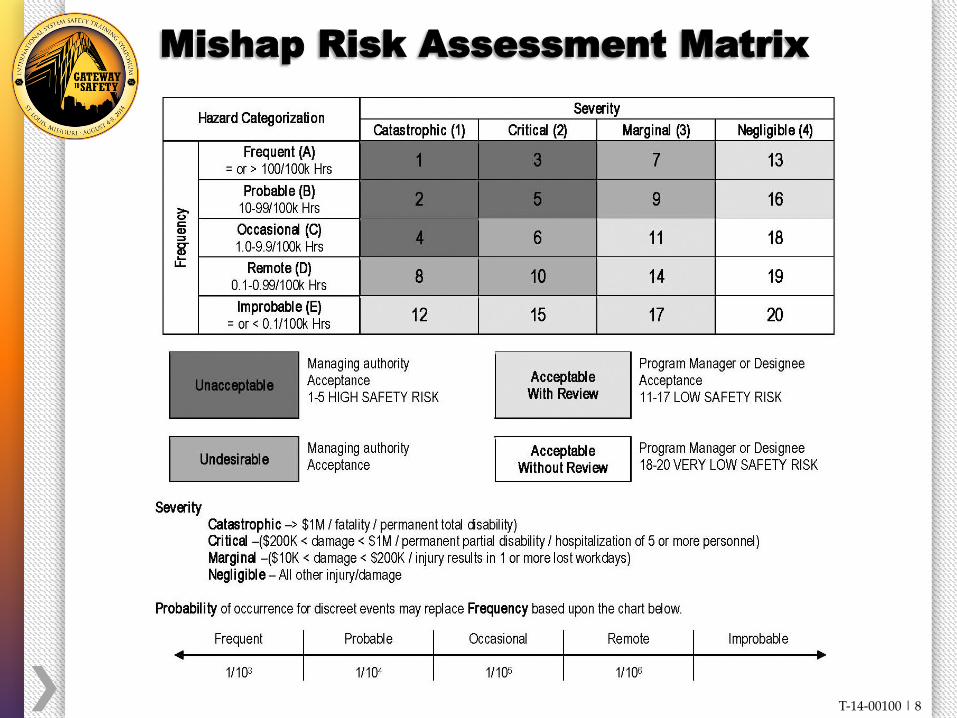
Mishap Risk Assessment Matrix

T-‐‑14-‐‑00100 | 9
Generic Subjective Mishap Risk Assessment Matrix
Desirable Features • Impossible Category • Cartesian Coordinates • Qualitative

T-‐‑14-‐‑00100 | 10
Multi-Purpose Aircraft Family Mishap Risk Assessment Matrix
Desirable Features • Multiple Systems • Log Scales
• Cartesian Coordinates • Quantitative

T-‐‑14-‐‑00100 | 11
Single Order of Magnitude Resolution Mishap Risk Assessment Matrix
Desirable Features • Cartesian Coordinates • Order of Magnitude Steps (log scale)
• Multiple Measures • Quantitative

T-‐‑14-‐‑00100 | 12
Half Order of Magnitude Resolution Mishap Risk Assessment Matrix
Desirable Features • Multiple Measures • Log Scale (1/2 Order of Magnitude)
• Cartesian Coordinates • Requires Calculations

T-‐‑14-‐‑00100 | 13
Total System Risk Assessment Criteria
Desirable Features • Requires Calculations • Risk is Measure • Cartesian Coordinates

T-‐‑14-‐‑00100 | 14
Estimating Total System Risk is Easy
» A conservative estimate can be defined by simple addition. » In most cases, hazards can be defined to combine dependent hazards as a single hazard, thus eliminating dependencies.
» Detailed methodology is contained in the Risk Summing Guidebook.
Hazard Name Undesired Consequence Probability Risk (r) Reduction
Action Final Risk (r)
1
2
3
n
Total System Risk (R)

T-‐‑14-‐‑00100 | 15
IDEA #6: Total system risk is the preferred metric
n321
ni
1iiT rrrrrR ++++=≈ ∑
=
=
…
where: RT = Total Risk
)ps (rAMR i
ni
1iii
ni
1ii
ni
1iiS ×=≈ ∑∑∑
=
=
=
=
=
=
where: RT = Total Risk si = Hazard Severity for the ith identified hazard pi = Hazard Probability for the ith identified hazard ri = Risk posed by the ith identified hazard Ai = Identity of the ith asset under threat Mi = The ith system Mission or Operational Phase under
consideration RS = Total System Risk = the risk of all hazards, for all life cycle
phases for all elements in our system
r2
r1
r3
r4
r5
rn
r1 Total Elimination Cost:
$22,000
r4 Intolerable Risk Elimination Cost:
$437,000
CCT1-02002
r = Partial risk = Hazard Severity × Hazard Probability
Notional

T-‐‑14-‐‑00100 | 16
URS for Total System Risk for US Populations – Transportation Systems
106
100
10-6
105
104
103
102
101
10-1
10-2
10-3
10-4
10-5
◄ All Automotive ◄ All Aircraft
◄ All Rail System ◄ All Rotary Wing
◄ All Watercraft ◄ All Fixed Wing Aircraft
◄ All Motorcycles ◄ Unmanned Aircraft ◄ All Bicycles
Annual Risk of Fatality
Total Annual System ► Risk of This System
All Systems, Multiple Types with Multiple Units
◄ All Automotive ◄ All Aircraft
◄ All Rail System ◄ All Rotary Wing
◄ All Watercraft ◄ All Fixed Wing Aircraft
◄ All Motorcycles ◄ Unmanned Aircraft ◄ All Bicycles
One System Type, All Units
◄ All Automotive ◄ All Aircraft
◄ All Rail System ◄ All Rotary Wing
◄ All Watercraft ◄ All Fixed Wing Aircraft
◄ All Motorcycles ◄ Unmanned Aircraft ◄ All Bicycles
One Unit
Historical Accident Data

T-‐‑14-‐‑00100 | 17
IDEA #8: Total System Risks are comparable to many other types of risk
Human Injury/ Illness Environmental Damage
Cost to Repair /Recover
Schedule Delays
Mission Damage
Adverse Program Publicity
Multiple Deaths > 30 > $100M or Clean-up Recovery Unachievable
> $100M or Recovery Not Possible
Factor of 100 Overrun
All Major Goals Aborted
> $100M or Irreparable Harm
Multiple Serious Injuries/Illnesses > 10
> $30M or Clean-up Cost
> $30M Factor of 30 Overrun
Half Major Goals Aborted
> $30M to Repair
Permanent Total Disability
> $10M or Clean-up Cost
> $10M Factor of 10 Overrun
> One Major Goal Aborted
> $10M to Repair
Permanent Partial Disability
> $3M or Clean-up Cost
> $3M Factor of 3 Overrun
One Major Goal Aborted
> $3M to Repair
Protracted Hospitalization > 3 wks
> $1M or Clean-up Cost
> $1M > 100% Overrun
All Minor Goals Aborted
> $1M to Repair
> 5 Man Weeks Lost Time
> $300K or Clean-up Cost
> $300K > 30% Overrun
Half Major Goals Aborted
> $300K to Repair
> 1 Man Week Lost Time
> $100K or Clean-up Cost
> $100K > 10% Overrun
> One Minor Goal Aborted
> $100K to Repair
OSHA Recordable Injury/Illness
> $30K or Clean-up Cost
> $30K > 3% Overrun
One Minor Goal Aborted
> $30K to Repair
Nuisance Contusion/Abrasion
> $10K or Clean-up Cost
> $10K > 1% Overrun
Some Goals Crippled
> $10K to Repair
None None None None None None
2009

T-‐‑14-‐‑00100 | 18
“I abhor the use of RACs and even worse, the misuse of RACs. But until we come up with something beIer, it is the best thing we have.” ~ Pat Clemens Systems Safety Society Convention, 2006
» It is time for us to move to beIer tools.
Summary