Embed Size (px)
Citation preview
Risk assessment Belgium
After regulation No 994/2010 of the European Parliament and of the
Council of 20 October 2010 concerning measures to safeguard security
of gas supply
June 2014
FPS Economy, S.M.E.s, Self-Employed and Energy
North Gate III, Koning Albert II-laan 16
1000 Brussels
September 14
Risk assessment Belgium 2
Table of content
Executive Summary ...................................................................................................................... 5
Introduction ................................................................................................................................. 8
Structure of the risk assessment .................................................................................................. 9
1. Establishing the context: Components of the Belgian gas system ......................................... 10
1.1. INTRODUCTION ................................................................................................................ 10
1.2. INSTITUTIONAL CONTEXT ................................................................................................... 10
1.2.1. THE COMPETENCES ON FEDERAL AND REGIONAL LEVEL ............................................................. 10
1.2.2. LEGAL ARRANGEMENTS FOR SECURITY OF GAS SUPPLY .............................................................. 11
1.2.2.1. Main legal framework ............................................................................................... 11
1.2.2.2. Specific legislation related to public service obligations (PSOs) ............................... 12
1.2.2.3. Other legislations related to security of gas supply .................................................. 13
1.2.3. INTERGOVERNMENTAL AGREEMENTS ..................................................................................... 14
1.2.4. MARKET LIBERALISATION IN BELGIUM ................................................................................... 15
1.2.5. THE BELGIAN WHOLESALE AND RETAIL MARKET ....................................................................... 17
1.3. REGIONAL CONTEXT .......................................................................................................... 18
1.3.1. BELGIUM IN THE NORTH-WEST GAS REGION .......................................................................... 18
1.3.2. GAS REGIONAL INITIATIVE .................................................................................................... 18
1.3.3. GAS PLATFORM ................................................................................................................. 18
1.3.4. L-GAS MARKET .................................................................................................................. 19
1.4. SUPPLY AND DEMAND ....................................................................................................... 20
1.4.1. SUPPLY ............................................................................................................................ 20
1.4.1.1. Current and projected gas supply ............................................................................. 20
1.4.1.2. Gas imports ............................................................................................................... 21
1.4.1.3. Supply routes ............................................................................................................ 23
1.4.1.4. Entry-exit model........................................................................................................ 24
1.4.2. DEMAND .......................................................................................................................... 25
1.4.2.1. Evolution of the yearly gas demand ......................................................................... 26
1.4.2.2. Monthly gas demand & seasonality .......................................................................... 29
1.4.2.3. Peak day demand vs. average day demand .............................................................. 31
1.4.2.4. Interruptible & protected customers ....................................................................... 38
1.4.2.5. Fuel switching ........................................................................................................... 41
1.4.3. CASE: COLD WAVE 2012 .................................................................................................... 42
1.4.3.1. The event .................................................................................................................. 42
1.4.3.2. Highlights of the event .............................................................................................. 42
1.5. INFRASTRUCTURE ............................................................................................................. 44
1.5.1. PIPELINES ......................................................................................................................... 44
1.5.1.1. Overview of the pipeline network ............................................................................ 44
1.5.1.2. Interconnections and reverse flow capacity ............................................................. 45
1.5.1.3. Infrastructure in the L-gas market ............................................................................ 47
1.5.2. LNG TERMINAL ................................................................................................................. 50
1.5.3. STORAGE FACILITIES ........................................................................................................... 52
1.5.4. N-1 INFRASTRUCTURE STANDARD ......................................................................................... 53
1.5.4.1. Definitions and assumptions ...................................................................................... 53
September 14
Risk assessment Belgium 3
1.5.4.2. Calculation: supply side .............................................................................................. 54
1.5.4.3. Calculation: demand side ........................................................................................... 56
1.5.4.4. Basic N-1 calculation .................................................................................................. 56
1.5.4.5. Alternative calculations .............................................................................................. 57
1.6. GAS INFRASTRUCTURE UTILIZATIONS & CONTRACTS ................................................................ 58
1.6.1. RESULTS QUESTIONNAIRE SHIPPERS ....................................................................................... 58
1.6.1.1. Contracts .................................................................................................................... 58
1.6.1.2. Infrastructure utilization ............................................................................................ 59
1.6.2. ZEEBRUGGE TRADING PLATFORM ......................................................................................... 59
2. Risk identification................................................................................................................ 61
2.1. CONTEXT & OBJECTIVE ...................................................................................................... 61
2.2. KEY PARAMETERS OF RISKS ................................................................................................. 61
2.3. QUESTION 1: “WHAT CAN HAPPEN?” .................................................................................. 61
2.3.1. TECHNICAL RISKS ............................................................................................................... 62
2.3.2. (GEO) POLITICAL RISKS ....................................................................................................... 62
2.3.3. ECONOMIC RISKS ............................................................................................................... 62
2.3.4. ENVIRONMENTAL RISKS (E.G. NATURAL HAZARDS) ................................................................... 63
2.3.5. GEOLOGICAL RISKS (PRODUCER COUNTRIES) ........................................................................... 63
2.4. QUESTION 2: “WHAT ARE THE CONSEQUENCES?” .................................................................. 63
2.5. QUESTION 3: “WHAT IS THE PROBABILITY OF ITS FUTURE OCCURRENCE?” ................................... 64
2.6. OTHER VARIABLES ............................................................................................................ 64
2.7. OVERVIEW POSSIBLE SCENARIOS & VARIABLES ....................................................................... 65
2.8. RISK EVALUATION BASED ON HISTORICAL INCIDENTS ................................................................ 66
3 Risk analysis ......................................................................................................................... 67
3.1. OBJECTIVES ..................................................................................................................... 67
3.2. SCENARIO ANALYSIS .......................................................................................................... 67
3.2.1. SCENARIO 1: LNG DISRUPTION SCENARIO .............................................................................. 67
3.2.2. SCENARIO 2: TECHNICAL INCIDENT ON ZEEPIPE ....................................................................... 71
3.2.3. SCENARIO 3: LOSS OF SUPPLY FROM THE NETHERLANDS ........................................................... 76
3.2.3.1. Short term loss of supply .......................................................................................... 76
3.2.3.2. Long term loss of supply ........................................................................................... 76
3.2.3.3. Conclusion ................................................................................................................. 77
3.2.4. SCENARIO 4: NUCLEAR PHASE OUT BELGIUM .......................................................................... 77
3.2.5. SCENARIO 5: DISRUPTION ON THE LOENHOUT STORAGE FACILITY ............................................... 82
3.2.5.1. Global context ........................................................................................................... 82
3.2.5.2. Local issues ................................................................................................................ 82
3.3. SUPPLY STANDARD ........................................................................................................... 84
4 Risk evaluation ..................................................................................................................... 95
4.1. CONCLUSION ................................................................................................................... 96
September 14
Risk assessment Belgium 4
List of figures
Figure 1: Market Shares of Natural Gas Supply Companies, 2013
Figure 2: Natural gas imports as part of the total primary energy supply in 1973 and 2012 (the
values of 2012 are the estimated values)
Figure 3: Flows natural gas into Belgium in 2013
Figure 4: HHI in national gas supply and retail markets according to the report of the energy
markets in 2011
Figure 5: Distribution of the entry volumes in 2013
Figure 6: Entry-exit model Belgium, 2012
Figure 7: Total measured yearly consumption from 2004-2013 (in TWh)
Figure 8: Total yearly consumption 2004-2013 in TWh (normalised)
Figure 9 : Yearly L-gas consumption on the distribution network in GWh (2004-2013)
Figure 10: Yearly measured industrial consumption of L- and H-gas in GWh (2004-2013)
Figure 11: Total monthly consumption 2009-2013 in GWh
Figure 12: Seasonal demand for H-gas 2009-2013 (in GWh)
Figure 13: Seasonal demand for L-gas 2009-2013 (in GWh)
Figure 14 : Correlation between DD and gas consumption
Figure 15: Relation between daily consumption and outside temperature
Figure 16: Natural gas consumption 2013 Total L+H and L and H separately (in GWh)
Figure 17: Gas consumption per sector 1973-2030 (in Mtoe)
Figure 18: Cold wave in Belgium 2012
Figure 19: Belgian transmission network operated by Fluxys
Figure 20: L-gas infrastructure in Belgium
Figure 21: Estimation of the future exploitation of the Groningen Gas Field
Figure 22: Example of gas storage to balance seasonal gas swings
Figure 23: Use of infrastructure during winter period 2013-2014
Figure 24: Evolution of traded volume on the Huberator
Figure 25: Traded quantities and physical throughput (in GWh/day)
Figure 26: Events 2012
Figure 27: Events 2013
Figure 28: LNG terminals minimum send-out under daily peak demand
Figure 29: Overview of the Norwegian pipeline network
Figure 30: Reference scenario flows from Norway
Figure 31: Flows with Franpipe out of operation
Figure 32: Electricity production per nuclear plant 1974-2008
Figure 33: Overview energy mix in Belgium (2010 and prospective analysis)
Figure 34: Evolution electricity production by renewable energy sources
Figure 35: Distribution of the generating capacity of each form of energy (2010 left , 2030
right) , scenario Nuc-1800
Figure 36: Maximum transfer to Antwerp (schematic overview)
Figure 37: Maximum transfer from Antwerp (schematic overview)
Figure 38: Natural gas consumption of L and H-gas per sector (2013)
Figure 39: Degree days corresponding to 7 day peak period during last 110 years
Figure 40: Amount of Degree days and likelihood of the degree days per winter

September 14
Risk assessment Belgium 5
Executive Summary
The updated risk-analysis Belgium 2014 does not reveal particular concerns or risks to meet
Belgian natural gas demand under normal and usual circumstances. The reasons for Belgium’s
robust natural gas system are various:
• Belgium is a crossroad for important gas flows from diverse sources and routes;
• Belgium’s gas infrastructure does not face congestion to meet national gas demand
nor to transport gas from border to border to supply neighboring countries;
• Several international supply companies with various types of supply contracts are
active in Belgium together with a list of newcomers competing with each other;
• Belgium has achieved a well-functioning gas market with wholesale gas prices
correlated and converged with gas prices in the neighboring markets;
• Belgium has a high level of market liquidity and intensive cross-border trades.
All these positive characteristics of the Belgian natural gas system provide confidence in
secure gas supplies. However, there are some issues and concerns which require proper
attention.
National Risks
Infrastructure
From the infrastructure point of view, incidents on major pipelines or interconnection points
in Belgium can be handled by the transmission system operator for a limited period without
significant impact on other sectors or end consumers. The remaining flexibility in the H-gas
system is sufficient to cope with incidents for a certain period of time. Of all the risks listed
under point 2.3., the risks most likely to occur for the Belgian gas supply are technical
incidents on the pipelines, or IT problems or (local) loss of electric power supply which can
cause very short interruptions on some of the installations. Issues with gas quality do also
occur. This could be mainly an issue for the gas transmission to the UK as the gas from Qatar
could fall slightly above the upper end of the Wobbe index for the UK, but also the industrial
clients on the Belgian gas network face sometimes technical difficulties if the gas quality (in
the Belgian Wobbe range) changes too rapidly.
At this moment, there is no physical congestion on the interconnections so shippers could (in
theory) be able to renominate gas flows if an incident occurs on one of the other border
points. As the Belgian TSO is not a supplier of last resort, the ability for the TSO to react to an
incident depends a lot on the market behaviour of the shippers and suppliers. For the market
players, it is not always evident to reallocate the flows. First of all the decisions are linked to
the existing contracts, and secondly, they need time to analyse the situation on the available
capacities (in Belgium and abroad). For L-gas the situation would be much more complicated.
As there is hardly any flexibility left in the capacity, possible incidents are much harder to cope
with during peak demand. However, as Belgium has never had only one incident on the L-gas
network since the beginning of the gas flows from the Netherlands and measures are
implemented to prevent a same incident in the future, we assume that the probability of
disruptions from the Netherlands is rather low, but we will follow the current situation of the
Groningen field very closely.
September 14
Risk assessment Belgium 6
Molecules
On the molecule side, most of the larger gas suppliers can react swiftly to an incident by
reallocating gas via other border points. Most of them have flexibility options with the gas
producers or are active on the gas hubs. However, because of the market liberalisation, the
EU wide portfolios of most of the shippers, and through the trades on the gas hubs, it is much
harder to get a comprehensive overview of the gas flows for the Belgian end consumers. This
will be important to see if the companies comply with the supply standard. In the preventive
action plan, we will look more deeply into the supply standard and decide if it needs to be
fulfilled by each shipper separately or by all shippers for Belgium as a whole1. Furthermore,
Belgium deems it necessary to upgrade the supply standard so it achieves the same level as
the infrastructure standard for the consistency of the approach.
As Belgium is an important transit country, it might be useful to take up a more regional
approach for the N-1 calculations as now there is an abstraction of transit flows. Those might
however be important for the protected customers in other countries.
Phase-out of low calorific gas (L-gas) and earthquakes in the Groningen region
Belgium is for 30% supplied by L-gas from the Netherlands. The announced production decline
of the Groningen gas field and the impacts (and remaining risks) of earthquakes in the
Groningen region, strongly impacts the Belgian L-gas market. Belgium faces challenges to
organize a transition to a fully H-gas market. Especially the transition period in which L-gas
consumers should progressively been switched to H-gas requires specific attention to security
of supply (as well as safety) issues. This transition requires a coordinated approach between
the Netherlands, Belgium and France. The threat of earthquakes provides an additional risk
component which requires a high degree of flexibility in order to cope with any accelerated
reduction of L-gas production, and consequently drop in L-gas exports, dependent on what
the Dutch government may decide.
European risks
It has to be taken into account that not only national risks have to be taken into account. In
case of possible risks in other countries of the European Union or abroad Belgium can still be
affected. It is therefore important that such risks need to be investigated and that possible
measures have to be taken into account by the European Union to avoid these risks.
EU gas market – new challenges for security of supply monitoring
The level of security of gas supply basically results from the commercial contracts between
producers, wholesalers, retailers and final consumers. Gas trading within the EU is more and more
international in which national borders disappear. The move to an internal energy market in
Europe has replaced the nations by the European market places (hubs) where gas demand meets
gas supply at a certain price level. Certainly in NW Europe (more than 55% of the EU
consumption) where market integration, price convergence and correlation are almost perfect,
are the markets the places where gas flows are attracted and sourced from diverse routes to meet
demand. Furthermore, these markets and supply/demand portfolio are internationally organized.
In this environment it is not possible anymore to discuss in a straightforward manner
1 The last option might create free riding amongst the suppliers.
September 14
Risk assessment Belgium 7
supply/demand on a national level in terms of gas sources used or the role of “national” UGS
facilities. Market liquidity is no pure matter anymore of local supplies or local UGS or local LNG
terminals etc. but depends largely on cross-border trading and swapping between markets.
Commercial mechanisms which are made possible thanks to mitigating any congestion or market
access obstacles. In this environment a well-functioning of gas market is the starting point for
delivering security of gas supply at reasonable prices. Any interventions may be needed once the
capabilities of the market to supply customers are exhausted.
Indirect threats from shocks elsewhere in Europe
Belgium’s security of supply is sensitive to events elsewhere in Europe since gas flows to
Belgium are for more than 50% cross-border traded to other EU-countries. Any shortage of
gas in the EU will have an impact on the wholesale gas prices. Natural gas prices may increase
and impact the economy. Market integration contributes to security of gas supply within the
EU but at the same time makes markets more sensitive to shocks elsewhere in the EU, events
which are primarily reflected in the gas wholesale prices to pay.
Current market mechanisms within Europe imply that e.g. Belgium - only marginally
depending on gas flows from Russia - will feel the impacts of any cut in Russian gas supply to
Europe. Wholesale prices will increase according to the drop of Russian gas volumes to
Europe. Since the high level of market integration and cross-border price convergence,
Belgium will also face higher wholesale gas prices. Depending on the alternative (more
expensive) sources (e.g. LNG) and the nature of the cut in Russian gas exports (level and
duration), higher price levels may have a structural impact without endangering the supply of
gas to Belgium as such. Obviously, security of gas supply does not only mean the safeguarding
of natural gas availability but includes also the requirement of gas supplies at reasonable
prices. In a market environment, any gas shortage will primarily be reflected in an increase of
gas prices and an adaptation of supply as well as demand. A well-functioning natural market
is crucial in which price signals have the capability to attract new gas volumes from new
sources. This market mechanism requires sufficient transmission capacity and easy access to
networks, as is the case in Belgium for cross-border trading.
Risks related to electricity black-outs
It should be recognized that there is an important link between gas and electricity. For example
gas-fired power plants but also compressor station on the gas network which are more and more
electricity-driven. So it is important to stay alert for possible treats and to investigate how the
dependency of the electricity and gas sector can have an impact on one another. The mutual
dependency between gas and electricity is a topic that should deserve more attention from us in
the future. But also the EU also should encourage to investigation of the possible dependency, not
only on national levels but also on regional levels.
Risks related to less commercial viability of UGS and LNG terminals in the EU
The current gas economics provide often more competitive alternatives to physical storage
and LNG supplies. A prerequisite for security of gas supply in the EU is the access to various
infrastructure facilities including UGS and LNG terminals. As long as no (contractual)
congestion is observed on cross-border interconnection points and cross-border trade is
facilitated, it is not a prerequisite that the required UGS (nor LNG facilities) is located in each
country.
September 14
Risk assessment Belgium 8
Introduction The intention of the Regulation 994/2010 of the European Parliament and of the Council
Concerning Measures to Safeguard Security of Gas Supply is to prevent the kind of gas crisis
situations EU-27 experienced in January 2009. One of the means considered in the Regulation
to achieve this target is performing a full risk assessment. Article 92 of the regulation on “Risk
Assessment” is of great importance in this regard:
Each Member State shall make a full risk assessment of the risks affecting its security of gas
supply by:
(a) using the standards specified in Articles 6 and 8 (infrastructure standard and supply
standard)
(b) taking into account all relevant national and regional circumstances,
(c) running various scenarios of exceptionally high gas demand and supply disruption, such as
failure of the main transmission infrastructures, storages or LNG terminals, and disruption of
supplies from third country suppliers, taking into account the history, probability, season,
frequency and duration of their occurrence as well as, where appropriate, geopolitical risks,
and assessing the likely consequences of these scenarios;
(d) identifying the interaction and correlation of risks with other Member States,
The first risk assessments are due by 3 December 2011. The Federal Public Service of
Economy, S.M.E.s, Self-employed and Energy (DG Energy) has been officially appointed as the
provisional Competent Authority for Belgium and has prepared a Risk Assessment on the
security of gas supply as required by the Regulation 994/2010. Roughly, the timeframe of the
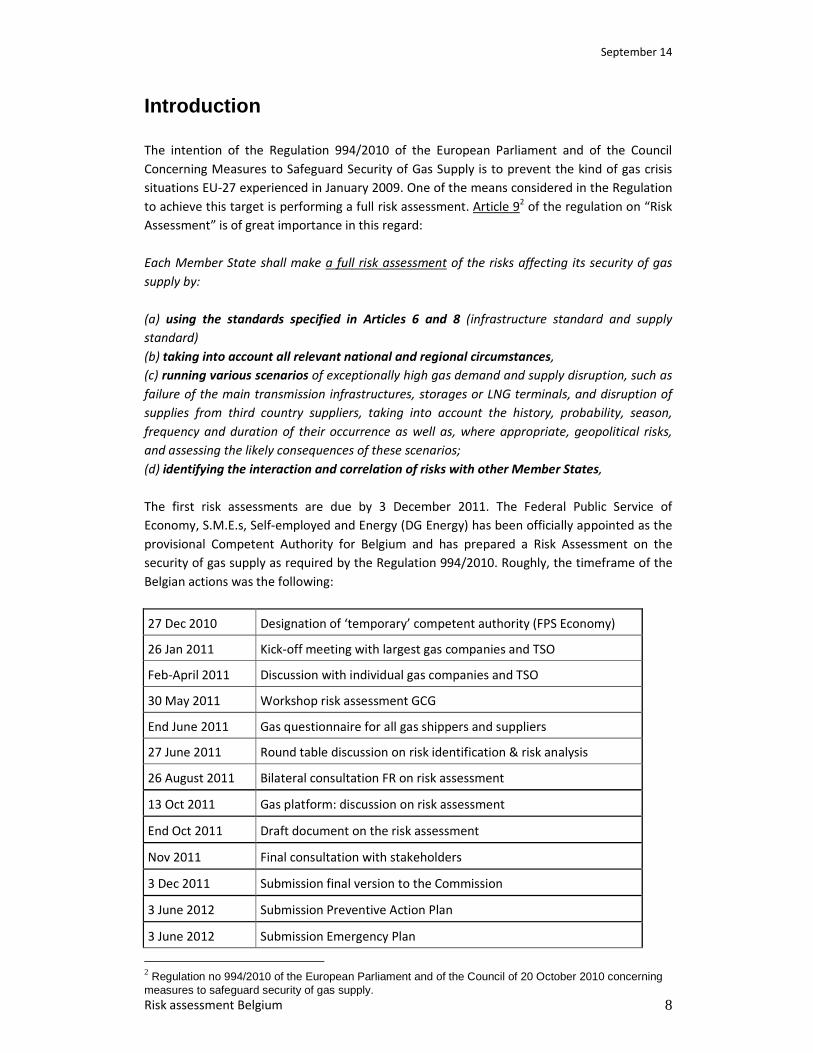
Belgian actions was the following:
27 Dec 2010 Designation of ‘temporary’ competent authority (FPS Economy)
26 Jan 2011 Kick-off meeting with largest gas companies and TSO
Feb-April 2011 Discussion with individual gas companies and TSO
30 May 2011 Workshop risk assessment GCG
End June 2011 Gas questionnaire for all gas shippers and suppliers
27 June 2011 Round table discussion on risk identification & risk analysis
26 August 2011 Bilateral consultation FR on risk assessment
13 Oct 2011 Gas platform: discussion on risk assessment
End Oct 2011 Draft document on the risk assessment
Nov 2011 Final consultation with stakeholders
3 Dec 2011 Submission final version to the Commission
3 June 2012 Submission Preventive Action Plan
3 June 2012 Submission Emergency Plan
2 Regulation no 994/2010 of the European Parliament and of the Council of 20 October 2010 concerning measures to safeguard security of gas supply.
September 14
Risk assessment Belgium 9
3 June 2014 1st Update Risk assessment
The Competent Authority is responsible for ensuring the implementation of the measures set
out in the regulation. However, there is also an important role in the establishment of the risk
assessment for the TSO Fluxys Belgium (N-1 calculation, reverse flow study, risk scenario’s,…),
the NRA CREG (market based measures, risk identification & analysis,…) and the shippers &
suppliers (supply standard,…). Natural gas undertakings, the transmission system operator,
industrial gas consumers, organisations representing interests of households and the NRA
shall cooperate and provide the Competent Authority upon request with all necessary
information.
The risk assessment gives a first indication of the main risk for Belgium’s gas security of
supply. The actions taken to prevent and mitigate the risks were taken up in the preventive
action plan and in the emergency plan that was established by the end of 2012. An update of
this preventive action plan and emergency plan will be made by the end of 2014.
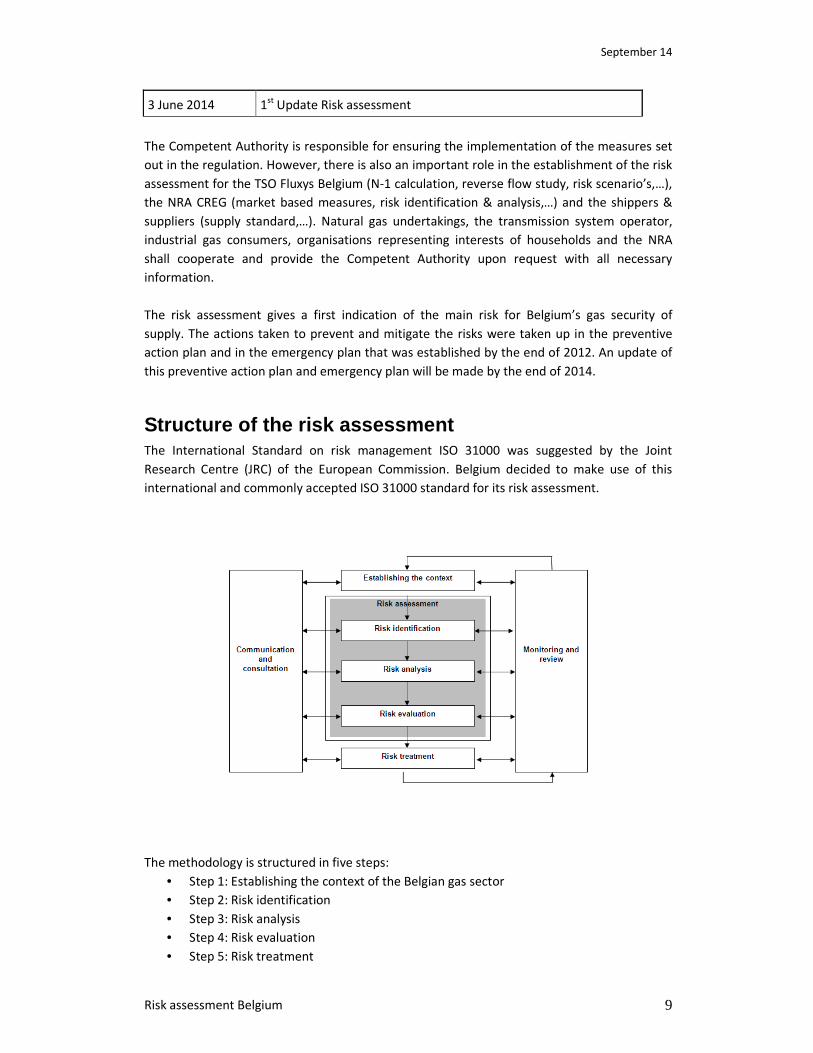
Structure of the risk assessment The International Standard on risk management ISO 31000 was suggested by the Joint
Research Centre (JRC) of the European Commission. Belgium decided to make use of this
international and commonly accepted ISO 31000 standard for its risk assessment.
The methodology is structured in five steps:
• Step 1: Establishing the context of the Belgian gas sector
• Step 2: Risk identification
• Step 3: Risk analysis
• Step 4: Risk evaluation
• Step 5: Risk treatment
September 14
Risk assessment Belgium 10
1. Establishing the context: Components of the Belgian gas system
1.1. Introduction
The context of the Belgian gas system will be described according to the following five
parameters:
• Institutional context
• Regional context
• Supply and demand - context
• Gas infrastructure (capacity) context
• Gas infrastructure utilization & contracts
1.2. Institutional context
1.2.1. The competences on federal and regional level Competences on energy in Belgium are divided over the federal state and the regions. There
are three regions in Belgium, the Flemish region, the Walloon region and the Brussels region
with each their own regulator and their own competences.
The federal government is responsible for the following:
- the national equipment program for the electricity sector
- de nuclear fuel cycle
- large infrastructure for storage, transmission, LNG terminal and production of
energy
- tariffs
The regions are competent for:
- distribution and local transport of electricity on the network with a voltage
inferior to 70.000 volt
- public gas distribution
- use of mine gas and blast-furnace gas
- district heating
- valorisation of stone piles
- renewables with the exception of those on the Belgian Continental Platform
- energy recovery by the industry and other users
- rational energy use
The federal government is competent for all subjects of the general interest that were not
explicitly taken up in the competences of the regions, so security of energy supply remains
one of the competences of the federal government.
September 14
Risk assessment Belgium 11
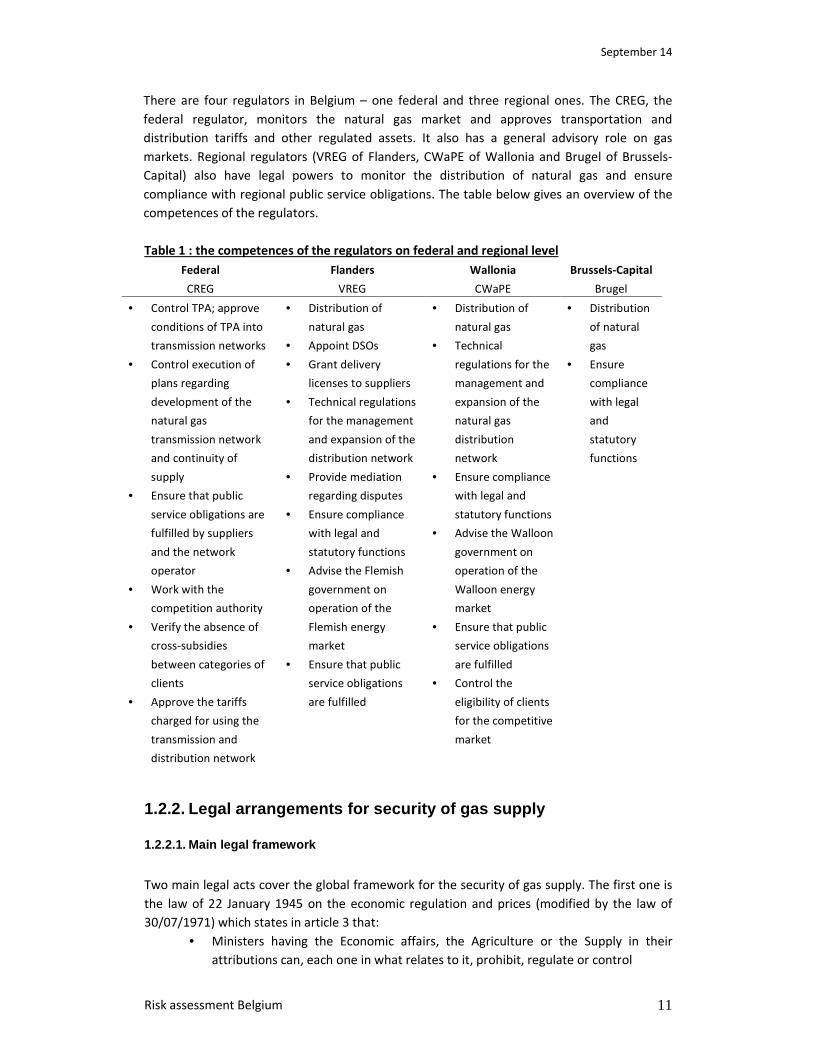
There are four regulators in Belgium – one federal and three regional ones. The CREG, the
federal regulator, monitors the natural gas market and approves transportation and
distribution tariffs and other regulated assets. It also has a general advisory role on gas
markets. Regional regulators (VREG of Flanders, CWaPE of Wallonia and Brugel of Brussels-
Capital) also have legal powers to monitor the distribution of natural gas and ensure
compliance with regional public service obligations. The table below gives an overview of the
competences of the regulators.
Table 1 : the competences of the regulators on federal and regional level
Federal
CREG
Flanders
VREG
Wallonia
CWaPE
Brussels-Capital
Brugel
• Control TPA; approve
conditions of TPA into
transmission networks
• Control execution of
plans regarding
development of the
natural gas
transmission network
and continuity of
supply
• Ensure that public
service obligations are
fulfilled by suppliers
and the network
operator
• Work with the
competition authority
• Verify the absence of
cross-subsidies
between categories of
clients
• Approve the tariffs
charged for using the
transmission and
distribution network
• Distribution of
natural gas
• Appoint DSOs
• Grant delivery
licenses to suppliers
• Technical regulations
for the management
and expansion of the
distribution network
• Provide mediation
regarding disputes
• Ensure compliance
with legal and
statutory functions
• Advise the Flemish
government on
operation of the
Flemish energy
market
• Ensure that public
service obligations
are fulfilled
• Distribution of
natural gas
• Technical
regulations for the
management and
expansion of the
natural gas
distribution
network
• Ensure compliance
with legal and
statutory functions
• Advise the Walloon
government on
operation of the
Walloon energy
market
• Ensure that public
service obligations
are fulfilled
• Control the
eligibility of clients
for the competitive
market
• Distribution
of natural
gas
• Ensure
compliance
with legal
and
statutory
functions
1.2.2. Legal arrangements for security of gas supply
1.2.2.1. Main legal framework
Two main legal acts cover the global framework for the security of gas supply. The first one is
the law of 22 January 1945 on the economic regulation and prices (modified by the law of
30/07/1971) which states in article 3 that:
• Ministers having the Economic affairs, the Agriculture or the Supply in their
attributions can, each one in what relates to it, prohibit, regulate or control

September 14
Risk assessment Belgium 12
o the following activities : import, production, manufacture, preparation,
detention, transformation, use, distribution, purchase, sale, exposure,
presentation, offer on sale, delivery and transport
o the following items : products, matters, food products, goods and animals
that they indicate.
• Possibility for the concerned Minister to reduce or suspend, temporarily or
definitively, the supply of all people or companies devoting itself to one of the
above mentioned activities
• Possibility to proceed or to make proceed to the requisition of products and
goods
The second is the gas Act of 12 April 1965 (with several modifications):
“The King can […] take any necessary safeguarding measure in the following cases:
threat of crisis or sudden crisis in the energy market;
the security of supply in the country is threatened;
threat on the physical security or the safety of people, equipment or installations;
threat on the integrity of transport networks.
1.2.2.2. Specific legislation related to public service obligations (PSOs)
Furthermore, there is some specific legislation related to public service obligations (PSOs). As
required by the security of gas supply regulation, the legislation related to PSOs was
communicated in February 2011 to the European Commission. Hereafter those PSOs are
described.
National legislation
• Article 15/1 of the Gas Act (12/04/1965), modified by article 20 from the law of
01/06/2005: general obligation related to the responsibility of the exploitation and
development of the gas installations
• Article 15/11,§1 of the Gas Act (12/04/1965), modified by article 109 (law of
22/12/2008) and article 5 (law of 27/02/2003) = PSO on the necessary investments
(al.1°) and on both the regularity and quality of supplies (al. 2°)
• Royal Decree of 16/12/1999 giving a list of priority consumers in case of supply
disruption
• Ministerial Decree of 23/10/2002 related to PSOs in the gas market = implementing
decree for already mentioned article 15/11, §1, al.1° (Gas Act of 12/04/1965) and
indicating specific cases where supply disruption is authorized
• Article 1 of the Gas Act (12/04/1965), modified by article 2 from the law of 11/6/2011:
Law to amend the Act of 12 April 1965 on the transport of gaseous and other products
by pipeline
• Article 1,2 ,15/13 of the Gas Act (12/04/1965), respectively modified by article 55, 56,
86 from the law of 08/01/2012: Law to amend the Act of 29 April 1999 on the
organization of the electricity market and the Act of 12 April 1965 on the transport of
gaseous and other products by pipeline
• Ministerial Decree of 18/12/2013 establishing the federal emergency plan for natural
gas supply
September 14
Risk assessment Belgium 13
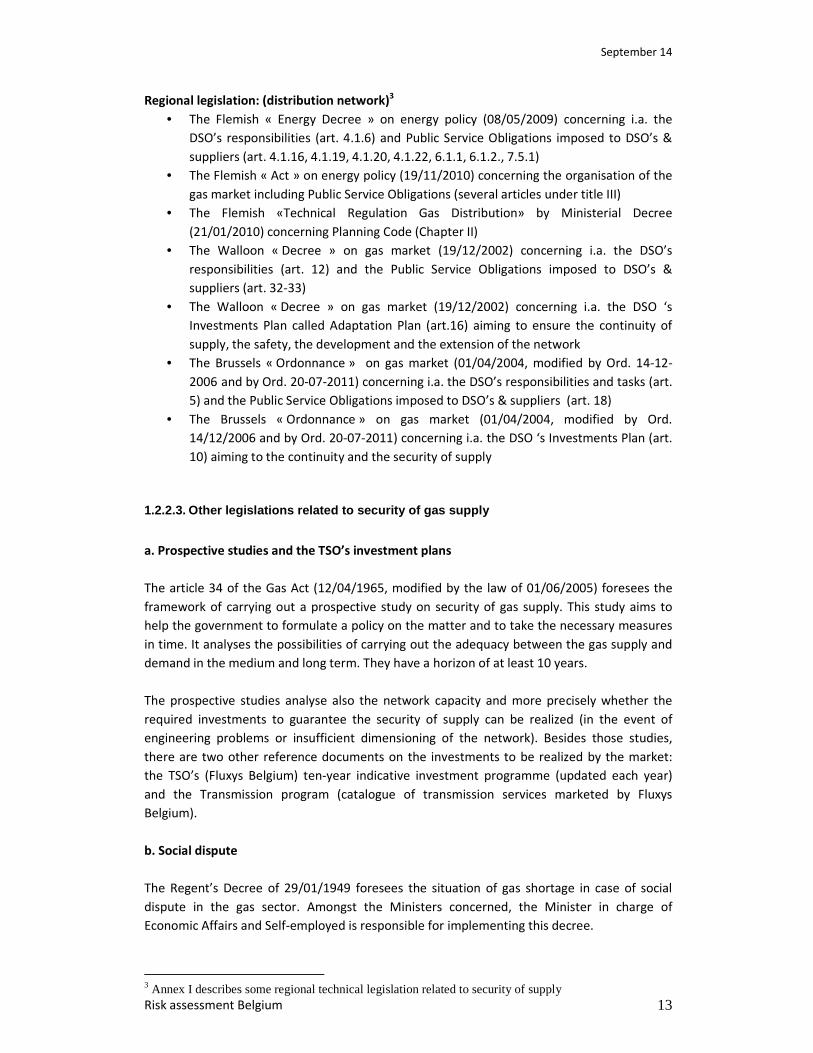
Regional legislation: (distribution network)3
• The Flemish « Energy Decree » on energy policy (08/05/2009) concerning i.a. the
DSO’s responsibilities (art. 4.1.6) and Public Service Obligations imposed to DSO’s &
suppliers (art. 4.1.16, 4.1.19, 4.1.20, 4.1.22, 6.1.1, 6.1.2., 7.5.1)
• The Flemish « Act » on energy policy (19/11/2010) concerning the organisation of the
gas market including Public Service Obligations (several articles under title III)
• The Flemish «Technical Regulation Gas Distribution» by Ministerial Decree
(21/01/2010) concerning Planning Code (Chapter II)
• The Walloon « Decree » on gas market (19/12/2002) concerning i.a. the DSO’s
responsibilities (art. 12) and the Public Service Obligations imposed to DSO’s &
suppliers (art. 32-33)
• The Walloon « Decree » on gas market (19/12/2002) concerning i.a. the DSO ‘s
Investments Plan called Adaptation Plan (art.16) aiming to ensure the continuity of
supply, the safety, the development and the extension of the network
• The Brussels « Ordonnance » on gas market (01/04/2004, modified by Ord. 14-12-
2006 and by Ord. 20-07-2011) concerning i.a. the DSO’s responsibilities and tasks (art.
5) and the Public Service Obligations imposed to DSO’s & suppliers (art. 18)
• The Brussels « Ordonnance » on gas market (01/04/2004, modified by Ord.
14/12/2006 and by Ord. 20-07-2011) concerning i.a. the DSO ‘s Investments Plan (art.
10) aiming to the continuity and the security of supply
1.2.2.3. Other legislations related to security of gas supply
a. Prospective studies and the TSO’s investment plans
The article 34 of the Gas Act (12/04/1965, modified by the law of 01/06/2005) foresees the
framework of carrying out a prospective study on security of gas supply. This study aims to
help the government to formulate a policy on the matter and to take the necessary measures
in time. It analyses the possibilities of carrying out the adequacy between the gas supply and
demand in the medium and long term. They have a horizon of at least 10 years.
The prospective studies analyse also the network capacity and more precisely whether the
required investments to guarantee the security of supply can be realized (in the event of
engineering problems or insufficient dimensioning of the network). Besides those studies,
there are two other reference documents on the investments to be realized by the market:
the TSO’s (Fluxys Belgium) ten-year indicative investment programme (updated each year)
and the Transmission program (catalogue of transmission services marketed by Fluxys
Belgium).
b. Social dispute
The Regent’s Decree of 29/01/1949 foresees the situation of gas shortage in case of social
dispute in the gas sector. Amongst the Ministers concerned, the Minister in charge of
Economic Affairs and Self-employed is responsible for implementing this decree.
3 Annex I describes some regional technical legislation related to security of supply

September 14
Risk assessment Belgium 14
c. Specific aspects related to security and safety requirements
=> TSO’s responsibility (Fluxys Belgium)
• The TSO is responsible for crisis mechanisms (see royal decree on public service
obligations on gas of 23 October 2002).
• The TSO has to set up an plan for incident management and a back-up plan. A 2-yearly
update is mandatory.
• The TSO has to respect the Code of conduct (range of operational and administrative
guidelines for the users of the gas network) which indicates i.e.
• Plan for incident management and shut-off plan (see royal decree of 23/12/2010)
=> KLIM (Kabel en Leidingen Informatie Meldpunt)
Following to the Ghilenghien disaster, a Cable and Pipeline Information Point (the KLIM) was
set up. It collects and monitors the location of all cables and pipelines in Belgium in order to
prevent accident with pipelines.
=> Coordination between regional and national emergency planning
The general crisis policy is supervised by the Coordination and Crisis Centre of the
Government (CCCG) linked to the Federal Public Service “Home Affairs” (see royal decree of
31/01/2003 related to the emergency plan). The CCCG’s action covers the following cases:
– vital interests or essential needs (production and distribution of energy are parts of
them) of the population are threatened;
– urgent decisions are needed to be taken;
– coordinated effort of various departments and organizations are needed.
The Federal Public Service “Economy” has set up 2 coordination units for this general crisis
policy: the Crisis Cell and the Bureau of Civil Plans for Defense.
1.2.3. Intergovernmental agreements Belgium signed the following intergovernmental agreements with non-EU countries:
1. Agreement signed with Norway
Date of signature : 14/04/1988
• Subject : transmission by gas pipeline coming from the Norwegian continental
Shelf and from other areas by Pipeline to the Kingdom of Belgium (it concerns
in particular the pipeline called « Zeepipe » starting in Norway and ending at
Zeebrugge)
• Agreement legally approved under the law of 19/09/1991 (published on
20/09/1993 in the official journal for publication of Belgian legislation)
2. Agreement with Norway (based on the above mentioned agreement)
• Date of signature : 19/11/1993
• Subject : Agreed procedures for safety supervision of the gas pipeline from the
Norwegian Continental Shelf to Belgium (Zeepipe)
September 14
Risk assessment Belgium 15
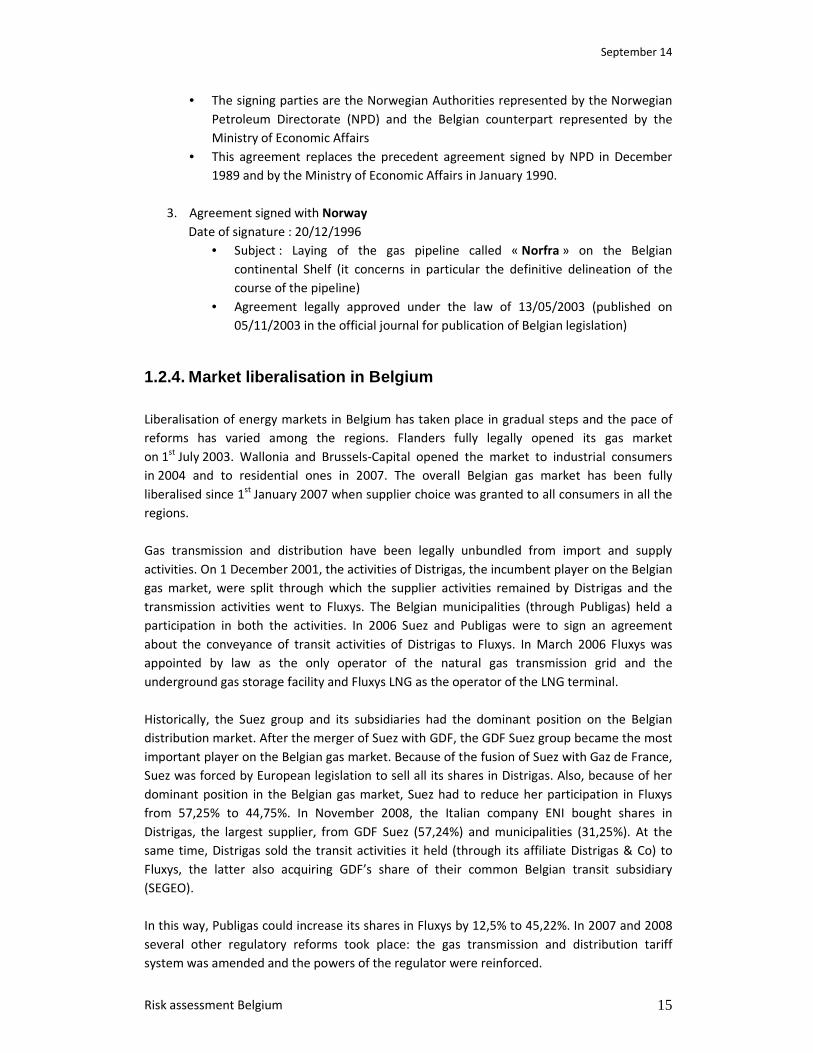
• The signing parties are the Norwegian Authorities represented by the Norwegian
Petroleum Directorate (NPD) and the Belgian counterpart represented by the
Ministry of Economic Affairs
• This agreement replaces the precedent agreement signed by NPD in December
1989 and by the Ministry of Economic Affairs in January 1990.
3. Agreement signed with Norway
Date of signature : 20/12/1996
• Subject : Laying of the gas pipeline called « Norfra » on the Belgian
continental Shelf (it concerns in particular the definitive delineation of the
course of the pipeline)
• Agreement legally approved under the law of 13/05/2003 (published on
05/11/2003 in the official journal for publication of Belgian legislation)
1.2.4. Market liberalisation in Belgium Liberalisation of energy markets in Belgium has taken place in gradual steps and the pace of
reforms has varied among the regions. Flanders fully legally opened its gas market
on 1st
July 2003. Wallonia and Brussels-Capital opened the market to industrial consumers
in 2004 and to residential ones in 2007. The overall Belgian gas market has been fully
liberalised since 1st
January 2007 when supplier choice was granted to all consumers in all the
regions.
Gas transmission and distribution have been legally unbundled from import and supply
activities. On 1 December 2001, the activities of Distrigas, the incumbent player on the Belgian
gas market, were split through which the supplier activities remained by Distrigas and the
transmission activities went to Fluxys. The Belgian municipalities (through Publigas) held a
participation in both the activities. In 2006 Suez and Publigas were to sign an agreement
about the conveyance of transit activities of Distrigas to Fluxys. In March 2006 Fluxys was
appointed by law as the only operator of the natural gas transmission grid and the
underground gas storage facility and Fluxys LNG as the operator of the LNG terminal.
Historically, the Suez group and its subsidiaries had the dominant position on the Belgian
distribution market. After the merger of Suez with GDF, the GDF Suez group became the most
important player on the Belgian gas market. Because of the fusion of Suez with Gaz de France,
Suez was forced by European legislation to sell all its shares in Distrigas. Also, because of her
dominant position in the Belgian gas market, Suez had to reduce her participation in Fluxys
from 57,25% to 44,75%. In November 2008, the Italian company ENI bought shares in
Distrigas, the largest supplier, from GDF Suez (57,24%) and municipalities (31,25%). At the
same time, Distrigas sold the transit activities it held (through its affiliate Distrigas & Co) to
Fluxys, the latter also acquiring GDF’s share of their common Belgian transit subsidiary
(SEGEO).
In this way, Publigas could increase its shares in Fluxys by 12,5% to 45,22%. In 2007 and 2008
several other regulatory reforms took place: the gas transmission and distribution tariff
system was amended and the powers of the regulator were reinforced.
September 14
Risk assessment Belgium 16
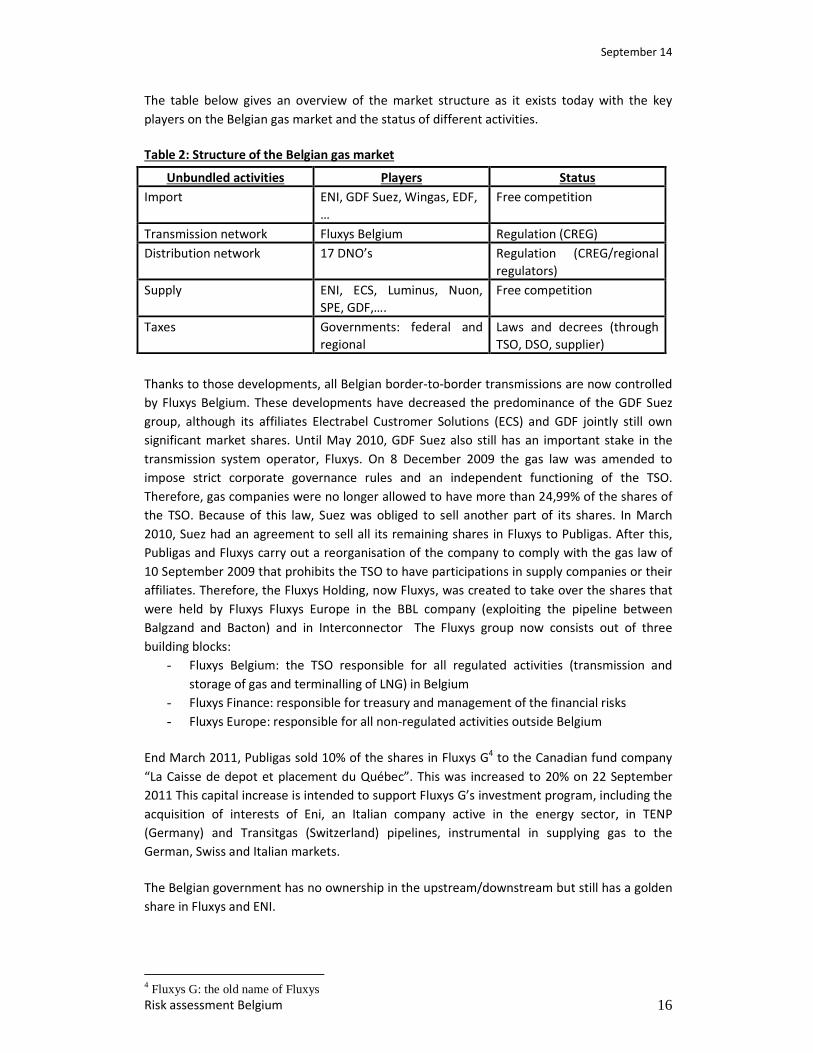
The table below gives an overview of the market structure as it exists today with the key
players on the Belgian gas market and the status of different activities.
Table 2: Structure of the Belgian gas market
Unbundled activities Players Status
Import ENI, GDF Suez, Wingas, EDF,
…
Free competition
Transmission network Fluxys Belgium Regulation (CREG)
Distribution network 17 DNO’s Regulation (CREG/regional
regulators)
Supply ENI, ECS, Luminus, Nuon,
SPE, GDF,….
Free competition
Taxes Governments: federal and
regional
Laws and decrees (through
TSO, DSO, supplier)
Thanks to those developments, all Belgian border-to-border transmissions are now controlled
by Fluxys Belgium. These developments have decreased the predominance of the GDF Suez
group, although its affiliates Electrabel Custromer Solutions (ECS) and GDF jointly still own
significant market shares. Until May 2010, GDF Suez also still has an important stake in the
transmission system operator, Fluxys. On 8 December 2009 the gas law was amended to
impose strict corporate governance rules and an independent functioning of the TSO.
Therefore, gas companies were no longer allowed to have more than 24,99% of the shares of
the TSO. Because of this law, Suez was obliged to sell another part of its shares. In March
2010, Suez had an agreement to sell all its remaining shares in Fluxys to Publigas. After this,
Publigas and Fluxys carry out a reorganisation of the company to comply with the gas law of
10 September 2009 that prohibits the TSO to have participations in supply companies or their
affiliates. Therefore, the Fluxys Holding, now Fluxys, was created to take over the shares that
were held by Fluxys Fluxys Europe in the BBL company (exploiting the pipeline between
Balgzand and Bacton) and in Interconnector The Fluxys group now consists out of three
building blocks:
- Fluxys Belgium: the TSO responsible for all regulated activities (transmission and
storage of gas and terminalling of LNG) in Belgium
- Fluxys Finance: responsible for treasury and management of the financial risks
- Fluxys Europe: responsible for all non-regulated activities outside Belgium
End March 2011, Publigas sold 10% of the shares in Fluxys G4 to the Canadian fund company
“La Caisse de depot et placement du Québec”. This was increased to 20% on 22 September
2011 This capital increase is intended to support Fluxys G’s investment program, including the
acquisition of interests of Eni, an Italian company active in the energy sector, in TENP
(Germany) and Transitgas (Switzerland) pipelines, instrumental in supplying gas to the
German, Swiss and Italian markets.
The Belgian government has no ownership in the upstream/downstream but still has a golden
share in Fluxys and ENI.
4 Fluxys G: the old name of Fluxys

September 14
Risk assessment Belgium 17
1.2.5. The Belgian wholesale and retail market Wholesale market players in Belgium provide natural gas to 17 distribution companies and to
about 250 large industrial end-users and power plants connected directly to the transmission
grid.
The graphs show the total market shares of all the suppliers active on the Belgian gas market.
Figure 1: Market Shares of Natural Gas Supply Companies, 2013
Source: CREG
The market liberalisation has created the possibility to establish a wholesale market in which
gas can be sold to other suppliers with their own portfolio. Historically, gas was (and for a
large part still is) imported through long term contracts between the producers and suppliers.
The creation of a wholesale and a retail market makes the decoupling possible between the
gas producer and the final gas supplier. In order to have a good functioning of the gas market
with a high security of supply, it is important to have a liquid market. This liquidity can be
increased by the development of the gas hub. In the national gas trade, Zeebrugge has a key
commercial role as one of Europe’s major spot markets for natural gas. Huberator, the
operator of the Zeebrugge Hub, facilitates over the counter trading of natural gas, while
exchange-based trading is operated by APX Gas ZEE, established in 2005. It provides a spot
market for trading of within-day and day-ahead gas contracts.
For the retail market, it is important to know that Belgium has two different types of gas: H-
gas (with high caloric value) and L-gas (with low caloric value). The L-gas market serves a
quarter of the Belgian consumption and supplies certain regions exclusively, including the
Brussels region. Most of the customers connected to the L-gas grid are households.
September 14
Risk assessment Belgium 18
1.3. Regional context
1.3.1. Belgium in the North-West gas region
Belgium serves as an important transit country for gas either coming through pipelines or
LNG. Being located in the middle of the largest gas consumer markets in the EU (UK, DE, FR
and NL), Belgium is very well placed with its highly interconnected transmission network. The
Zeebrugge area is one of the most important natural gas landing points in the EU28.
Connecting to a variety of pipeline gas and LNG sources, the Zeebrugge area has an overall
throughput capacity of about 48 bcm/y. This corresponds with roughly 10% of the border
capacity needed to supply the EU28. As for pipeline gas flows, the Zeebrugge area gives access
to natural gas from Norwegian and British offshore production fields in the North Sea as well
as from Germany. Worldwide LNG supply is accessible through the Zeebrugge LNG terminal.
The terminal has three primary shippers and standard provisions are in place to facilitate spot
LNG deliveries. Any LNG or pipe gas brought into the Zeebrugge area can be traded at the
Zeebrugge Hub or shipped through the Fluxys Belgium grid for delivery into the Belgian
market or redelivery at one of the borders for onward transmission to the United Kingdom,
the Netherlands, Germany, the Grand Duchy of Luxembourg, France and Southern Europe.
1.3.2. Gas regional initiative
The development of regional gas markets is an important and practical intermediate step
towards the eventual goal of a competitive, single-European gas market. On 25 April
2006, ERGEG launched the Gas Regional Initiative (GRI) to speed up the integration of
Europe's national gas markets. The GRI created three regional gas markets in Europe (North-
West; South South-East; and South regions) as an interim step to creating a single-EU gas
market. Belgium is part of the North-West regional initiative in which also The Netherlands,
France, Ireland, Great Britain, Germany, Denmark, Sweden, Northern Ireland and Norway
(observer) are involved. The goal of the regional initiative is to tackle barriers to competition,
such as the lack of market integration, transparency and balancing issues.
In 2008, the Secondary Market pilot project was initiated as to establish online platform(s) for
the trading of firm secondary gas transport capacity rights on a day-ahead basis. Belgium and
France have established a platform named Capsquare to buy or sell secondary market
capacity in the Fluxys network (Belgium), and in the GRTgaz network (France). It also proposes
primary capacity for both networks at once through the Bundled Fluxys-GRTgaz product
Zeebrugge Hub to PEG North. Companies that hold capacity they do not intend to use can
valorise it at market price by selling it through the Capsquare platform. It also provides an
alternative source for the standard primary market as single capacity can be booked on the
secondary market and bundled capacity on the primary market.
1.3.3. Gas platform
Belgium is part of the regional Gas Platform that brings together energy ministers from
Belgium, Germany, France, Luxembourg and the Netherlands. Two working groups operate in
the framework of this Platform: 1) on market and competitiveness issues, and 2) on security
of supply. The objective of the first working group is to facilitate cross-border trade. Its
priorities include regional view on allocation mechanisms; more compatible balancing
September 14
Risk assessment Belgium 19
regimes; market alignment/integration, transport procedures in different countries. The
priority of working group two will be the implementation of the regulation 994/2010 on
security of gas supply. The Member states of the Penta region currently do not foresee a joint
regional risk assessment or the establishment of regional plans. However, close cooperation
on regional level will be organised for the following items: methodology of the risk
assessment, change of views on the preventive action plan and the emergency plan,
discussions about the reverse flow projects, the interaction on the simulation of disruption
scenarios and one item that is very specific for the North-West region, namely the Dutch
planned phase-out of L-gas.
1.3.4. L-gas market Belgium has two different types of gas: H-gas (with high caloric value) and L-gas (with low
caloric value). L-gas is mainly originating from the Groningen field in the Netherlands
(Groningen gas). To be able to import or inject the L-gas into the Belgian L-gas network, the
gas needs to fulfil certain quality specifications, amongst others, the gas needs to have a
Wobbe index between 43,9 MJ/m³(n) et 46,89 MJ/m³(n). For H-gas, the Wobbe index is
situated between 49,13 MJ/m³(n) et 56,81 MJ/m³(n). This lower Wobbe index is compensated
through a higher pressure in the public distribution network. The average pressure for non-
industrial clients in the distribution network is about 25mbar, while for the H-gas the average
pressure is 20 mbar.
Those different characteristics for L and H gas end in having two different infrastructure
networks and two separate commercial markets in Belgium, one for L-gas and another for H-
gas.
Dutch supplies are reliable and the L-gas is of good quality. Having a reliable gas producer so
close to the Belgian gas market surely increases the security of gas supply. However, the
current situation will not be sustainable in the very long term: a large part of the Belgian
consumers depend on one single source of gas, which may come to an end in the future.
Following the official communication of the Dutch Ministry of Economic Affairs mentioning
the reduction of the L-gas export towards the Belgian market as form 2024, a conversion
project will be necessary to replace the L-gas by H-gas.
As this is a very specific item for our region, Belgium has set up a task force on L-gas who deals
with the security of supply of the L-gas market. In this task force experts form the energy
administration work together with the regulators, TSO’s and suppliers from Belgium, the
Netherlands and France. Some the challenges in the near future due to the L-gas conversion
are: what to do with the Poppel connection, will there be enough storage, winter and summer
analysis, possible regional effects…. It is therefore necessary to make a simulation exercise
together with Fluxys Belgium to see what possible effects are as well as to see what possible
investments will be.
September 14
Risk assessment Belgium 20
1.4. Supply and demand
1.4.1. Supply
1.4.1.1. Current and projected gas supply
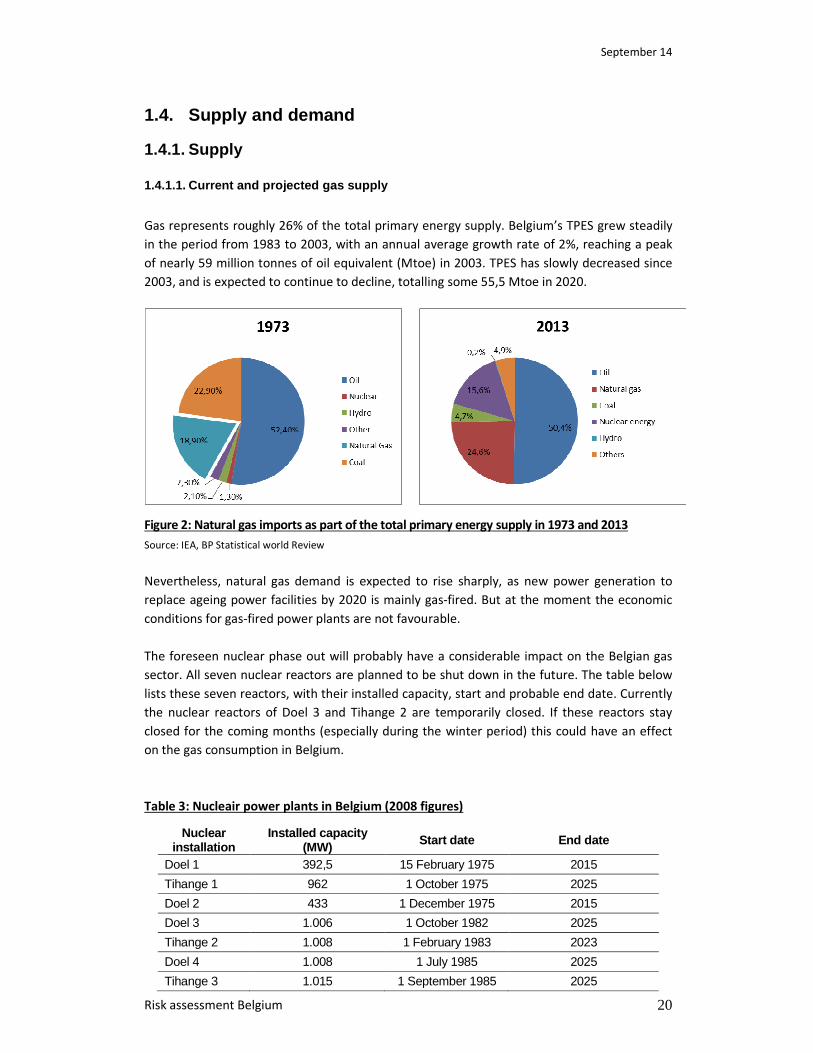
Gas represents roughly 26% of the total primary energy supply. Belgium’s TPES grew steadily
in the period from 1983 to 2003, with an annual average growth rate of 2%, reaching a peak
of nearly 59 million tonnes of oil equivalent (Mtoe) in 2003. TPES has slowly decreased since
2003, and is expected to continue to decline, totalling some 55,5 Mtoe in 2020.
Figure 2: Natural gas imports as part of the total primary energy supply in 1973 and 2013
Source: IEA, BP Statistical world Review
Nevertheless, natural gas demand is expected to rise sharply, as new power generation to
replace ageing power facilities by 2020 is mainly gas-fired. But at the moment the economic
conditions for gas-fired power plants are not favourable.
The foreseen nuclear phase out will probably have a considerable impact on the Belgian gas
sector. All seven nuclear reactors are planned to be shut down in the future. The table below
lists these seven reactors, with their installed capacity, start and probable end date. Currently
the nuclear reactors of Doel 3 and Tihange 2 are temporarily closed. If these reactors stay
closed for the coming months (especially during the winter period) this could have an effect
on the gas consumption in Belgium.
Table 3: Nucleair power plants in Belgium (2008 figures)
Nuclear installation
Installed capacity (MW) Start date End date
Doel 1 392,5 15 February 1975 2015
Tihange 1 962 1 October 1975 2025
Doel 2 433 1 December 1975 2015
Doel 3 1.006 1 October 1982 2025
Tihange 2 1.008 1 February 1983 2023
Doel 4 1.008 1 July 1985 2025
Tihange 3 1.015 1 September 1985 2025
September 14
Risk assessment Belgium 21
In November 2008, a group of experts was asked by the Minister of Energy, to produce a
report (GEMIX) on the ideal energy mix for Belgium in 2020 and 2030. On the basis of this
report, the Belgian government declared in October 2009 that the lifetime of the three oldest
nuclear reactors (Doel 1 & 2 en Tihange 1) will be prolonged by 10 years. In total, more than
5.800MW of installed (nuclear) capacity will have to be replaced in the coming decades.
Obviously, this could have a huge impact on the gas needs of Belgium in the decades to come.
One of the risk scenario’s described below will focus on the possible impact of a nuclear phase
out. In 2012, the Belgium government decided to prolong the lifetime of Tihange 1 with 10
years, from 2015 to 2025.
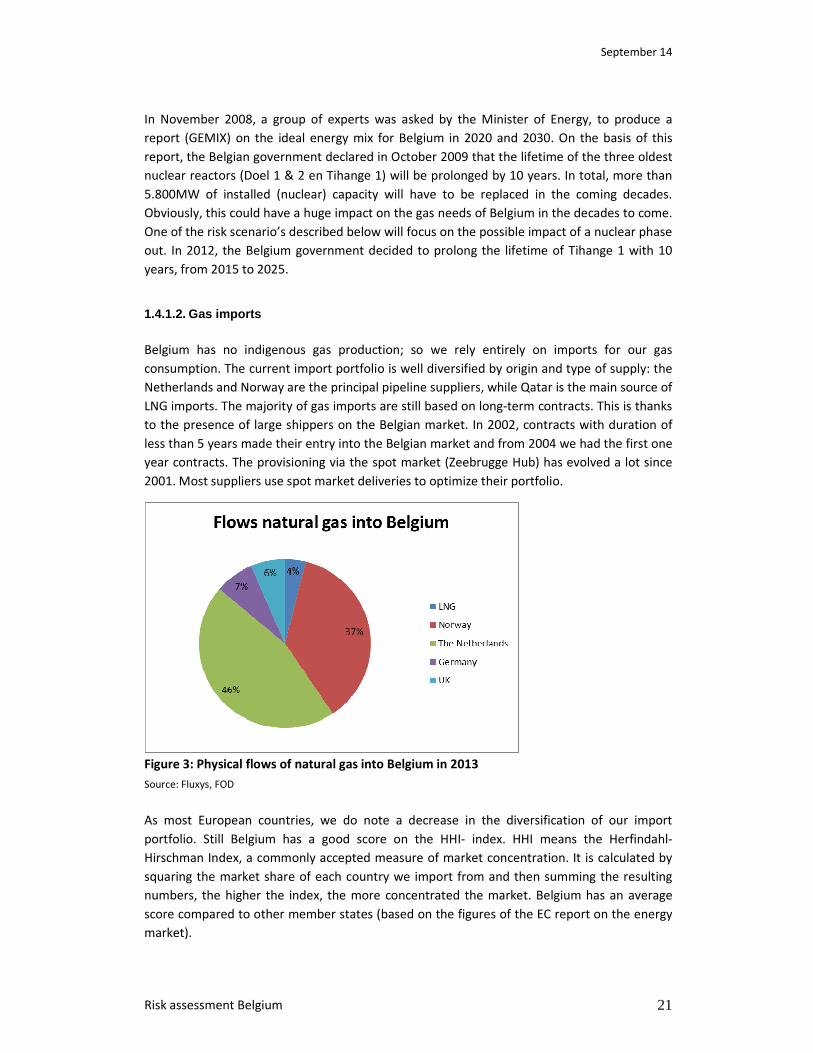
1.4.1.2. Gas imports Belgium has no indigenous gas production; so we rely entirely on imports for our gas
consumption. The current import portfolio is well diversified by origin and type of supply: the
Netherlands and Norway are the principal pipeline suppliers, while Qatar is the main source of
LNG imports. The majority of gas imports are still based on long-term contracts. This is thanks
to the presence of large shippers on the Belgian market. In 2002, contracts with duration of
less than 5 years made their entry into the Belgian market and from 2004 we had the first one
year contracts. The provisioning via the spot market (Zeebrugge Hub) has evolved a lot since
2001. Most suppliers use spot market deliveries to optimize their portfolio.
Figure 3: Physical flows of natural gas into Belgium in 2013
Source: Fluxys, FOD
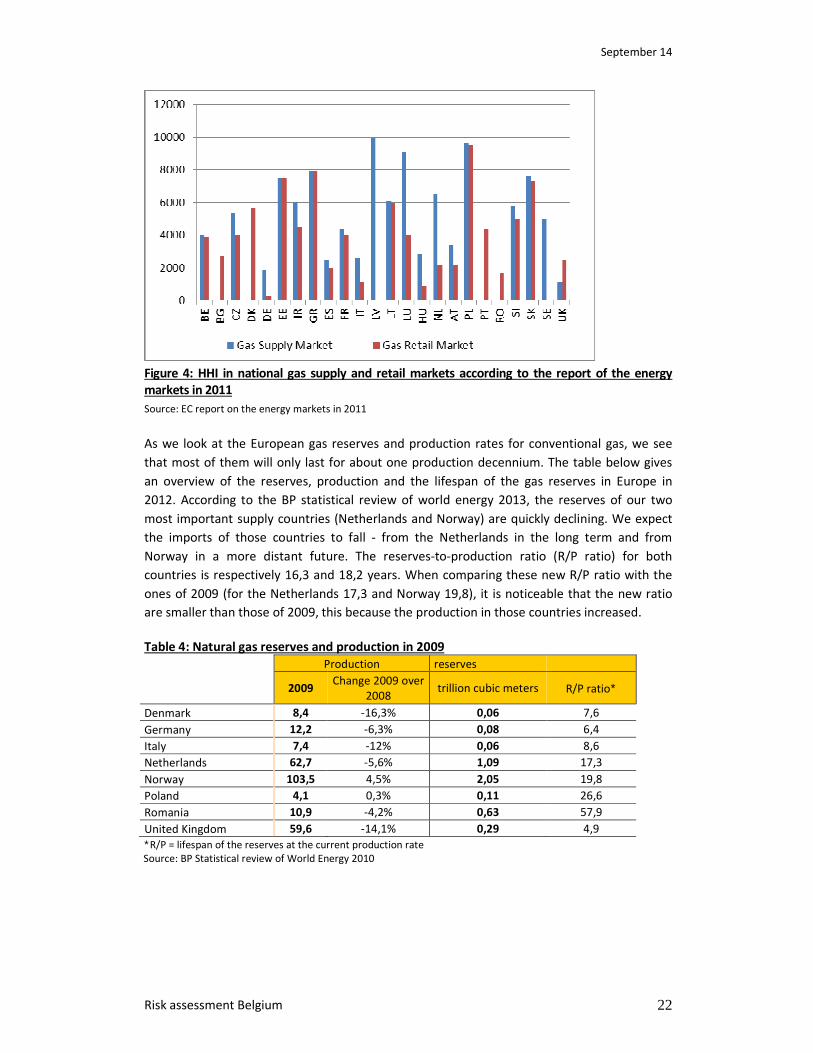
As most European countries, we do note a decrease in the diversification of our import
portfolio. Still Belgium has a good score on the HHI- index. HHI means the Herfindahl-
Hirschman Index, a commonly accepted measure of market concentration. It is calculated by
squaring the market share of each country we import from and then summing the resulting
numbers, the higher the index, the more concentrated the market. Belgium has an average
score compared to other member states (based on the figures of the EC report on the energy
market).
September 14
Risk assessment Belgium 22
Figure 4: HHI in national gas supply and retail markets according to the report of the energy
markets in 2011
Source: EC report on the energy markets in 2011
As we look at the European gas reserves and production rates for conventional gas, we see
that most of them will only last for about one production decennium. The table below gives
an overview of the reserves, production and the lifespan of the gas reserves in Europe in
2012. According to the BP statistical review of world energy 2013, the reserves of our two
most important supply countries (Netherlands and Norway) are quickly declining. We expect
the imports of those countries to fall - from the Netherlands in the long term and from
Norway in a more distant future. The reserves-to-production ratio (R/P ratio) for both
countries is respectively 16,3 and 18,2 years. When comparing these new R/P ratio with the
ones of 2009 (for the Netherlands 17,3 and Norway 19,8), it is noticeable that the new ratio
are smaller than those of 2009, this because the production in those countries increased.
Table 4: Natural gas reserves and production in 2009
Production reserves
2009
Change 2009 over
2008 trillion cubic meters R/P ratio∗
Denmark 8,4 -16,3% 0,06 7,6
Germany 12,2 -6,3% 0,08 6,4
Italy 7,4 -12% 0,06 8,6
Netherlands 62,7 -5,6% 1,09 17,3
Norway 103,5 4,5% 2,05 19,8
Poland 4,1 0,3% 0,11 26,6
Romania 10,9 -4,2% 0,63 57,9
United Kingdom 59,6 -14,1% 0,29 4,9
∗R/P = lifespan of the reserves at the current production rate
Source: BP Statistical review of World Energy 2010
September 14
Risk assessment Belgium 23
Table 5: Natural gas reserves and production in 2012
Production (in billion m³) reserves
2012
Change 2011 over
2012 trillion cubic meters R/P ratio∗
Denmark 6,4 -9,4% 0,04 5,9
Germany 9,0 -9,8% 0,06 6,1
Italy 7,8 1,7% 0,06 7,0
Netherlands 63,9 -0,8% 1,04 16,3
Norway 114,9 12,6% 2,09 18,2
Poland 4,2 -1,1% 0,12 28,3
Romania 10,9 <0,05% 0,10 9,3
United Kingdom 41,0 -14,1% 0,25 6,0
∗R/P = lifespan of the reserves at the current production rate
Source: BP Statistical review of World Energy 2013
Since The Netherlands and Norway represent together 70% of the natural gas imports of
Belgium, substantial alternative supplies will need to be available to replace the declining gas
supplies from the Netherlands and Norway in due time. In the long run, these developments
will most likely cause an increased dependence on gas imports from Russia and the Middle
East.
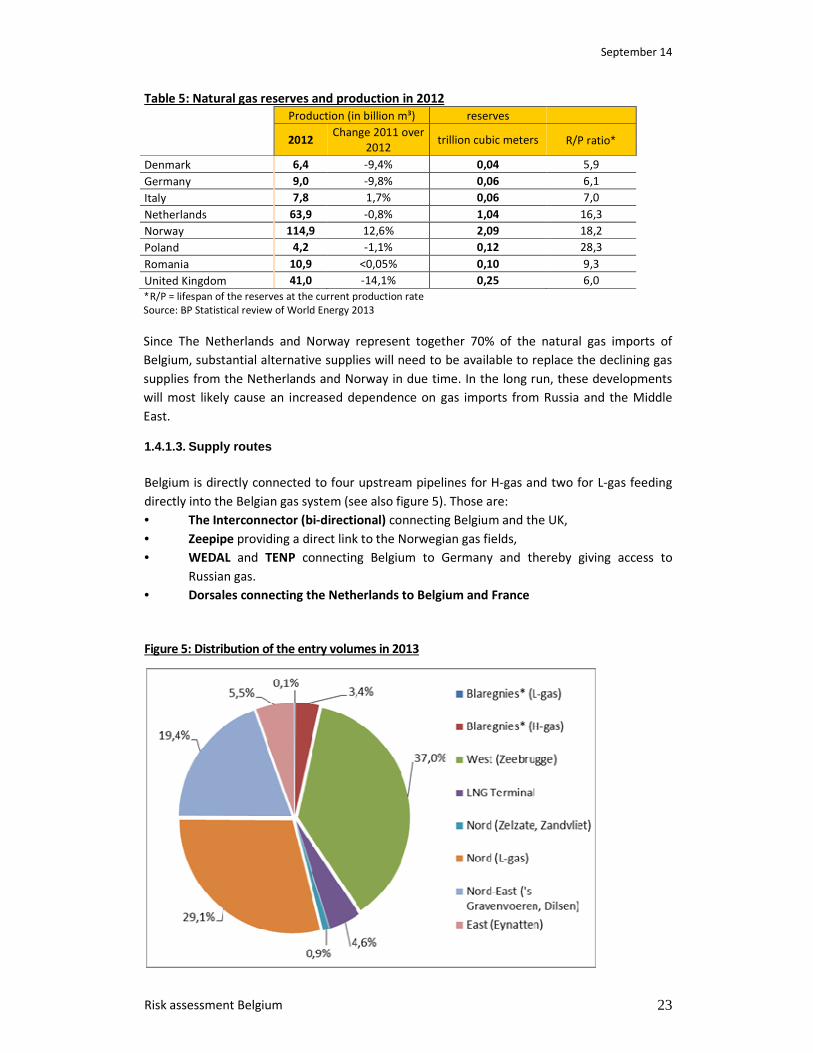
1.4.1.3. Supply routes Belgium is directly connected to four upstream pipelines for H-gas and two for L-gas feeding
directly into the Belgian gas system (see also figure 5). Those are:
• The Interconnector (bi-directional) connecting Belgium and the UK,
• Zeepipe providing a direct link to the Norwegian gas fields,
• WEDAL and TENP connecting Belgium to Germany and thereby giving access to
Russian gas.
• Dorsales connecting the Netherlands to Belgium and France
Figure 5: Distribution of the entry volumes in 2013
September 14
Risk assessment Belgium 24
Source: CREG; *The entry points of Blaregnies are opposite to the physical flows (reverse flows) by making use of
the dominant transits on these points
Figure 5 illustrates that most gas comes to Belgium via pipelines. 4,6% is imported via the
LNG-terminal of Zeebrugge. The Zeebrugge LNG terminal serves as a gateway to supply LNG
into North-western Europe. Any LNG unloaded at the terminal can be redelivered for
consumption on the Belgian market, traded on the Zeebrugge Hub or onward transmission to
supply other end consumer markets in the UK, the Netherland, Germany, Luxemburg, France
and Southern Europe. However, we want to note that not all LNG can be traded at the
Zeebrugge Hub, nor shipped to the UK due to quality restrictions5.
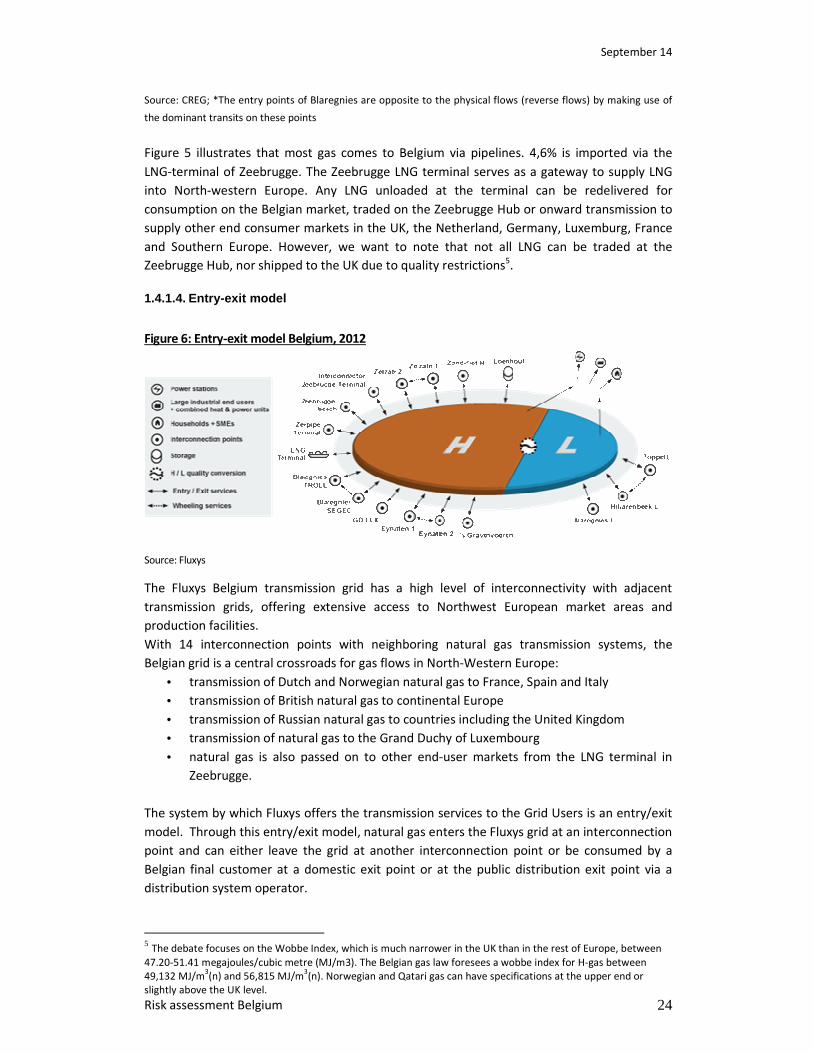
1.4.1.4. Entry-exit model
Figure 6: Entry-exit model Belgium, 2012
Source: Fluxys
The Fluxys Belgium transmission grid has a high level of interconnectivity with adjacent
transmission grids, offering extensive access to Northwest European market areas and
production facilities.
With 14 interconnection points with neighboring natural gas transmission systems, the
Belgian grid is a central crossroads for gas flows in North-Western Europe:
• transmission of Dutch and Norwegian natural gas to France, Spain and Italy
• transmission of British natural gas to continental Europe
• transmission of Russian natural gas to countries including the United Kingdom
• transmission of natural gas to the Grand Duchy of Luxembourg
• natural gas is also passed on to other end-user markets from the LNG terminal in
Zeebrugge.
The system by which Fluxys offers the transmission services to the Grid Users is an entry/exit
model. Through this entry/exit model, natural gas enters the Fluxys grid at an interconnection
point and can either leave the grid at another interconnection point or be consumed by a
Belgian final customer at a domestic exit point or at the public distribution exit point via a
distribution system operator.
5 The debate focuses on the Wobbe Index, which is much narrower in the UK than in the rest of Europe, between
47.20-51.41 megajoules/cubic metre (MJ/m3). The Belgian gas law foresees a wobbe index for H-gas between
49,132 MJ/m3(n) and 56,815 MJ/m
3(n). Norwegian and Qatari gas can have specifications at the upper end or
slightly above the UK level.
September 14
Risk assessment Belgium 25
Transmission services can be subscribed and used independently at interconnection points
(entry & exit services) and at domestic exit points (exit services). The model enables parties to
freely exchange quantities of gas within the Belgian system. This natural gas can, by
consequence, be delivered from any interconnection point and taken off towards any
interconnection point or any domestic exit point.
The transmission grid is divided into two entry/exit zones: the H-zone and the L-zone.
The H-zone corresponds to the physical H-calorific subgrid and the L-zone to the physical L-
calorific subgrid (see figure 6).
In addition, daily market based balancing will be applied. In order to reliably and efficiently
operate the Fluxys grid, the total quantities of natural gas entering the Fluxys grid must be, on
a daily basis, equal to the total quantities of natural gas leaving the Fluxys grid or consumed
by Final Customers. Any remaining residual differences at the end of the day will be settled by
Fluxys Belgium (market short: Fluxys Belgium buys gas at ZTP; market long: Fluxys Belgium
sells gas to ZTP) for the account of the causing shipper(s).
Within the day, the market balancing position, being the sum of the respective individual
balancing position of each Grid User, is assumed to remain within a predefined upper and
lower market threshold, corresponding to the commercially offered flexibility within the
system. This market balancing position is updated on an hourly basis, together with the
individual balancing position of each Grid User, representing the cumulated delta so far within
the day. As long as the market balancing position remains within the predefined market
threshold, there is no residual intervention by Fluxys Belgium. When the market position goes
beyond the market threshold, also within a day, Fluxys Belgium intervenes on the market in
order to settle the residual excess or shortfall beyond market threshold, by a sale or purchase
transaction. Such intervention is reported by Fluxys to Grid User(s) identified as contributing
to the residual imbalance by a proportional settlement in cash of their individual balancing
position.
1.4.2. Demand In 2013, the total measured gas demand of the Belgian end consumers amounted to 183,2
TWh, of which 129,8 TWh is H-gas (71% of total demand) and 53,5 TWh is L-gas (29% of total
demand). This results in about ± 17 bcm/year of total gas demand in Belgium. The Belgian gas
consumption is divided over H-gas or high calorific gas and L-gas or low calorific gas, which we
will treat separately.
September 14
Risk assessment Belgium 26
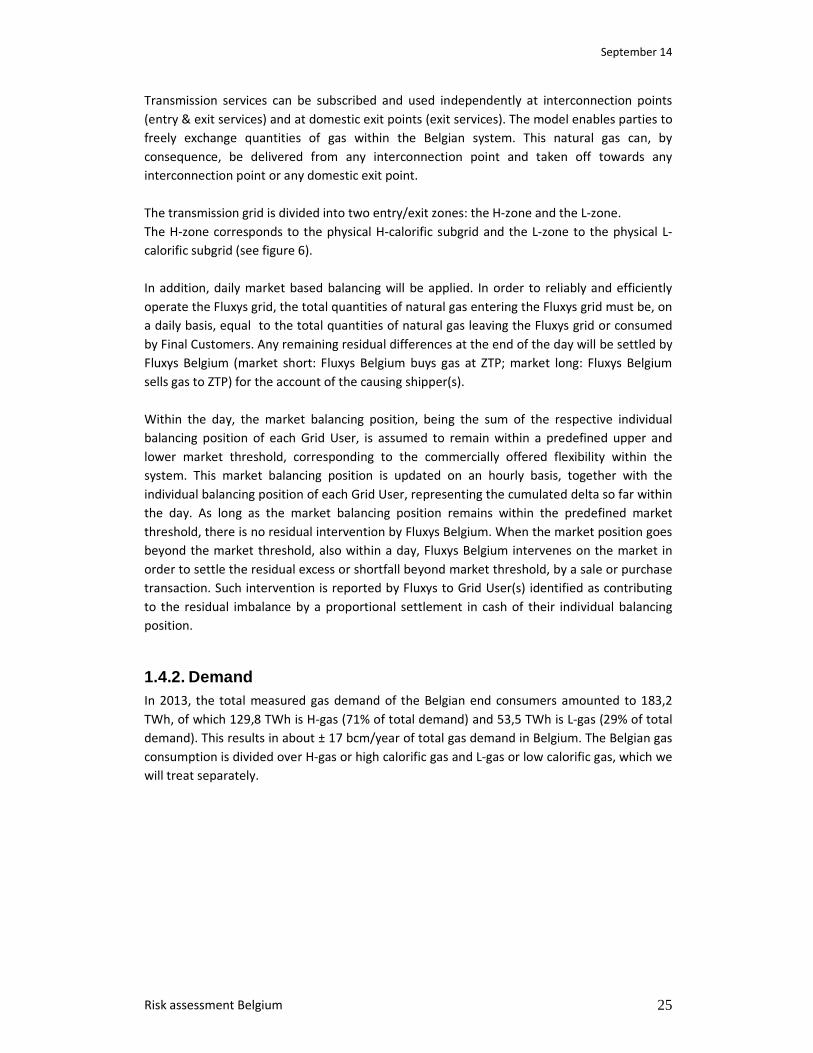
1.4.2.1. Evolution of the yearly gas demand
Table 6: Ranking of the coldest gas years according to the Degree Days (DD)
Ranking GasYear DDeq
DDeq
corr.
18 1969 2.670 2.517
17 1952 2.751 2.535
16 1983 2.643 2.542
15 1961 2.729 2.547
14 1916 2.906 2.556
13 1984 2.661 2.564
12 1923 2.894 2.570
11 1964 2.746 2.575
10 1939 2.847 2.583
9 1986 2.678 2.589
8 1940 2.882 2.622
7 1928 2.944 2.638
6 1995 2.696 2.641
5 1941 2.915 2.658
4 1955 2.893 2.688
3 1978 2.807 2.688
2 1985 2.901 2.808
1 1962 3.040 2.861
Most of the gas consumption on the distribution network is used for heating, it is very
sensitive to the outside temperature. Therefore the number of degree days will have a
significant influence on the consumption. Also the pattern of the degree days over the year
will have an influence on the consumption. The consumption of the industry is to a lesser
extent influenced by the outside temperature.
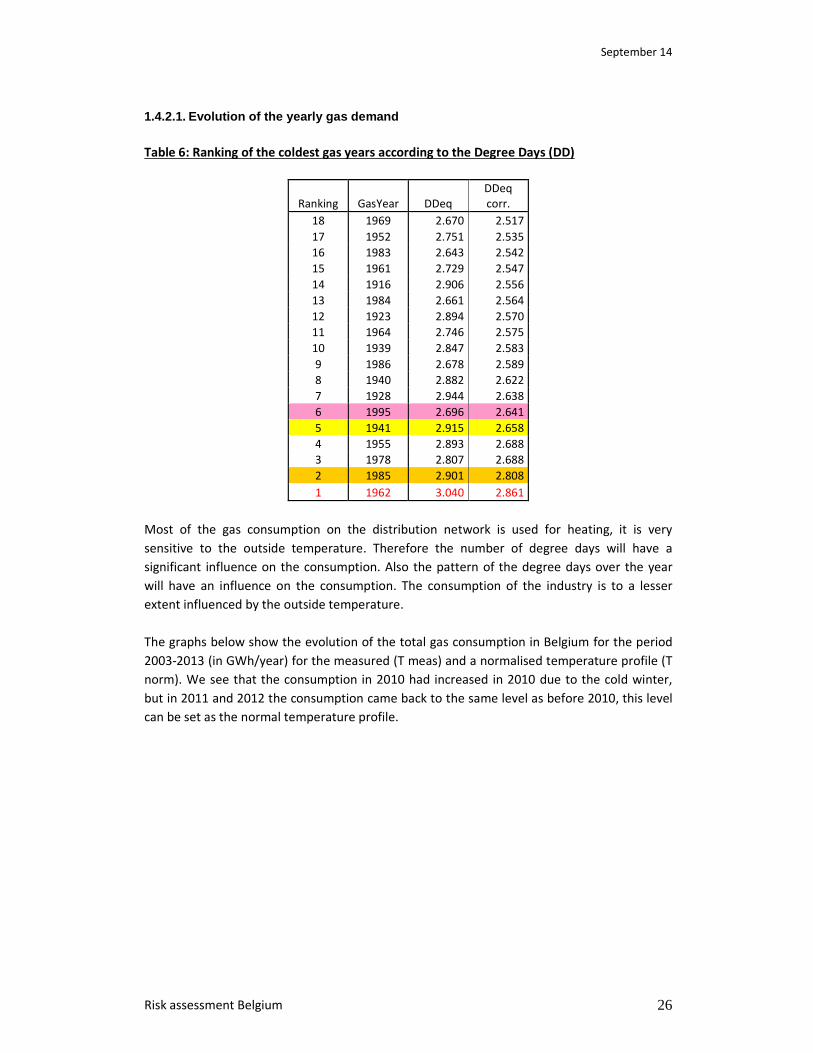
The graphs below show the evolution of the total gas consumption in Belgium for the period
2003-2013 (in GWh/year) for the measured (T meas) and a normalised temperature profile (T
norm). We see that the consumption in 2010 had increased in 2010 due to the cold winter,
but in 2011 and 2012 the consumption came back to the same level as before 2010, this level
can be set as the normal temperature profile.
September 14
Risk assessment Belgium 27
Figure 7: Total measured yearly consumption from 2004-2013 (in TWh)
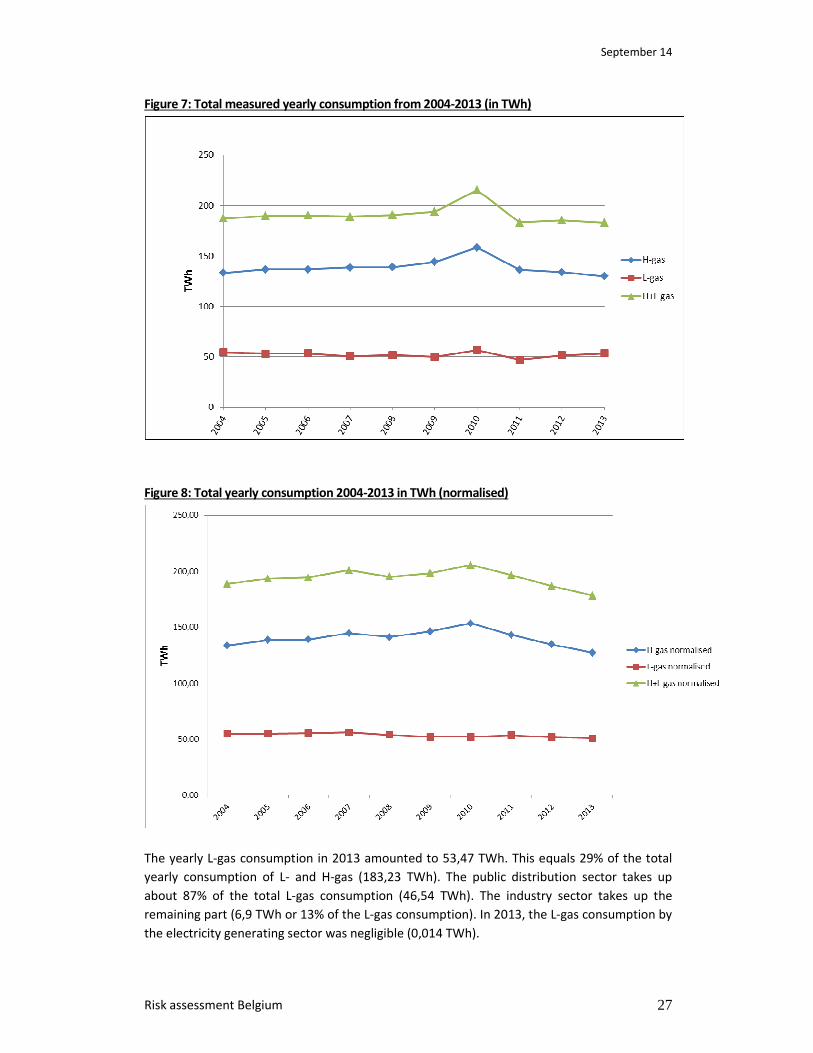
Figure 8: Total yearly consumption 2004-2013 in TWh (normalised)
The yearly L-gas consumption in 2013 amounted to 53,47 TWh. This equals 29% of the total
yearly consumption of L- and H-gas (183,23 TWh). The public distribution sector takes up
about 87% of the total L-gas consumption (46,54 TWh). The industry sector takes up the
remaining part (6,9 TWh or 13% of the L-gas consumption). In 2013, the L-gas consumption by
the electricity generating sector was negligible (0,014 TWh).
September 14
Risk assessment Belgium 28
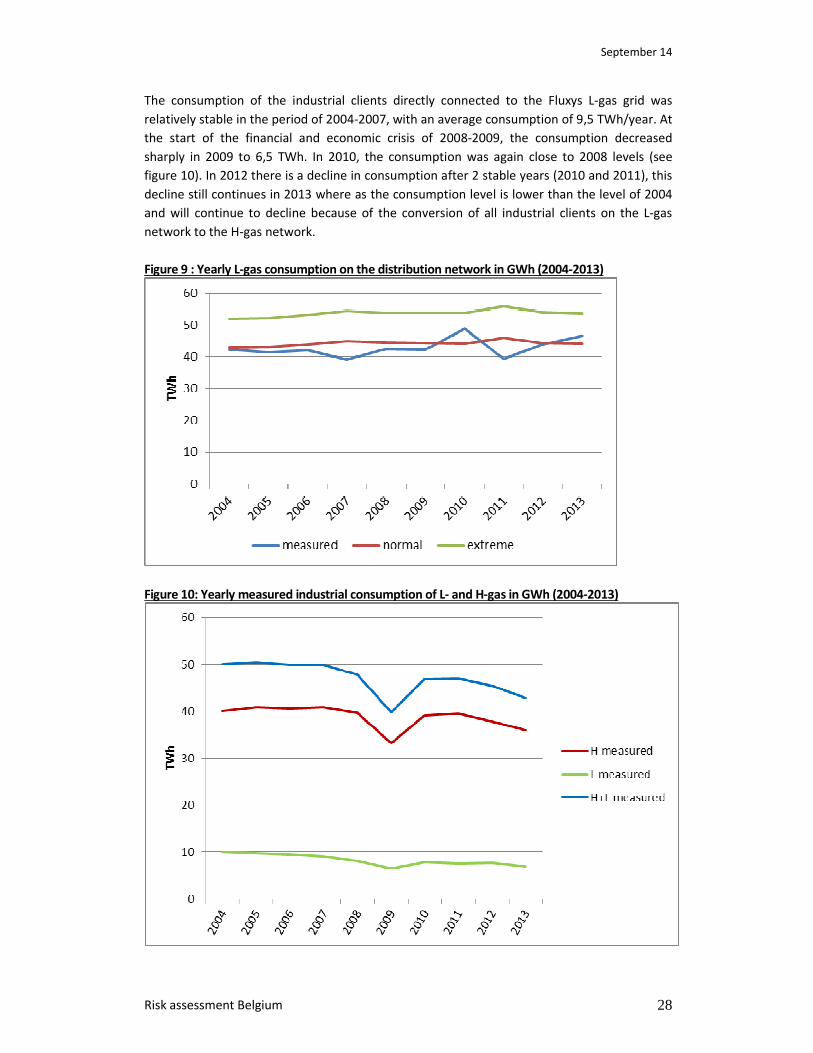
The consumption of the industrial clients directly connected to the Fluxys L-gas grid was
relatively stable in the period of 2004-2007, with an average consumption of 9,5 TWh/year. At
the start of the financial and economic crisis of 2008-2009, the consumption decreased
sharply in 2009 to 6,5 TWh. In 2010, the consumption was again close to 2008 levels (see
figure 10). In 2012 there is a decline in consumption after 2 stable years (2010 and 2011), this
decline still continues in 2013 where as the consumption level is lower than the level of 2004
and will continue to decline because of the conversion of all industrial clients on the L-gas
network to the H-gas network.
Figure 9 : Yearly L-gas consumption on the distribution network in GWh (2004-2013)
Figure 10: Yearly measured industrial consumption of L- and H-gas in GWh (2004-2013)
September 14
Risk assessment Belgium 29
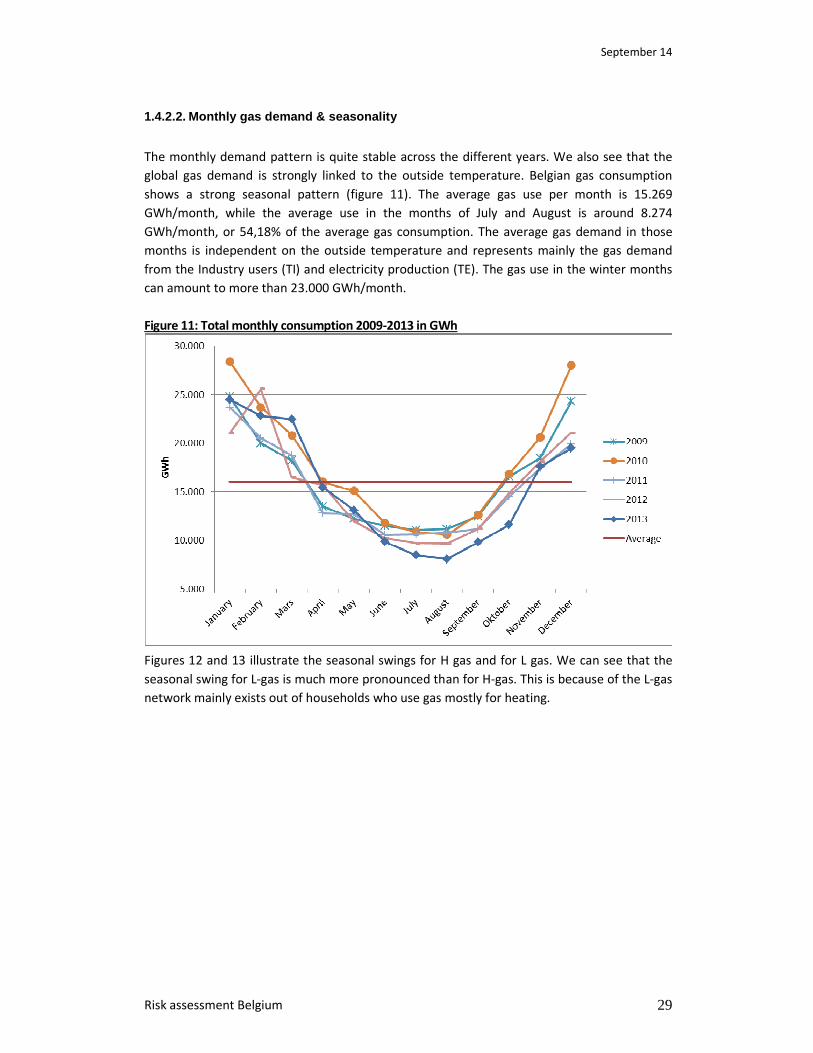
1.4.2.2. Monthly gas demand & seasonality
The monthly demand pattern is quite stable across the different years. We also see that the
global gas demand is strongly linked to the outside temperature. Belgian gas consumption
shows a strong seasonal pattern (figure 11). The average gas use per month is 15.269
GWh/month, while the average use in the months of July and August is around 8.274
GWh/month, or 54,18% of the average gas consumption. The average gas demand in those
months is independent on the outside temperature and represents mainly the gas demand
from the Industry users (TI) and electricity production (TE). The gas use in the winter months
can amount to more than 23.000 GWh/month.
Figure 11: Total monthly consumption 2009-2013 in GWh
Figures 12 and 13 illustrate the seasonal swings for H gas and for L gas. We can see that the
seasonal swing for L-gas is much more pronounced than for H-gas. This is because of the L-gas
network mainly exists out of households who use gas mostly for heating.
September 14
Risk assessment Belgium 30
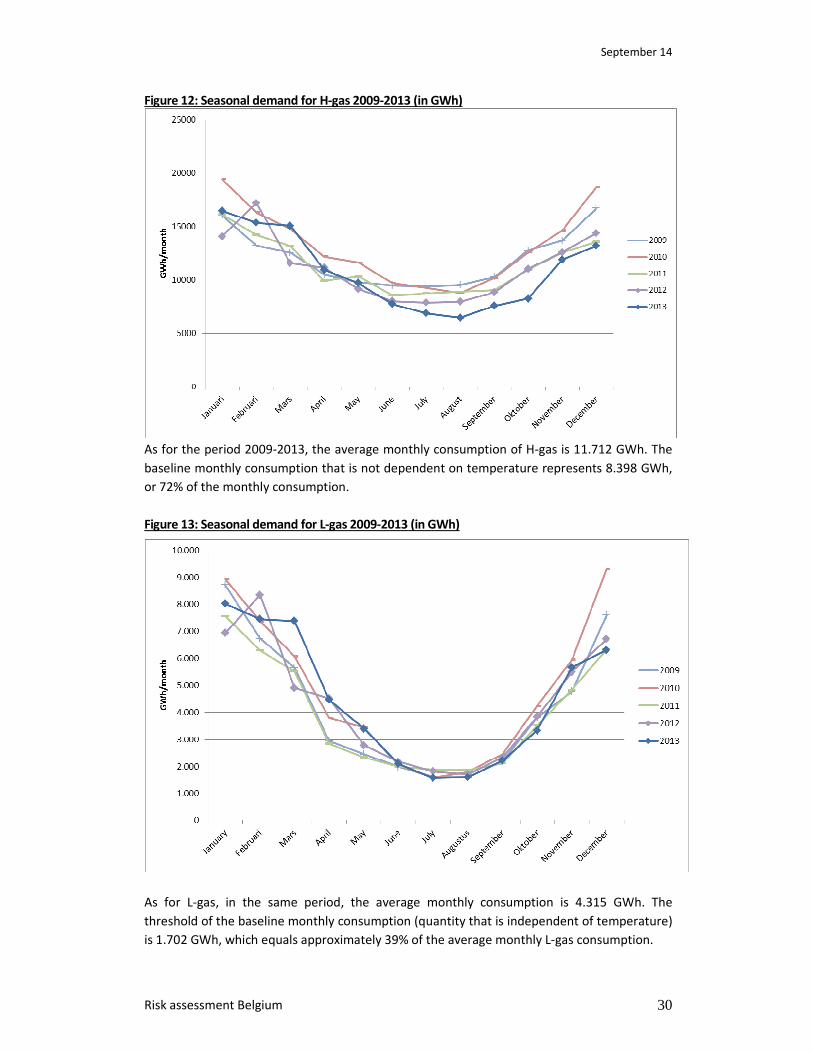
Figure 12: Seasonal demand for H-gas 2009-2013 (in GWh)
As for the period 2009-2013, the average monthly consumption of H-gas is 11.712 GWh. The
baseline monthly consumption that is not dependent on temperature represents 8.398 GWh,
or 72% of the monthly consumption.
Figure 13: Seasonal demand for L-gas 2009-2013 (in GWh)
As for L-gas, in the same period, the average monthly consumption is 4.315 GWh. The
threshold of the baseline monthly consumption (quantity that is independent of temperature)
is 1.702 GWh, which equals approximately 39% of the average monthly L-gas consumption.

September 14
Risk assessment Belgium 31
It can be concluded that L-gas consumption is relatively more volatile during the year,
compared to H-gas. The fact that 87% of all the L-gas is consumed by the public distribution
sector can explain this higher volatility.
1.4.2.3. Peak day demand vs. average day demand
Table 7 illustrates the considerable difference between the gas demand on an average day
and the peak demand day. This difference results in a very high peak day/average day ratio. In
Belgium, peak day demand can be three times (300%) as high as an average day. Compared to
other NW-European countries, Belgium has the third highest ratio. This high ratio can be
explained by the high share of household demand, which can be very volatile in function of
the temperature. Other countries have a lower share of the residential sector, but higher
share of industry demand. This industry demand is mostly quite stable throughout the year
and consequently results in a lower ratio peak day/average day demand. Obviously, this ratio
has an impact on the needed infrastructure capacity.
Table 7: Average demand vs. peak demand in NW EU (in GWh/day)
Capacity (in GWh/day) IRL UK F D NL BE LU Nw-EU
2013 264 5.334 4.512 5.215 4.468 1.500 72 21.365
2018 298 4.993 4.551 4.969 4.590 1.814 78 21.292
2022 313 4.659 4.537 4.793 4.666 1.878 82 20.928
2013 152 2.258 1.416 2.436 1.208 552 39 8.060
2018 172 2.409 1.499 2.321 1.182 603 40 8.226
2022 184 2.201 1.522 2.238 1.160 619 41 7.965
2013 174% 236% 319% 214% 370% 272% 183% 265%
2018 173% 207% 304% 214% 388% 301% 194% 259%
2022 170% 212% 298% 214% 402% 303% 202% 263%
Demand (Peak
Day)
Demand
(Average day)
Ratio Peak
Day/Average Day Source: ENTSOG TYNDP
Below 16,5°C, the gas consumption is mainly influenced by the outside temperature, or more
exactly by the number of degree days (DD). As shown in figure 14, peak consumption
corresponds generally with a day that registered a high number of DD. Some days note a
lower consumption than would be expected by the DD. This can be explained either by the
consumption on weekends or holidays, and because the consumption on a peak day is also
dependant on the conditions before and after the peak day.

September 14
Risk assessment Belgium 32
We start from the basic principle that the peak consumption is obtained at a winter peak day.
A winter peak day is considered as one day with extreme temperature occurring with a
statistical probability of once in 20 years conform the provisions of article 8 of the regulation
994/2010 EC for the infrastructure criteria.
Figure 14 : Correlation between DD and gas consumption
To be able to find the number of DD corresponding to the equivalent temperature occurring
with a statistical probability of once in 20 years, we have to observe values in January,
statistically the coldest month of the year. We look for the 15 days representing the coldest
day temperatures in the last 100 years. The table below shows us that the fifth value
registered in the last 100 years gives us 27,4 DD or an equivalent temperature of -10,9°C. It is
worth noting that of those 15 values, 10 were recorded in the last 30 years.
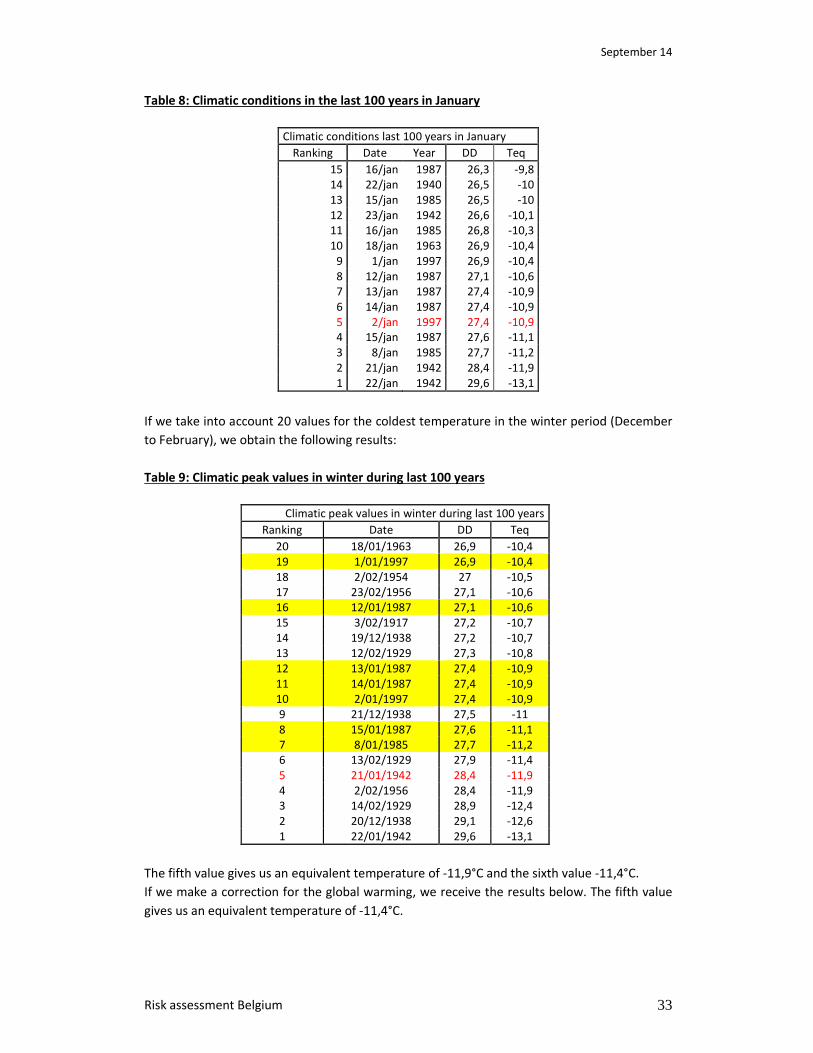
September 14
Risk assessment Belgium 33
Table 8: Climatic conditions in the last 100 years in January
Climatic conditions last 100 years in January
Ranking Date Year DD Teq
15 16/jan 1987 26,3 -9,8
14 22/jan 1940 26,5 -10
13 15/jan 1985 26,5 -10
12 23/jan 1942 26,6 -10,1
11 16/jan 1985 26,8 -10,3
10 18/jan 1963 26,9 -10,4
9 1/jan 1997 26,9 -10,4
8 12/jan 1987 27,1 -10,6
7 13/jan 1987 27,4 -10,9
6 14/jan 1987 27,4 -10,9
5 2/jan 1997 27,4 -10,9
4 15/jan 1987 27,6 -11,1
3 8/jan 1985 27,7 -11,2
2 21/jan 1942 28,4 -11,9
1 22/jan 1942 29,6 -13,1
If we take into account 20 values for the coldest temperature in the winter period (December
to February), we obtain the following results:
Table 9: Climatic peak values in winter during last 100 years
Climatic peak values in winter during last 100 years
Ranking Date DD Teq
20 18/01/1963 26,9 -10,4
19 1/01/1997 26,9 -10,4
18 2/02/1954 27 -10,5
17 23/02/1956 27,1 -10,6
16 12/01/1987 27,1 -10,6
15 3/02/1917 27,2 -10,7
14 19/12/1938 27,2 -10,7
13 12/02/1929 27,3 -10,8
12 13/01/1987 27,4 -10,9
11 14/01/1987 27,4 -10,9
10 2/01/1997 27,4 -10,9
9 21/12/1938 27,5 -11
8 15/01/1987 27,6 -11,1
7 8/01/1985 27,7 -11,2
6 13/02/1929 27,9 -11,4
5 21/01/1942 28,4 -11,9
4 2/02/1956 28,4 -11,9
3 14/02/1929 28,9 -12,4
2 20/12/1938 29,1 -12,6
1 22/01/1942 29,6 -13,1
The fifth value gives us an equivalent temperature of -11,9°C and the sixth value -11,4°C.
If we make a correction for the global warming, we receive the results below. The fifth value
gives us an equivalent temperature of -11,4°C.
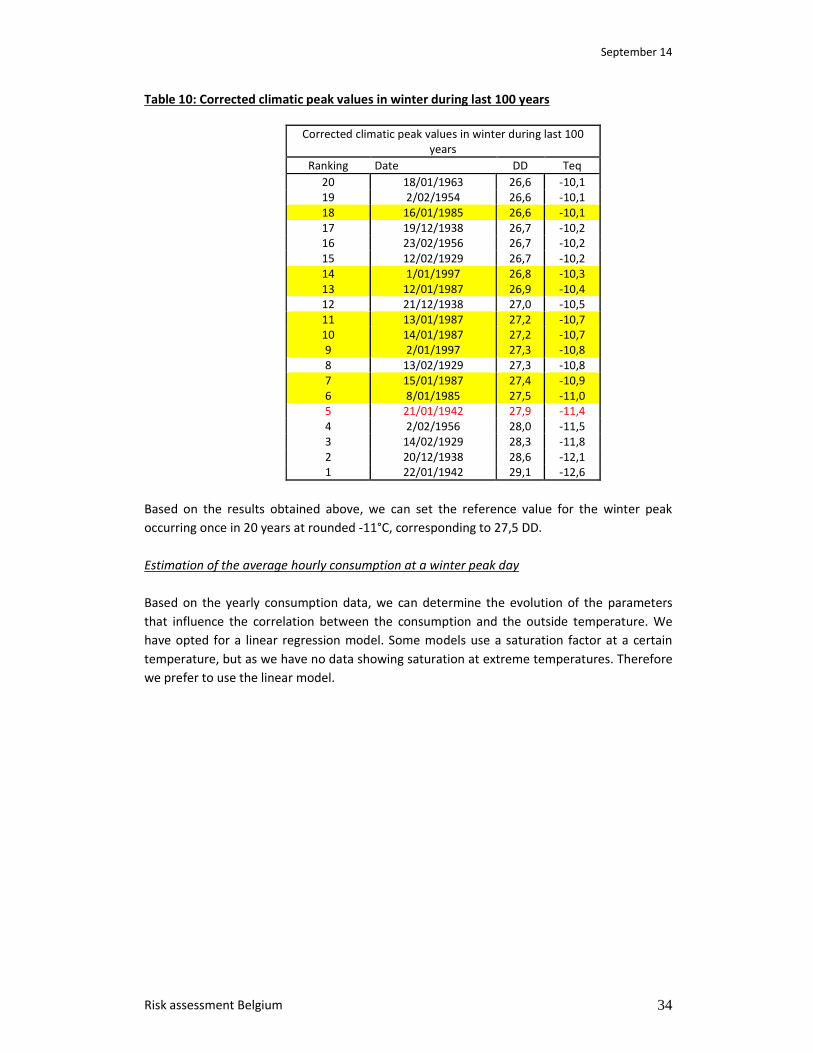
September 14
Risk assessment Belgium 34
Table 10: Corrected climatic peak values in winter during last 100 years
Corrected climatic peak values in winter during last 100
years
Ranking Date DD Teq
20 18/01/1963 26,6 -10,1
19 2/02/1954 26,6 -10,1
18 16/01/1985 26,6 -10,1
17 19/12/1938 26,7 -10,2
16 23/02/1956 26,7 -10,2
15 12/02/1929 26,7 -10,2
14 1/01/1997 26,8 -10,3
13 12/01/1987 26,9 -10,4
12 21/12/1938 27,0 -10,5
11 13/01/1987 27,2 -10,7
10 14/01/1987 27,2 -10,7
9 2/01/1997 27,3 -10,8
8 13/02/1929 27,3 -10,8
7 15/01/1987 27,4 -10,9
6 8/01/1985 27,5 -11,0
5 21/01/1942 27,9 -11,4
4 2/02/1956 28,0 -11,5
3 14/02/1929 28,3 -11,8
2 20/12/1938 28,6 -12,1
1 22/01/1942 29,1 -12,6
Based on the results obtained above, we can set the reference value for the winter peak
occurring once in 20 years at rounded -11°C, corresponding to 27,5 DD.
Estimation of the average hourly consumption at a winter peak day
Based on the yearly consumption data, we can determine the evolution of the parameters
that influence the correlation between the consumption and the outside temperature. We
have opted for a linear regression model. Some models use a saturation factor at a certain
temperature, but as we have no data showing saturation at extreme temperatures. Therefore
we prefer to use the linear model.
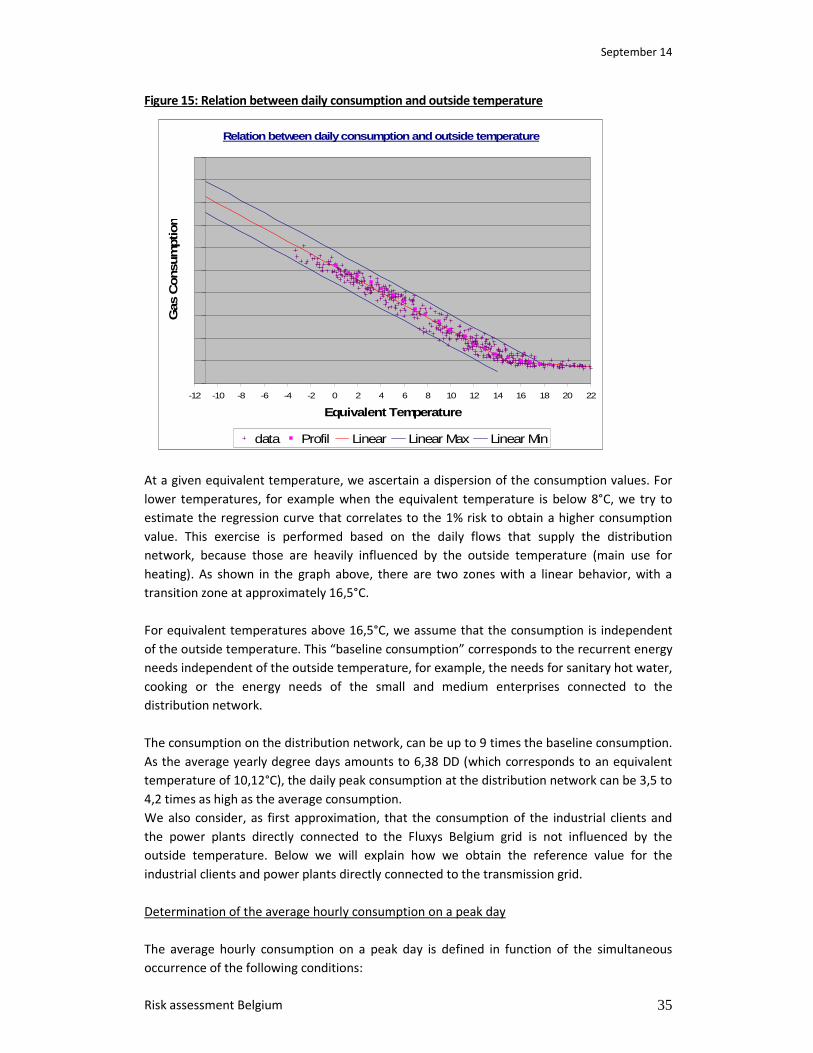
September 14
Risk assessment Belgium 35
Figure 15: Relation between daily consumption and outside temperature
At a given equivalent temperature, we ascertain a dispersion of the consumption values. For
lower temperatures, for example when the equivalent temperature is below 8°C, we try to
estimate the regression curve that correlates to the 1% risk to obtain a higher consumption
value. This exercise is performed based on the daily flows that supply the distribution
network, because those are heavily influenced by the outside temperature (main use for
heating). As shown in the graph above, there are two zones with a linear behavior, with a
transition zone at approximately 16,5°C.
For equivalent temperatures above 16,5°C, we assume that the consumption is independent
of the outside temperature. This “baseline consumption” corresponds to the recurrent energy
needs independent of the outside temperature, for example, the needs for sanitary hot water,
cooking or the energy needs of the small and medium enterprises connected to the
distribution network.
The consumption on the distribution network, can be up to 9 times the baseline consumption.
As the average yearly degree days amounts to 6,38 DD (which corresponds to an equivalent
temperature of 10,12°C), the daily peak consumption at the distribution network can be 3,5 to
4,2 times as high as the average consumption.
We also consider, as first approximation, that the consumption of the industrial clients and
the power plants directly connected to the Fluxys Belgium grid is not influenced by the
outside temperature. Below we will explain how we obtain the reference value for the
industrial clients and power plants directly connected to the transmission grid.
Determination of the average hourly consumption on a peak day
The average hourly consumption on a peak day is defined in function of the simultaneous
occurrence of the following conditions:
Relation between daily consumption and outside temperature
-12 -10 -8 -6 -4 -2 0 2 4 6 8 10 12 14 16 18 20 22
Equivalent Temperature
Gas
Consu
mption
.
data Profil Linear Linear Max Linear Min
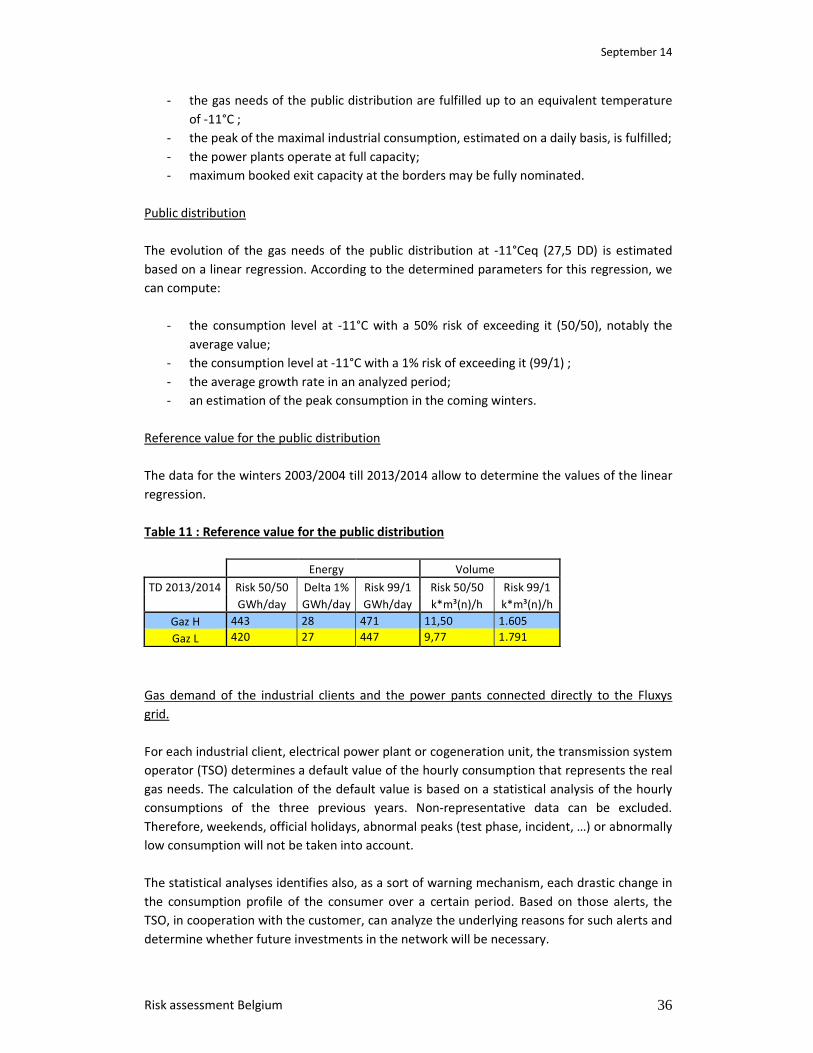
September 14
Risk assessment Belgium 36
- the gas needs of the public distribution are fulfilled up to an equivalent temperature
of -11°C ;
- the peak of the maximal industrial consumption, estimated on a daily basis, is fulfilled;
- the power plants operate at full capacity;
- maximum booked exit capacity at the borders may be fully nominated.
Public distribution
The evolution of the gas needs of the public distribution at -11°Ceq (27,5 DD) is estimated
based on a linear regression. According to the determined parameters for this regression, we
can compute:
- the consumption level at -11°C with a 50% risk of exceeding it (50/50), notably the
average value;
- the consumption level at -11°C with a 1% risk of exceeding it (99/1) ;
- the average growth rate in an analyzed period;
- an estimation of the peak consumption in the coming winters.
Reference value for the public distribution
The data for the winters 2003/2004 till 2013/2014 allow to determine the values of the linear
regression.
Table 11 : Reference value for the public distribution
Energy Volume
TD 2013/2014 Risk 50/50 Delta 1% Risk 99/1 Risk 50/50 Risk 99/1
GWh/day GWh/day GWh/day k*m³(n)/h k*m³(n)/h
Gaz H 443 28 471 11,50 1.605
Gaz L 420 27 447 9,77 1.791
Gas demand of the industrial clients and the power pants connected directly to the Fluxys
grid.
For each industrial client, electrical power plant or cogeneration unit, the transmission system
operator (TSO) determines a default value of the hourly consumption that represents the real
gas needs. The calculation of the default value is based on a statistical analysis of the hourly
consumptions of the three previous years. Non-representative data can be excluded.
Therefore, weekends, official holidays, abnormal peaks (test phase, incident, …) or abnormally
low consumption will not be taken into account.
The statistical analyses identifies also, as a sort of warning mechanism, each drastic change in
the consumption profile of the consumer over a certain period. Based on those alerts, the
TSO, in cooperation with the customer, can analyze the underlying reasons for such alerts and
determine whether future investments in the network will be necessary.
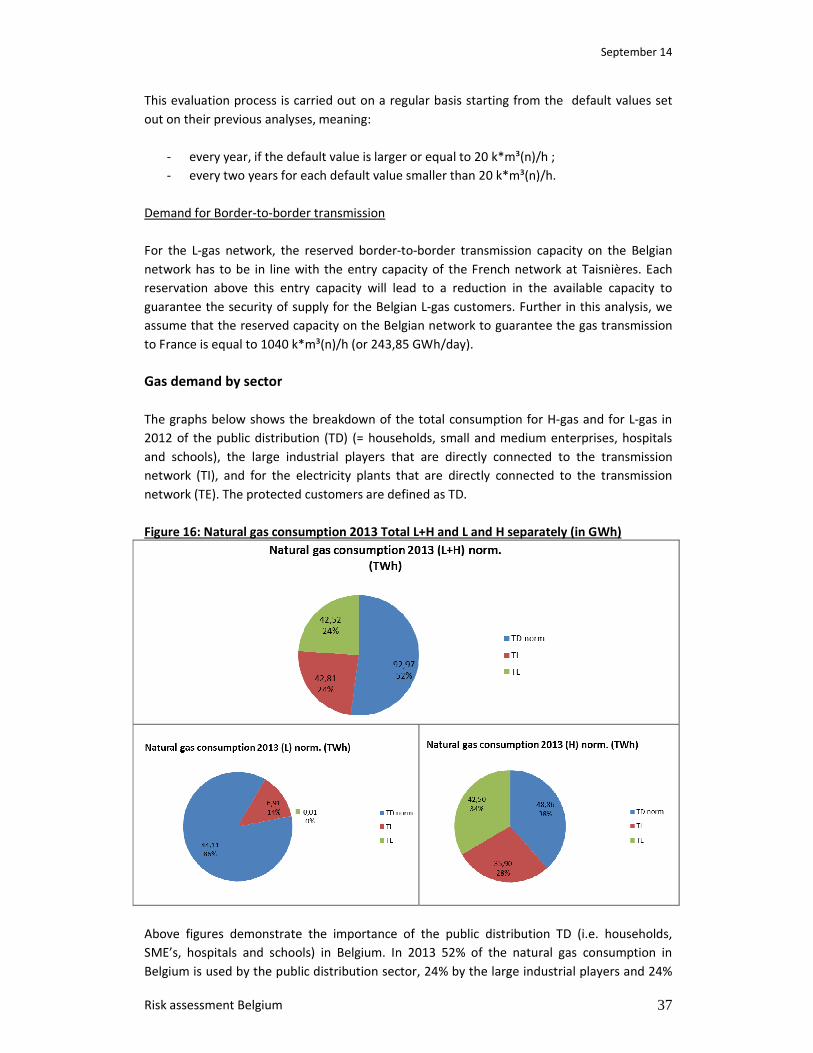
September 14
Risk assessment Belgium 37
This evaluation process is carried out on a regular basis starting from the default values set
out on their previous analyses, meaning:
- every year, if the default value is larger or equal to 20 k*m³(n)/h ;
- every two years for each default value smaller than 20 k*m³(n)/h.
Demand for Border-to-border transmission
For the L-gas network, the reserved border-to-border transmission capacity on the Belgian
network has to be in line with the entry capacity of the French network at Taisnières. Each
reservation above this entry capacity will lead to a reduction in the available capacity to
guarantee the security of supply for the Belgian L-gas customers. Further in this analysis, we
assume that the reserved capacity on the Belgian network to guarantee the gas transmission
to France is equal to 1040 k*m³(n)/h (or 243,85 GWh/day).
Gas demand by sector
The graphs below shows the breakdown of the total consumption for H-gas and for L-gas in
2012 of the public distribution (TD) (= households, small and medium enterprises, hospitals
and schools), the large industrial players that are directly connected to the transmission
network (TI), and for the electricity plants that are directly connected to the transmission
network (TE). The protected customers are defined as TD.
Figure 16: Natural gas consumption 2013 Total L+H and L and H separately (in GWh)
Above figures demonstrate the importance of the public distribution TD (i.e. households,
SME’s, hospitals and schools) in Belgium. In 2013 52% of the natural gas consumption in
Belgium is used by the public distribution sector, 24% by the large industrial players and 24%
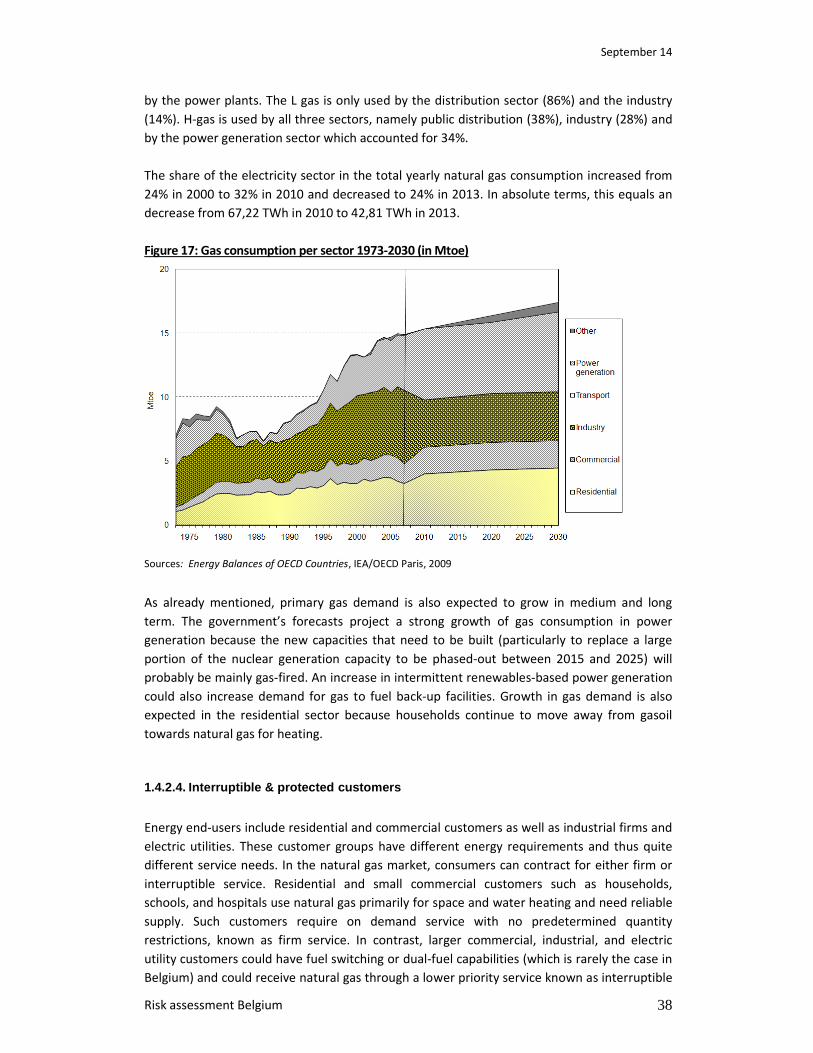
September 14
Risk assessment Belgium 38
by the power plants. The L gas is only used by the distribution sector (86%) and the industry
(14%). H-gas is used by all three sectors, namely public distribution (38%), industry (28%) and
by the power generation sector which accounted for 34%.
The share of the electricity sector in the total yearly natural gas consumption increased from
24% in 2000 to 32% in 2010 and decreased to 24% in 2013. In absolute terms, this equals an
decrease from 67,22 TWh in 2010 to 42,81 TWh in 2013.
Figure 17: Gas consumption per sector 1973-2030 (in Mtoe)
Sources: Energy Balances of OECD Countries, IEA/OECD Paris, 2009
As already mentioned, primary gas demand is also expected to grow in medium and long
term. The government’s forecasts project a strong growth of gas consumption in power
generation because the new capacities that need to be built (particularly to replace a large
portion of the nuclear generation capacity to be phased-out between 2015 and 2025) will
probably be mainly gas-fired. An increase in intermittent renewables-based power generation
could also increase demand for gas to fuel back-up facilities. Growth in gas demand is also
expected in the residential sector because households continue to move away from gasoil
towards natural gas for heating.
1.4.2.4. Interruptible & protected customers
Energy end-users include residential and commercial customers as well as industrial firms and
electric utilities. These customer groups have different energy requirements and thus quite
different service needs. In the natural gas market, consumers can contract for either firm or
interruptible service. Residential and small commercial customers such as households,
schools, and hospitals use natural gas primarily for space and water heating and need reliable
supply. Such customers require on demand service with no predetermined quantity
restrictions, known as firm service. In contrast, larger commercial, industrial, and electric
utility customers could have fuel switching or dual-fuel capabilities (which is rarely the case in
Belgium) and could receive natural gas through a lower priority service known as interruptible

September 14
Risk assessment Belgium 39
service. In theory, energy supply reliability could be effectively handled at the customer level
ability to switch quickly to an alternative fuel. Therefore, some countries distinguish between
protected customers for whom most of the capacity offered is firm capacity. In Belgium,
interruptible capacity is only offered if all the firm capacity is booked by the shippers.
The definition of protected customers in the regulation states that protected customers
include all household customers connected to a gas distribution network and can also include
small and medium sized enterprises and essential social services connected to the gas
distribution network provided that these additional customers do not represent more than
20% of the final gas use.
The regulation defines the protected customers as all household customers connected to a
gas distribution network and may also include:
- small and medium-sized enterprises connected to the distribution network and
essential social services connected to the gas distribution or transmission network
if they do not represent more than 20% of the final gas use
- district heating installations to the extent that they deliver heating to household
customers and to customers mentioned above provided that these installations
are not able to switch to other fuels and that they are connected to the
distribution or transmission network.
For Belgium the protected customers are defined as all customers connected to the
distribution network. One of the reasons is that a selective shut off is not possible on the
distribution network. Protected customers represent about 50% of the total gas demand.
Most of this demand stems from household consumers. It might be useful to study (in
consultation with the distribution network operators) if it could be possible for the
telemeasured clients to reduce their consumption in case of an emergency.
Table 12 gives a detailed overview of the consumption profiles on the distribution network
during the winter peak.
Table 12: Consumption profiles and their representation on the distribution network
2012-2013 S30 S31 S32 S41 S31+S32+S41
H 10,13% 12,63% 19,90% 57,34% 89,87%
L 13,34% 12,14% 19,62% 54,91% 86,67%
There are 4 consumption profiles on the distribution network: S30, S31, S32 and S41. The
household customers are represented under category S41. Their consumption is heavily
reliable on the outside temperature. The other three profiles dispose of a VAT number and
correspond to the tertiary, commercial and industrial sector.
The profiles S31 and S32 are the non-telemeasured clients. S31 are the commercial clients
that consume less than 150.000 KWh/year, S32 clients consume more than 150.000
KWh/year. The gas consumption of those clients is dependent on the outside temperature so
they are close to household consumers.
September 14
Risk assessment Belgium 40
The profile S30 represents the telemeasured clients. Those are the larger (industrial) clients
with an hourly counting of the gas consumption (hospitals, administrative buildings, large
supermarkets,…) connected to the distribution grid. We can see that the gas consumption of
these consumers (except for the hospitals) is less dependent on the outside temperature. The
consumption of those clients represents less than 20% of the total gas demand.
Contrary to the protected customers, the gas supply to industrial consumers connected to the
Fluxys transport network could be interrupted. Historically, the infrastructure for transporting
and delivering natural gas is designed and operated primarily to meet the need for firm
service. Because the peak demand for natural gas tends to be seasonal, interruptible service
contracts allow pipeline and distribution system operators to increase on of their fixed assets
and better manage costs of service on average. These arrangements allow operators to
maximize economic efficiency by meeting the needs of their committed firm service
customers while providing delivery during off peak periods to interruptible and seasonal
customers. In the past, these arrangements provided opportunities for large-volume energy
consumers such as industrial firms and electric generators to attain lower-cost energy
supplies.
There are two kinds of interruptible contracts:
1. Supplier interruption:
Suppliers have the right to interrupt the customer, normally in return for a discount on
price and with some notice in advance. The notice period will be specified in the energy
contract. Most interruptible contracts specify that there will only be a few hours’ notice,
unless it is specified otherwise in the contract. Customers with an interruptible contract
have agreed to receive gas but are willing to have supply interrupted at some point,
according to the reasons in the contract (mostly meteorological circumstances) and for a
maximum amount of hours or days.
Interruptible contracts are more and more disappearing from the stage. This is due to the
fact that the attributed discounts are no longer a sufficient incentive on the longer term.
In the industrial sector, interruptible contracts account for less than 5% of the total
contracted volumes between end users and suppliers. Interruptions are also limited to
force majeure events. For the power plants, we also see a tendency towards more firm
contracts (depends a lot on the supplier).
2. Transporter or border-to-border interruption:
The TSO has the right to interrupt supply (this is to interruptible contracted customers) in
the network for operational reasons under normal circumstances. Again this will be
covered in the transmission contract signed by the network user. Interruptible capacity is
hardly booked by the shippers because Fluxys only offers interruptible capacity to the
market if there is no firm capacity left. Even if Fluxys would offer interruptible capacity,
the price difference between interruptible and firm capacity has become too small to be
an incentive. Therefore we can say that interruptible capacity for the shippers is negligible
in Belgium.
We have to be clear however that the above mentioned interruptions are separate to other
interruption rights, which exist for use only in potential or actual emergency situations. In
September 14
Risk assessment Belgium 41
emergency situations, some companies can reduce demand considerably when prices are high
or maintain production by switching to back-up fuels. However, they still need to maintain a
certain level of gas to keep systems going and to let their plant safely shut down.
At any point an accident could damage a major part of the gas infrastructure and cut off
supply. Some gas users have back-up systems and fuels to switch to in the event of an
emergency or if commercial incentives make using an alternative fuel source preferable. Not
every gas user has back up fuels (most of the end consumers in Belgium do not have back up
fuels), so the gas system and the procedures that exist within it are designed to minimise the
risk of gas being switched off from those who don’t expect it to be (those not on interruptible
contracts). Appliances for commercial premises generally incorporate flame out safety
devices. These allow for supplies to be quickly and safely reinstated following a cessation in
gas supplies.
In the unlikely event of an emergency, the safe provision of gas to domestic users and other
low volume users (all connected to the distribution network) is the top priority. Before firm
customers are interrupted, emergency plans provide for the suspension of the normal market
for gas. After the suspension, it will depend on how quickly gas supply and demand is
balanced, before firm customers start to be interrupted. Before firm customers are
interrupted, firm border-to-border transmission will be interrupted. Public appeals may take
place asking the public to restrain gas usage but this would depend on the type of emergency.
1.4.2.5. Fuel switching
Fuel switching capability is the short-term capability of a manufacturing establishment to have
used substitute energy sources in place of those actually consumed. Capability to use
substitute energy sources means that the establishment's combustors (for example, boilers,
furnaces, ovens, and blast furnaces) had the machinery or equipment either in place or
available for installation so that substitutions could actually have been introduced within 30
days without extensive modifications. Fuel-switching capability does not depend on the
relative prices of energy sources; it depends only on the characteristics of the equipment and
certain legal constraints.
Fuel switching possibilities, short term switching away from the use of natural gas to another
fuel, are limited in Belgium. Fuel switching is only possible in the transformation sector and
for a very small part in the industry sector.
In Belgium there is no program in place in order to encourage or otherwise require users of
gas to switch to another fuel source in case of a disruption of natural gas supply. Also the new
power plants that are constructed do not have the build-in capability to switch fuel.
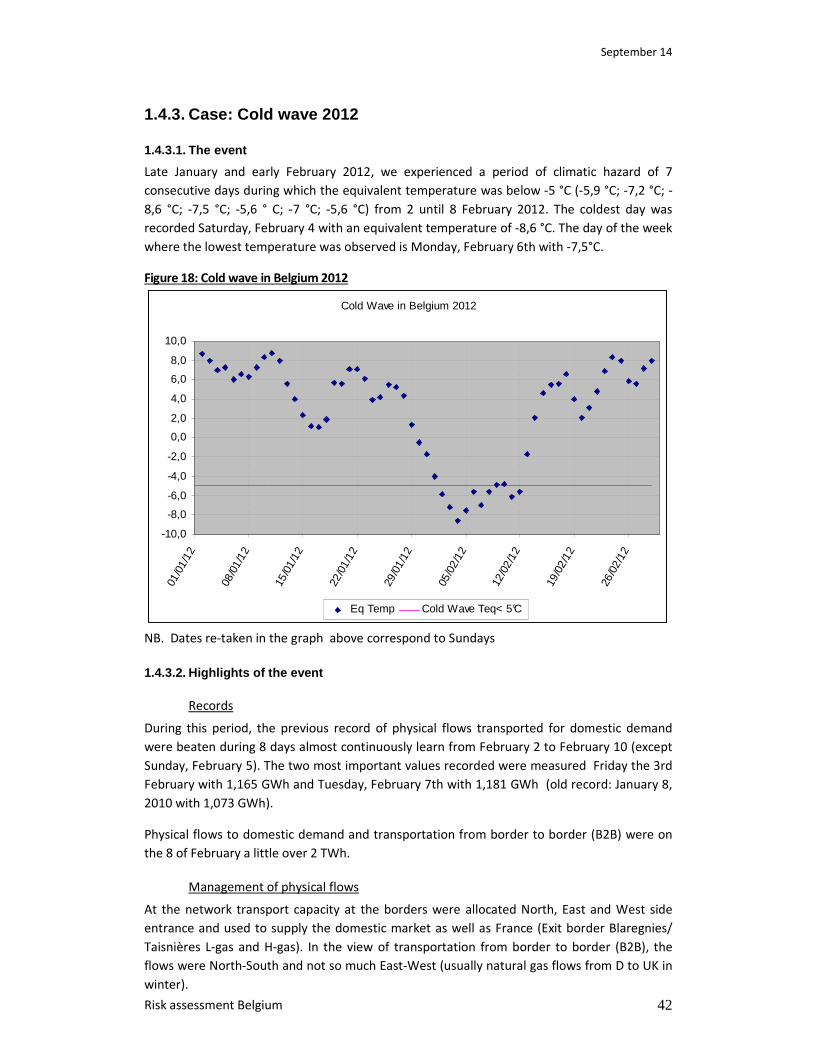
September 14
Risk assessment Belgium 42
1.4.3. Case: Cold wave 2012
1.4.3.1. The event
Late January and early February 2012, we experienced a period of climatic hazard of 7
consecutive days during which the equivalent temperature was below -5 °C (-5,9 °C; -7,2 °C; -
8,6 °C; -7,5 °C; -5,6 ° C; -7 °C; -5,6 °C) from 2 until 8 February 2012. The coldest day was
recorded Saturday, February 4 with an equivalent temperature of -8,6 °C. The day of the week
where the lowest temperature was observed is Monday, February 6th with -7,5°C.
Figure 18: Cold wave in Belgium 2012
Cold Wave in Belgium 2012
-10,0
-8,0
-6,0
-4,0
-2,0
0,0
2,0
4,0
6,0
8,0
10,0
01/0
1/12
08/0
1/12
15/0
1/12
22/0
1/12
29/0
1/12
05/0
2/12
12/0
2/12
19/0
2/12
26/0
2/12
Eq Temp Cold Wave Teq< 5°C
NB. Dates re-taken in the graph above correspond to Sundays
1.4.3.2. Highlights of the event
Records
During this period, the previous record of physical flows transported for domestic demand
were beaten during 8 days almost continuously learn from February 2 to February 10 (except
Sunday, February 5). The two most important values recorded were measured Friday the 3rd
February with 1,165 GWh and Tuesday, February 7th with 1,181 GWh (old record: January 8,
2010 with 1,073 GWh).
Physical flows to domestic demand and transportation from border to border (B2B) were on
the 8 of February a little over 2 TWh.
Management of physical flows
At the network transport capacity at the borders were allocated North, East and West side
entrance and used to supply the domestic market as well as France (Exit border Blaregnies/
Taisnières L-gas and H-gas). In the view of transportation from border to border (B2B), the
flows were North-South and not so much East-West (usually natural gas flows from D to UK in
winter).
September 14
Risk assessment Belgium 43
a)At entry side
More concretely during the two peak days of 7 and 8 February, the needs were provided as
followed on the entry points:
• 25% of the flows came from Norway via the Zeepipe
• 25% of the flow came from the Netherlands via the Poppel / Hilvarenbeek entrance and
was intended to serve the French and Belgian L-gas market.
• 13% of flows had been provided by the LNG terminal in Zeebrugge
• Between 10 and 11% flowed through the entry point of the Netherlands s'Gravenvoeren.
• -6% of flows had been imported from Germany via the interconnection point Eynatten (of
which 3% were immediately exported to Germany by the same point (see point b))
• Having regard to the possibilities of underground storage located in Belgium are limited,
the natural H-gas storage of Loenhout provided 7% of the needed gas
• In particularly 8% of flow came from the United Kingdom via the interconnector. In other
(more normal) winter circumstances the Interconnector is used as an exit point of the
Belgian network rather than as an entry point to serve the Belgian market.
b) at output side
Also during this same period of 2 days, the imported feeds have been allocated to the
following uses :
• between 60% and 63% was transported to the domestic market (national use)
• between 28% and 32% was exported to France
• 3% was exported respectively to the Netherlands and Germany and 2% to the Grand
Duchy of Luxembourg.
The level of domestic demand
Necessary to ensure home heating, energy needs had reached 90% of estimated needs in
climate scenario with a peak at -11°C.
Another point, the evolution of the consumption of gas for power generation was unusually
correlated to the outside temperature. If this electrical production was destined for the
Belgian market, this dependence would be relatively low. To fix ideas, the increase in
electricity consumption compared to the temperature is generally estimated in Belgium to 50
MW per degree less consumption for one day peak of between 12.000 MW and 14.500 MW.
The explanation may be found in the fact that an important part of this electricity was
exported to countries with a strong dependence of the power consumption compared to the
outside temperature (e.g. France). This point was confirmed by the Belgian electricity network
operator Elia.
Management Belgian TSO + cooperation between the TSO and the adjacent networks
At the Belgian TSO, there was nothing significant to report this period and was managed
without incident (considered " as usual " at this time of year).
At the level of cooperation, a continuous exchange of information took place between Fluxys
and the adjacent TSOs.

September 14
Risk assessment Belgium 44
Operation of the Hubs
The wholesale price of gas on its various hub followed the same trend and has little delayed,
which attempts to show that the markets remained highly interconnected.
1.5. Infrastructure
1.5.1. Pipelines
1.5.1.1. Overview of the pipeline network
Fluxys, Belgium’s transmission system operator, has a network of about 4.100 kilometres of
pipelines with 14 interconnection points and four compression stations. The 8 cross border
pipelines connects the Belgian gas market directly to Norway, UK, Germany, the Netherlands,
France and Luxembourg. The five compressor stations are located in:
- Weelde: The compression station in Weelde was upgraded in 2010 to increase the
pressure of low-calorific natural gas in the pipeline from Poppel on the Dutch
border to Blaregnies on the French border.
- Winksele: to increase pressure on the North/South axis. In 2010 the upgrade of
compression station was started to include four new compression units to
increase pressure on the East/West axis (VTN/ RTR1 and 2). Currently not yet in
use.
- Berneau: in 2010-2011 additional compression stations were built on the high
calorific gas pipeline from ‘s Gravenvoeren on the Dutch border to Blaregnies on
the French border and to export further on the VTN/RTR pipeline (Zeebrugge-
Zelzate/Eynatten.
- Zelzate: The Zelzate compressor station came on line at the end of 2008 to create
additional capacity for the overall rise in demand of the Belgian domestic market
and enables larger volumes to be transported to and from the underground
storage facility in Loenhout.
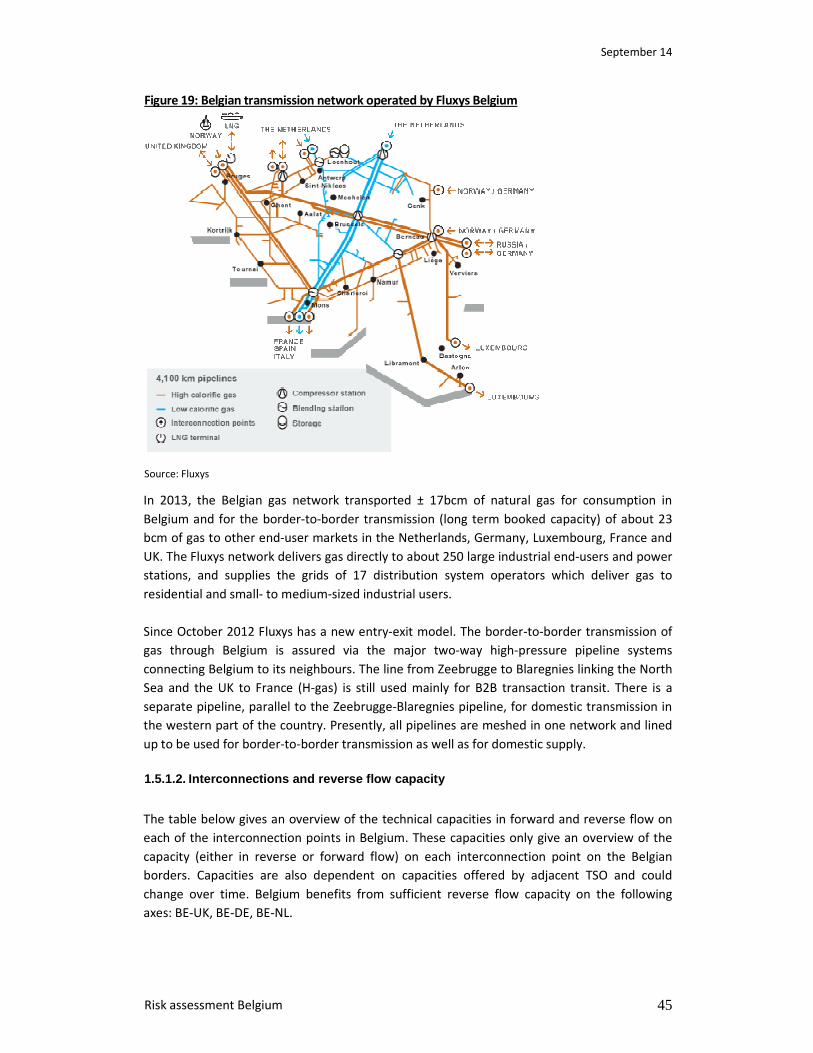
September 14
Risk assessment Belgium 45
Figure 19: Belgian transmission network operated by Fluxys Belgium
Source: Fluxys
In 2013, the Belgian gas network transported ± 17bcm of natural gas for consumption in
Belgium and for the border-to-border transmission (long term booked capacity) of about 23
bcm of gas to other end-user markets in the Netherlands, Germany, Luxembourg, France and
UK. The Fluxys network delivers gas directly to about 250 large industrial end-users and power
stations, and supplies the grids of 17 distribution system operators which deliver gas to
residential and small- to medium-sized industrial users.
Since October 2012 Fluxys has a new entry-exit model. The border-to-border transmission of
gas through Belgium is assured via the major two-way high-pressure pipeline systems
connecting Belgium to its neighbours. The line from Zeebrugge to Blaregnies linking the North
Sea and the UK to France (H-gas) is still used mainly for B2B transaction transit. There is a
separate pipeline, parallel to the Zeebrugge-Blaregnies pipeline, for domestic transmission in
the western part of the country. Presently, all pipelines are meshed in one network and lined
up to be used for border-to-border transmission as well as for domestic supply.
1.5.1.2. Interconnections and reverse flow capacity
The table below gives an overview of the technical capacities in forward and reverse flow on
each of the interconnection points in Belgium. These capacities only give an overview of the
capacity (either in reverse or forward flow) on each interconnection point on the Belgian
borders. Capacities are also dependent on capacities offered by adjacent TSO and could
change over time. Belgium benefits from sufficient reverse flow capacity on the following
axes: BE-UK, BE-DE, BE-NL.

September 14
Risk assessment Belgium 46
Table 13: Firm entry and exit capacity offered on the connection points (in mcm/d)
H
Connection point Type Firm capacity offered
2014 (mcm/d)
Firm capacity offered
2017 (mcm/d)
Entry Exit Entry Exit
IZT EP 64,800 78,000 74,400 78,000
LNG terminal 1 22,800 0,000 22,800 0,000
LNG terminal 2 LNG 22,800 0,000 22,800 0,000
ZPT EP 45,600 0,000 45,600 0,000
Alveringem EP 0,000 0,000 24,000 0,000
Zandvliet H EP 4,320 0,000 4,320 0,000
Zelzate 1 EP 34,800 16,800 34,800 16,800
Zelzate 2 EP 0,000 10,800 0,000 10,800
Eynatten 1 EP 18,000 16,800 18,000 16,800
Eynatten 2 EP 31,200 18,000 31,200 18,000
S Gravenvoeren +
Obbicht EP 31,200 0,000 31,200 0,000
Blaregnies H EP 0,000 60,000 0,000 60,000
Loenhout Storage S 15,000 7,800 15,000 7,800
Pétange & Bras (GD Lux) EP 0,000 4,320 0,000 4,320
L-inject EP 0,000 0,000 0,000 0,000
L
Poppel/Zandlviet L EP 65,520 0,000 65,520 0,000
Blaregnies L EP 0,000 27,360 0,000 27,360
Transfo H � L EP 9,600 8,640 9,600 8,640
∗ Alveringem will be online from 2016. Transfo H→ L is the entry capacity at the L-gas side and exit at the H-gas
side Source: Data compiled based on information of Fluxys
The VTN-RTR pipeline (H-gas) is bi-directional linking the Zeebrugge hub with Germany and
the Netherlands, the Segeo pipeline (H-gas) runs from the Dutch border in ‘s Gravenvoeren to
France and the Poppel-Blaregnies pipeline runs from north to south, linking the Netherlands
with France (L-gas). In 2010, the Zelzate entry point (physical bi-directional) came into
operation following investments in the Dutch grid through which the capacity on the east-
west axis increased. This also shored up the supply into the Belgian market and enabled
greater volumes of natural gas to be traded on the Zeebrugge hub. The Interconnector
Zeebrugge Terminal (IZT) connects the Fluxys grid to the subsea Interconnector pipeline which
runs to Bacton in the United Kingdom and is so far the only physical bi-directional link
between the UK and continental European markets. IZT allows natural gas from the Continent
to be shipped to the United Kingdom. The Interconnector also serves as the only gas export
route from the United Kingdom. Gassco’s Zeepipe Terminal (ZPT) connects Norway’s Troll and
Sleipner offshore gas fields to the Fluxys grid via the subsear Zeepipe pipeline.
The need for new infrastructure is evaluated every year by Fluxys in the updated investment
programme for the next 10 years. These updates take into account the changes in
requirements in terms of natural gas supply, request for new connections and the changing
needs of grid users identified through subscription periods and international market
consultations among other things. Several simulations based on the winter peak (January at -
11°Ceq) and border to border transmission requirements are being set up to calculate the
effects on the network.
Current investments planned/underway:
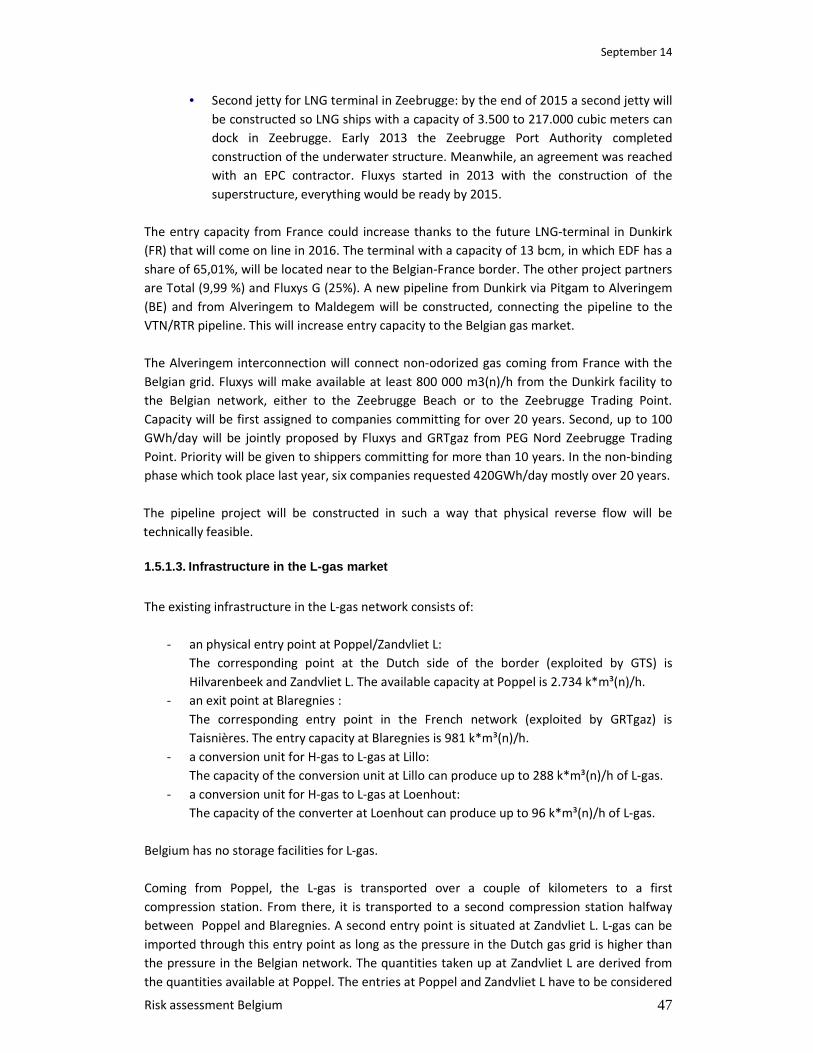
September 14
Risk assessment Belgium 47
• Second jetty for LNG terminal in Zeebrugge: by the end of 2015 a second jetty will
be constructed so LNG ships with a capacity of 3.500 to 217.000 cubic meters can
dock in Zeebrugge. Early 2013 the Zeebrugge Port Authority completed
construction of the underwater structure. Meanwhile, an agreement was reached
with an EPC contractor. Fluxys started in 2013 with the construction of the
superstructure, everything would be ready by 2015.
The entry capacity from France could increase thanks to the future LNG-terminal in Dunkirk
(FR) that will come on line in 2016. The terminal with a capacity of 13 bcm, in which EDF has a
share of 65,01%, will be located near to the Belgian-France border. The other project partners
are Total (9,99 %) and Fluxys G (25%). A new pipeline from Dunkirk via Pitgam to Alveringem
(BE) and from Alveringem to Maldegem will be constructed, connecting the pipeline to the
VTN/RTR pipeline. This will increase entry capacity to the Belgian gas market.
The Alveringem interconnection will connect non-odorized gas coming from France with the
Belgian grid. Fluxys will make available at least 800 000 m3(n)/h from the Dunkirk facility to
the Belgian network, either to the Zeebrugge Beach or to the Zeebrugge Trading Point.
Capacity will be first assigned to companies committing for over 20 years. Second, up to 100
GWh/day will be jointly proposed by Fluxys and GRTgaz from PEG Nord Zeebrugge Trading
Point. Priority will be given to shippers committing for more than 10 years. In the non-binding
phase which took place last year, six companies requested 420GWh/day mostly over 20 years.
The pipeline project will be constructed in such a way that physical reverse flow will be
technically feasible.
1.5.1.3. Infrastructure in the L-gas market
The existing infrastructure in the L-gas network consists of:
- an physical entry point at Poppel/Zandvliet L:
The corresponding point at the Dutch side of the border (exploited by GTS) is
Hilvarenbeek and Zandvliet L. The available capacity at Poppel is 2.734 k*m³(n)/h.
- an exit point at Blaregnies :
The corresponding entry point in the French network (exploited by GRTgaz) is
Taisnières. The entry capacity at Blaregnies is 981 k*m³(n)/h.
- a conversion unit for H-gas to L-gas at Lillo:
The capacity of the conversion unit at Lillo can produce up to 288 k*m³(n)/h of L-gas.
- a conversion unit for H-gas to L-gas at Loenhout:
The capacity of the converter at Loenhout can produce up to 96 k*m³(n)/h of L-gas.
Belgium has no storage facilities for L-gas.
Coming from Poppel, the L-gas is transported over a couple of kilometers to a first
compression station. From there, it is transported to a second compression station halfway
between Poppel and Blaregnies. A second entry point is situated at Zandvliet L. L-gas can be
imported through this entry point as long as the pressure in the Dutch gas grid is higher than
the pressure in the Belgian network. The quantities taken up at Zandvliet L are derived from
the quantities available at Poppel. The entries at Poppel and Zandvliet L have to be considered
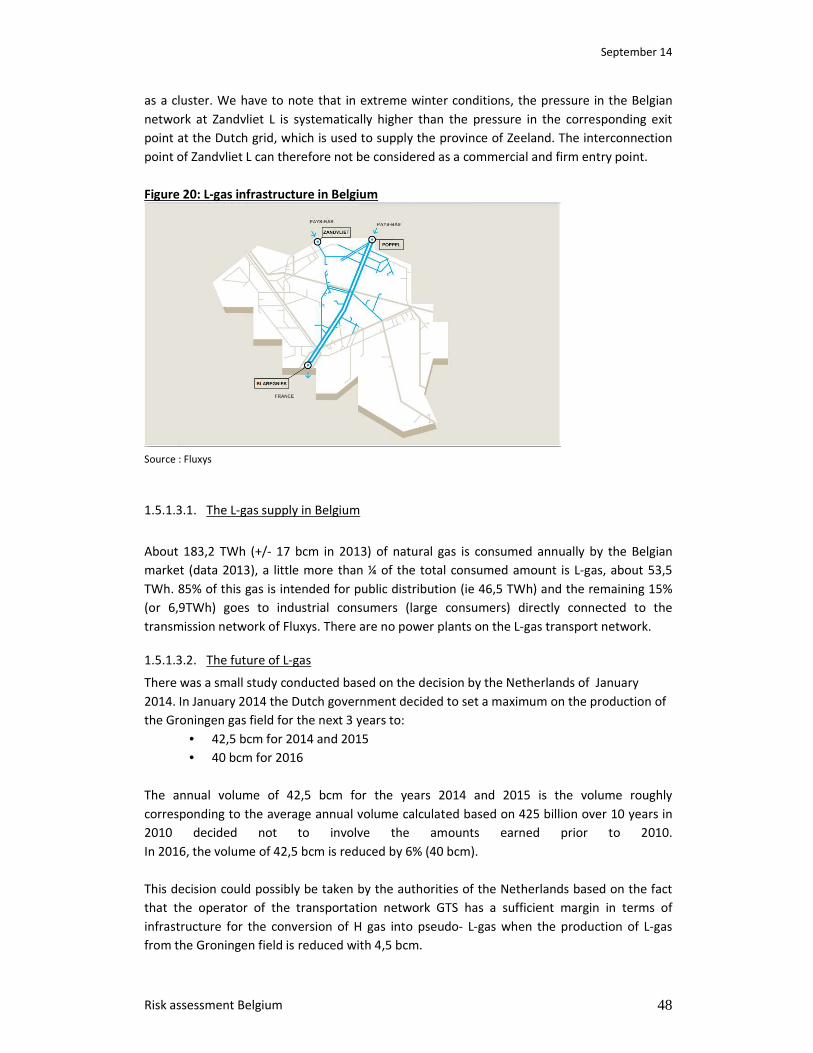
September 14
Risk assessment Belgium 48
as a cluster. We have to note that in extreme winter conditions, the pressure in the Belgian
network at Zandvliet L is systematically higher than the pressure in the corresponding exit
point at the Dutch grid, which is used to supply the province of Zeeland. The interconnection
point of Zandvliet L can therefore not be considered as a commercial and firm entry point.
Figure 20: L-gas infrastructure in Belgium
Source : Fluxys
1.5.1.3.1. The L-gas supply in Belgium
About 183,2 TWh (+/- 17 bcm in 2013) of natural gas is consumed annually by the Belgian
market (data 2013), a little more than ¼ of the total consumed amount is L-gas, about 53,5
TWh. 85% of this gas is intended for public distribution (ie 46,5 TWh) and the remaining 15%
(or 6,9TWh) goes to industrial consumers (large consumers) directly connected to the
transmission network of Fluxys. There are no power plants on the L-gas transport network.
1.5.1.3.2. The future of L-gas
There was a small study conducted based on the decision by the Netherlands of January
2014. In January 2014 the Dutch government decided to set a maximum on the production of
the Groningen gas field for the next 3 years to:
• 42,5 bcm for 2014 and 2015
• 40 bcm for 2016
The annual volume of 42,5 bcm for the years 2014 and 2015 is the volume roughly
corresponding to the average annual volume calculated based on 425 billion over 10 years in
2010 decided not to involve the amounts earned prior to 2010.
In 2016, the volume of 42,5 bcm is reduced by 6% (40 bcm).
This decision could possibly be taken by the authorities of the Netherlands based on the fact
that the operator of the transportation network GTS has a sufficient margin in terms of
infrastructure for the conversion of H gas into pseudo- L-gas when the production of L-gas
from the Groningen field is reduced with 4,5 bcm.
September 14
Risk assessment Belgium 49
The table below shows our estimates on the changes in the reserves of Groningen-gas in the
coming years (these results are not binding values, and are just used to give a hypostasis).
Pending the decision should be taken by the Dutch authorities in 2017 , the ceiling set in 2016
42,5 bcm has been artificially maintained until 2021. This is a hypothetical calculation that
currently rests on any official information.
Year
Annual Prod.
Groningen
fields % of 2010
Avail. Volume
on 1st of January
(bcm)
% initial vol
i.e. 2800
(bcm)
2010 44,5 100% 918 32,8%
2011 44,5 95% 874 31,2%
2012 44,5 90% 829 29,6%
2013 44,5 85% 780 27,9%
2014 42,5 80% 736 26,3%
2015 42,5 75% 693 24,8%
2016 40,0 71% 651 23,2%
2017 40,0 67% 611 21,8%
2018 40,0 62% 571 20,4%
2019 40,0 58% 531 18,9%
2020 40,0 53% 491 17,5%
2021 40,0 49% 451 16,1%
Figure 21: Estimation of the future exploitation of the Groningen Gas Field
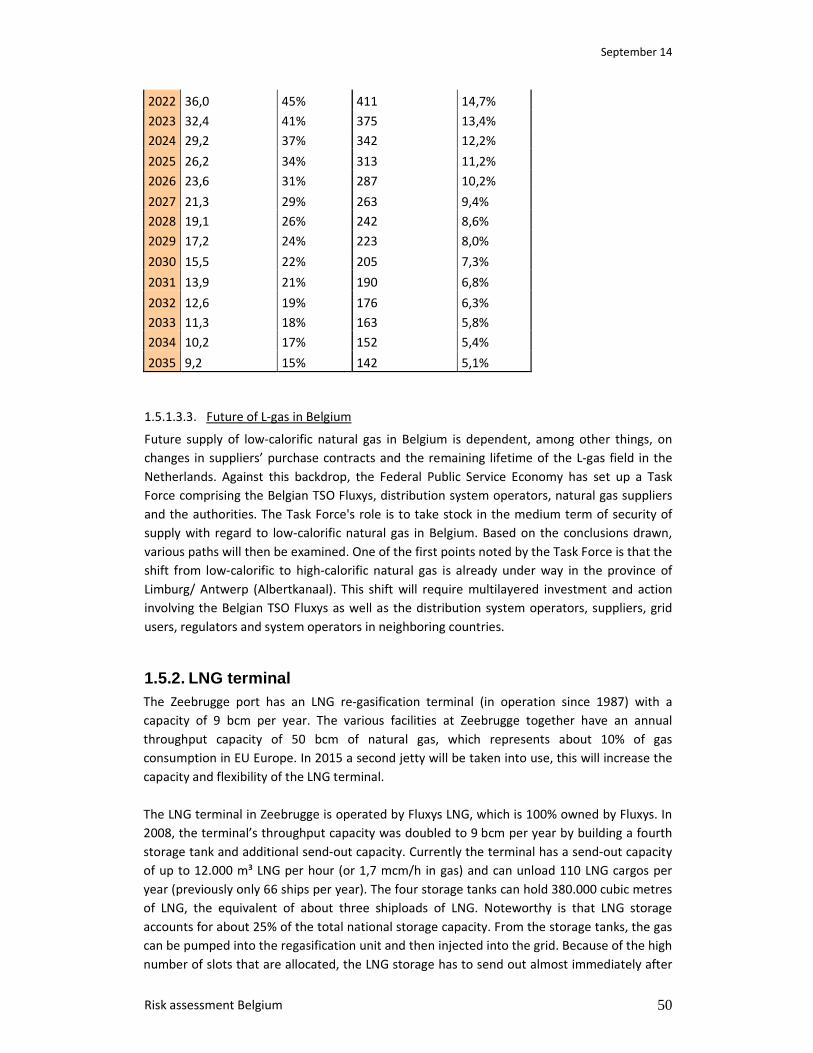
September 14
Risk assessment Belgium 50
2022 36,0 45% 411 14,7%
2023 32,4 41% 375 13,4%
2024 29,2 37% 342 12,2%
2025 26,2 34% 313 11,2%
2026 23,6 31% 287 10,2%
2027 21,3 29% 263 9,4%
2028 19,1 26% 242 8,6%
2029 17,2 24% 223 8,0%
2030 15,5 22% 205 7,3%
2031 13,9 21% 190 6,8%
2032 12,6 19% 176 6,3%
2033 11,3 18% 163 5,8%
2034 10,2 17% 152 5,4%
2035 9,2 15% 142 5,1%
1.5.1.3.3. Future of L-gas in Belgium
Future supply of low-calorific natural gas in Belgium is dependent, among other things, on
changes in suppliers’ purchase contracts and the remaining lifetime of the L-gas field in the
Netherlands. Against this backdrop, the Federal Public Service Economy has set up a Task
Force comprising the Belgian TSO Fluxys, distribution system operators, natural gas suppliers
and the authorities. The Task Force's role is to take stock in the medium term of security of
supply with regard to low-calorific natural gas in Belgium. Based on the conclusions drawn,
various paths will then be examined. One of the first points noted by the Task Force is that the
shift from low-calorific to high-calorific natural gas is already under way in the province of
Limburg/ Antwerp (Albertkanaal). This shift will require multilayered investment and action
involving the Belgian TSO Fluxys as well as the distribution system operators, suppliers, grid
users, regulators and system operators in neighboring countries.
1.5.2. LNG terminal The Zeebrugge port has an LNG re-gasification terminal (in operation since 1987) with a
capacity of 9 bcm per year. The various facilities at Zeebrugge together have an annual
throughput capacity of 50 bcm of natural gas, which represents about 10% of gas
consumption in EU Europe. In 2015 a second jetty will be taken into use, this will increase the
capacity and flexibility of the LNG terminal.
The LNG terminal in Zeebrugge is operated by Fluxys LNG, which is 100% owned by Fluxys. In
2008, the terminal’s throughput capacity was doubled to 9 bcm per year by building a fourth
storage tank and additional send-out capacity. Currently the terminal has a send-out capacity
of up to 12.000 m³ LNG per hour (or 1,7 mcm/h in gas) and can unload 110 LNG cargos per
year (previously only 66 ships per year). The four storage tanks can hold 380.000 cubic metres
of LNG, the equivalent of about three shiploads of LNG. Noteworthy is that LNG storage
accounts for about 25% of the total national storage capacity. From the storage tanks, the gas
can be pumped into the regasification unit and then injected into the grid. Because of the high
number of slots that are allocated, the LNG storage has to send out almost immediately after
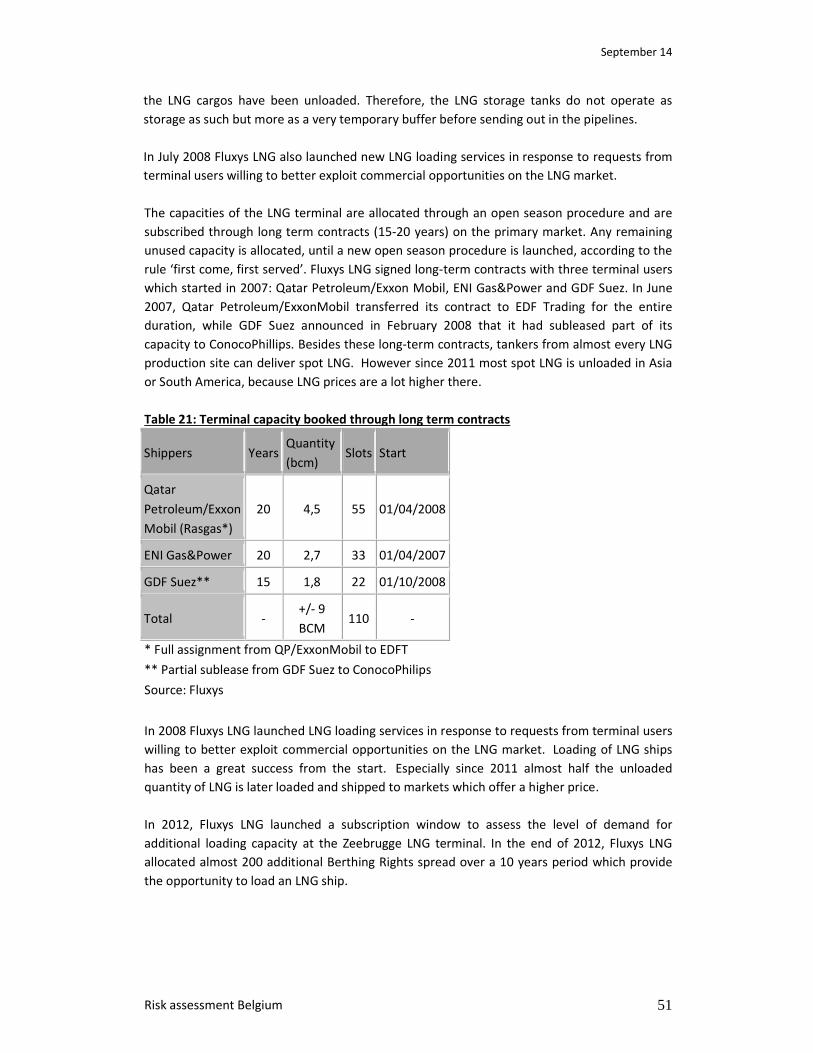
September 14
Risk assessment Belgium 51
the LNG cargos have been unloaded. Therefore, the LNG storage tanks do not operate as
storage as such but more as a very temporary buffer before sending out in the pipelines.
In July 2008 Fluxys LNG also launched new LNG loading services in response to requests from
terminal users willing to better exploit commercial opportunities on the LNG market.
The capacities of the LNG terminal are allocated through an open season procedure and are
subscribed through long term contracts (15-20 years) on the primary market. Any remaining
unused capacity is allocated, until a new open season procedure is launched, according to the
rule ‘first come, first served’. Fluxys LNG signed long-term contracts with three terminal users
which started in 2007: Qatar Petroleum/Exxon Mobil, ENI Gas&Power and GDF Suez. In June
2007, Qatar Petroleum/ExxonMobil transferred its contract to EDF Trading for the entire
duration, while GDF Suez announced in February 2008 that it had subleased part of its
capacity to ConocoPhillips. Besides these long-term contracts, tankers from almost every LNG
production site can deliver spot LNG. However since 2011 most spot LNG is unloaded in Asia
or South America, because LNG prices are a lot higher there.
Table 21: Terminal capacity booked through long term contracts
Shippers Years Quantity
(bcm) Slots Start
Qatar
Petroleum/Exxon
Mobil (Rasgas*)
20 4,5 55 01/04/2008
ENI Gas&Power 20 2,7 33 01/04/2007
GDF Suez** 15 1,8 22 01/10/2008
Total - +/- 9
BCM 110 -
* Full assignment from QP/ExxonMobil to EDFT
** Partial sublease from GDF Suez to ConocoPhilips
Source: Fluxys
In 2008 Fluxys LNG launched LNG loading services in response to requests from terminal users
willing to better exploit commercial opportunities on the LNG market. Loading of LNG ships
has been a great success from the start. Especially since 2011 almost half the unloaded
quantity of LNG is later loaded and shipped to markets which offer a higher price.
In 2012, Fluxys LNG launched a subscription window to assess the level of demand for
additional loading capacity at the Zeebrugge LNG terminal. In the end of 2012, Fluxys LNG
allocated almost 200 additional Berthing Rights spread over a 10 years period which provide
the opportunity to load an LNG ship.
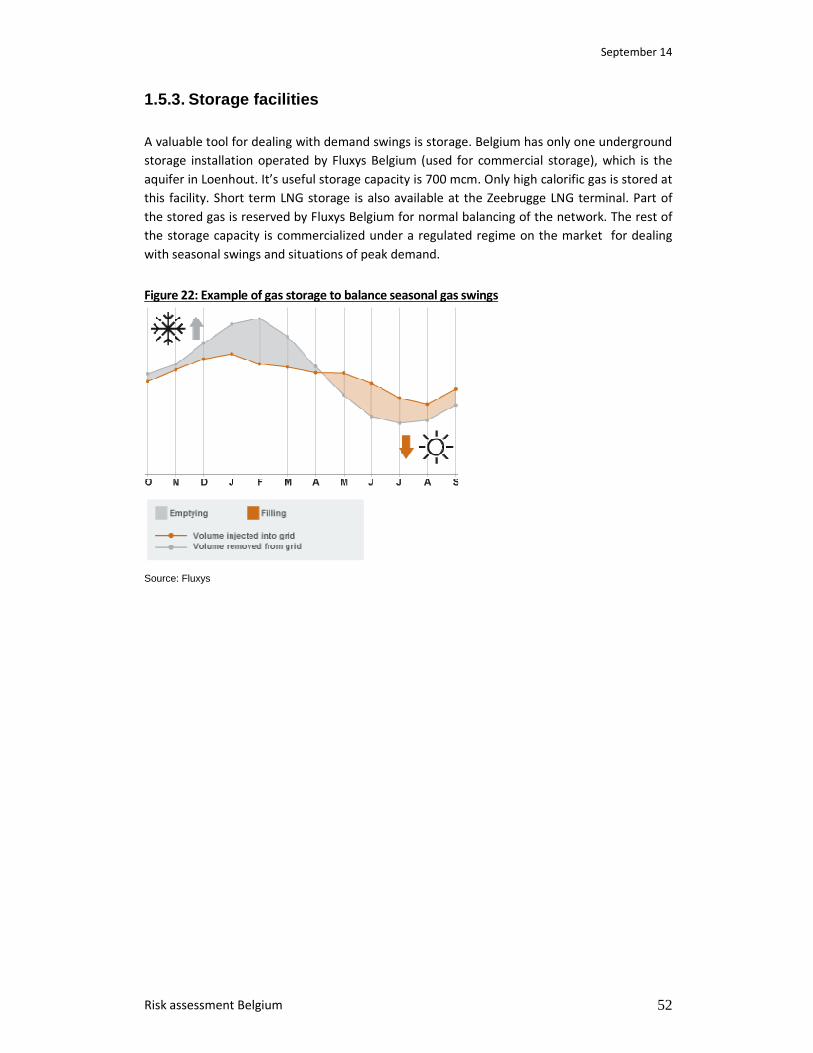
September 14
Risk assessment Belgium 52
1.5.3. Storage facilities A valuable tool for dealing with demand swings is storage. Belgium has only one underground
storage installation operated by Fluxys Belgium (used for commercial storage), which is the
aquifer in Loenhout. It’s useful storage capacity is 700 mcm. Only high calorific gas is stored at
this facility. Short term LNG storage is also available at the Zeebrugge LNG terminal. Part of
the stored gas is reserved by Fluxys Belgium for normal balancing of the network. The rest of
the storage capacity is commercialized under a regulated regime on the market for dealing
with seasonal swings and situations of peak demand.
Figure 22: Example of gas storage to balance seasonal gas swings
Source: Fluxys
September 14
Risk assessment Belgium 53
1.5.4. N-1 infrastructure standard The N-1 formula describes the ability of the technical capacity of the gas infrastructure to
satisfy total gas demand in the calculated area in the event of disruption of the single largest
gas infrastructure during a day of exceptionally high gas demand occurring with a statistical
probability of once in 20 years. Gas infrastructure includes the gas transmission network
including interconnectors as well as production, LNG and storage facilities connected to the
calculated area. We do note that the transit flows are not taken into account for the
calculation of the N-1 standard. The impact of N-1 has to be carefully evaluated therefore
because this does not mean that all imports are destined for the Belgian domestic market.
Therefore it could be useful in the future to calculate the N-1 standard also at regional level.
The technical capacity of all remaining available gas infrastructure in the event of disruption of
the single largest gas infrastructure should be at least equal to the sum of the total daily gas
demand of the calculated area during a day of exceptionally high gas demand occurring with a
statistical probability of once in 20 years. The results of the N-1 formula, as calculated below,
should at least equal 100 %.
The calculation of the N-1 formula, presented in this document, is based on the investment
plan 2013 - 2023. Investment planning for the 10 years to come is done by Fluxys on a yearly
basis. Every year, by the end of May, the investment plan is updated taking the evolutions on
the market, the planning of adjacent TSO’s and specific grid calculations into account.
1.5.4.1. Definitions and assumptions
All the definitions and assumptions for calculating the N-1 formula are described in this
paragraph and are consistent with the assumptions and definitions used in the investment
plan.
• Technical Capacity
According to Article 2(1)(18) of Regulation (EC) No 715/2009, ‘technical capacity’ means the
maximum firm capacity that the transmission system operator can offer to the network users,
taking account of system integrity and the operational requirements of the transmission
network.
The methodology used for defining the maximum firm capacity that Fluxys can offer is the
default target capacity applied for capacity simulations and is based on the up- and/or
downstream bottlenecks. This results in a realistic value of the capacity that can be offered on
a firm basis under all simulated scenarios according to the commercial model and takes into
account the reality of the adjacent TSO as defined by:
- Asset reality i.e. current assets and likely future investments
- Commercial behaviour (e.g. interruptible management,…)
- Flow planning assumptions (e.g. measured maximum flow,…)
- End user demand
September 14
Risk assessment Belgium 54
The technical capacities appearing in the investment plan are also provided by Fluxys to
ENTSOG for the Ten Year Network Development Statement.
• Definition Entry point, production and storage facilities
Entry points, storage and LNG facilities are considered as interconnection points with adjacent
network systems on which firm capacity is offered to the network users. So the technical
capacity is stated per contractual interconnection point. This means that the physical
interconnection points such as Dilsen and ‘s Gravenvoeren are considered to be the
contractual interconnection point ‘s Gravenvoeren.
Since entry points, storage and LNG facilities are considered to be contractual points, the
calculation of the N-1 formula is first presented considering the single largest gas
infrastructure as a contractual point.
However, for calculated areas where this calculation methodology of the N-1 formula
indicates non-compliancy, alternative calculations are given taking the following aspect of the
definition of single largest infrastructure into account: When several gas infrastructures are
connected to a common upstream or downstream gas infrastructure and cannot be
separately operated, they shall be considered as one single gas infrastructure.
• Calculated area
The ‘Calculated area’ means a geographical area for which the N – 1 formula is calculated, as
determined by the Competent Authority. Since the recital of the Regulation 994/2010 states
that the specificities of low calorific gas should be considered at national and regional level,
Fluxys provides in this document the calculation of the low and high calorific gas as separate
calculated areas.
Exceptionally high gas demand with a statistical probability of once in 20 years
Since public distributions are temperature dependent, exceptionally high gas demand
occurring with a statistical probability of once in 20 years for the public distributions is
considered to be the demand (expressed in mcm/d) at an equivalent daily temperature of
-11°C. This temperature is the result of a statistical approach and corresponds with a
statistical probability of once in 20 years. This probability is calculated based on data of the
last 100 years.
For the Power Plants and Industrial Clients a default value is used.
1.5.4.2. Calculation: supply side
At the supply side the Technical Capacity of the Entry points, Storage, LNG and Production
facilities is presented hereunder.
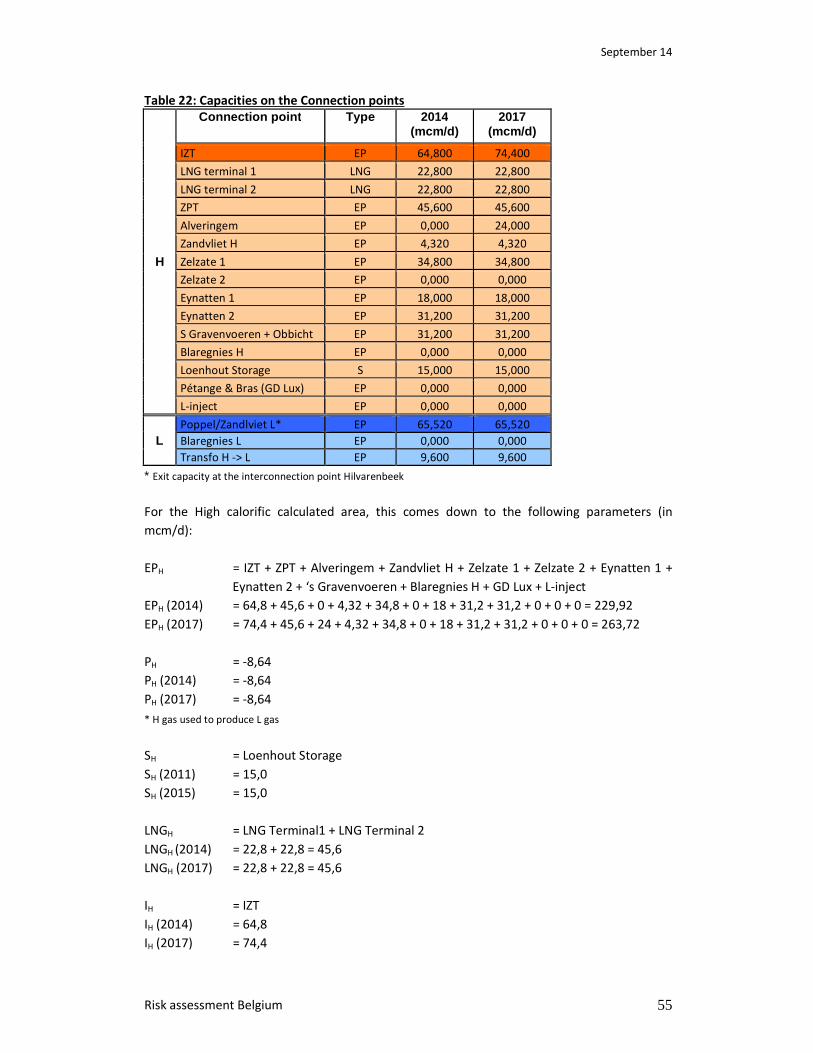
September 14
Risk assessment Belgium 55
Table 22: Capacities on the Connection points
H
Connection point Type 2014 (mcm/d)
2017 (mcm/d)
IZT EP 64,800 74,400
LNG terminal 1 LNG 22,800 22,800
LNG terminal 2 LNG 22,800 22,800
ZPT EP 45,600 45,600
Alveringem EP 0,000 24,000
Zandvliet H EP 4,320 4,320
Zelzate 1 EP 34,800 34,800
Zelzate 2 EP 0,000 0,000
Eynatten 1 EP 18,000 18,000
Eynatten 2 EP 31,200 31,200
S Gravenvoeren + Obbicht EP 31,200 31,200
Blaregnies H EP 0,000 0,000
Loenhout Storage S 15,000 15,000
Pétange & Bras (GD Lux) EP 0,000 0,000
L-inject EP 0,000 0,000
L Poppel/Zandlviet L* EP 65,520 65,520
Blaregnies L EP 0,000 0,000
Transfo H -> L EP 9,600 9,600
* Exit capacity at the interconnection point Hilvarenbeek
For the High calorific calculated area, this comes down to the following parameters (in
mcm/d):
EPH = IZT + ZPT + Alveringem + Zandvliet H + Zelzate 1 + Zelzate 2 + Eynatten 1 +
Eynatten 2 + ‘s Gravenvoeren + Blaregnies H + GD Lux + L-inject
EPH (2014) = 64,8 + 45,6 + 0 + 4,32 + 34,8 + 0 + 18 + 31,2 + 31,2 + 0 + 0 + 0 = 229,92
EPH (2017) = 74,4 + 45,6 + 24 + 4,32 + 34,8 + 0 + 18 + 31,2 + 31,2 + 0 + 0 + 0 = 263,72
PH = -8,64
PH (2014) = -8,64
PH (2017) = -8,64
* H gas used to produce L gas
SH = Loenhout Storage
SH (2011) = 15,0
SH (2015) = 15,0
LNGH = LNG Terminal1 + LNG Terminal 2
LNGH (2014) = 22,8 + 22,8 = 45,6
LNGH (2017) = 22,8 + 22,8 = 45,6
IH = IZT
IH (2014) = 64,8
IH (2017) = 74,4
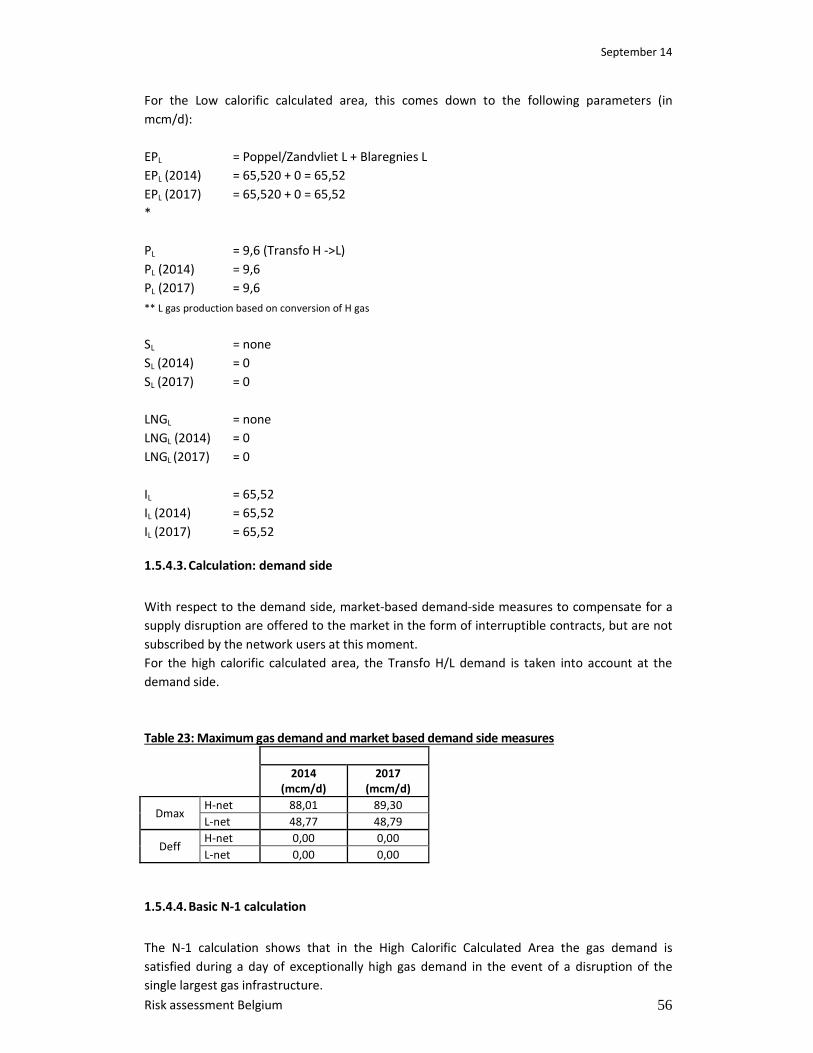
September 14
Risk assessment Belgium 56
For the Low calorific calculated area, this comes down to the following parameters (in
mcm/d):
EPL = Poppel/Zandvliet L + Blaregnies L
EPL (2014) = 65,520 + 0 = 65,52
EPL (2017) = 65,520 + 0 = 65,52
*
PL = 9,6 (Transfo H ->L)
PL (2014) = 9,6
PL (2017) = 9,6
** L gas production based on conversion of H gas
SL = none
SL (2014) = 0
SL (2017) = 0
LNGL = none
LNGL (2014) = 0
LNGL (2017) = 0
IL = 65,52
IL (2014) = 65,52
IL (2017) = 65,52
1.5.4.3. Calculation: demand side
With respect to the demand side, market-based demand-side measures to compensate for a
supply disruption are offered to the market in the form of interruptible contracts, but are not
subscribed by the network users at this moment.
For the high calorific calculated area, the Transfo H/L demand is taken into account at the
demand side.
Table 23: Maximum gas demand and market based demand side measures
2014
(mcm/d)
2017
(mcm/d)
Dmax H-net 88,01 89,30
L-net 48,77 48,79
Deff H-net 0,00 0,00
L-net 0,00 0,00
1.5.4.4. Basic N-1 calculation
The N-1 calculation shows that in the High Calorific Calculated Area the gas demand is
satisfied during a day of exceptionally high gas demand in the event of a disruption of the
single largest gas infrastructure.
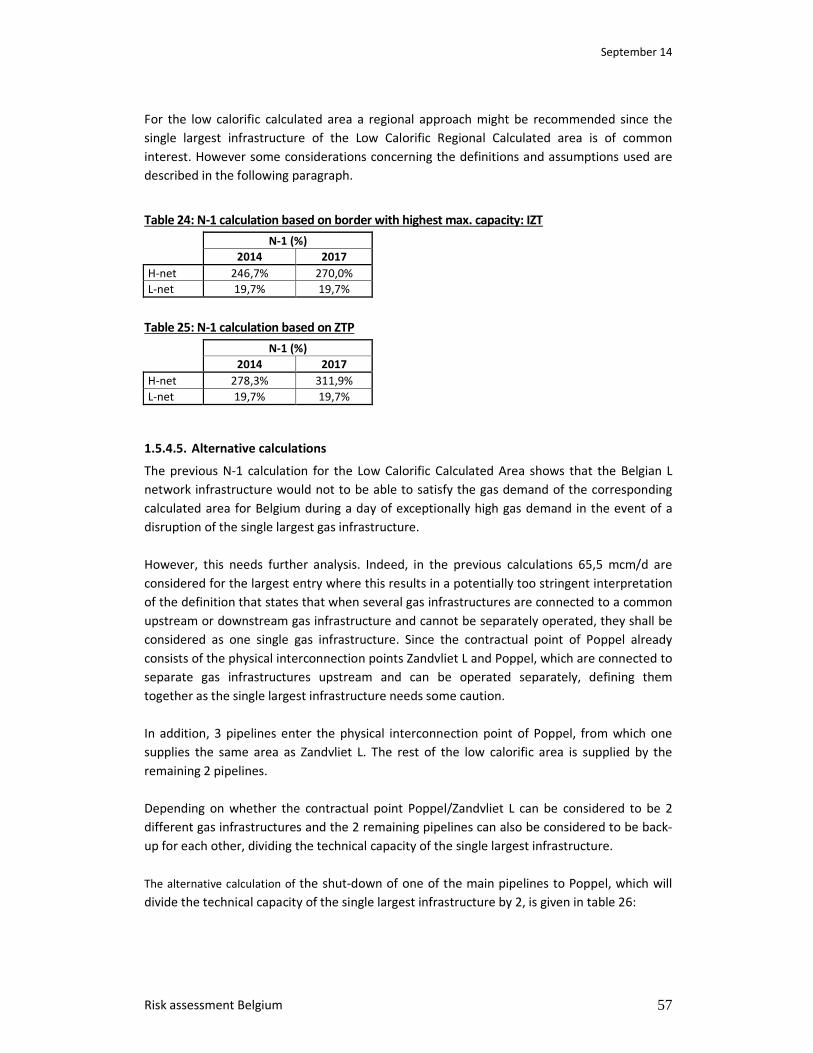
September 14
Risk assessment Belgium 57
For the low calorific calculated area a regional approach might be recommended since the
single largest infrastructure of the Low Calorific Regional Calculated area is of common
interest. However some considerations concerning the definitions and assumptions used are
described in the following paragraph.
Table 24: N-1 calculation based on border with highest max. capacity: IZT
N-1 (%)
2014 2017
H-net 246,7% 270,0%
L-net 19,7% 19,7%
Table 25: N-1 calculation based on ZTP
N-1 (%)
2014 2017
H-net 278,3% 311,9%
L-net 19,7% 19,7%
1.5.4.5. Alternative calculations
The previous N-1 calculation for the Low Calorific Calculated Area shows that the Belgian L
network infrastructure would not to be able to satisfy the gas demand of the corresponding
calculated area for Belgium during a day of exceptionally high gas demand in the event of a
disruption of the single largest gas infrastructure.
However, this needs further analysis. Indeed, in the previous calculations 65,5 mcm/d are
considered for the largest entry where this results in a potentially too stringent interpretation
of the definition that states that when several gas infrastructures are connected to a common
upstream or downstream gas infrastructure and cannot be separately operated, they shall be
considered as one single gas infrastructure. Since the contractual point of Poppel already
consists of the physical interconnection points Zandvliet L and Poppel, which are connected to
separate gas infrastructures upstream and can be operated separately, defining them
together as the single largest infrastructure needs some caution.
In addition, 3 pipelines enter the physical interconnection point of Poppel, from which one
supplies the same area as Zandvliet L. The rest of the low calorific area is supplied by the
remaining 2 pipelines.
Depending on whether the contractual point Poppel/Zandvliet L can be considered to be 2
different gas infrastructures and the 2 remaining pipelines can also be considered to be back-
up for each other, dividing the technical capacity of the single largest infrastructure.
The alternative calculation of the shut-down of one of the main pipelines to Poppel, which will
divide the technical capacity of the single largest infrastructure by 2, is given in table 26:

September 14
Risk assessment Belgium 58
Table 26: Alternative N-1 calculation
N-1 (%)
2014 2017
L-net 19,7% 19,7%
L-net – Disruption 1 upstream Line 86,9% 86,8%
1.6. Gas infrastructure utilizations & contracts In June 2011, the Belgian Energy Administration sent questionnaires to all gas undertakings
that currently possess a federal supply licence. As the administration wanted to gain as much
insight as possible, the questionnaire was quite comprehensive.
Many of the gas undertakings stressed their will to cooperate on a subject that they
confirmed as being important and/or necessary. Due to the sensitive nature, a few legal
remarks were made and several partners stressed the confidential nature of the data
provided. The administration anticipated and duly recognised these concerns. The technical
obstacles were harder to anticipate. Some questions were open for interpretation, others
were simply impossible for some companies to answer. For the future, the level of clarity of
the questions will need to increase, with more definitions. Another difficulty was the structure
of the gas market. The free market has spawned a large network of cross ownership and
arrangements. Any study on the gas market should make sure that each amount of gas is only
counted once. Nevertheless, the questionnaires provided a very valuable insight into the
Belgian gas market and allowed the competent authority to make this Risk Assessment.
1.6.1. Results questionnaire shippers
1.6.1.1. Contracts
Shippers and suppliers active on the Belgian market tend to integrate their sourcing contracts
for Belgium into the European-wide market. More and more, the contracts are diversified to
the extent that a direct link between sourcing contract and supply contract disappears. Listing
the exact source of the gas molecules on the Belgian market is therefore hard.
Management on a European scale is also demonstrated in the use of storage facilities, with
suppliers citing foreign storage as a source of flexibility or peak capacity for the Belgian
market. In general, the integrated approach seems to provide advantages for the security and
for the flexibility of the gas market.
The big supply companies lean towards a conservative attitude on their contracts. The
sourcing contracts are divers and long term contracts with producers are preferred. Some
companies indicated that in their quest for a secure supply, they opt to use the least amount
of separate infrastructure between producer and end user. In general, most companies claim
to cover all bases in the event of a crisis.
The long term contracts with the Netherlands will last until 2029. The current contracts (and
acquisitions on the spot market) are sufficient to cover the expected demand until 2016. After
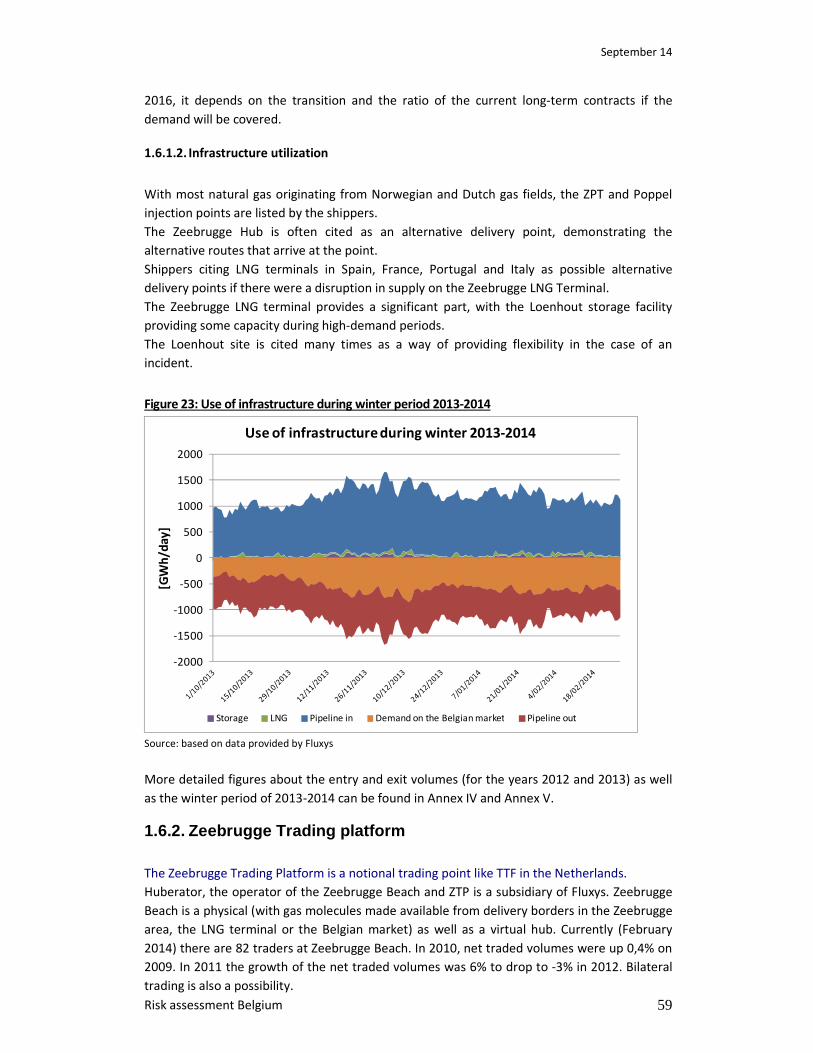
September 14
Risk assessment Belgium 59
2016, it depends on the transition and the ratio of the current long-term contracts if the
demand will be covered.
1.6.1.2. Infrastructure utilization
With most natural gas originating from Norwegian and Dutch gas fields, the ZPT and Poppel
injection points are listed by the shippers.
The Zeebrugge Hub is often cited as an alternative delivery point, demonstrating the
alternative routes that arrive at the point.
Shippers citing LNG terminals in Spain, France, Portugal and Italy as possible alternative
delivery points if there were a disruption in supply on the Zeebrugge LNG Terminal.
The Zeebrugge LNG terminal provides a significant part, with the Loenhout storage facility
providing some capacity during high-demand periods.
The Loenhout site is cited many times as a way of providing flexibility in the case of an
incident.
Figure 23: Use of infrastructure during winter period 2013-2014
-2000
-1500
-1000
-500
0
500
1000
1500
2000
[GW
h/d
ay
]
Use of infrastructure during winter 2013-2014
Storage LNG Pipeline in Demand on the Belgian market Pipeline out
Source: based on data provided by Fluxys
More detailed figures about the entry and exit volumes (for the years 2012 and 2013) as well
as the winter period of 2013-2014 can be found in Annex IV and Annex V.
1.6.2. Zeebrugge Trading platform The Zeebrugge Trading Platform is a notional trading point like TTF in the Netherlands.
Huberator, the operator of the Zeebrugge Beach and ZTP is a subsidiary of Fluxys. Zeebrugge
Beach is a physical (with gas molecules made available from delivery borders in the Zeebrugge
area, the LNG terminal or the Belgian market) as well as a virtual hub. Currently (February
2014) there are 82 traders at Zeebrugge Beach. In 2010, net traded volumes were up 0,4% on
2009. In 2011 the growth of the net traded volumes was 6% to drop to -3% in 2012. Bilateral
trading is also a possibility.
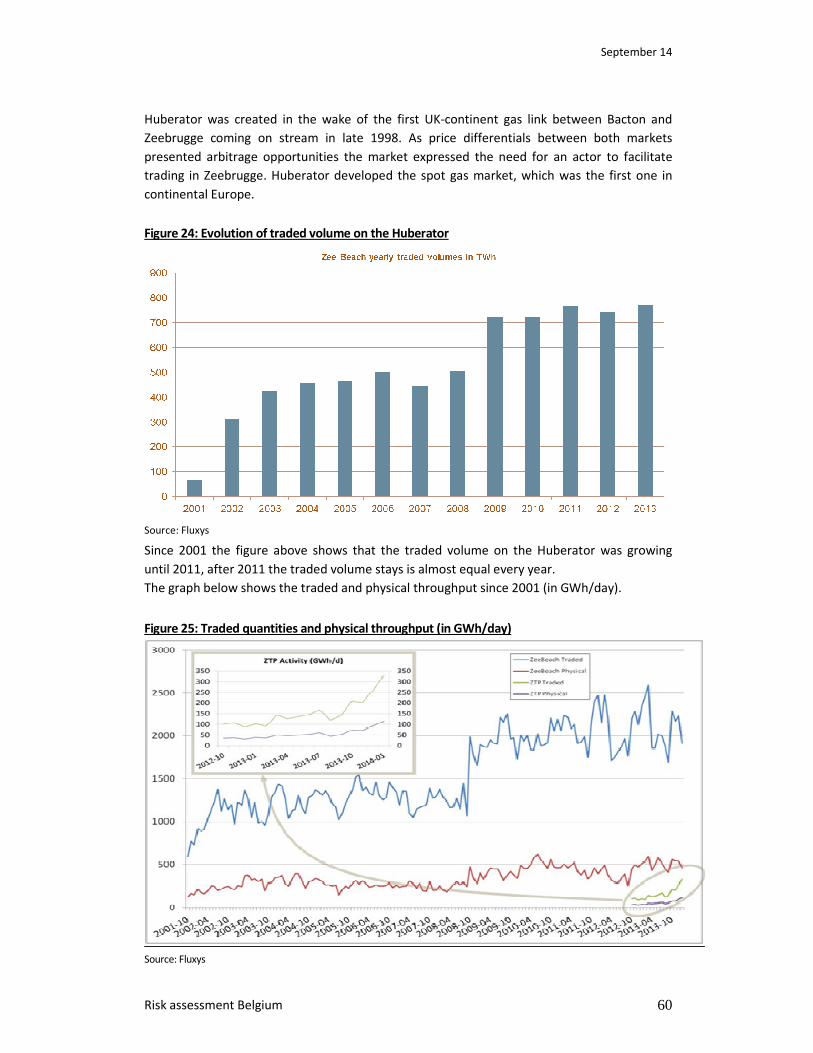
September 14
Risk assessment Belgium 60
Huberator was created in the wake of the first UK-continent gas link between Bacton and
Zeebrugge coming on stream in late 1998. As price differentials between both markets
presented arbitrage opportunities the market expressed the need for an actor to facilitate
trading in Zeebrugge. Huberator developed the spot gas market, which was the first one in
continental Europe.
Figure 24: Evolution of traded volume on the Huberator
Source: Fluxys
Since 2001 the figure above shows that the traded volume on the Huberator was growing
until 2011, after 2011 the traded volume stays is almost equal every year.
The graph below shows the traded and physical throughput since 2001 (in GWh/day).
Figure 25: Traded quantities and physical throughput (in GWh/day)
Source: Fluxys
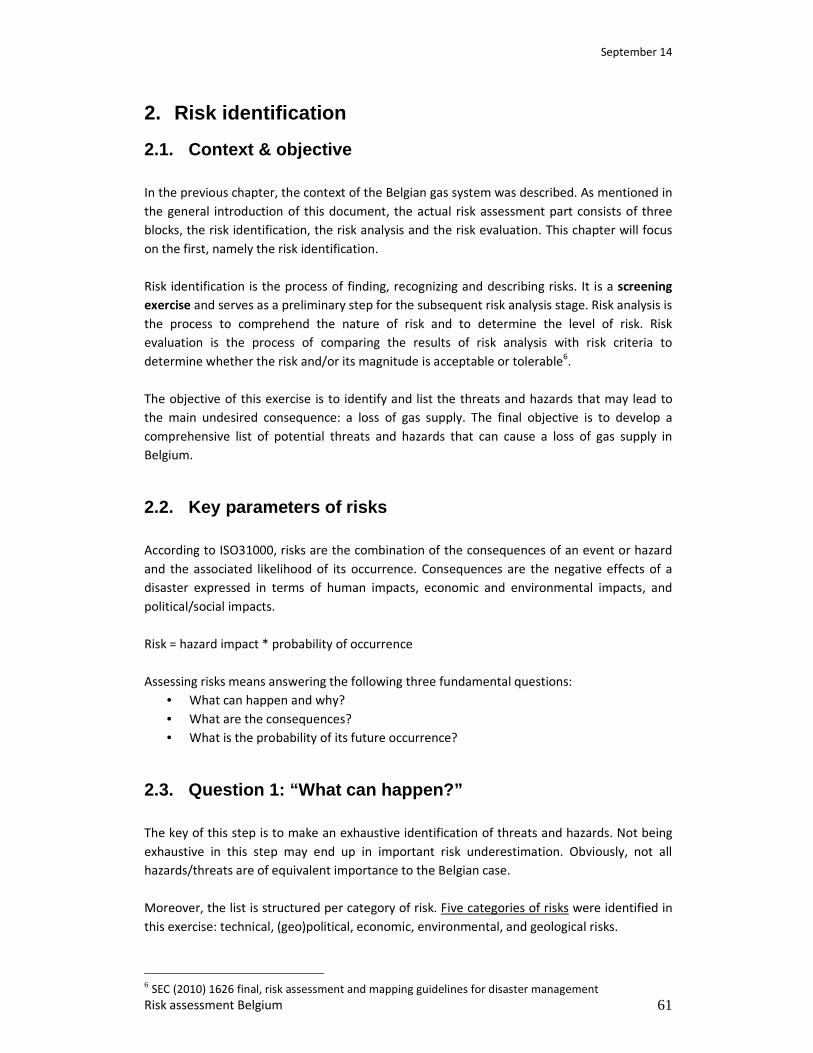
September 14
Risk assessment Belgium 61
2. Risk identification
2.1. Context & objective In the previous chapter, the context of the Belgian gas system was described. As mentioned in
the general introduction of this document, the actual risk assessment part consists of three
blocks, the risk identification, the risk analysis and the risk evaluation. This chapter will focus
on the first, namely the risk identification.
Risk identification is the process of finding, recognizing and describing risks. It is a screening
exercise and serves as a preliminary step for the subsequent risk analysis stage. Risk analysis is
the process to comprehend the nature of risk and to determine the level of risk. Risk
evaluation is the process of comparing the results of risk analysis with risk criteria to
determine whether the risk and/or its magnitude is acceptable or tolerable6.
The objective of this exercise is to identify and list the threats and hazards that may lead to
the main undesired consequence: a loss of gas supply. The final objective is to develop a
comprehensive list of potential threats and hazards that can cause a loss of gas supply in
Belgium.
2.2. Key parameters of risks According to ISO31000, risks are the combination of the consequences of an event or hazard
and the associated likelihood of its occurrence. Consequences are the negative effects of a
disaster expressed in terms of human impacts, economic and environmental impacts, and
political/social impacts.
Risk = hazard impact * probability of occurrence
Assessing risks means answering the following three fundamental questions:
• What can happen and why?
• What are the consequences?
• What is the probability of its future occurrence?
2.3. Question 1: “What can happen?” The key of this step is to make an exhaustive identification of threats and hazards. Not being
exhaustive in this step may end up in important risk underestimation. Obviously, not all
hazards/threats are of equivalent importance to the Belgian case.
Moreover, the list is structured per category of risk. Five categories of risks were identified in
this exercise: technical, (geo)political, economic, environmental, and geological risks.
6 SEC (2010) 1626 final, risk assessment and mapping guidelines for disaster management
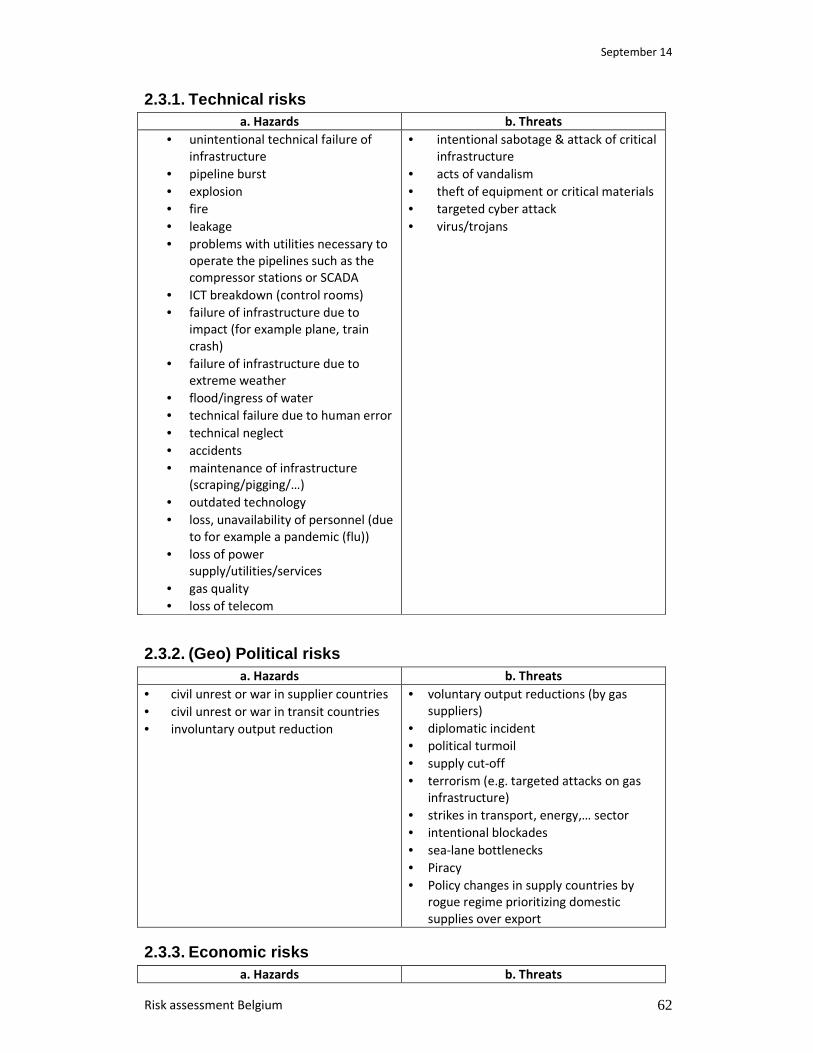
September 14
Risk assessment Belgium 62
2.3.1. Technical risks a. Hazards b. Threats
• unintentional technical failure of
infrastructure
• pipeline burst
• explosion
• fire
• leakage
• problems with utilities necessary to
operate the pipelines such as the
compressor stations or SCADA
• ICT breakdown (control rooms)
• failure of infrastructure due to
impact (for example plane, train
crash)
• failure of infrastructure due to
extreme weather
• flood/ingress of water
• technical failure due to human error
• technical neglect
• accidents
• maintenance of infrastructure
(scraping/pigging/…)
• outdated technology
• loss, unavailability of personnel (due
to for example a pandemic (flu))
• loss of power
supply/utilities/services
• gas quality
• loss of telecom
• intentional sabotage & attack of critical
infrastructure
• acts of vandalism
• theft of equipment or critical materials
• targeted cyber attack
• virus/trojans
2.3.2. (Geo) Political risks a. Hazards b. Threats
• civil unrest or war in supplier countries
• civil unrest or war in transit countries
• involuntary output reduction
• voluntary output reductions (by gas
suppliers)
• diplomatic incident
• political turmoil
• supply cut-off
• terrorism (e.g. targeted attacks on gas
infrastructure)
• strikes in transport, energy,… sector
• intentional blockades
• sea-lane bottlenecks
• Piracy
• Policy changes in supply countries by
rogue regime prioritizing domestic
supplies over export
2.3.3. Economic risks a. Hazards b. Threats
September 14
Risk assessment Belgium 63
• gas price volatility
• sudden loss of supply (imports,
production)
• Sudden peak gas demand,…
• supply-demand imbalance
• regulatory failure/shortcoming
• commercial dispute
• monopolization of market
• underinvestment
• public opinion opposition
2.3.4. Environmental risks (e.g. natural hazards) a. Hazards
• hurricane
• thunderstorm (& lightning)
• earthquake
• flood
• landslide
• extreme cold wave
• extreme heat wave
• increasing greenhouse gas emissions
• marine pollution
2.3.5. Geological risks (producer countries) • Resource depletion/shortage
• Extraction difficulties
• Political constraints for extraction
2.4. Question 2: “What are the consequences?” The first question gives us a comprehensive overview of possible hazards/threats. A second
fundamental question assesses the consequences of above events. First of all, there are
different types of impact. As described in an EC working staff document7, several types of
impact are defined, namely:
• Human impacts: number of affected people
• Economic impact
• Environmental impact
• Political impact
• Social impact
If we apply this to Ghislenghien event, namely the explosion of the high pressure gas pipeline
explosion at Ghislenghien in 2004. Several types of impact can be identified.
• Human impact: death toll
• Economic impact: cost of restoration of infrastructure, buildings,…; loss of gas
• Environnemental impact: air pollution etc.
• Political impact: impact on public order and safety
• Social impact: social & psychological impact
7 SEC (2010) 1626 final, risk assessment and mapping guidelines for disaster management

September 14
Risk assessment Belgium 64
In this document, solely the impact in terms of “loss of gas supply” will be analysed. The other
types of impact will not be discussed in detail.
Moreover, the actual assessment of the gas supply-related consequences (impact) is difficult.
There is again a choice between a qualitative and a quantitative approach. In the qualitative
approach, consequences can be determined by creating a (standardized) scale of impact, such
as for example the scales 1) Minor impact, 2) Noticeable impact and 3) Severe impact.
In the quantitative approach, consequences (impact) of risks can be quantitatively expressed
in different ways:
• Quantity of not delivered gas to the protected customers (mcm/d)
• Quantity of not delivered gas to all customers (mcm/d)
• Duration of the shortage of gas (hour)
• Impact on the economy (euro)
• …
In the risk analysis of the Belgian gas system, the impact will be estimated in a qualitative
way.
2.5. Question 3: “What is the probability of its fu ture occurrence?”
The assessment of probability can be very subjective and difficult. Moreover, the assessment
may be quantitative or qualitative, in function of the available data to assess the likelihood of
a risk. When the option selected is the qualitative one, a likelihood scale should be defined,
with for example 5 scales: 1) very low probability, 2) low, 3) medium, 4) high and 5) very high.
Although such scale could be considered as too coarse, and other more precise ones could be
defined. As an example, in the EURACOM project, the following scale is suggested:
� 1 Very low probability (It is extremely unlikely that the incident will occur – no
experience in the Belgian gas sector)
� 2 low probability (It is unlikely to occur – very limited experience in the
Belgian gas sector, happened only once in ten years)
� 3 Medium probability (It is a likely event – similar accidents have been
reported once in three years in the Belgian gas sector)
� 4 High probability (It is very likely to occur – it has been experienced once a
year in the Belgian gas system)
� 5 Very high (It will happen in the close future)
In the risk analysis of the Belgian gas system, the probability of certain events will be
estimated in a qualitative manner.
2.6. Other variables • Timeframe: probability and consequences of risk change in different timeframes.
Therefore, it is necessary to categorize and distinguish between:
September 14
Risk assessment Belgium 65
� short-term: existing risks and risks appearing within the coming 5 years
� medium-term: risks appearing within the coming 5-10 years
� long-term: risks appearing in more than 10 years
A technical failure of gas infrastructure is mostly a short term event whereas the
shortage of interconnection capacity in 2025 concerns more a LT event.
• Intentionality: Threats imply intentional acts (acts of terrorism, vandalism, theft, …).
Hazards are non-intentional (extreme weather, accidents,…).
• Provenance: The risks can both occur in supplier, transit (external risks) and/or
consumer states (internal). Not all hazards and threats listed above, are taking place
in Belgium. A lot of hazards/threats are likely to occur abroad, in supplier and transit
states that are of importance to Belgium
• Duration: Short duration (events/shocks) versus long duration (processes/stresses)
• Timing: winter versus summer (seasonal elements), peak versus normal situation, …
• Frequency
• Severity of disruption
2.7. Overview possible scenarios & variables Ideally, risk identification would consider all possible hazards, their probabilities of occurrence
and their possible impacts. However, this is not feasible. In this Belgian risk Assessment, the
most probable risks will be assessed.
Building further on the results of step 1 (i.e. establishing the context), step 2 (i.e. risk
identification) and taking into account historical data and past incidents, numerous scenarios
of the identified risks can be developed. The objective for this scenario building is to identify
certain events that could have a large impact on the Belgian gas sector. As it is not possible to
simulate all possible scenarios, a selection of the risks with a high probability or a large impact
on the Belgian gas supply might be made. We suggest five scenarios that could be presented
in the risk analysis (next chapter):
1. Political unrest in Middle East: LNG disruption scenario (Qatar)
2. Hurricane in North Sea: major outage of supplies from Norway
3. Technical failure major pipeline: outage of supplies from the Netherlands
4. Nuclear phase out Belgium
5. Terroristic attack on Loenhout storage facility
These five important scenarios for the Belgian gas system are presented in table under section
3.2.
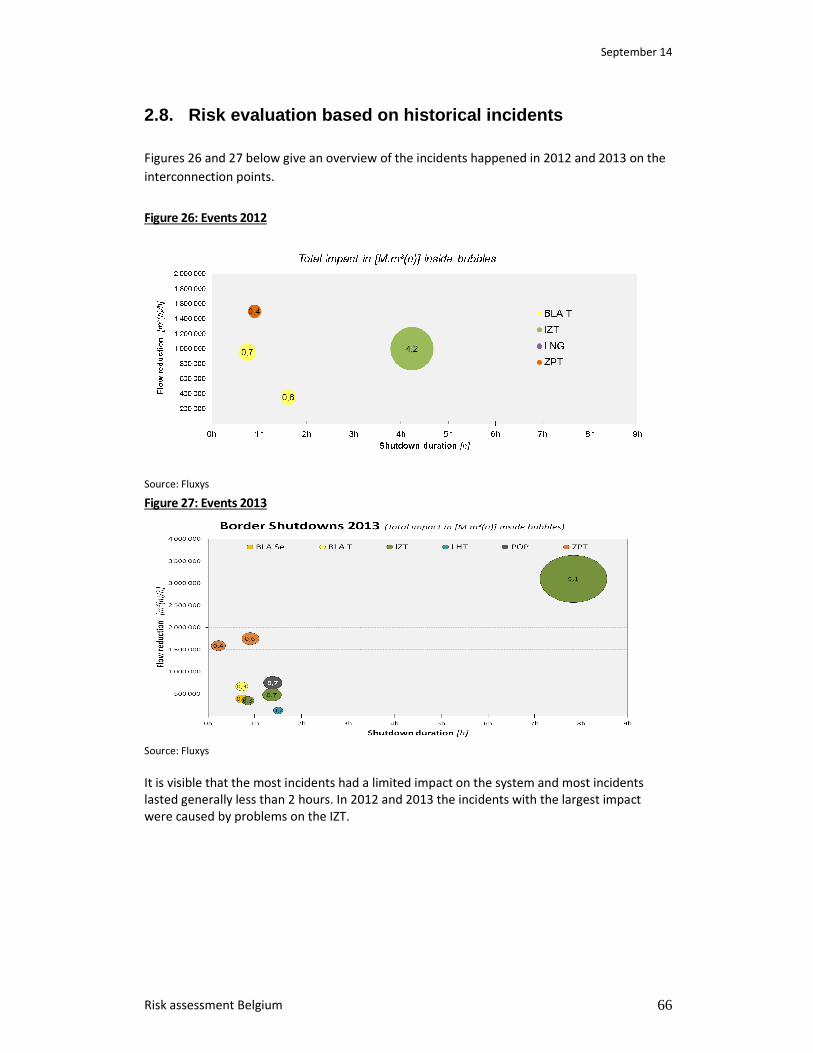
September 14
Risk assessment Belgium 66
2.8. Risk evaluation based on historical incidents
Figures 26 and 27 below give an overview of the incidents happened in 2012 and 2013 on the
interconnection points.
Figure 26: Events 2012
Source: Fluxys
Figure 27: Events 2013
Source: Fluxys
It is visible that the most incidents had a limited impact on the system and most incidents
lasted generally less than 2 hours. In 2012 and 2013 the incidents with the largest impact
were caused by problems on the IZT.
September 14
Risk assessment Belgium 67
3 Risk analysis
3.1. Objectives The objective of the risk analysis is to:
1. define scenarios as combinations of previously identified events (hazards and threats)
that may jeopardize the correct gas system performance.
2. assess the likelihoods of the hazards/threats identified above.
3. assess the consequences/impact under the conditions of each scenario.
4. Assess the elements that may influence the likelihoods and impact of certain threats
and/or hazards.
3.2. Scenario analysis
Scenarios Category
risk Impact Likelihood Timeframe
Threat/
hazard Provenance Duration Timing Severity
Political unrest in
Middle East: LNG
disruption scenario
on 15/01 (Qatar)
Political
risk Severe Low Short term Hazard External 30 days Winter
295
GWh/d
Hurricane in North
Sea: major outage
of supplies from
Norway on 15/01
Environmental
risk Severe Very low Short term Hazard External 1 month Winter
411
GWh/day
Technical failure
major pipeline:
outage of supplies
from the
Netherlands on
5/02
Technical
risk Severe Low Short term Hazard External 7 days Winter
77
GWh/day
Nuclear phase out
Belgium and
impact of increased
gas supplies from
Russia
Political
risk Noticeable High Long term Threat
Internal &
external / / n/a
Failure of Loenhout
storage facility - all
storage capacity
out (15/7)
Geo-political
risk Noticeable Low Short term Threat Internal 2 months Summer
625
mcm/day
3.2.1. Scenario 1: LNG disruption scenario LNG represents about 15% of the import capacity in Belgium and about 10% of the total yearly
gas supplies entering the Belgian network (average 2006-2013). Send out capacity from
Zeebrugge is 1,7 mcm/h (about 9 bcm/y) with a storage capacity of 380.000 m³ LNG. The
Zeebrugge LNG facility has about 5,5 days of autonomy (storage capacity/ daily regasification
capacity).
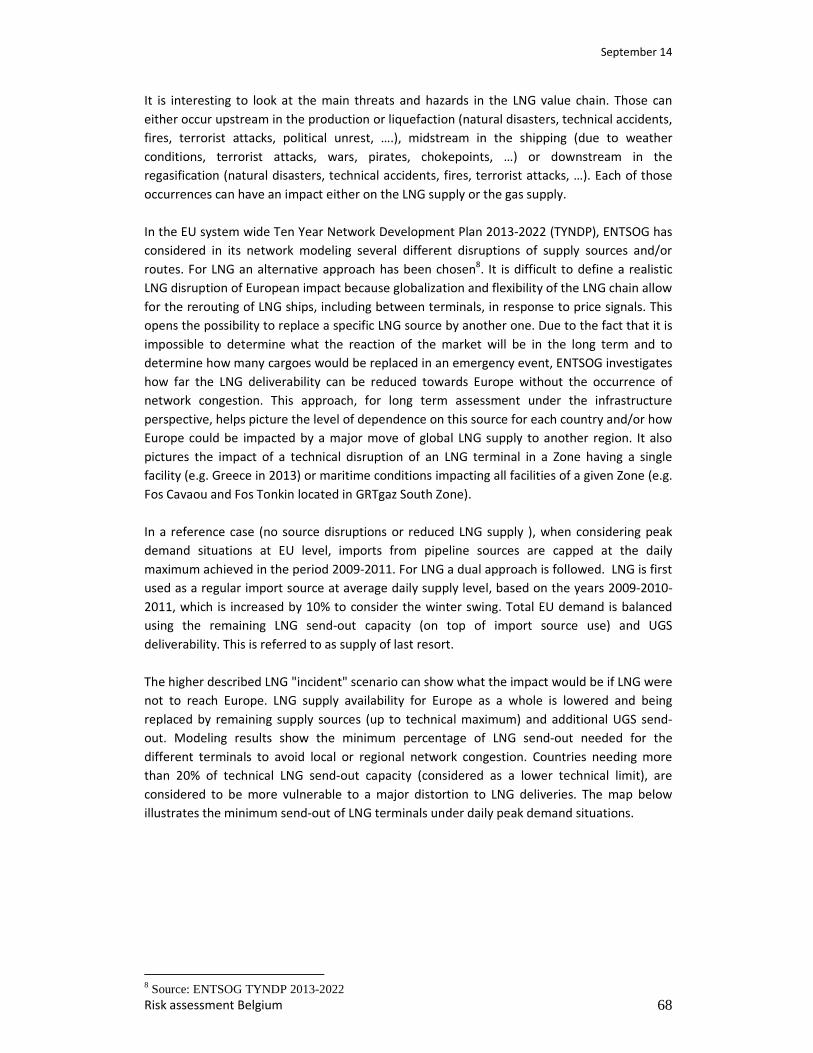
September 14
Risk assessment Belgium 68
It is interesting to look at the main threats and hazards in the LNG value chain. Those can
either occur upstream in the production or liquefaction (natural disasters, technical accidents,
fires, terrorist attacks, political unrest, ….), midstream in the shipping (due to weather
conditions, terrorist attacks, wars, pirates, chokepoints, …) or downstream in the
regasification (natural disasters, technical accidents, fires, terrorist attacks, …). Each of those
occurrences can have an impact either on the LNG supply or the gas supply.
In the EU system wide Ten Year Network Development Plan 2013-2022 (TYNDP), ENTSOG has
considered in its network modeling several different disruptions of supply sources and/or
routes. For LNG an alternative approach has been chosen8. It is difficult to define a realistic
LNG disruption of European impact because globalization and flexibility of the LNG chain allow
for the rerouting of LNG ships, including between terminals, in response to price signals. This
opens the possibility to replace a specific LNG source by another one. Due to the fact that it is
impossible to determine what the reaction of the market will be in the long term and to
determine how many cargoes would be replaced in an emergency event, ENTSOG investigates
how far the LNG deliverability can be reduced towards Europe without the occurrence of
network congestion. This approach, for long term assessment under the infrastructure
perspective, helps picture the level of dependence on this source for each country and/or how
Europe could be impacted by a major move of global LNG supply to another region. It also
pictures the impact of a technical disruption of an LNG terminal in a Zone having a single
facility (e.g. Greece in 2013) or maritime conditions impacting all facilities of a given Zone (e.g.
Fos Cavaou and Fos Tonkin located in GRTgaz South Zone).
In a reference case (no source disruptions or reduced LNG supply ), when considering peak
demand situations at EU level, imports from pipeline sources are capped at the daily
maximum achieved in the period 2009-2011. For LNG a dual approach is followed. LNG is first
used as a regular import source at average daily supply level, based on the years 2009-2010-
2011, which is increased by 10% to consider the winter swing. Total EU demand is balanced
using the remaining LNG send-out capacity (on top of import source use) and UGS
deliverability. This is referred to as supply of last resort.
The higher described LNG "incident" scenario can show what the impact would be if LNG were
not to reach Europe. LNG supply availability for Europe as a whole is lowered and being
replaced by remaining supply sources (up to technical maximum) and additional UGS send-
out. Modeling results show the minimum percentage of LNG send-out needed for the
different terminals to avoid local or regional network congestion. Countries needing more
than 20% of technical LNG send-out capacity (considered as a lower technical limit), are
considered to be more vulnerable to a major distortion to LNG deliveries. The map below
illustrates the minimum send-out of LNG terminals under daily peak demand situations.
8 Source: ENTSOG TYNDP 2013-2022
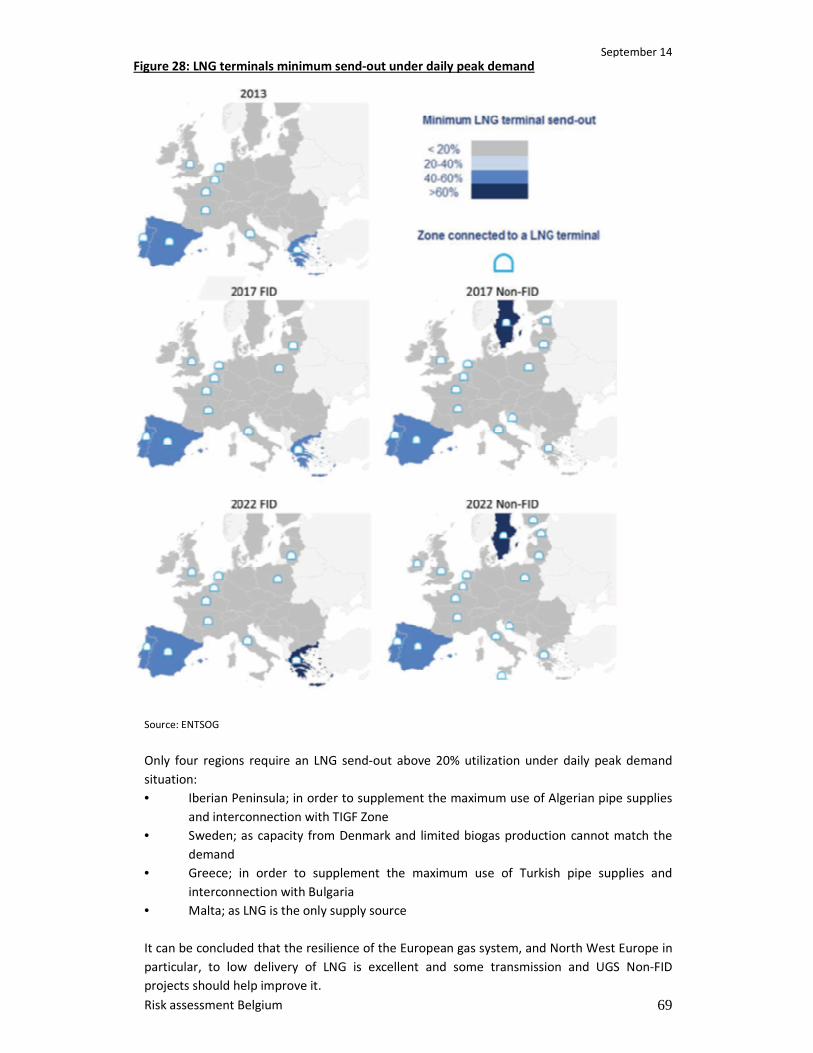
September 14
Risk assessment Belgium 69
Source: ENTSOG
Only four regions require an LNG send-out above 20% utilization under daily peak demand
situation:
• Iberian Peninsula; in order to supplement the maximum use of Algerian pipe supplies
and interconnection with TIGF Zone
• Sweden; as capacity from Denmark and limited biogas production cannot match the
demand
• Greece; in order to supplement the maximum use of Turkish pipe supplies and
interconnection with Bulgaria
• Malta; as LNG is the only supply source
It can be concluded that the resilience of the European gas system, and North West Europe in
particular, to low delivery of LNG is excellent and some transmission and UGS Non-FID
projects should help improve it.
Figure 28: LNG terminals minimum send-out under daily peak demand
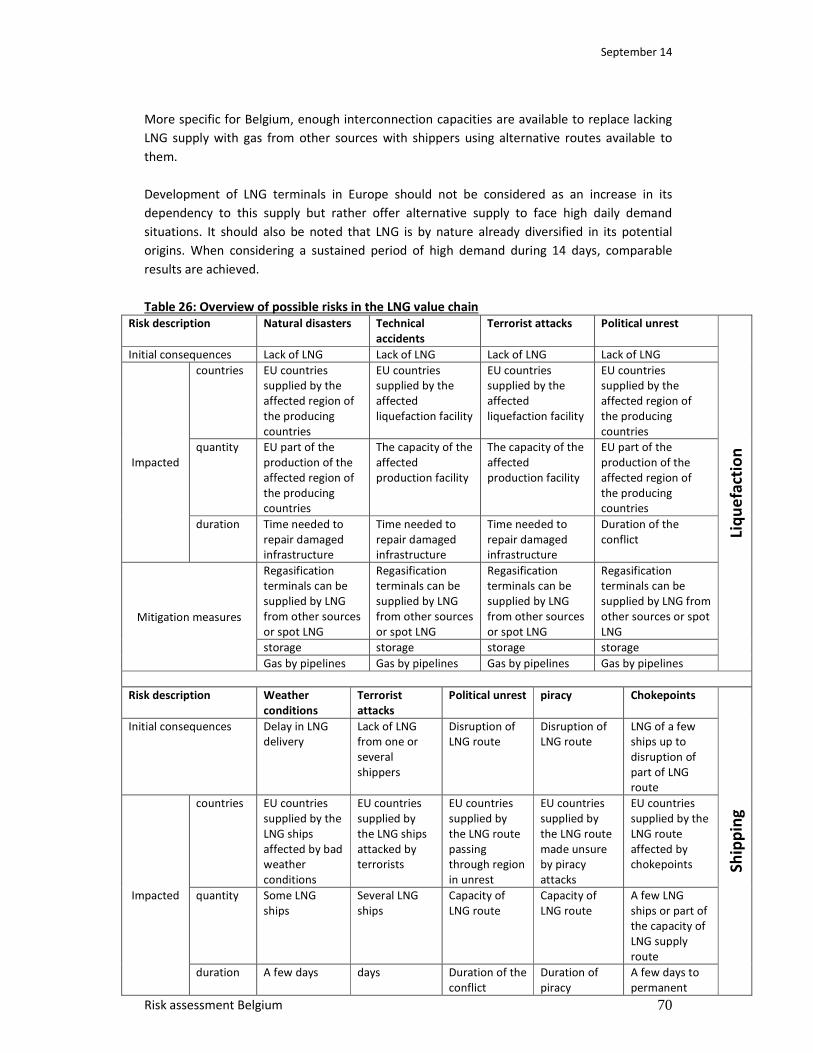
September 14
Risk assessment Belgium 70
More specific for Belgium, enough interconnection capacities are available to replace lacking
LNG supply with gas from other sources with shippers using alternative routes available to
them.
Development of LNG terminals in Europe should not be considered as an increase in its
dependency to this supply but rather offer alternative supply to face high daily demand
situations. It should also be noted that LNG is by nature already diversified in its potential
origins. When considering a sustained period of high demand during 14 days, comparable
results are achieved.
Table 26: Overview of possible risks in the LNG value chain
Risk description Natural disasters Technical
accidents
Terrorist attacks Political unrest
Liq
ue
fact
ion
Initial consequences Lack of LNG Lack of LNG Lack of LNG Lack of LNG
Impacted
countries EU countries
supplied by the
affected region of
the producing
countries
EU countries
supplied by the
affected
liquefaction facility
EU countries
supplied by the
affected
liquefaction facility
EU countries
supplied by the
affected region of
the producing
countries
quantity EU part of the
production of the
affected region of
the producing
countries
The capacity of the
affected
production facility
The capacity of the
affected
production facility
EU part of the
production of the
affected region of
the producing
countries
duration Time needed to
repair damaged
infrastructure
Time needed to
repair damaged
infrastructure
Time needed to
repair damaged
infrastructure
Duration of the
conflict
Mitigation measures
Regasification
terminals can be
supplied by LNG
from other sources
or spot LNG
Regasification
terminals can be
supplied by LNG
from other sources
or spot LNG
Regasification
terminals can be
supplied by LNG
from other sources
or spot LNG
Regasification
terminals can be
supplied by LNG from
other sources or spot
LNG
storage storage storage storage
Gas by pipelines Gas by pipelines Gas by pipelines Gas by pipelines
Risk description Weather
conditions
Terrorist
attacks
Political unrest piracy Chokepoints
Sh
ipp
ing
Initial consequences Delay in LNG
delivery
Lack of LNG
from one or
several
shippers
Disruption of
LNG route
Disruption of
LNG route
LNG of a few
ships up to
disruption of
part of LNG
route
Impacted
countries EU countries
supplied by the
LNG ships
affected by bad
weather
conditions
EU countries
supplied by
the LNG ships
attacked by
terrorists
EU countries
supplied by
the LNG route
passing
through region
in unrest
EU countries
supplied by
the LNG route
made unsure
by piracy
attacks
EU countries
supplied by the
LNG route
affected by
chokepoints
quantity Some LNG
ships
Several LNG
ships
Capacity of
LNG route
Capacity of
LNG route
A few LNG
ships or part of
the capacity of
LNG supply
route
duration A few days days Duration of the
conflict
Duration of
piracy
A few days to
permanent
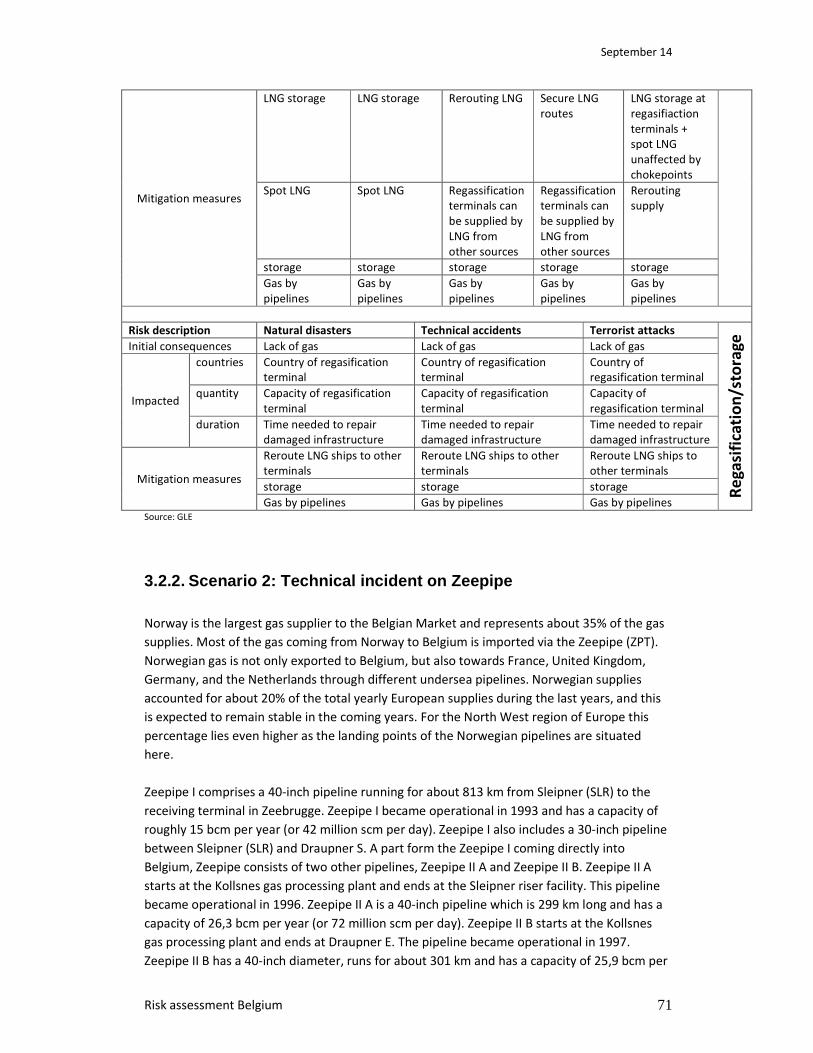
September 14
Risk assessment Belgium 71
Mitigation measures
LNG storage LNG storage Rerouting LNG Secure LNG
routes
LNG storage at
regasifiaction
terminals +
spot LNG
unaffected by
chokepoints
Spot LNG Spot LNG Regassification
terminals can
be supplied by
LNG from
other sources
Regassification
terminals can
be supplied by
LNG from
other sources
Rerouting
supply
storage storage storage storage storage
Gas by
pipelines
Gas by
pipelines
Gas by
pipelines
Gas by
pipelines
Gas by
pipelines
Risk description Natural disasters Technical accidents Terrorist attacks
Re
ga
sifi
cati
on
/sto
rag
e
Initial consequences Lack of gas Lack of gas Lack of gas
Impacted
countries Country of regasification
terminal
Country of regasification
terminal
Country of
regasification terminal
quantity Capacity of regasification
terminal
Capacity of regasification
terminal
Capacity of
regasification terminal
duration Time needed to repair
damaged infrastructure
Time needed to repair
damaged infrastructure
Time needed to repair
damaged infrastructure
Mitigation measures
Reroute LNG ships to other
terminals
Reroute LNG ships to other
terminals
Reroute LNG ships to
other terminals
storage storage storage
Gas by pipelines Gas by pipelines Gas by pipelines Source: GLE
3.2.2. Scenario 2: Technical incident on Zeepipe Norway is the largest gas supplier to the Belgian Market and represents about 35% of the gas
supplies. Most of the gas coming from Norway to Belgium is imported via the Zeepipe (ZPT).
Norwegian gas is not only exported to Belgium, but also towards France, United Kingdom,
Germany, and the Netherlands through different undersea pipelines. Norwegian supplies
accounted for about 20% of the total yearly European supplies during the last years, and this
is expected to remain stable in the coming years. For the North West region of Europe this
percentage lies even higher as the landing points of the Norwegian pipelines are situated
here.
Zeepipe I comprises a 40-inch pipeline running for about 813 km from Sleipner (SLR) to the
receiving terminal in Zeebrugge. Zeepipe I became operational in 1993 and has a capacity of
roughly 15 bcm per year (or 42 million scm per day). Zeepipe I also includes a 30-inch pipeline
between Sleipner (SLR) and Draupner S. A part form the Zeepipe I coming directly into
Belgium, Zeepipe consists of two other pipelines, Zeepipe II A and Zeepipe II B. Zeepipe II A
starts at the Kollsnes gas processing plant and ends at the Sleipner riser facility. This pipeline
became operational in 1996. Zeepipe II A is a 40-inch pipeline which is 299 km long and has a
capacity of 26,3 bcm per year (or 72 million scm per day). Zeepipe II B starts at the Kollsnes
gas processing plant and ends at Draupner E. The pipeline became operational in 1997.
Zeepipe II B has a 40-inch diameter, runs for about 301 km and has a capacity of 25,9 bcm per
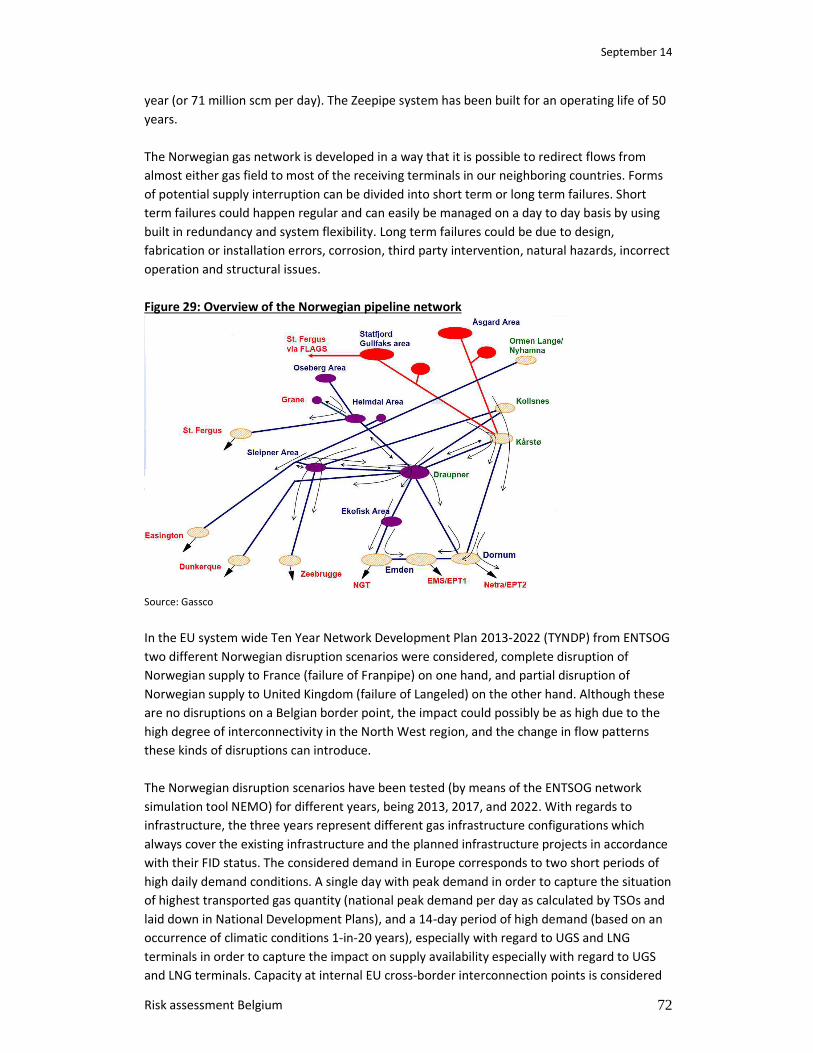
September 14
Risk assessment Belgium 72
year (or 71 million scm per day). The Zeepipe system has been built for an operating life of 50
years.
The Norwegian gas network is developed in a way that it is possible to redirect flows from
almost either gas field to most of the receiving terminals in our neighboring countries. Forms
of potential supply interruption can be divided into short term or long term failures. Short
term failures could happen regular and can easily be managed on a day to day basis by using
built in redundancy and system flexibility. Long term failures could be due to design,
fabrication or installation errors, corrosion, third party intervention, natural hazards, incorrect
operation and structural issues.
Figure 29: Overview of the Norwegian pipeline network
Source: Gassco
In the EU system wide Ten Year Network Development Plan 2013-2022 (TYNDP) from ENTSOG
two different Norwegian disruption scenarios were considered, complete disruption of
Norwegian supply to France (failure of Franpipe) on one hand, and partial disruption of
Norwegian supply to United Kingdom (failure of Langeled) on the other hand. Although these
are no disruptions on a Belgian border point, the impact could possibly be as high due to the
high degree of interconnectivity in the North West region, and the change in flow patterns
these kinds of disruptions can introduce.
The Norwegian disruption scenarios have been tested (by means of the ENTSOG network
simulation tool NEMO) for different years, being 2013, 2017, and 2022. With regards to
infrastructure, the three years represent different gas infrastructure configurations which
always cover the existing infrastructure and the planned infrastructure projects in accordance
with their FID status. The considered demand in Europe corresponds to two short periods of
high daily demand conditions. A single day with peak demand in order to capture the situation
of highest transported gas quantity (national peak demand per day as calculated by TSOs and
laid down in National Development Plans), and a 14-day period of high demand (based on an
occurrence of climatic conditions 1-in-20 years), especially with regard to UGS and LNG
terminals in order to capture the impact on supply availability especially with regard to UGS
and LNG terminals. Capacity at internal EU cross-border interconnection points is considered
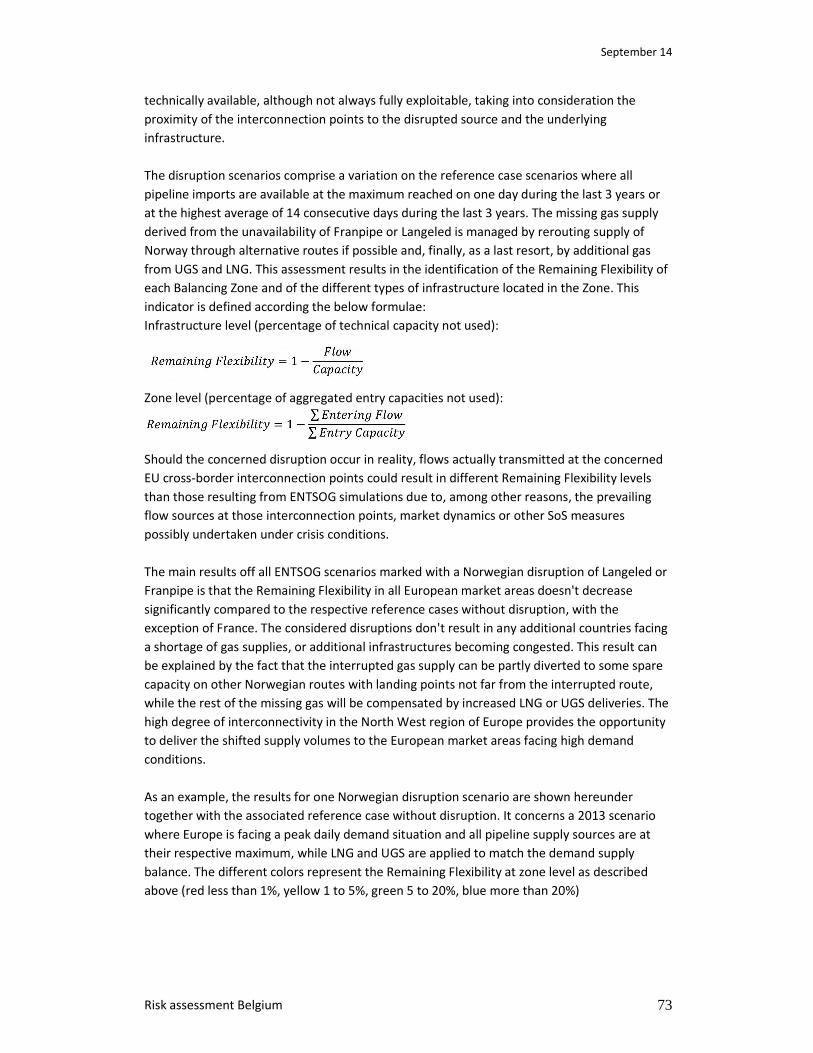
September 14
Risk assessment Belgium 73
technically available, although not always fully exploitable, taking into consideration the
proximity of the interconnection points to the disrupted source and the underlying
infrastructure.
The disruption scenarios comprise a variation on the reference case scenarios where all
pipeline imports are available at the maximum reached on one day during the last 3 years or
at the highest average of 14 consecutive days during the last 3 years. The missing gas supply
derived from the unavailability of Franpipe or Langeled is managed by rerouting supply of
Norway through alternative routes if possible and, finally, as a last resort, by additional gas
from UGS and LNG. This assessment results in the identification of the Remaining Flexibility of
each Balancing Zone and of the different types of infrastructure located in the Zone. This
indicator is defined according the below formulae:
Infrastructure level (percentage of technical capacity not used):
Zone level (percentage of aggregated entry capacities not used):
Should the concerned disruption occur in reality, flows actually transmitted at the concerned
EU cross-border interconnection points could result in different Remaining Flexibility levels
than those resulting from ENTSOG simulations due to, among other reasons, the prevailing
flow sources at those interconnection points, market dynamics or other SoS measures
possibly undertaken under crisis conditions.
The main results off all ENTSOG scenarios marked with a Norwegian disruption of Langeled or
Franpipe is that the Remaining Flexibility in all European market areas doesn't decrease
significantly compared to the respective reference cases without disruption, with the
exception of France. The considered disruptions don't result in any additional countries facing
a shortage of gas supplies, or additional infrastructures becoming congested. This result can
be explained by the fact that the interrupted gas supply can be partly diverted to some spare
capacity on other Norwegian routes with landing points not far from the interrupted route,
while the rest of the missing gas will be compensated by increased LNG or UGS deliveries. The
high degree of interconnectivity in the North West region of Europe provides the opportunity
to deliver the shifted supply volumes to the European market areas facing high demand
conditions.
As an example, the results for one Norwegian disruption scenario are shown hereunder
together with the associated reference case without disruption. It concerns a 2013 scenario
where Europe is facing a peak daily demand situation and all pipeline supply sources are at
their respective maximum, while LNG and UGS are applied to match the demand supply
balance. The different colors represent the Remaining Flexibility at zone level as described
above (red less than 1%, yellow 1 to 5%, green 5 to 20%, blue more than 20%)
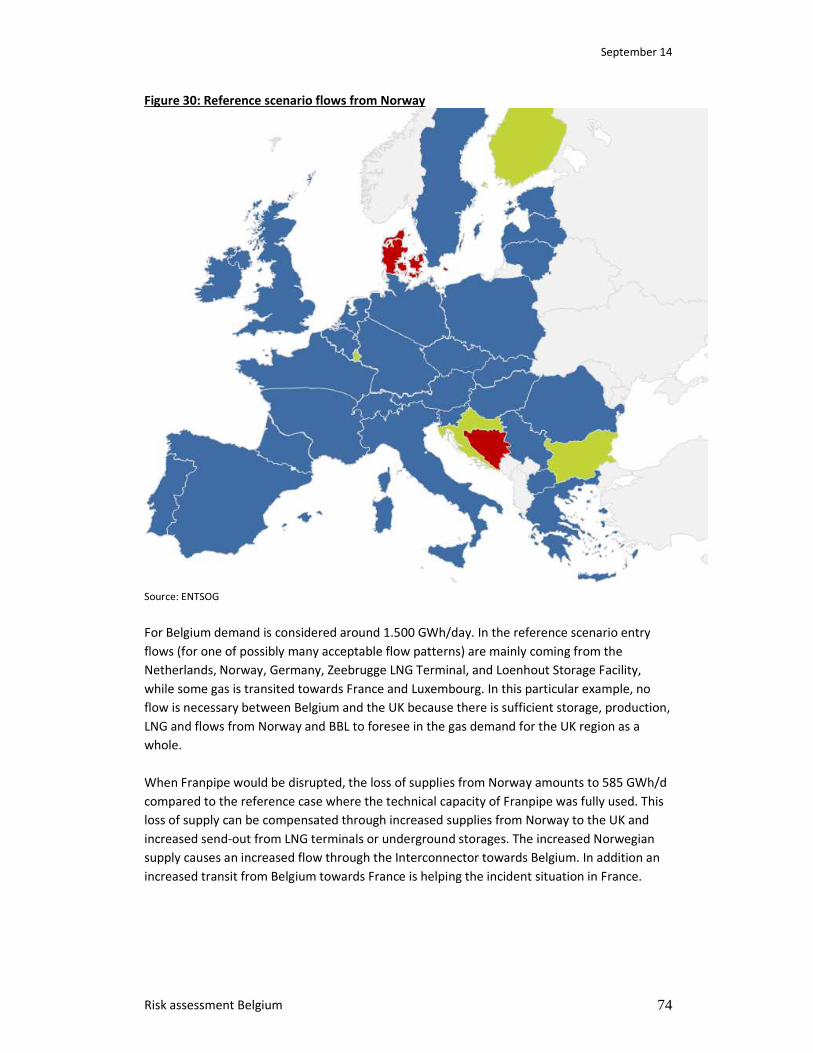
September 14
Risk assessment Belgium 74
Figure 30: Reference scenario flows from Norway
Source: ENTSOG
For Belgium demand is considered around 1.500 GWh/day. In the reference scenario entry
flows (for one of possibly many acceptable flow patterns) are mainly coming from the
Netherlands, Norway, Germany, Zeebrugge LNG Terminal, and Loenhout Storage Facility,
while some gas is transited towards France and Luxembourg. In this particular example, no
flow is necessary between Belgium and the UK because there is sufficient storage, production,
LNG and flows from Norway and BBL to foresee in the gas demand for the UK region as a
whole.
When Franpipe would be disrupted, the loss of supplies from Norway amounts to 585 GWh/d
compared to the reference case where the technical capacity of Franpipe was fully used. This
loss of supply can be compensated through increased supplies from Norway to the UK and
increased send-out from LNG terminals or underground storages. The increased Norwegian
supply causes an increased flow through the Interconnector towards Belgium. In addition an
increased transit from Belgium towards France is helping the incident situation in France.

September 14
Risk assessment Belgium 75
Figure 31: Flows with Franpipe out of operation
Source: ENTSOG
The flow situations shown above are one of many conceivable flow situations and do not
necessarily mean that in reality the flow distribution will be the same in case of such events.
The simulations show only that disruptions can be managed by using the technical capacity
and the usual flow schemes. The considered technical capacities of installations and
interconnection points in the ENTSOG simulation tool are the result of input from the
concerned TSOs. In this way all resulting EU wide flow patterns are implicitly checked on a
national level through entry-exit hydraulic simulations.
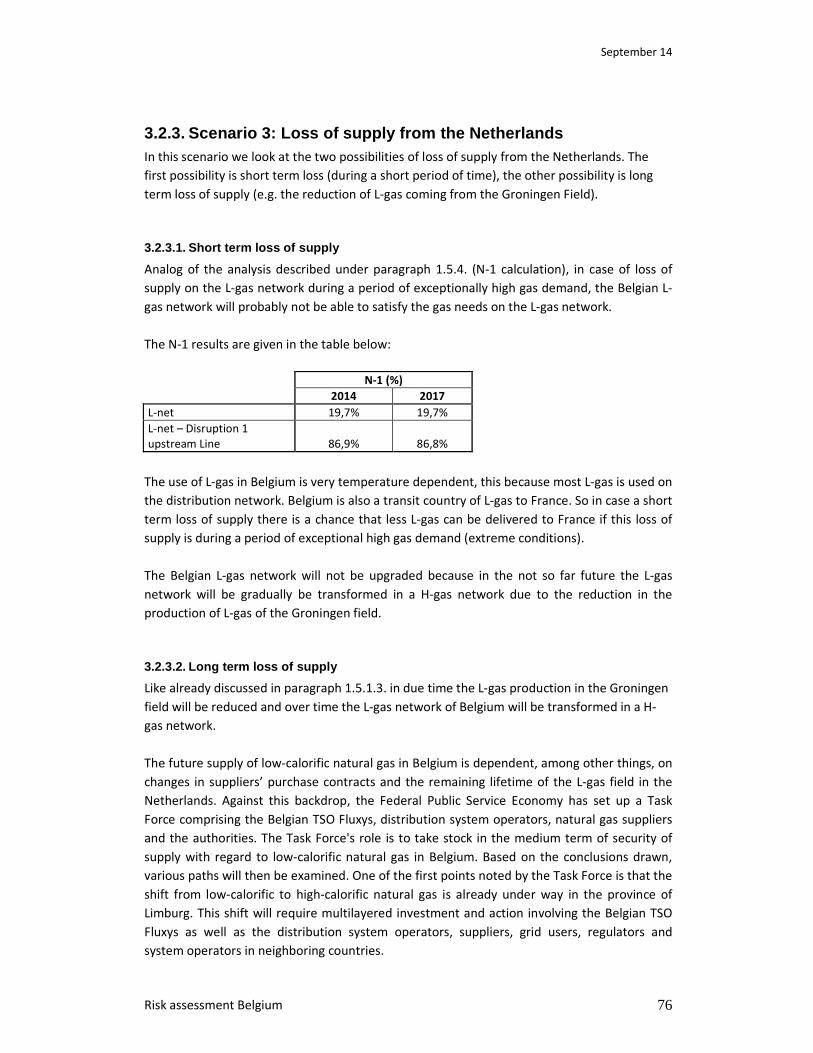
September 14
Risk assessment Belgium 76
3.2.3. Scenario 3: Loss of supply from the Netherlands In this scenario we look at the two possibilities of loss of supply from the Netherlands. The
first possibility is short term loss (during a short period of time), the other possibility is long
term loss of supply (e.g. the reduction of L-gas coming from the Groningen Field).
3.2.3.1. Short term loss of supply
Analog of the analysis described under paragraph 1.5.4. (N-1 calculation), in case of loss of
supply on the L-gas network during a period of exceptionally high gas demand, the Belgian L-
gas network will probably not be able to satisfy the gas needs on the L-gas network.
The N-1 results are given in the table below:
N-1 (%)
2014 2017
L-net 19,7% 19,7%
L-net – Disruption 1
upstream Line 86,9% 86,8%
The use of L-gas in Belgium is very temperature dependent, this because most L-gas is used on
the distribution network. Belgium is also a transit country of L-gas to France. So in case a short
term loss of supply there is a chance that less L-gas can be delivered to France if this loss of
supply is during a period of exceptional high gas demand (extreme conditions).
The Belgian L-gas network will not be upgraded because in the not so far future the L-gas
network will be gradually be transformed in a H-gas network due to the reduction in the
production of L-gas of the Groningen field.
3.2.3.2. Long term loss of supply
Like already discussed in paragraph 1.5.1.3. in due time the L-gas production in the Groningen
field will be reduced and over time the L-gas network of Belgium will be transformed in a H-
gas network.
The future supply of low-calorific natural gas in Belgium is dependent, among other things, on
changes in suppliers’ purchase contracts and the remaining lifetime of the L-gas field in the
Netherlands. Against this backdrop, the Federal Public Service Economy has set up a Task
Force comprising the Belgian TSO Fluxys, distribution system operators, natural gas suppliers
and the authorities. The Task Force's role is to take stock in the medium term of security of
supply with regard to low-calorific natural gas in Belgium. Based on the conclusions drawn,
various paths will then be examined. One of the first points noted by the Task Force is that the
shift from low-calorific to high-calorific natural gas is already under way in the province of
Limburg. This shift will require multilayered investment and action involving the Belgian TSO
Fluxys as well as the distribution system operators, suppliers, grid users, regulators and
system operators in neighboring countries.
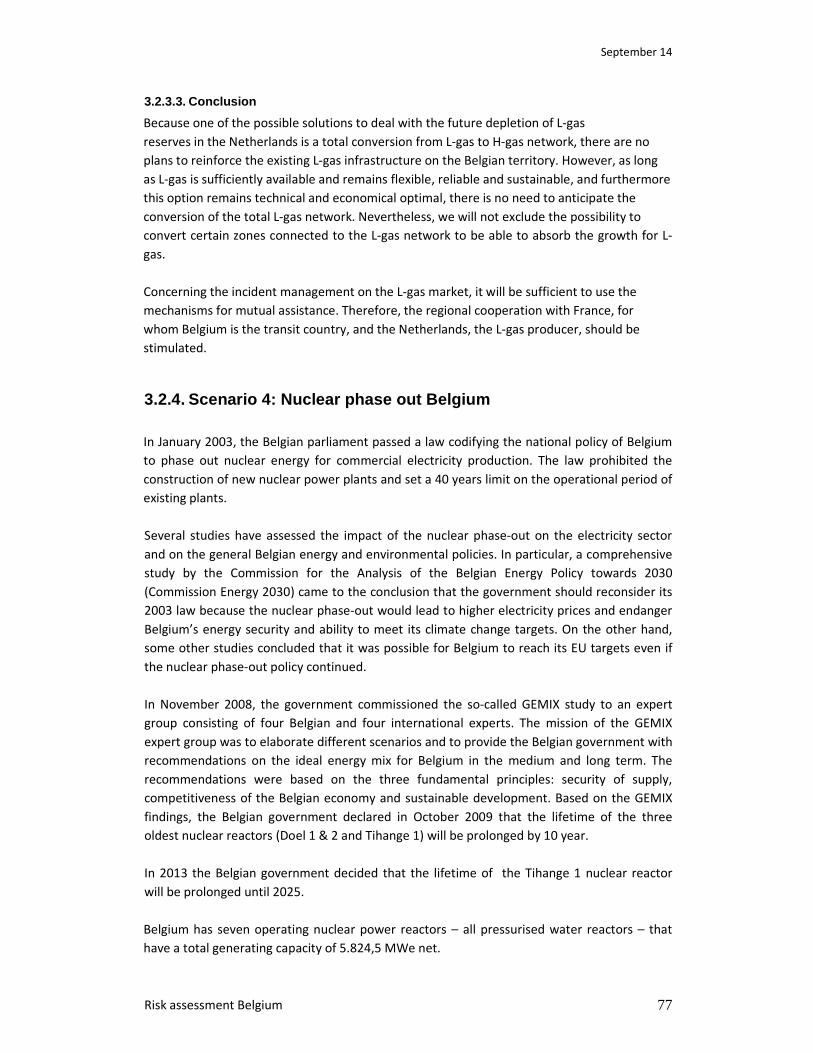
September 14
Risk assessment Belgium 77
3.2.3.3. Conclusion
Because one of the possible solutions to deal with the future depletion of L-gas
reserves in the Netherlands is a total conversion from L-gas to H-gas network, there are no
plans to reinforce the existing L-gas infrastructure on the Belgian territory. However, as long
as L-gas is sufficiently available and remains flexible, reliable and sustainable, and furthermore
this option remains technical and economical optimal, there is no need to anticipate the
conversion of the total L-gas network. Nevertheless, we will not exclude the possibility to
convert certain zones connected to the L-gas network to be able to absorb the growth for L-
gas.
Concerning the incident management on the L-gas market, it will be sufficient to use the
mechanisms for mutual assistance. Therefore, the regional cooperation with France, for
whom Belgium is the transit country, and the Netherlands, the L-gas producer, should be
stimulated.
3.2.4. Scenario 4: Nuclear phase out Belgium In January 2003, the Belgian parliament passed a law codifying the national policy of Belgium
to phase out nuclear energy for commercial electricity production. The law prohibited the
construction of new nuclear power plants and set a 40 years limit on the operational period of
existing plants.
Several studies have assessed the impact of the nuclear phase-out on the electricity sector
and on the general Belgian energy and environmental policies. In particular, a comprehensive
study by the Commission for the Analysis of the Belgian Energy Policy towards 2030
(Commission Energy 2030) came to the conclusion that the government should reconsider its
2003 law because the nuclear phase-out would lead to higher electricity prices and endanger
Belgium’s energy security and ability to meet its climate change targets. On the other hand,
some other studies concluded that it was possible for Belgium to reach its EU targets even if
the nuclear phase-out policy continued.
In November 2008, the government commissioned the so-called GEMIX study to an expert
group consisting of four Belgian and four international experts. The mission of the GEMIX
expert group was to elaborate different scenarios and to provide the Belgian government with
recommendations on the ideal energy mix for Belgium in the medium and long term. The
recommendations were based on the three fundamental principles: security of supply,
competitiveness of the Belgian economy and sustainable development. Based on the GEMIX
findings, the Belgian government declared in October 2009 that the lifetime of the three
oldest nuclear reactors (Doel 1 & 2 and Tihange 1) will be prolonged by 10 year.
In 2013 the Belgian government decided that the lifetime of the Tihange 1 nuclear reactor
will be prolonged until 2025.
Belgium has seven operating nuclear power reactors – all pressurised water reactors – that
have a total generating capacity of 5.824,5 MWe net.
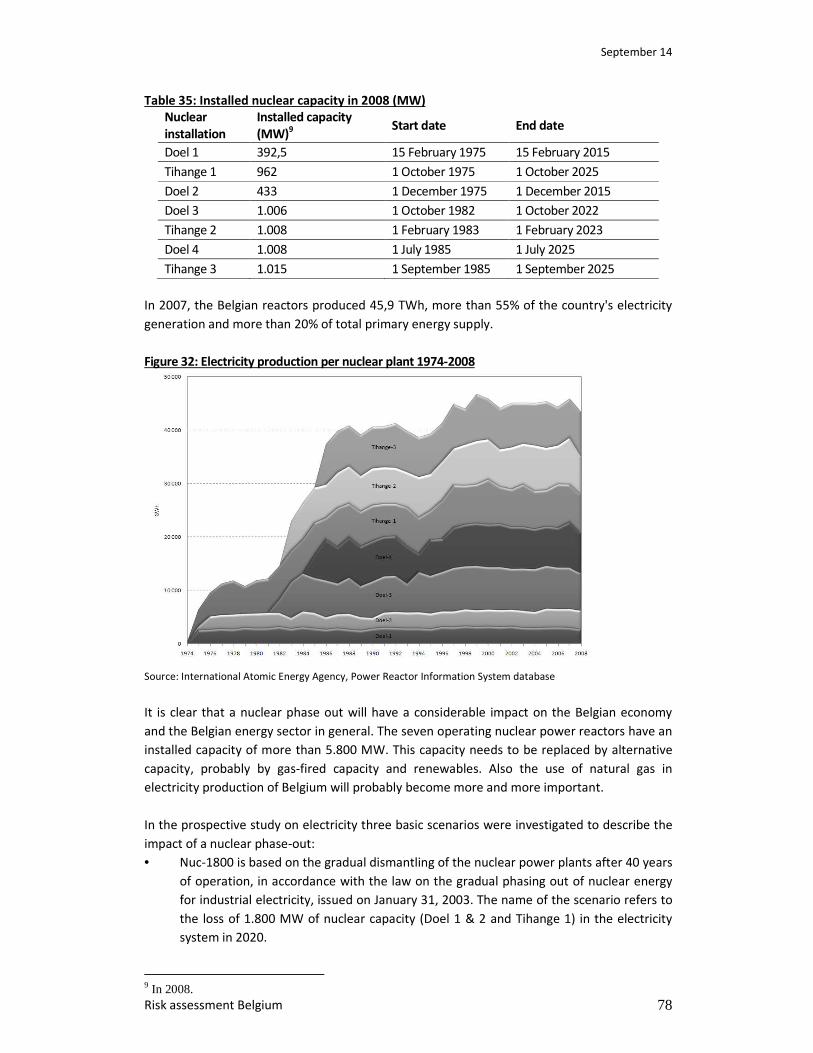
September 14
Risk assessment Belgium 78
Table 35: Installed nuclear capacity in 2008 (MW)
Nuclear
installation
Installed capacity
(MW)9
Start date End date
Doel 1 392,5 15 February 1975 15 February 2015
Tihange 1 962 1 October 1975 1 October 2025
Doel 2 433 1 December 1975 1 December 2015
Doel 3 1.006 1 October 1982 1 October 2022
Tihange 2 1.008 1 February 1983 1 February 2023
Doel 4 1.008 1 July 1985 1 July 2025
Tihange 3 1.015 1 September 1985 1 September 2025
In 2007, the Belgian reactors produced 45,9 TWh, more than 55% of the country's electricity
generation and more than 20% of total primary energy supply.
Figure 32: Electricity production per nuclear plant 1974-2008
Source: International Atomic Energy Agency, Power Reactor Information System database
It is clear that a nuclear phase out will have a considerable impact on the Belgian economy
and the Belgian energy sector in general. The seven operating nuclear power reactors have an
installed capacity of more than 5.800 MW. This capacity needs to be replaced by alternative
capacity, probably by gas-fired capacity and renewables. Also the use of natural gas in
electricity production of Belgium will probably become more and more important.
In the prospective study on electricity three basic scenarios were investigated to describe the
impact of a nuclear phase-out:
• Nuc-1800 is based on the gradual dismantling of the nuclear power plants after 40 years
of operation, in accordance with the law on the gradual phasing out of nuclear energy
for industrial electricity, issued on January 31, 2003. The name of the scenario refers to
the loss of 1.800 MW of nuclear capacity (Doel 1 & 2 and Tihange 1) in the electricity
system in 2020.
9 In 2008.
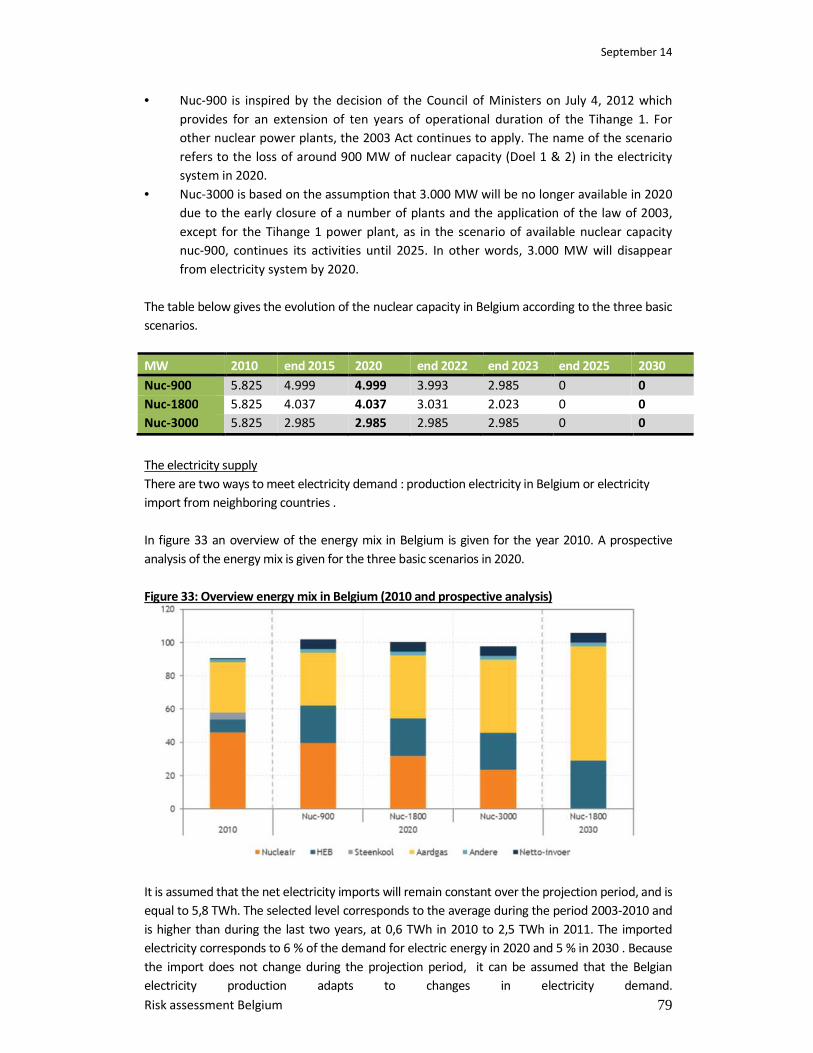
September 14
Risk assessment Belgium 79
• Nuc-900 is inspired by the decision of the Council of Ministers on July 4, 2012 which
provides for an extension of ten years of operational duration of the Tihange 1. For
other nuclear power plants, the 2003 Act continues to apply. The name of the scenario
refers to the loss of around 900 MW of nuclear capacity (Doel 1 & 2) in the electricity
system in 2020.
• Nuc-3000 is based on the assumption that 3.000 MW will be no longer available in 2020
due to the early closure of a number of plants and the application of the law of 2003,
except for the Tihange 1 power plant, as in the scenario of available nuclear capacity
nuc-900, continues its activities until 2025. In other words, 3.000 MW will disappear
from electricity system by 2020.
The table below gives the evolution of the nuclear capacity in Belgium according to the three basic
scenarios.
MW 2010 end 2015 2020 end 2022 end 2023 end 2025 2030
Nuc-900 5.825 4.999 4.999 3.993 2.985 0 0
Nuc-1800 5.825 4.037 4.037 3.031 2.023 0 0
Nuc-3000 5.825 2.985 2.985 2.985 2.985 0 0
The electricity supply
There are two ways to meet electricity demand : production electricity in Belgium or electricity
import from neighboring countries .
In figure 33 an overview of the energy mix in Belgium is given for the year 2010. A prospective
analysis of the energy mix is given for the three basic scenarios in 2020.
Figure 33: Overview energy mix in Belgium (2010 and prospective analysis)
It is assumed that the net electricity imports will remain constant over the projection period, and is
equal to 5,8 TWh. The selected level corresponds to the average during the period 2003-2010 and
is higher than during the last two years, at 0,6 TWh in 2010 to 2,5 TWh in 2011. The imported
electricity corresponds to 6 % of the demand for electric energy in 2020 and 5 % in 2030 . Because
the import does not change during the projection period, it can be assumed that the Belgian
electricity production adapts to changes in electricity demand.
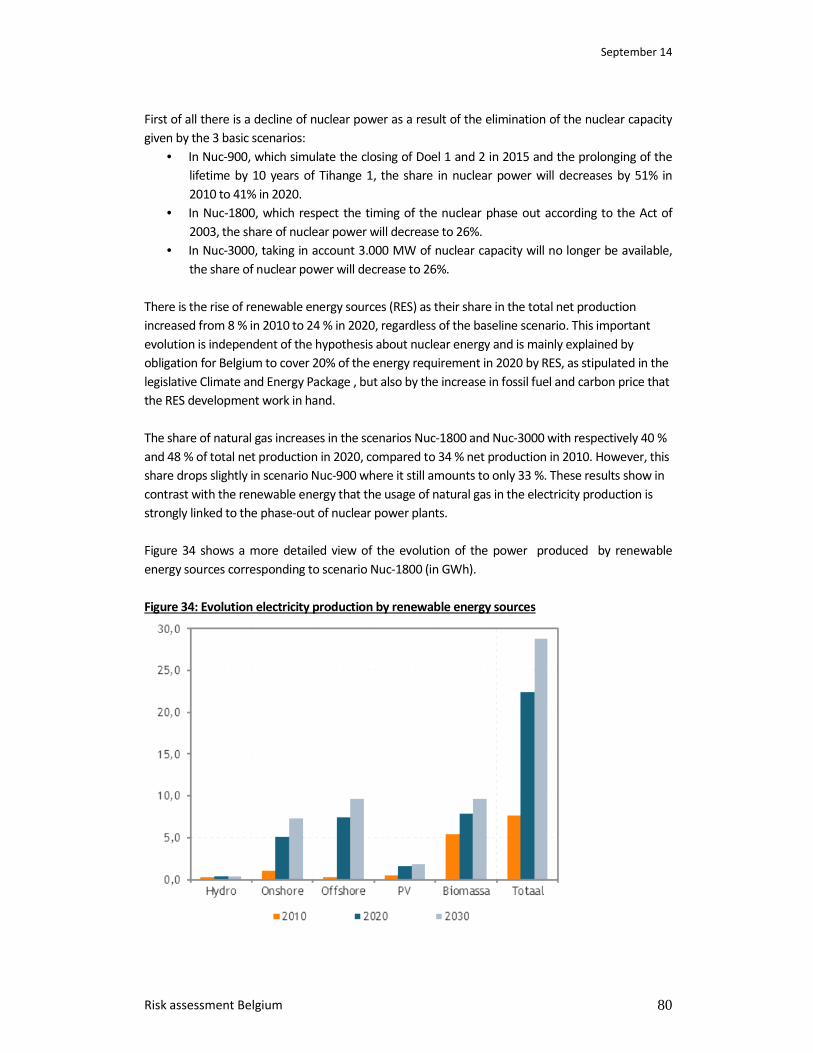
September 14
Risk assessment Belgium 80
First of all there is a decline of nuclear power as a result of the elimination of the nuclear capacity
given by the 3 basic scenarios:
• In Nuc-900, which simulate the closing of Doel 1 and 2 in 2015 and the prolonging of the
lifetime by 10 years of Tihange 1, the share in nuclear power will decreases by 51% in
2010 to 41% in 2020.
• In Nuc-1800, which respect the timing of the nuclear phase out according to the Act of
2003, the share of nuclear power will decrease to 26%.
• In Nuc-3000, taking in account 3.000 MW of nuclear capacity will no longer be available,
the share of nuclear power will decrease to 26%.
There is the rise of renewable energy sources (RES) as their share in the total net production
increased from 8 % in 2010 to 24 % in 2020, regardless of the baseline scenario. This important
evolution is independent of the hypothesis about nuclear energy and is mainly explained by
obligation for Belgium to cover 20% of the energy requirement in 2020 by RES, as stipulated in the
legislative Climate and Energy Package , but also by the increase in fossil fuel and carbon price that
the RES development work in hand.
The share of natural gas increases in the scenarios Nuc-1800 and Nuc-3000 with respectively 40 %
and 48 % of total net production in 2020, compared to 34 % net production in 2010. However, this
share drops slightly in scenario Nuc-900 where it still amounts to only 33 %. These results show in
contrast with the renewable energy that the usage of natural gas in the electricity production is
strongly linked to the phase-out of nuclear power plants.
Figure 34 shows a more detailed view of the evolution of the power produced by renewable
energy sources corresponding to scenario Nuc-1800 (in GWh).
Figure 34: Evolution electricity production by renewable energy sources
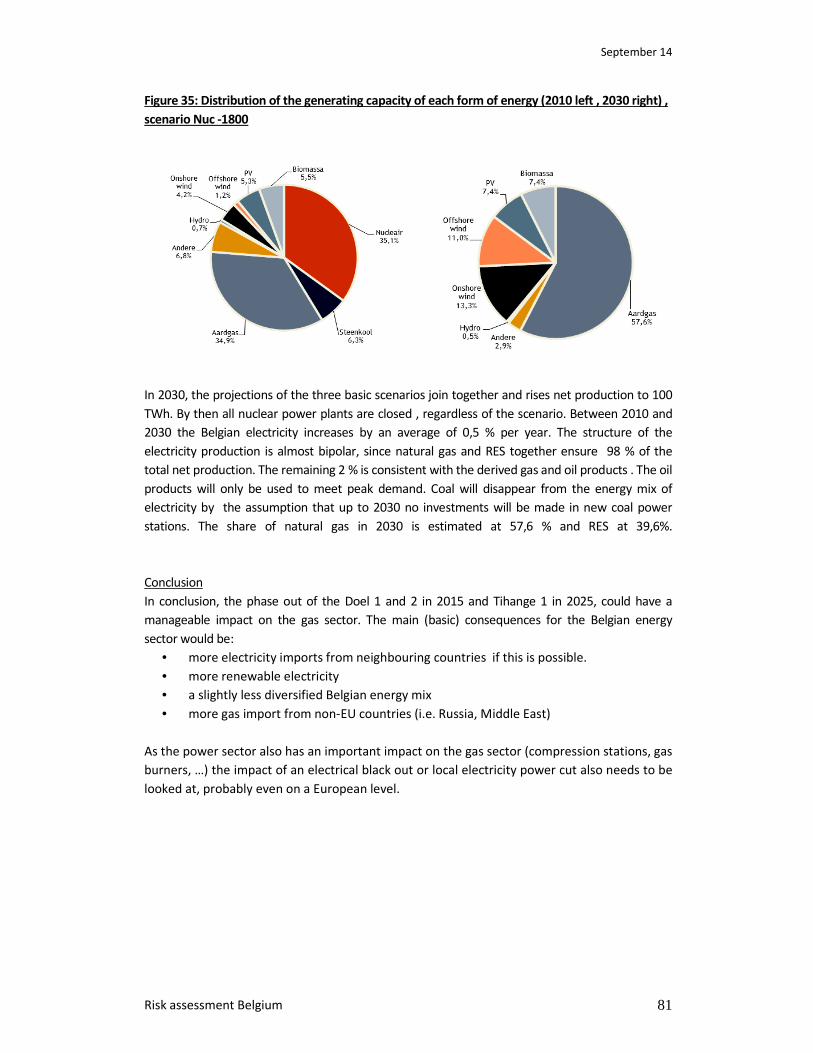
September 14
Risk assessment Belgium 81
Figure 35: Distribution of the generating capacity of each form of energy (2010 left , 2030 right) ,
scenario Nuc -1800
In 2030, the projections of the three basic scenarios join together and rises net production to 100
TWh. By then all nuclear power plants are closed , regardless of the scenario. Between 2010 and
2030 the Belgian electricity increases by an average of 0,5 % per year. The structure of the
electricity production is almost bipolar, since natural gas and RES together ensure 98 % of the
total net production. The remaining 2 % is consistent with the derived gas and oil products . The oil
products will only be used to meet peak demand. Coal will disappear from the energy mix of
electricity by the assumption that up to 2030 no investments will be made in new coal power
stations. The share of natural gas in 2030 is estimated at 57,6 % and RES at 39,6%.
Conclusion
In conclusion, the phase out of the Doel 1 and 2 in 2015 and Tihange 1 in 2025, could have a
manageable impact on the gas sector. The main (basic) consequences for the Belgian energy
sector would be:
• more electricity imports from neighbouring countries if this is possible.
• more renewable electricity
• a slightly less diversified Belgian energy mix
• more gas import from non-EU countries (i.e. Russia, Middle East)
As the power sector also has an important impact on the gas sector (compression stations, gas
burners, …) the impact of an electrical black out or local electricity power cut also needs to be
looked at, probably even on a European level.
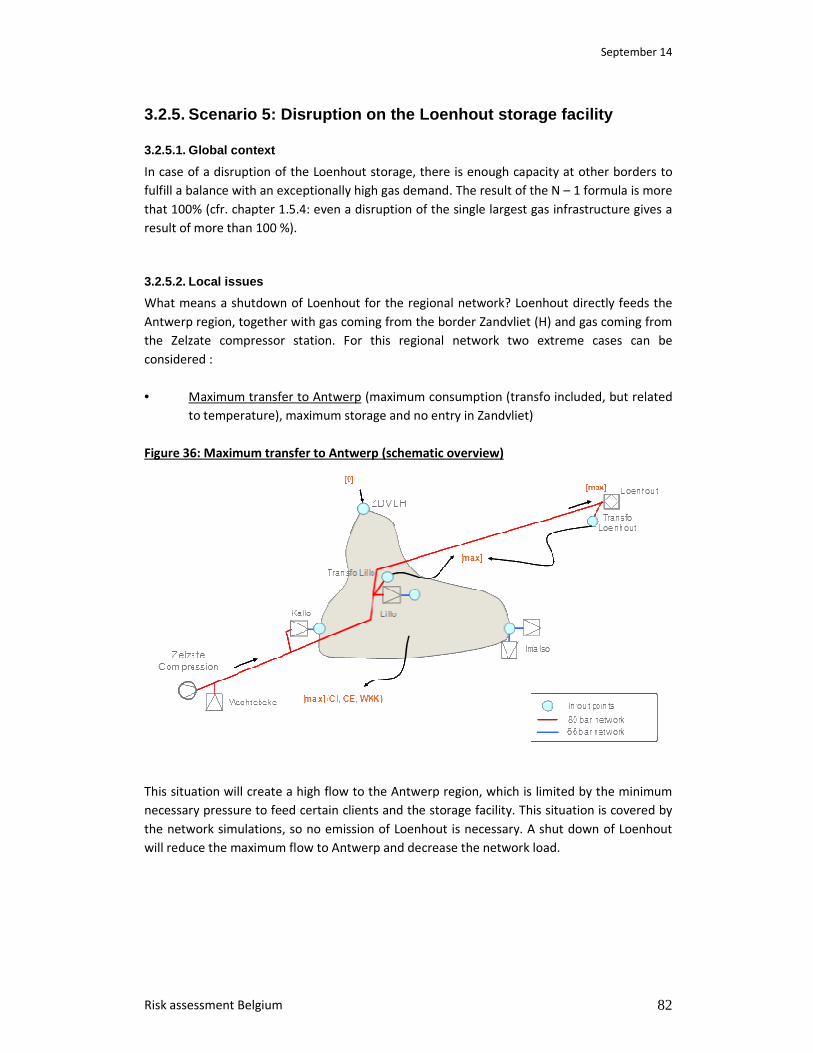
September 14
Risk assessment Belgium 82
3.2.5. Scenario 5: Disruption on the Loenhout storage facility
3.2.5.1. Global context
In case of a disruption of the Loenhout storage, there is enough capacity at other borders to
fulfill a balance with an exceptionally high gas demand. The result of the N – 1 formula is more
that 100% (cfr. chapter 1.5.4: even a disruption of the single largest gas infrastructure gives a
result of more than 100 %).
3.2.5.2. Local issues
What means a shutdown of Loenhout for the regional network? Loenhout directly feeds the
Antwerp region, together with gas coming from the border Zandvliet (H) and gas coming from
the Zelzate compressor station. For this regional network two extreme cases can be
considered :
• Maximum transfer to Antwerp (maximum consumption (transfo included, but related
to temperature), maximum storage and no entry in Zandvliet)
Figure 36: Maximum transfer to Antwerp (schematic overview)
This situation will create a high flow to the Antwerp region, which is limited by the minimum
necessary pressure to feed certain clients and the storage facility. This situation is covered by
the network simulations, so no emission of Loenhout is necessary. A shut down of Loenhout
will reduce the maximum flow to Antwerp and decrease the network load.
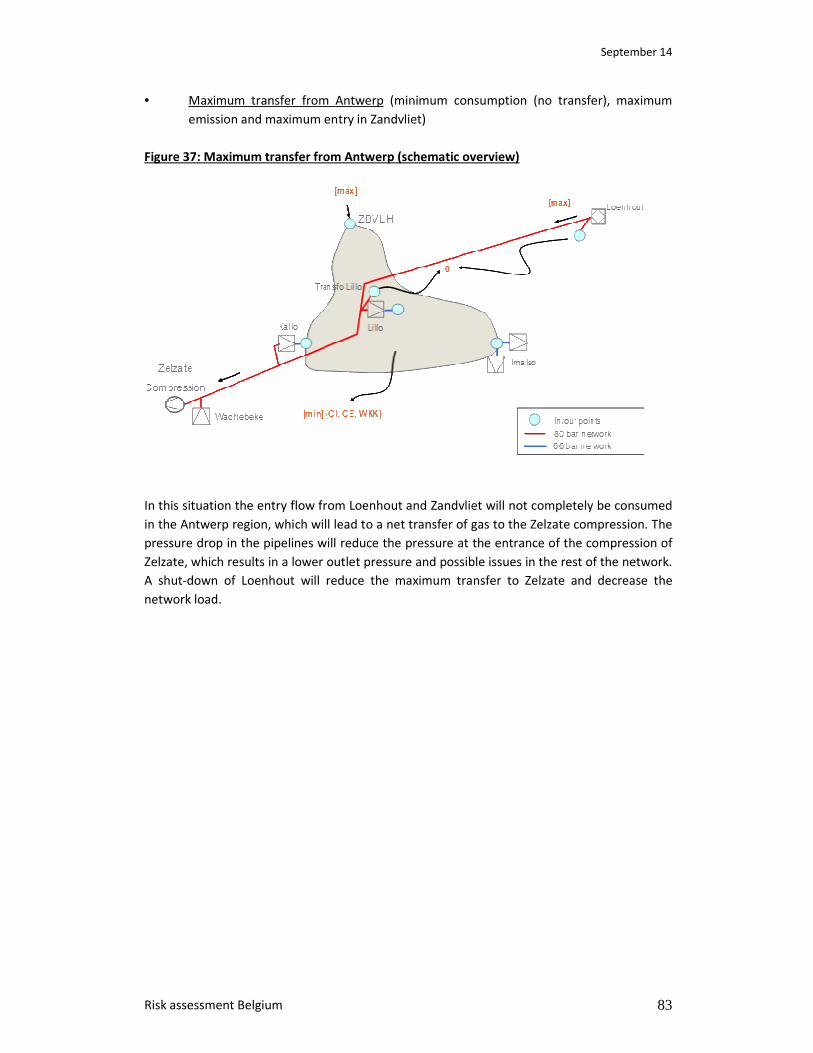
September 14
Risk assessment Belgium 83
• Maximum transfer from Antwerp (minimum consumption (no transfer), maximum
emission and maximum entry in Zandvliet)
Figure 37: Maximum transfer from Antwerp (schematic overview)
In this situation the entry flow from Loenhout and Zandvliet will not completely be consumed
in the Antwerp region, which will lead to a net transfer of gas to the Zelzate compression. The
pressure drop in the pipelines will reduce the pressure at the entrance of the compression of
Zelzate, which results in a lower outlet pressure and possible issues in the rest of the network.
A shut-down of Loenhout will reduce the maximum transfer to Zelzate and decrease the
network load.
September 14
Risk assessment Belgium 84
3.3. Supply standard Analysis of the application of supply criteria given by Article 8 of Regulation 994/2010 in Belgium
When comparing the criteria of Regulation 994/2010 with those applied previously in
Belgium, there are significant differences. It is therefore appropriate to ask whether these
new criteria are adequate or not, to ensure security of supply at a reasonable and prudent
level. The following paragraphs show the first two criteria, and compare the consequences of
their application.
Criteria "molecules" of Regulation 994 /2010
Article 8 of Regulation 994 /2010 provides that Member States require gas companies to take
measures to ensure the supply of natural gas to protected customers of the Member State in
the following cases:
a) extreme temperatures for a period of seven days peak , occurring with a statistical
probability of once in twenty years;
b) a period of at least thirty days of exceptionally high gas demand occurring with a
statistical probability of once in twenty years;
c) a period of at least thirty days in case of failure of the largest gas infrastructure under
average winter conditions.
Historical national criteria10
The criteria used by the industry and once endorsed by the Monitoring Committee of the Gas
and Electricity before the liberalization of the gas and electricity were as follows:
1. the volume of the winter was to cover the consumption of winter 1962/1963 , the
coldest winter of the century (Statistical risk of 1 in 95 years);
2. a peak volume for 5 consecutive days between -10°C and -11°C should be assured
(statistical risk of 1 in 95 years);
3. transport capacity of hourly peak at -11°C must be guaranteed (statistical risk of 1 in
20 years).
The third national standard is to be compared with Article 6 of Regulation 994/2010, which
sets more stringent standards for the infrastructure TSO. This article provides that gas
infrastructure must be able to satisfy total gas demand of the calculated area during a day of
exceptionally high gas demand occurring with a statistical probability of once in twenty years
and this, even in the case of failure of the largest infrastructure. The italicized phrase of the
previous sentence is an additional constraint, requiring the TSO to introduce redundancy to
cope with a failure of the largest infrastructure.
10 NB. The listed temperatures are equivalent to average daily temperatures Uccle.
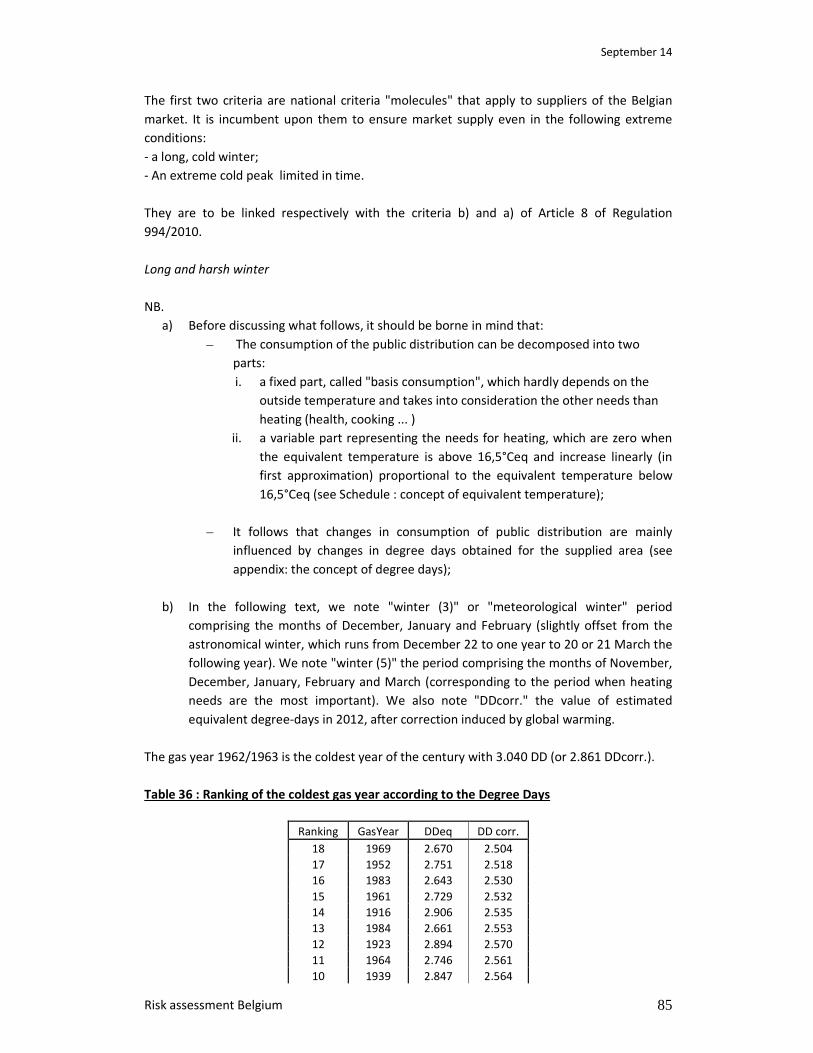
September 14
Risk assessment Belgium 85
The first two criteria are national criteria "molecules" that apply to suppliers of the Belgian
market. It is incumbent upon them to ensure market supply even in the following extreme
conditions:
- a long, cold winter;
- An extreme cold peak limited in time.
They are to be linked respectively with the criteria b) and a) of Article 8 of Regulation
994/2010.
Long and harsh winter
NB.
a) Before discussing what follows, it should be borne in mind that:
– The consumption of the public distribution can be decomposed into two
parts:
i. a fixed part, called "basis consumption", which hardly depends on the
outside temperature and takes into consideration the other needs than
heating (health, cooking ... )
ii. a variable part representing the needs for heating, which are zero when
the equivalent temperature is above 16,5°Ceq and increase linearly (in
first approximation) proportional to the equivalent temperature below
16,5°Ceq (see Schedule : concept of equivalent temperature);
– It follows that changes in consumption of public distribution are mainly
influenced by changes in degree days obtained for the supplied area (see
appendix: the concept of degree days);
b) In the following text, we note "winter (3)" or "meteorological winter" period
comprising the months of December, January and February (slightly offset from the
astronomical winter, which runs from December 22 to one year to 20 or 21 March the
following year). We note "winter (5)" the period comprising the months of November,
December, January, February and March (corresponding to the period when heating
needs are the most important). We also note "DDcorr." the value of estimated
equivalent degree-days in 2012, after correction induced by global warming.
The gas year 1962/1963 is the coldest year of the century with 3.040 DD (or 2.861 DDcorr.).
Table 36 : Ranking of the coldest gas year according to the Degree Days
Ranking GasYear DDeq DD corr.
18 1969 2.670 2.504
17 1952 2.751 2.518
16 1983 2.643 2.530
15 1961 2.729 2.532
14 1916 2.906 2.535
13 1984 2.661 2.553
12 1923 2.894 2.570
11 1964 2.746 2.561
10 1939 2.847 2.564
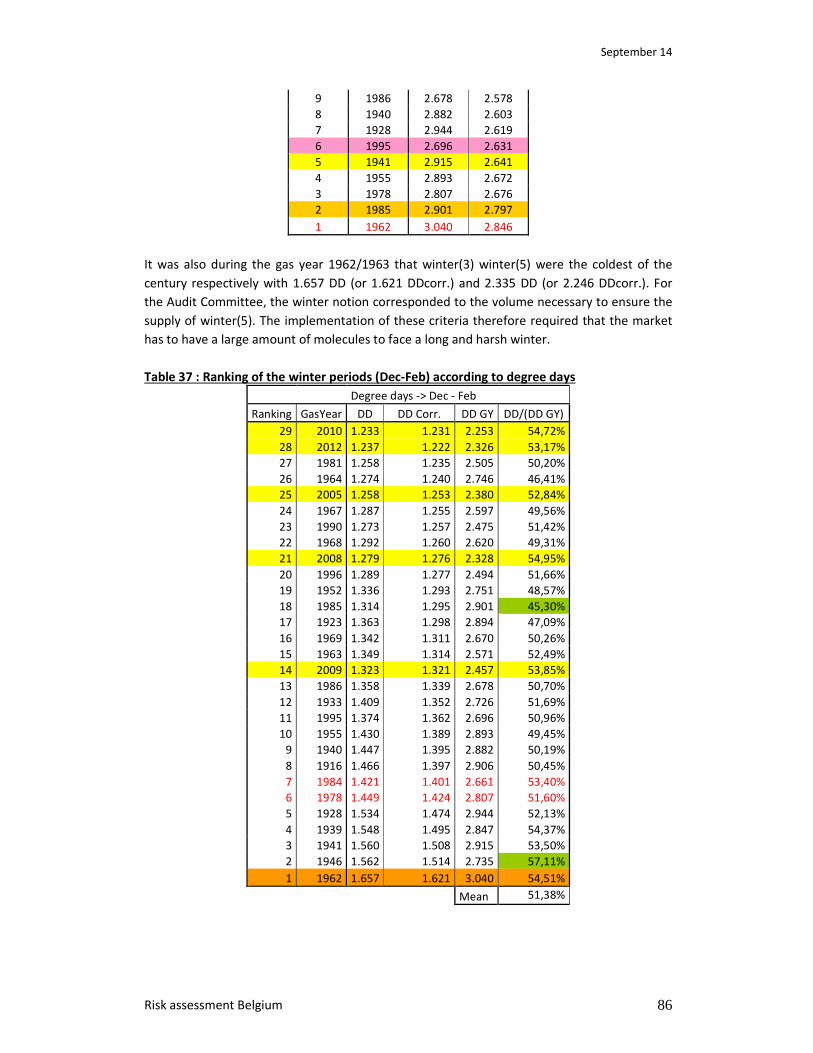
September 14
Risk assessment Belgium 86
9 1986 2.678 2.578
8 1940 2.882 2.603
7 1928 2.944 2.619
6 1995 2.696 2.631
5 1941 2.915 2.641
4 1955 2.893 2.672
3 1978 2.807 2.676
2 1985 2.901 2.797
1 1962 3.040 2.846
It was also during the gas year 1962/1963 that winter(3) winter(5) were the coldest of the
century respectively with 1.657 DD (or 1.621 DDcorr.) and 2.335 DD (or 2.246 DDcorr.). For
the Audit Committee, the winter notion corresponded to the volume necessary to ensure the
supply of winter(5). The implementation of these criteria therefore required that the market
has to have a large amount of molecules to face a long and harsh winter.
Table 37 : Ranking of the winter periods (Dec-Feb) according to degree days
Degree days -> Dec - Feb
Ranking GasYear DD DD Corr. DD GY DD/(DD GY)
29 2010 1.233 1.231 2.253 54,72%
28 2012 1.237 1.222 2.326 53,17%
27 1981 1.258 1.235 2.505 50,20%
26 1964 1.274 1.240 2.746 46,41%
25 2005 1.258 1.253 2.380 52,84%
24 1967 1.287 1.255 2.597 49,56%
23 1990 1.273 1.257 2.475 51,42%
22 1968 1.292 1.260 2.620 49,31%
21 2008 1.279 1.276 2.328 54,95%
20 1996 1.289 1.277 2.494 51,66%
19 1952 1.336 1.293 2.751 48,57%
18 1985 1.314 1.295 2.901 45,30%
17 1923 1.363 1.298 2.894 47,09%
16 1969 1.342 1.311 2.670 50,26%
15 1963 1.349 1.314 2.571 52,49%
14 2009 1.323 1.321 2.457 53,85%
13 1986 1.358 1.339 2.678 50,70%
12 1933 1.409 1.352 2.726 51,69%
11 1995 1.374 1.362 2.696 50,96%
10 1955 1.430 1.389 2.893 49,45%
9 1940 1.447 1.395 2.882 50,19%
8 1916 1.466 1.397 2.906 50,45%
7 1984 1.421 1.401 2.661 53,40%
6 1978 1.449 1.424 2.807 51,60%
5 1928 1.534 1.474 2.944 52,13%
4 1939 1.548 1.495 2.847 54,37%
3 1941 1.560 1.508 2.915 53,50%
2 1946 1.562 1.514 2.735 57,11%
1 1962 1.657 1.621 3.040 54,51%
Mean 51,38%
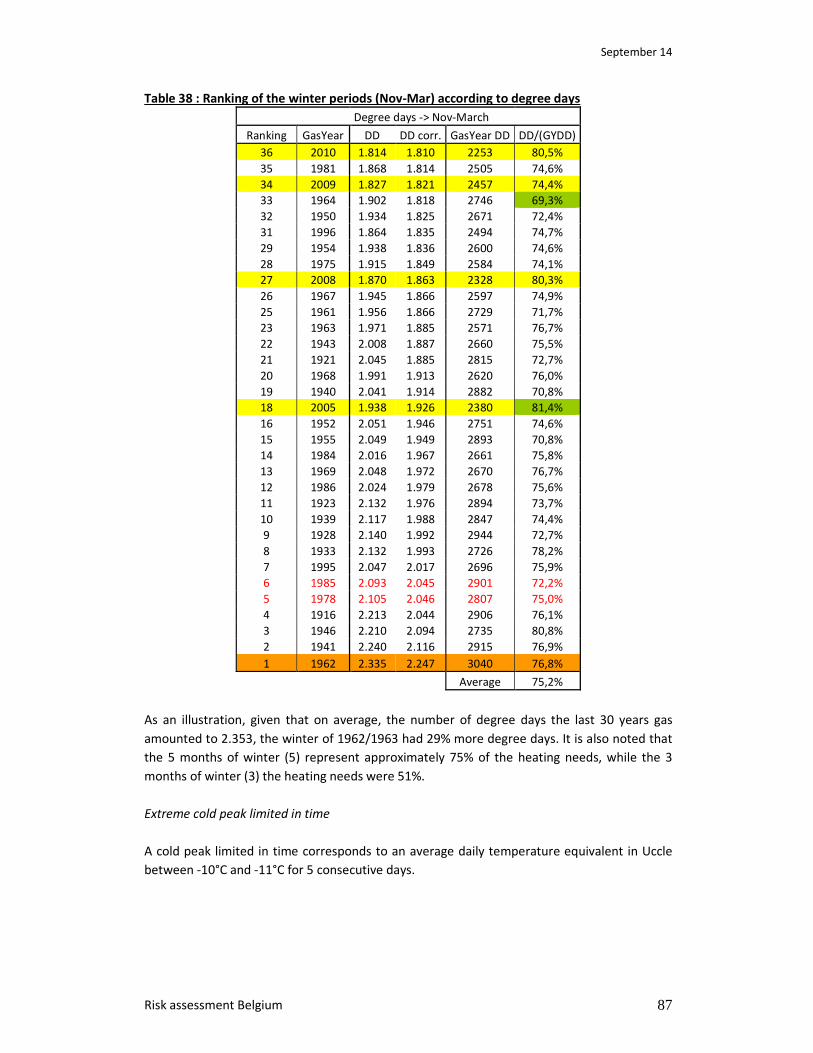
September 14
Risk assessment Belgium 87
Table 38 : Ranking of the winter periods (Nov-Mar) according to degree days
Degree days -> Nov-March
Ranking GasYear DD DD corr. GasYear DD DD/(GYDD)
36 2010 1.814 1.810 2253 80,5%
35 1981 1.868 1.814 2505 74,6%
34 2009 1.827 1.821 2457 74,4%
33 1964 1.902 1.818 2746 69,3%
32 1950 1.934 1.825 2671 72,4%
31 1996 1.864 1.835 2494 74,7%
29 1954 1.938 1.836 2600 74,6%
28 1975 1.915 1.849 2584 74,1%
27 2008 1.870 1.863 2328 80,3%
26 1967 1.945 1.866 2597 74,9%
25 1961 1.956 1.866 2729 71,7%
23 1963 1.971 1.885 2571 76,7%
22 1943 2.008 1.887 2660 75,5%
21 1921 2.045 1.885 2815 72,7%
20 1968 1.991 1.913 2620 76,0%
19 1940 2.041 1.914 2882 70,8%
18 2005 1.938 1.926 2380 81,4%
16 1952 2.051 1.946 2751 74,6%
15 1955 2.049 1.949 2893 70,8%
14 1984 2.016 1.967 2661 75,8%
13 1969 2.048 1.972 2670 76,7%
12 1986 2.024 1.979 2678 75,6%
11 1923 2.132 1.976 2894 73,7%
10 1939 2.117 1.988 2847 74,4%
9 1928 2.140 1.992 2944 72,7%
8 1933 2.132 1.993 2726 78,2%
7 1995 2.047 2.017 2696 75,9%
6 1985 2.093 2.045 2901 72,2%
5 1978 2.105 2.046 2807 75,0%
4 1916 2.213 2.044 2906 76,1%
3 1946 2.210 2.094 2735 80,8%
2 1941 2.240 2.116 2915 76,9%
1 1962 2.335 2.247 3040 76,8%
Average 75,2%
As an illustration, given that on average, the number of degree days the last 30 years gas
amounted to 2.353, the winter of 1962/1963 had 29% more degree days. It is also noted that
the 5 months of winter (5) represent approximately 75% of the heating needs, while the 3
months of winter (3) the heating needs were 51%.
Extreme cold peak limited in time
A cold peak limited in time corresponds to an average daily temperature equivalent in Uccle
between -10°C and -11°C for 5 consecutive days.

September 14
Risk assessment Belgium 88
This reference has its origin in the cold peak of January 1987.
begin end
Equivalent temperatures Average
12/01/1987 16/01/1987 -10,6 -10,9 -10,9 -11,1 -9,8 -10,66
The temperature range was obtained by rounding down and up, respectively the 4th and 5th
values ( -11,1°C and -9,8°C ).
It should be noted that this cold peak occurs ones every 25 years.
Comparison of historical national criteria with the criteria of Article 8 of Regulation 994/2010
a) National Market and protected customers
The most pragmatic approach adopted by the Audit Committee, on the proposal of market
participants, is to consider that the suppliers of the gas market are able to supply their
customers even in extreme weather conditions.
In general, national criteria were applicable to the entire market, that is to say that the market
should ensure gas supply to both public supply, industry and electricity producer, even under
conditions of severe winter (1962/1963) or an extreme cold peak.
Regulation 994/2010 reduced this requirement to protected customers. If the concept of
"protected client" is equated to that of "public distribution", the criteria of Article 8 of the
994/2010 Regulation is only applicable on 52 % of the national market (based on consumption
standardized annual temperature of 2013) ( see graph below).
Figure 38: Natural gas consumption of L and H-gas per sector (2013)
b) Result of the application of the criteria a) of Article 8 of Regulation 994/2010
As a reminder, this criteria says that the gas companies need to take the necessary measures
to ensure supplies to protected customers of the Member State in the case of extreme
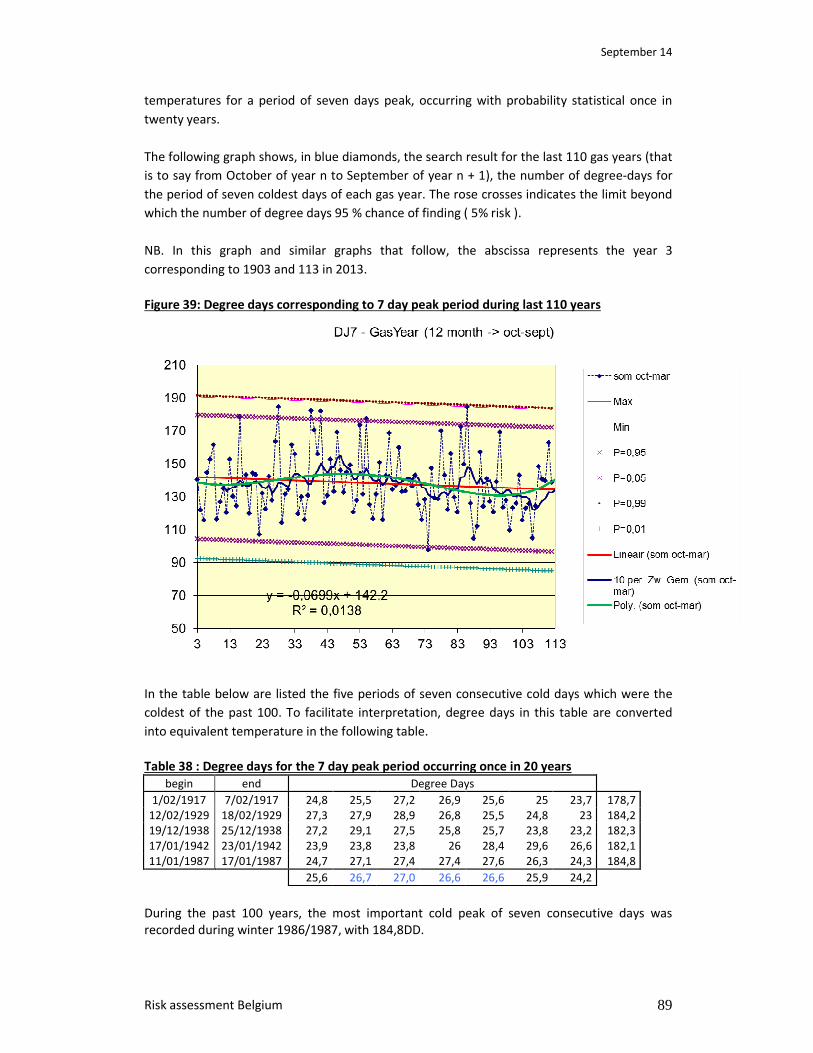
September 14
Risk assessment Belgium 89
temperatures for a period of seven days peak, occurring with probability statistical once in
twenty years.
The following graph shows, in blue diamonds, the search result for the last 110 gas years (that
is to say from October of year n to September of year n + 1), the number of degree-days for
the period of seven coldest days of each gas year. The rose crosses indicates the limit beyond
which the number of degree days 95 % chance of finding ( 5% risk ).
NB. In this graph and similar graphs that follow, the abscissa represents the year 3
corresponding to 1903 and 113 in 2013.
Figure 39: Degree days corresponding to 7 day peak period during last 110 years
In the table below are listed the five periods of seven consecutive cold days which were the
coldest of the past 100. To facilitate interpretation, degree days in this table are converted
into equivalent temperature in the following table.
Table 38 : Degree days for the 7 day peak period occurring once in 20 years
begin end Degree Days
1/02/1917 7/02/1917 24,8 25,5 27,2 26,9 25,6 25 23,7 178,7
12/02/1929 18/02/1929 27,3 27,9 28,9 26,8 25,5 24,8 23 184,2
19/12/1938 25/12/1938 27,2 29,1 27,5 25,8 25,7 23,8 23,2 182,3
17/01/1942 23/01/1942 23,9 23,8 23,8 26 28,4 29,6 26,6 182,1
11/01/1987 17/01/1987 24,7 27,1 27,4 27,4 27,6 26,3 24,3 184,8
25,6 26,7 27,0 26,6 26,6 25,9 24,2
During the past 100 years, the most important cold peak of seven consecutive days was
recorded during winter 1986/1987, with 184,8DD.
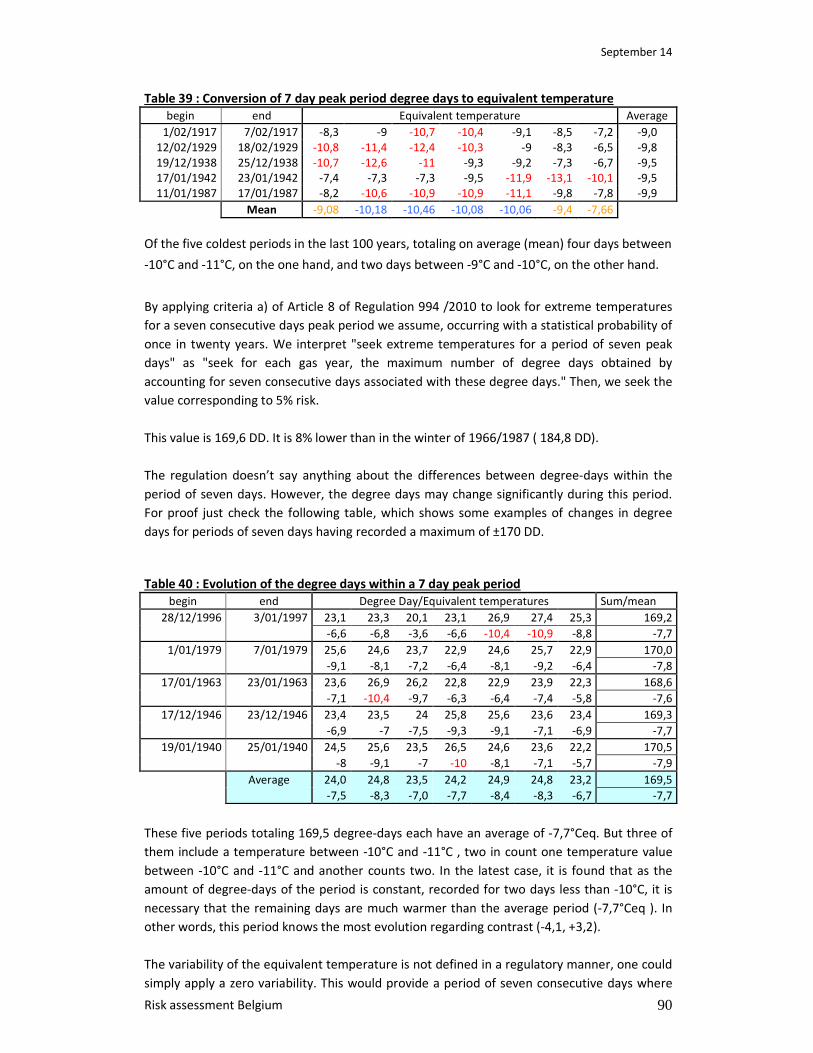
September 14
Risk assessment Belgium 90
Table 39 : Conversion of 7 day peak period degree days to equivalent temperature
begin end Equivalent temperature Average
1/02/1917 7/02/1917 -8,3 -9 -10,7 -10,4 -9,1 -8,5 -7,2 -9,0
12/02/1929 18/02/1929 -10,8 -11,4 -12,4 -10,3 -9 -8,3 -6,5 -9,8
19/12/1938 25/12/1938 -10,7 -12,6 -11 -9,3 -9,2 -7,3 -6,7 -9,5
17/01/1942 23/01/1942 -7,4 -7,3 -7,3 -9,5 -11,9 -13,1 -10,1 -9,5
11/01/1987 17/01/1987 -8,2 -10,6 -10,9 -10,9 -11,1 -9,8 -7,8 -9,9
Mean -9,08 -10,18 -10,46 -10,08 -10,06 -9,4 -7,66
Of the five coldest periods in the last 100 years, totaling on average (mean) four days between
-10°C and -11°C, on the one hand, and two days between -9°C and -10°C, on the other hand.
By applying criteria a) of Article 8 of Regulation 994 /2010 to look for extreme temperatures
for a seven consecutive days peak period we assume, occurring with a statistical probability of
once in twenty years. We interpret "seek extreme temperatures for a period of seven peak
days" as "seek for each gas year, the maximum number of degree days obtained by
accounting for seven consecutive days associated with these degree days." Then, we seek the
value corresponding to 5% risk.
This value is 169,6 DD. It is 8% lower than in the winter of 1966/1987 ( 184,8 DD).
The regulation doesn’t say anything about the differences between degree-days within the
period of seven days. However, the degree days may change significantly during this period.
For proof just check the following table, which shows some examples of changes in degree
days for periods of seven days having recorded a maximum of ±170 DD.
Table 40 : Evolution of the degree days within a 7 day peak period
begin end Degree Day/Equivalent temperatures Sum/mean
28/12/1996 3/01/1997 23,1 23,3 20,1 23,1 26,9 27,4 25,3 169,2
-6,6 -6,8 -3,6 -6,6 -10,4 -10,9 -8,8 -7,7
1/01/1979 7/01/1979 25,6 24,6 23,7 22,9 24,6 25,7 22,9 170,0
-9,1 -8,1 -7,2 -6,4 -8,1 -9,2 -6,4 -7,8
17/01/1963 23/01/1963 23,6 26,9 26,2 22,8 22,9 23,9 22,3 168,6
-7,1 -10,4 -9,7 -6,3 -6,4 -7,4 -5,8 -7,6
17/12/1946 23/12/1946 23,4 23,5 24 25,8 25,6 23,6 23,4 169,3
-6,9 -7 -7,5 -9,3 -9,1 -7,1 -6,9 -7,7
19/01/1940 25/01/1940 24,5 25,6 23,5 26,5 24,6 23,6 22,2 170,5
-8 -9,1 -7 -10 -8,1 -7,1 -5,7 -7,9
Average 24,0 24,8 23,5 24,2 24,9 24,8 23,2 169,5
-7,5 -8,3 -7,0 -7,7 -8,4 -8,3 -6,7 -7,7
These five periods totaling 169,5 degree-days each have an average of -7,7°Ceq. But three of
them include a temperature between -10°C and -11°C , two in count one temperature value
between -10°C and -11°C and another counts two. In the latest case, it is found that as the
amount of degree-days of the period is constant, recorded for two days less than -10°C, it is
necessary that the remaining days are much warmer than the average period (-7,7°Ceq ). In
other words, this period knows the most evolution regarding contrast (-4,1, +3,2).
The variability of the equivalent temperature is not defined in a regulatory manner, one could
simply apply a zero variability. This would provide a period of seven consecutive days where

September 14
Risk assessment Belgium 91
the temperature is -7,7°C and deduce that the limits of daily peak flow conditions to be
fulfilled are limited to -7,7°C. If this approach is adopted - and nothing seems to oppose the
regulation - the market may no longer have to provide an equivalent temperature below -7,7
°C. However, no less than 17 gas winters show a similar temperature below -7,7°C at least one
day during the past 100 years (after correction due to global warming ), or about one in six
winter. In the context of security of supply, this result is not acceptable, because it is simply
not prudent.
Conclusion
Criteria a) of Article 8 does not seem sufficient to ensure security of supply, for two main
reasons:
1. it does not take into consideration the wintry conditions of the winter of 1986/1987
(which occurs ones in 30 years), during which the temperature was below -10°C
during almost five consecutive days;
2. within the period of seven days, no criteria of evolution of the equivalent temperature
was defined, which, depending on the chosen profile and its variance, will have a
significant impact on the daily peak flow to be provided by the market.
c) Result of applying criteria b) of Article 8 of Regulation 994/2010
As a reminder, this criteria says that the gas companies need to take the necessary measures
to ensure the supply of natural gas to protected customers of the Member State in the case of
a period of at least thirty days of gas demand exceptionally high, occurring with a statistical
probability of once in twenty years.
Following that it is assumed that a period of at least thirty days of exceptionally high gas
demand is equivalent to the protected customers, a period of at least thirty days exceptionally
cold.
The following graph shows, indicated with blue diamonds, the evolution for the last 110 years
gas (that is to say from October of year n to September of year n +1), the number of degree -
days obtained by taking , for each gas year , the period of 30 consecutive cold days. The rose
crosses indicate the limit beyond which the number of degree days 95 % chance of finding (5%
risk).
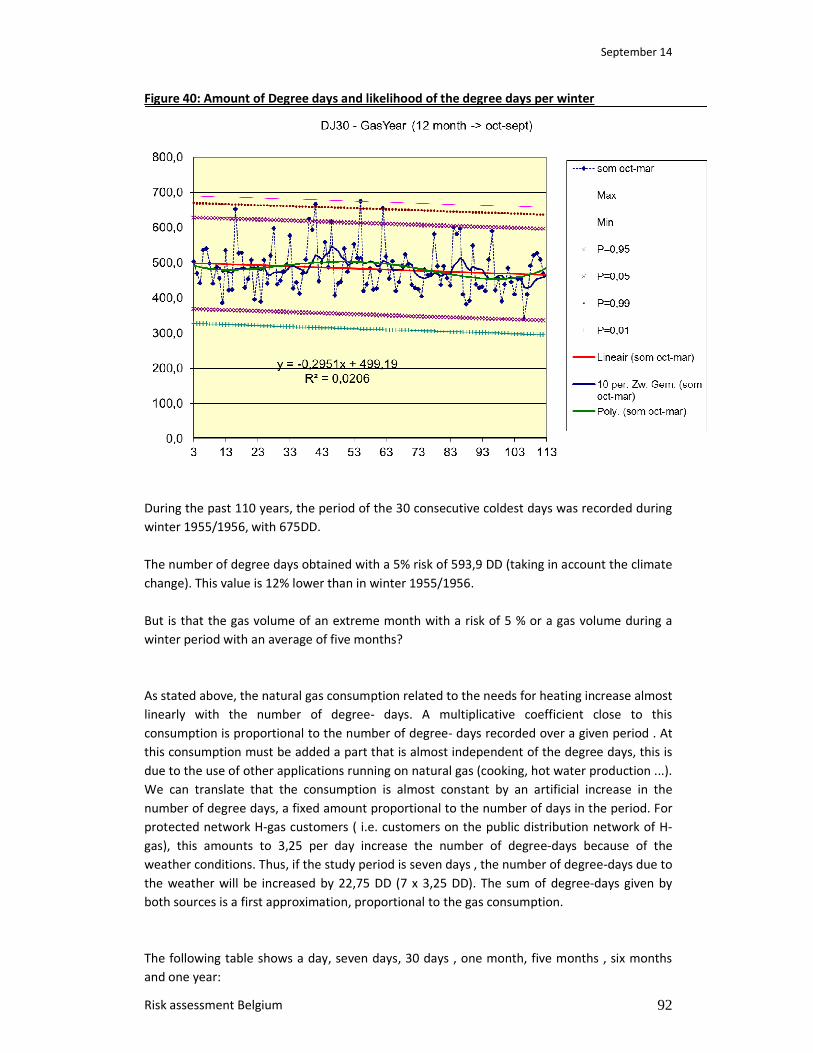
September 14
Risk assessment Belgium 92
Figure 40: Amount of Degree days and likelihood of the degree days per winter
During the past 110 years, the period of the 30 consecutive coldest days was recorded during
winter 1955/1956, with 675DD.
The number of degree days obtained with a 5% risk of 593,9 DD (taking in account the climate
change). This value is 12% lower than in winter 1955/1956.
But is that the gas volume of an extreme month with a risk of 5 % or a gas volume during a
winter period with an average of five months?
As stated above, the natural gas consumption related to the needs for heating increase almost
linearly with the number of degree- days. A multiplicative coefficient close to this
consumption is proportional to the number of degree- days recorded over a given period . At
this consumption must be added a part that is almost independent of the degree days, this is
due to the use of other applications running on natural gas (cooking, hot water production ...).
We can translate that the consumption is almost constant by an artificial increase in the
number of degree days, a fixed amount proportional to the number of days in the period. For
protected network H-gas customers ( i.e. customers on the public distribution network of H-
gas), this amounts to 3,25 per day increase the number of degree-days because of the
weather conditions. Thus, if the study period is seven days , the number of degree-days due to
the weather will be increased by 22,75 DD (7 x 3,25 DD). The sum of degree-days given by
both sources is a first approximation, proportional to the gas consumption.
The following table shows a day, seven days, 30 days , one month, five months , six months
and one year:
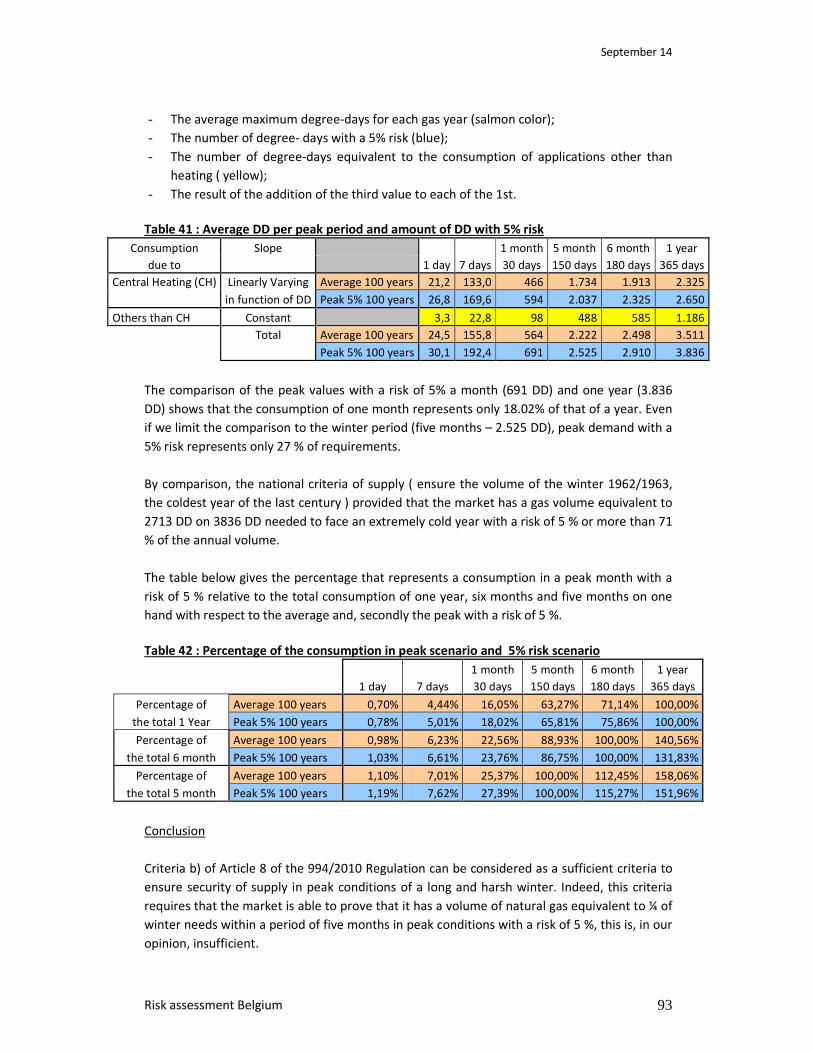
September 14
Risk assessment Belgium 93
- The average maximum degree-days for each gas year (salmon color);
- The number of degree- days with a 5% risk (blue);
- The number of degree-days equivalent to the consumption of applications other than
heating ( yellow);
- The result of the addition of the third value to each of the 1st.
Table 41 : Average DD per peak period and amount of DD with 5% risk
Consumption Slope 1 month 5 month 6 month 1 year
due to 1 day 7 days 30 days 150 days 180 days 365 days
Central Heating (CH) Linearly Varying Average 100 years 21,2 133,0 466 1.734 1.913 2.325
in function of DD Peak 5% 100 years 26,8 169,6 594 2.037 2.325 2.650
Others than CH Constant 3,3 22,8 98 488 585 1.186
Total Average 100 years 24,5 155,8 564 2.222 2.498 3.511
Peak 5% 100 years 30,1 192,4 691 2.525 2.910 3.836
The comparison of the peak values with a risk of 5% a month (691 DD) and one year (3.836
DD) shows that the consumption of one month represents only 18.02% of that of a year. Even
if we limit the comparison to the winter period (five months – 2.525 DD), peak demand with a
5% risk represents only 27 % of requirements.
By comparison, the national criteria of supply ( ensure the volume of the winter 1962/1963,
the coldest year of the last century ) provided that the market has a gas volume equivalent to
2713 DD on 3836 DD needed to face an extremely cold year with a risk of 5 % or more than 71
% of the annual volume.
The table below gives the percentage that represents a consumption in a peak month with a
risk of 5 % relative to the total consumption of one year, six months and five months on one
hand with respect to the average and, secondly the peak with a risk of 5 %.
Table 42 : Percentage of the consumption in peak scenario and 5% risk scenario
1 month 5 month 6 month 1 year
1 day 7 days 30 days 150 days 180 days 365 days
Percentage of Average 100 years 0,70% 4,44% 16,05% 63,27% 71,14% 100,00%
the total 1 Year Peak 5% 100 years 0,78% 5,01% 18,02% 65,81% 75,86% 100,00%
Percentage of Average 100 years 0,98% 6,23% 22,56% 88,93% 100,00% 140,56%
the total 6 month Peak 5% 100 years 1,03% 6,61% 23,76% 86,75% 100,00% 131,83%
Percentage of Average 100 years 1,10% 7,01% 25,37% 100,00% 112,45% 158,06%
the total 5 month Peak 5% 100 years 1,19% 7,62% 27,39% 100,00% 115,27% 151,96%
Conclusion
Criteria b) of Article 8 of the 994/2010 Regulation can be considered as a sufficient criteria to
ensure security of supply in peak conditions of a long and harsh winter. Indeed, this criteria
requires that the market is able to prove that it has a volume of natural gas equivalent to ¼ of
winter needs within a period of five months in peak conditions with a risk of 5 %, this is, in our
opinion, insufficient.
September 14
Risk assessment Belgium 94
General conclusion
Although the criteria of Article 8 of Regulation 994 /2010 are the minimum requirements from
which a European consensus has been reached and solidarity mechanisms were, among
others, to be developed. It nonetheless results that not only these criteria are sufficient, even
prudent, to ensure security of supply in the country.

September 14
Risk assessment Belgium 95
4 Risk evaluation
In the risk evaluation, all risks (with its likelihoods and impacts) identified and analysed during
the risk identification & risk analysis, are evaluated.
• Risk is acceptable => OK
• Risk is not acceptable => risk treatment/risk avoidance/risk transfer is needed.
Risk treatment is not part of the risk assessment as such. Risk treatment will be addressed in
the preventive action plans and emergency plans.
As for the risk evaluation, it is not feasible to guarantee a total protection of the entire Belgian
gas supply. A reasonable risk threshold, that determines a realistic protection level, has to be
defined.
The level of the threshold will depend on several matters, most of all on:
- the quantities of gas lost
- the probability of the risks considered
- the duration to cover
The guarantee of a secure gas supply in Belgium comes at a cost. The higher the risk that
needs to be covered, the higher the price tag.
We can try to classify the risks according to the probability levels and the impact. The
classification only gives only a broad indication of the risks, as the impact of the same risk may
vary according to the timing and the location of the incident. We have tried to take into
account the most likely outcome of the incidents based on historical experiences.
Table 43: Severity levels of consequences criteria
Impact Description
Minor Short-term disturbance of sector activity. No direct consequences to other
sectors.
Low Temporary disturbance of national gas supply. Consequences are eliminated
by efforts of Fluxys Belgium alone. Impact of consequences of disturbance of
gas supply on other sectors (heat supply) are negligible.
Noticeable Gas supply disruption to the area and necessity of back-up systems or
alternative measures.
Severe The impact of the disruption of gas supply to other sectors is severe. (Load
shedding)
Very severe Long-term efforts required for restoration of gas supply. Impact on other
sectors and protected customers.
Table 44: Assessment of the probability of accidents
Probability level Probability Average frequency of occurrence
1 Very low Less than once in 20 years
2 Low Once in 10 years
3 Medium Once in 3 years
4 High Once a year
5 Very high More often than once a year
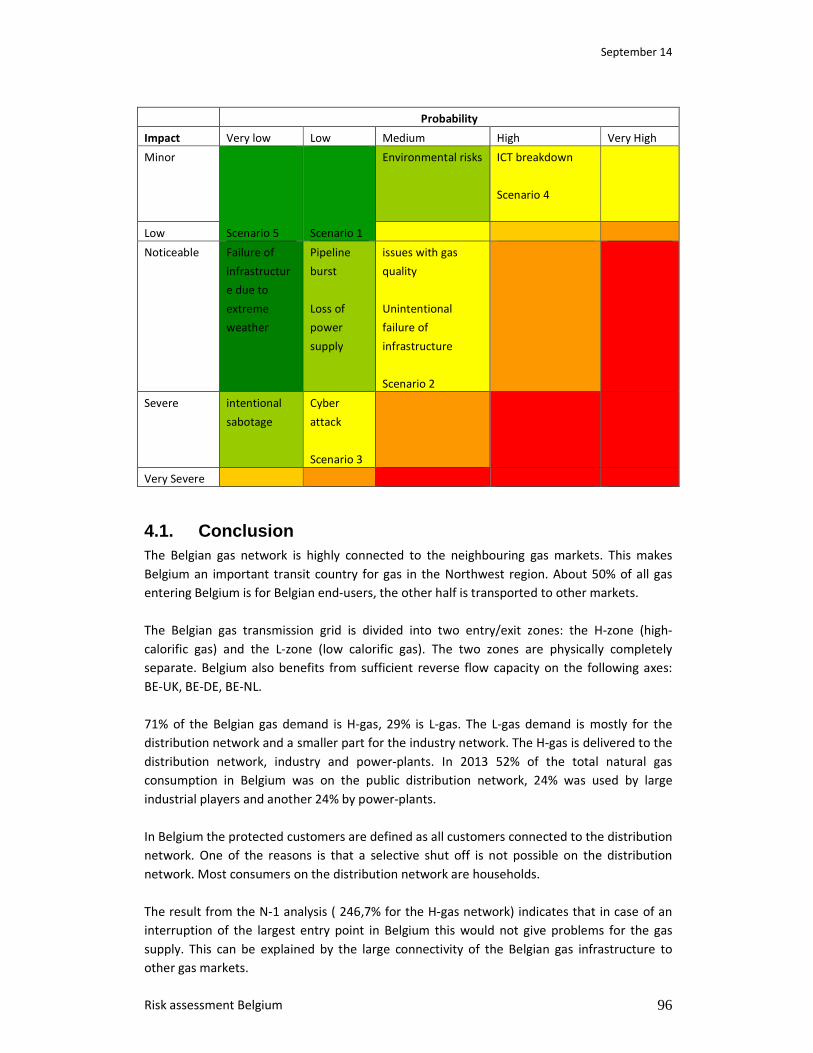
September 14
Risk assessment Belgium 96
Probability
Impact Very low Low Medium High Very High
Minor Environmental risks ICT breakdown
Scenario 4
Low Scenario 5 Scenario 1
Noticeable Failure of
infrastructur
e due to
extreme
weather
Pipeline
burst
Loss of
power
supply
issues with gas
quality
Unintentional
failure of
infrastructure
Scenario 2
Severe intentional
sabotage
Cyber
attack
Scenario 3
Very Severe
4.1. Conclusion The Belgian gas network is highly connected to the neighbouring gas markets. This makes
Belgium an important transit country for gas in the Northwest region. About 50% of all gas
entering Belgium is for Belgian end-users, the other half is transported to other markets.
The Belgian gas transmission grid is divided into two entry/exit zones: the H-zone (high-
calorific gas) and the L-zone (low calorific gas). The two zones are physically completely
separate. Belgium also benefits from sufficient reverse flow capacity on the following axes:
BE-UK, BE-DE, BE-NL.
71% of the Belgian gas demand is H-gas, 29% is L-gas. The L-gas demand is mostly for the
distribution network and a smaller part for the industry network. The H-gas is delivered to the
distribution network, industry and power-plants. In 2013 52% of the total natural gas
consumption in Belgium was on the public distribution network, 24% was used by large
industrial players and another 24% by power-plants.
In Belgium the protected customers are defined as all customers connected to the distribution
network. One of the reasons is that a selective shut off is not possible on the distribution
network. Most consumers on the distribution network are households.
The result from the N-1 analysis ( 246,7% for the H-gas network) indicates that in case of an
interruption of the largest entry point in Belgium this would not give problems for the gas
supply. This can be explained by the large connectivity of the Belgian gas infrastructure to
other gas markets.
September 14
Risk assessment Belgium 97
At the L-gas network the N-1 analysis was below 100%. This result still depends on how the
analysis was made (look at the infrastructure as one or divide it in multiple pipelines like the
entry pipeline really is constructed from. However historically only one incident happened on
this network for which measures are implemented to prevent this in the future. It also needs
to be taken into account the decline of the Groningen gas field a conversion of the L-gas
network to the H-gas network will be a next step in the future. Because of these prospects
there are no more extension plans for the L-gas network for the future.
For the Risk assessment 5 different scenarios were analysed and described. These scenarios
were chosen because they could have a potentially high impact in Belgium when they occur.
These scenarios were:
• Political unrest in the Middle East: Disruption of LNG from Qatar
• Hurricane in North Sea: Disruption of supplies from Norway by Zeepipe
• Technical Failure of major pipeline: Loss of supply L-gas from the Netherlands
• Nuclear phase-out in Belgium
• Terroristic attack on Loenhout storage facility
The different scenarios which were analysed did not show any large risk for the Belgian gas
supply:
• The Zeepipe is part of a large pipeline infrastructure coming from Norway to West-
Europe. In case of a disruption of the Zeepipe it is possible to reroute the gas which
normally goes by the Zeepipe to Belgium to one of our neighbouring countries. Also
due to the high interconnectivity of Belgium gas coming from other entry points can
fill in the gap created by a disruption of the Zeepipe.
• When no LNG is delivered to Belgium it will not cause an insurmountable problem for
Belgium. Only 4% (in 2013) of the gas that physically enters the Belgian network is
LNG, this part can be replaced by pipeline gas in case of a disruption.
• The nuclear phase-out in Belgium is coming and would probably have a manageable
impact on the gas sector because the energy production by gas power plants could
become an important part of the energy-mix in Belgium, but is has to be taken into
account that at the moment the economic conditions, for natural gas, are not
favourable.
• A disruption of the Loenhout storage facility will not have a large effect on the Belgian
network because of the high interconnectivity of the Belgian network as well the N-1
analysis is above 100%.
These updated risk assessment for Belgium does not reveal particular concerns but this does
not mean that possible risks could not occur in the future and so it stays important to
investigate and analyse the Belgian gas network on a regular basis for possible new as well as
known risk scenarios. This to make sure that possible measures can be investigated and
implemented.
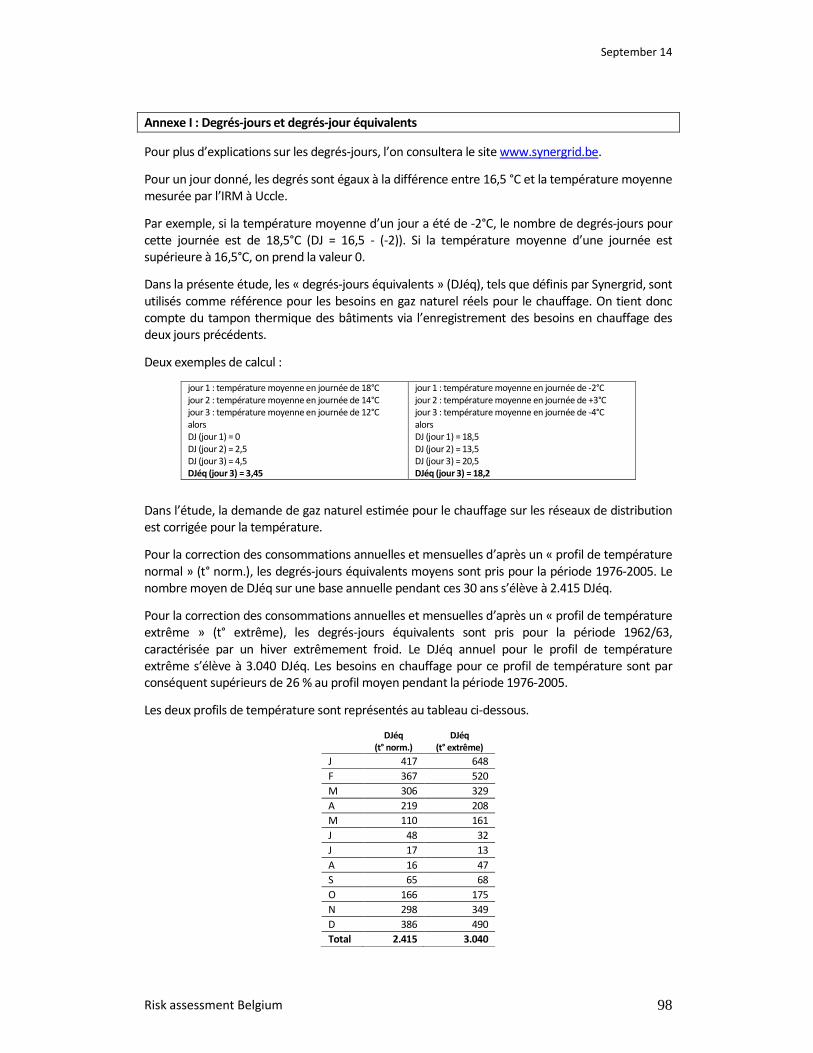
September 14
Risk assessment Belgium 98
Annexe I : Degrés-jours et degrés-jour équivalents
Pour plus d’explications sur les degrés-jours, l’on consultera le site www.synergrid.be.
Pour un jour donné, les degrés sont égaux à la différence entre 16,5 °C et la température moyenne
mesurée par l’IRM à Uccle.
Par exemple, si la température moyenne d’un jour a été de -2°C, le nombre de degrés-jours pour
cette journée est de 18,5°C (DJ = 16,5 - (-2)). Si la température moyenne d’une journée est
supérieure à 16,5°C, on prend la valeur 0.
Dans la présente étude, les « degrés-jours équivalents » (DJéq), tels que définis par Synergrid, sont
utilisés comme référence pour les besoins en gaz naturel réels pour le chauffage. On tient donc
compte du tampon thermique des bâtiments via l’enregistrement des besoins en chauffage des
deux jours précédents.
Deux exemples de calcul :
jour 1 : température moyenne en journée de 18°C
jour 2 : température moyenne en journée de 14°C
jour 3 : température moyenne en journée de 12°C
alors
DJ (jour 1) = 0
DJ (jour 2) = 2,5
DJ (jour 3) = 4,5
DJéq (jour 3) = 3,45
jour 1 : température moyenne en journée de -2°C
jour 2 : température moyenne en journée de +3°C
jour 3 : température moyenne en journée de -4°C
alors
DJ (jour 1) = 18,5
DJ (jour 2) = 13,5
DJ (jour 3) = 20,5
DJéq (jour 3) = 18,2
Dans l’étude, la demande de gaz naturel estimée pour le chauffage sur les réseaux de distribution
est corrigée pour la température.
Pour la correction des consommations annuelles et mensuelles d’après un « profil de température
normal » (t° norm.), les degrés-jours équivalents moyens sont pris pour la période 1976-2005. Le
nombre moyen de DJéq sur une base annuelle pendant ces 30 ans s’élève à 2.415 DJéq.
Pour la correction des consommations annuelles et mensuelles d’après un « profil de température
extrême » (t° extrême), les degrés-jours équivalents sont pris pour la période 1962/63,
caractérisée par un hiver extrêmement froid. Le DJéq annuel pour le profil de température
extrême s’élève à 3.040 DJéq. Les besoins en chauffage pour ce profil de température sont par
conséquent supérieurs de 26 % au profil moyen pendant la période 1976-2005.
Les deux profils de température sont représentés au tableau ci-dessous.
DJéq
(t° norm.)
DJéq
(t° extrême)
J 417 648
F 367 520
M 306 329
A 219 208
M 110 161
J 48 32
J 17 13
A 16 47
S 65 68
O 166 175
N 298 349
D 386 490
Total 2.415 3.040

September 14
Risk assessment Belgium 99
Annex II : Regional technical legislation related to security of supply
1. Region of Brussels-Capital: Technical regulation (Decree of 13.07.2006)
Section 2.4. — Garanties à donner par le détenteur d’accès
Art. 119. Le détenteur d’accès garantit au gestionnaire du réseau de distribution qu’à dater de
l’entrée en vigueur et pendant toute la durée du contrat d’accès, les prélèvements
effectués aux points d’accès relevant de son portefeuille seront couverts par des
contrats de fourniture.
Le détenteur d’accès garantit également qu’il fera injecter, via le réseau de transport et les
stations de réception, autant de gaz qu’il en fournit aux utilisateurs du réseau de
distribution avec lesquels il a conclu un contrat de fourniture. Le détenteur d’accès
déclare et garantit à cette fin au gestionnaire du réseau de distribution que tous les
contrats nécessaires à l’obtention de l’accès au réseau de transport et aux autres
réseaux de distribution ont été conclus.
Art. 120. Le détenteur d’accès s’engage à informer immédiatement le gestionnaire du réseau
de distribution en cas de modification d’un des éléments repris au contrat d’accès ou de
l’identité et des coordonnées de l’utilisateur du réseau de distribution présent sur un
point d’accès relevant de son portefeuille.
2. Walloon Region: Technical regulation (Decree of 12.07.2007)
Section 2.3. - Déclarations et garanties du fournisseur
Art. 125.
§1er. Afin de maintenir l'équilibre du réseau de distribution, chaque fournisseur doit injecter
durant la période élémentaire définie à l'article 136, via le réseau de transport, le ou les
réseaux de distribution interconnectés (s'il échet) et les stations de réception, autant de
gaz qu'il en est fourni aux URD pour lesquels il a conclu des contrats d'accès. A cette fin,
le fournisseur souscrit les quantités de gaz nécessaires pour faire face aux conditions
extrêmes correspondant à une température équivalente à Uccle de -11°C durant une
journée.
§2. Si le fournisseur collabore avec un affréteur, il conclut avec ce dernier un contrat de
collaboration où les responsabilités mutuelles sont clairement délimitées et décrites
avec précision.
Art. 126. Le fournisseur déclare et garantit au GRD qu'à partir de la date d'entrée en vigueur
du contrat d'accès et pour la durée totale de celui-ci, tous les prélèvements ou
injections prévus par lui sont ou seront couverts par un contrat de fourniture, y
compris aux conditions extrêmes précisées à l'article 125.
Art. 127. Le fournisseur déclare et garantit au GRD, pour ce qui concerne l'accès à d'autres
réseaux de distribution et au réseau de transport, qu'il conclura tous les contrats
nécessaires à couvrir l'accès pour toutes ses injections et tous ses prélèvements. Ce
faisant, le fournisseur relève le GRD de toute responsabilité à ce sujet.
Art. 128. Le fournisseur avertit immédiatement le GRD si une ou plusieurs déclarations ou
garanties susdites viennent à expiration.
September 14
Risk assessment Belgium 100
3. Flanders Region: Technical regulation on distribution (Decree of 04.04.2007)
Afdeling IV.2.5 Verklaringen en garanties van de leverancier
Artikel IV.2.5.1 De leverancier verklaart en garandeert ten opzichte van de
distributienetbeheerder dat vanaf de datum van het verkrijgen van toegang onder de
voorwaarden van het toegangsreglement en voor de hele duurtijd ervan, alle door hem
geplande afnamen en injecties gedekt zijn of gedekt zullen zijn door een leverings- of
aankoopcontract.
Artikel IV.2.5.2
§1 De leverancier draagt bij tot het evenwicht op het distributienet door ervoor te zorgen dat
er evenveel gas ingebracht wordt via het vervoernet en de ontvangstations als er
geleverd wordt bij de distributienetgebruikers waarvoor hij toegang heeft.
§2 Als de leverancier voor de toegang naar het vervoernet opteert voor samenwerking met
een bevrachter, moet voor elke bevrachter een verklaring die de leverancier en de
bevrachter hebben ondertekend, aan de distributienetbeheerder bezorgd Technisch
Reglement Distributie Gas 04-04-2007 VREGDM-#5720-v10-
Technisch_Reglement_Distributie_Gas_v04- 04-2007.DOC Pagina 39 van 67 worden. In
die verklaring wordt de samenwerking van de beide partijen bevestigd met betrekking
tot (een deel van) de toegangspunten waarop de leverancier toegang tot het
distributienet heeft. De distributienetbeheerder stelt daarvoor een modelformulier op.
Artikel IV.2.5.3 De leverancier verklaart en garandeert, voor wat de toegang tot andere
distributienetten en tot het vervoernet betreft, ten opzichte van de
distributienetbeheerder dat hij de nodige contracten zal afsluiten zodat de toegang voor
alle injecties en afnamen gedekt is.
Artikel IV.2.5.4 De leverancier of de bevrachter waarschuwt de distributienetbeheerder
onmiddellijk als een of meer van de hierboven beschreven verklaringen en garanties
vervallen.
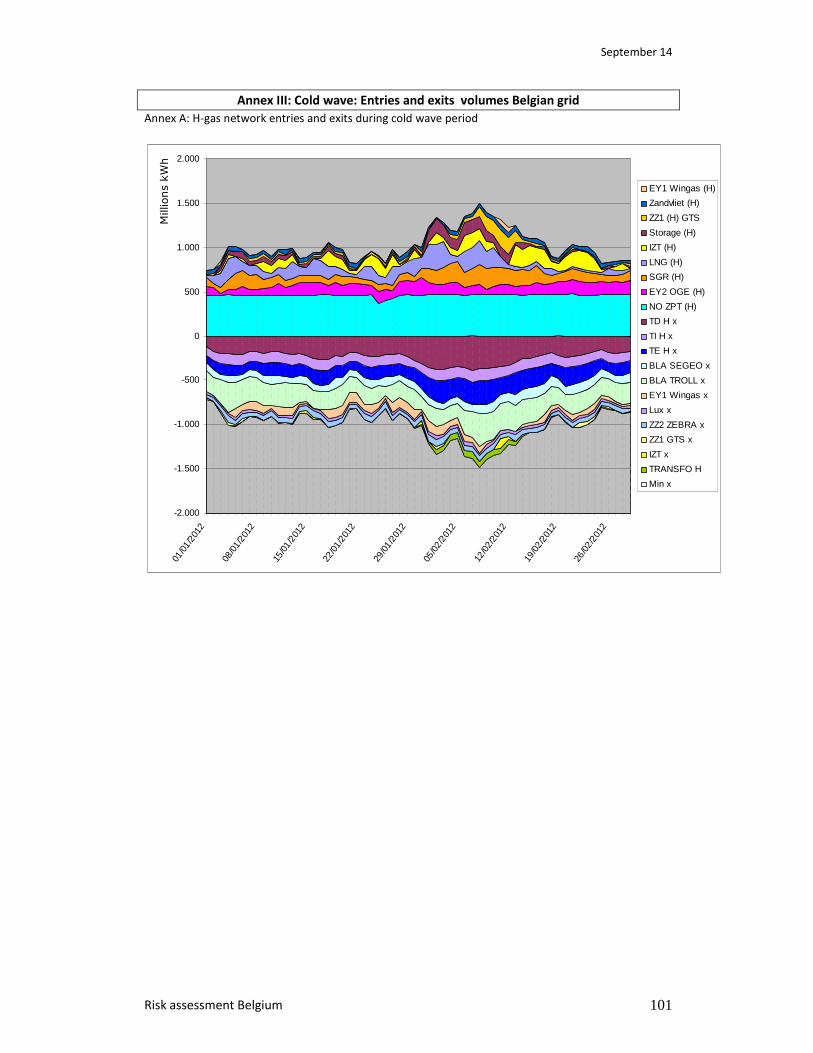
September 14
Risk assessment Belgium 101
Annex III: Cold wave: Entries and exits volumes Belgian grid
Annex A: H-gas network entries and exits during cold wave period
-2.000
-1.500
-1.000
-500
0
500
1.000
1.500
2.000
01/0
1/20
12
08/0
1/20
12
15/0
1/20
12
22/0
1/20
12
29/0
1/20
12
05/0
2/20
12
12/0
2/20
12
19/0
2/20
12
26/0
2/20
12
Millions k
Wh
EY1 Wingas (H)
Zandvliet (H)
ZZ1 (H) GTS
Storage (H)
IZT (H)
LNG (H)
SGR (H)
EY2 OGE (H)
NO ZPT (H)
TD H x
TI H x
TE H x
BLA SEGEO x
BLA TROLL x
EY1 Wingas x
Lux x
ZZ2 ZEBRA x
ZZ1 GTS x
IZT x
TRANSFO H
Min x
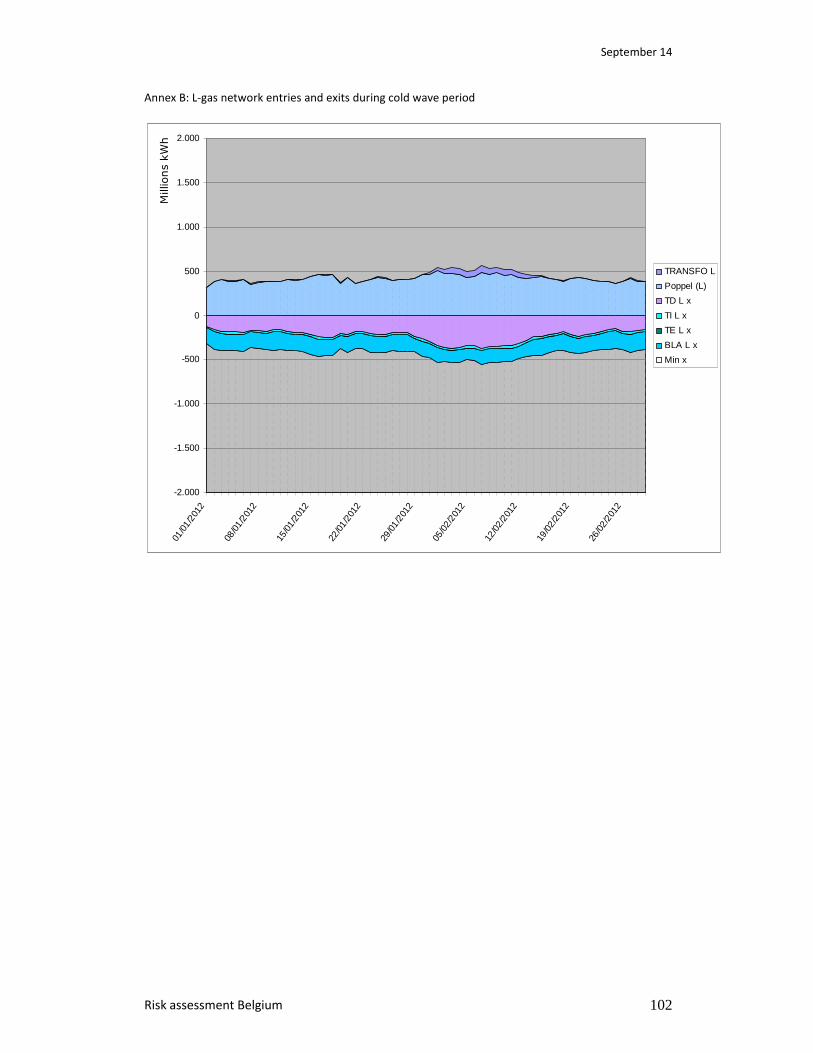
September 14
Risk assessment Belgium 102
Annex B: L-gas network entries and exits during cold wave period
-2.000
-1.500
-1.000
-500
0
500
1.000
1.500
2.000
01/0
1/20
12
08/0
1/20
12
15/0
1/20
12
22/0
1/20
12
29/0
1/20
12
05/0
2/20
12
12/0
2/20
12
19/0
2/20
12
26/0
2/20
12
Millions k
Wh
TRANSFO L
Poppel (L)
TD L x
TI L x
TE L x
BLA L x
Min x

September 14
Risk assessment Belgium 103
Annex B: Total Belgian gas network entries and exits during cold wave period
-2.000
-1.500
-1.000
-500
0
500
1.000
1.500
2.000
01/0
1/20
12
10/0
1/20
12
19/0
1/20
12
28/0
1/20
12
06/0
2/20
12
15/0
2/20
12
24/0
2/20
12
Mill
ion
s kW
h TRANSFO L
EY1 Wingas (H)
Zandvliet (H)
ZZ1 (H) GTS
Storage (H)
IZT (H)
LNG (H)
SGR (H)
EY2 OGE (H)
Poppel (L)
NO ZPT (H)
TD H x
TD L x
TI H x
TI L x
TE H x
TE L x
BLA TROLL x
BLA L x
BLA SEGEO x
EY1 Wingas x
ZZ2 ZEBRA x
Lux x
ZZ1 GTS x
IZT x
TRANSFO H
Min x
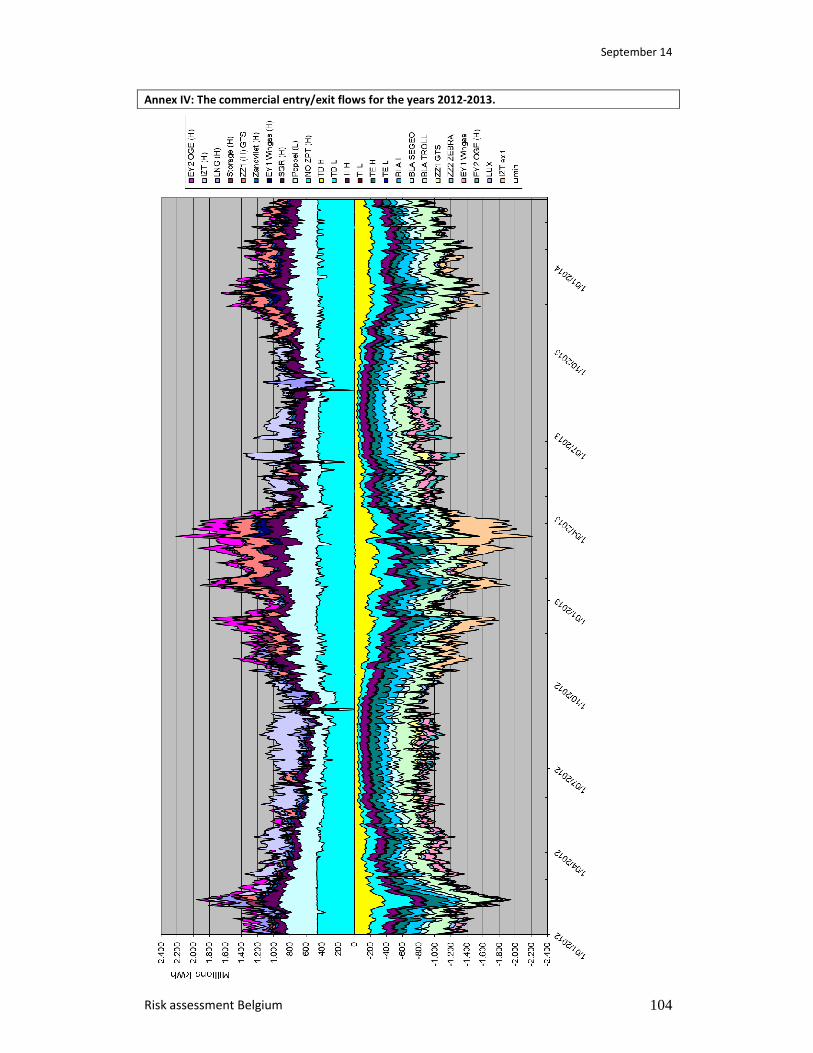
September 14
Risk assessment Belgium 104
Annex IV: The commercial entry/exit flows for the years 2012-2013.

September 14
Risk assessment Belgium 105
Annex V: The commercial entry/exit flows for the winterperiod of 2013-2014.
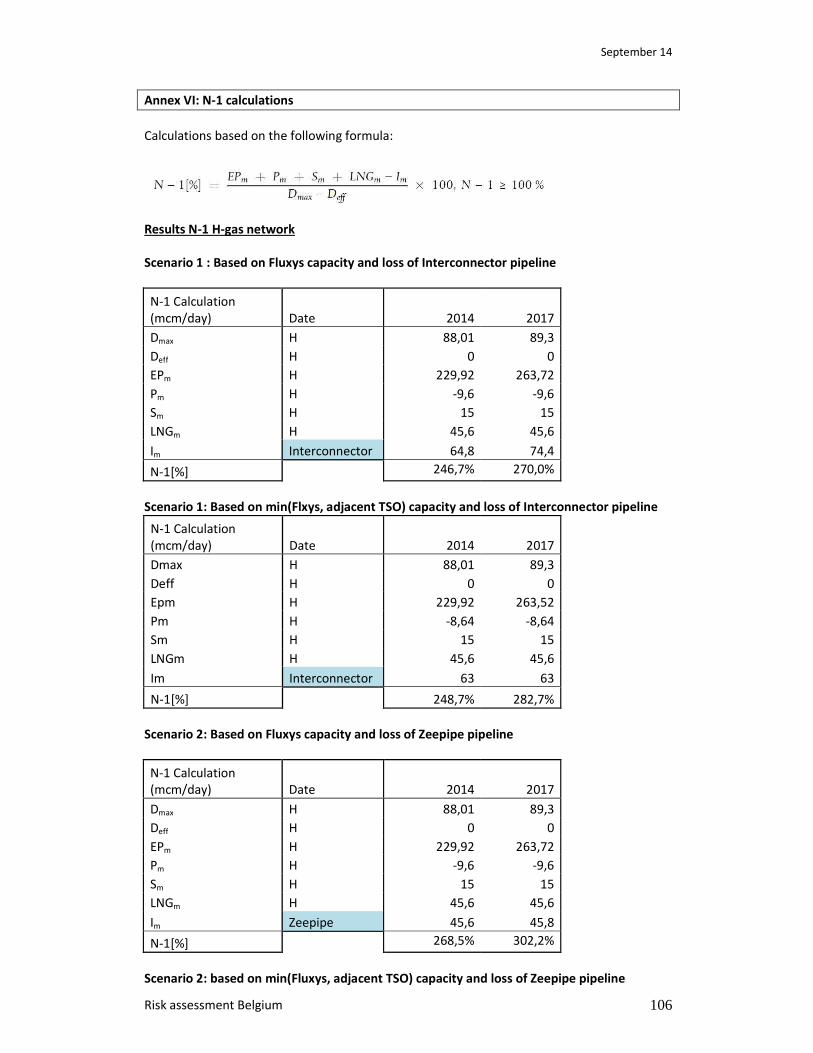
September 14
Risk assessment Belgium 106
Annex VI: N-1 calculations
Calculations based on the following formula:
Results N-1 H-gas network
Scenario 1 : Based on Fluxys capacity and loss of Interconnector pipeline
N-1 Calculation
(mcm/day) Date 2014 2017
Dmax H 88,01 89,3
Deff H 0 0
EPm H 229,92 263,72
Pm H -9,6 -9,6
Sm H 15 15
LNGm H 45,6 45,6
Im Interconnector 64,8 74,4
N-1[%]
246,7% 270,0%
Scenario 1: Based on min(Flxys, adjacent TSO) capacity and loss of Interconnector pipeline
N-1 Calculation
(mcm/day) Date 2014 2017
Dmax H 88,01 89,3
Deff H 0 0
Epm H 229,92 263,52
Pm H -8,64 -8,64
Sm H 15 15
LNGm H 45,6 45,6
Im Interconnector 63 63
N-1[%]
248,7% 282,7%
Scenario 2: Based on Fluxys capacity and loss of Zeepipe pipeline
N-1 Calculation
(mcm/day) Date 2014 2017
Dmax H 88,01 89,3
Deff H 0 0
EPm H 229,92 263,72
Pm H -9,6 -9,6
Sm H 15 15
LNGm H 45,6 45,6
Im Zeepipe 45,6 45,8
N-1[%]
268,5% 302,2%
Scenario 2: based on min(Fluxys, adjacent TSO) capacity and loss of Zeepipe pipeline
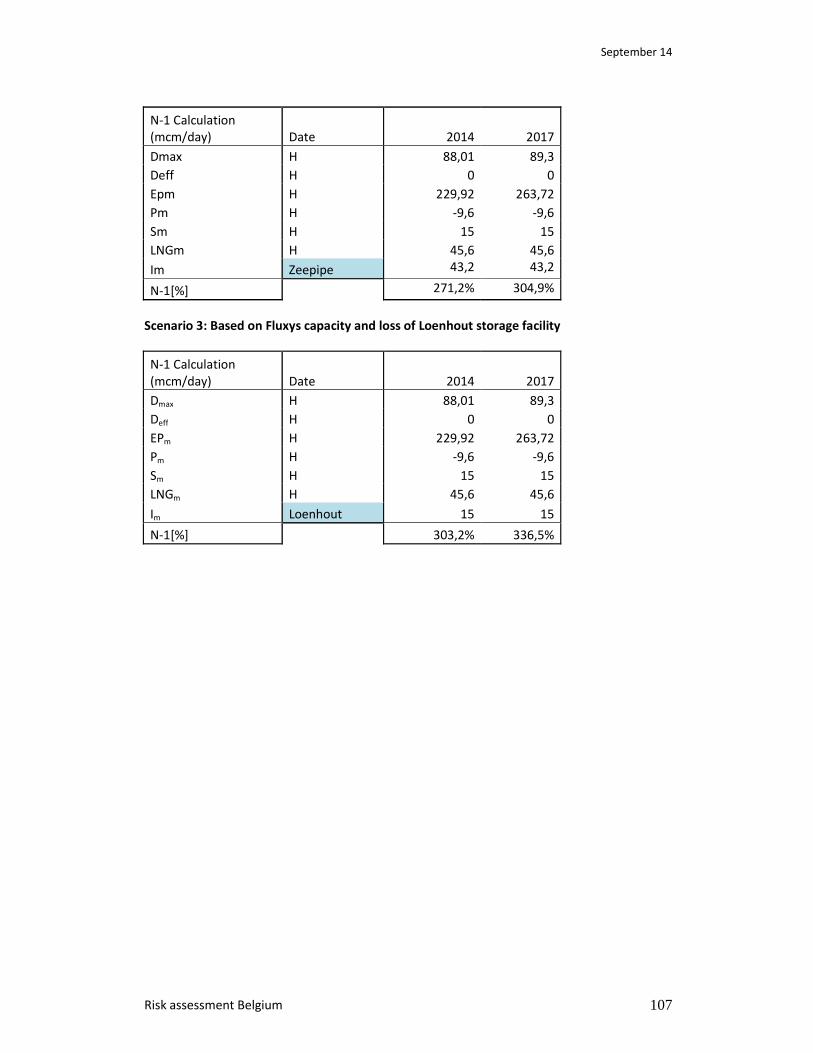
September 14
Risk assessment Belgium 107
N-1 Calculation
(mcm/day) Date 2014 2017
Dmax H 88,01 89,3
Deff H 0 0
Epm H 229,92 263,72
Pm H -9,6 -9,6
Sm H 15 15
LNGm H 45,6 45,6
Im Zeepipe 43,2 43,2
N-1[%]
271,2% 304,9%
Scenario 3: Based on Fluxys capacity and loss of Loenhout storage facility
N-1 Calculation
(mcm/day) Date 2014 2017
Dmax H 88,01 89,3
Deff H 0 0
EPm H 229,92 263,72
Pm H -9,6 -9,6
Sm H 15 15
LNGm H 45,6 45,6
Im Loenhout 15 15
N-1[%]
303,2% 336,5%
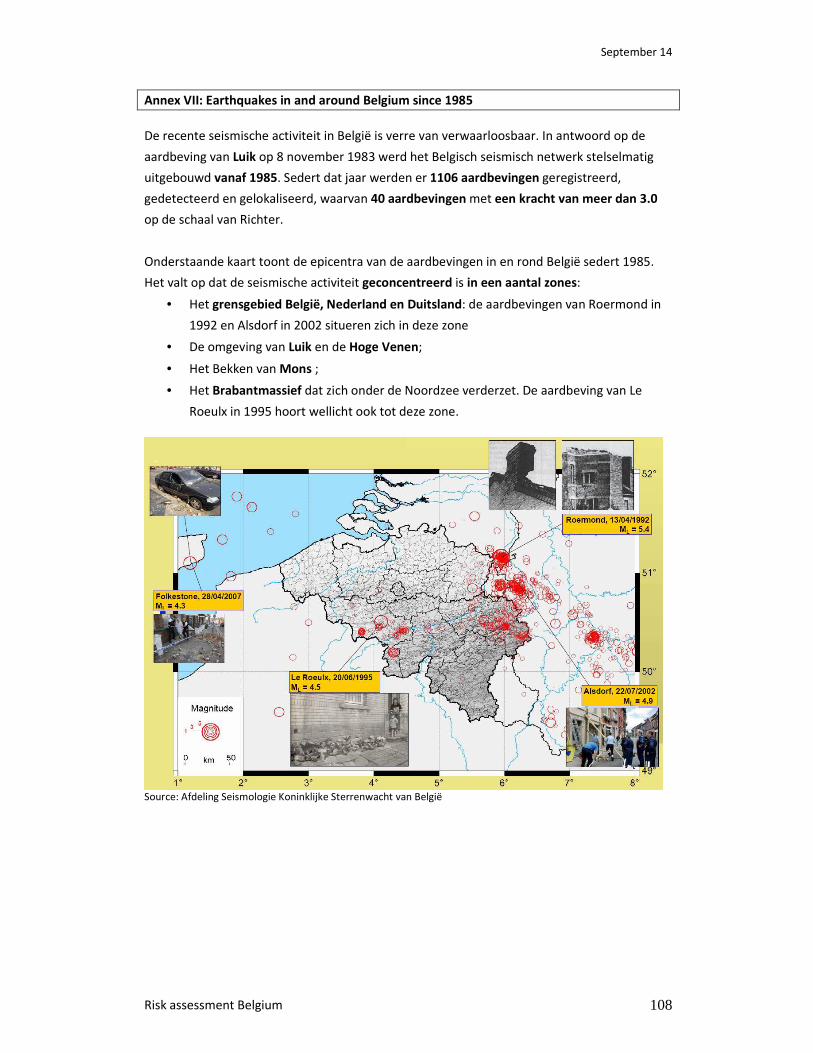
September 14
Risk assessment Belgium 108
Annex VII: Earthquakes in and around Belgium since 1985
De recente seismische activiteit in België is verre van verwaarloosbaar. In antwoord op de
aardbeving van Luik op 8 november 1983 werd het Belgisch seismisch netwerk stelselmatig
uitgebouwd vanaf 1985. Sedert dat jaar werden er 1106 aardbevingen geregistreerd,
gedetecteerd en gelokaliseerd, waarvan 40 aardbevingen met een kracht van meer dan 3.0
op de schaal van Richter.
Onderstaande kaart toont de epicentra van de aardbevingen in en rond België sedert 1985.
Het valt op dat de seismische activiteit geconcentreerd is in een aantal zones:
• Het grensgebied België, Nederland en Duitsland: de aardbevingen van Roermond in
1992 en Alsdorf in 2002 situeren zich in deze zone
• De omgeving van Luik en de Hoge Venen;
• Het Bekken van Mons ;
• Het Brabantmassief dat zich onder de Noordzee verderzet. De aardbeving van Le
Roeulx in 1995 hoort wellicht ook tot deze zone.
Source: Afdeling Seismologie Koninklijke Sterrenwacht van België


![RISK ASSESSMENT [ASSESSMENT]](https://img.pdfslide.us/doc/110x75/6212412fca52115ed803cf10/risk-assessment-assessment.jpg)