Embed Size (px)
Citation preview

Risk Assessment and Decision Analysis
Gestión Ambiental
Tema 11

Risk Evaluation
• Risk = Probability of a specific undesired consequence.
• Each activity produces a risk. Total risk in life is 1.• Risk evaluation offers a starting point in the balance
between acceptable risk increase vs cost of controlling the risk.
• When several kinds or magnitudes of injury or loss may occur, risk can be defined as:
• Risk = (Probability of an undesired consequence) x (size of the loss)


Risk Assessment Methodology
• Hazard Assessment
• Dose-Response Assessment
• Exposure Assessment
• Risk Characterization
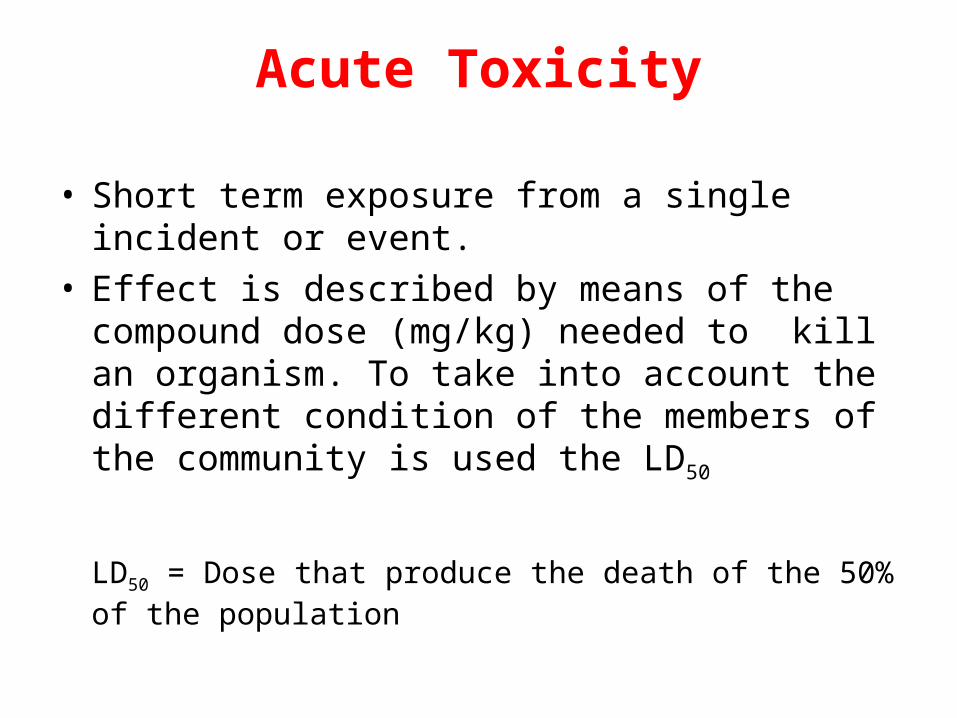
Acute Toxicity
• Short term exposure from a single incident or event.
• Effect is described by means of the compound dose (mg/kg) needed to kill an organism. To take into account the different condition of the members of the community is used the LD50
LD50 = Dose that produce the death of the 50% of the population

Acute Toxicity
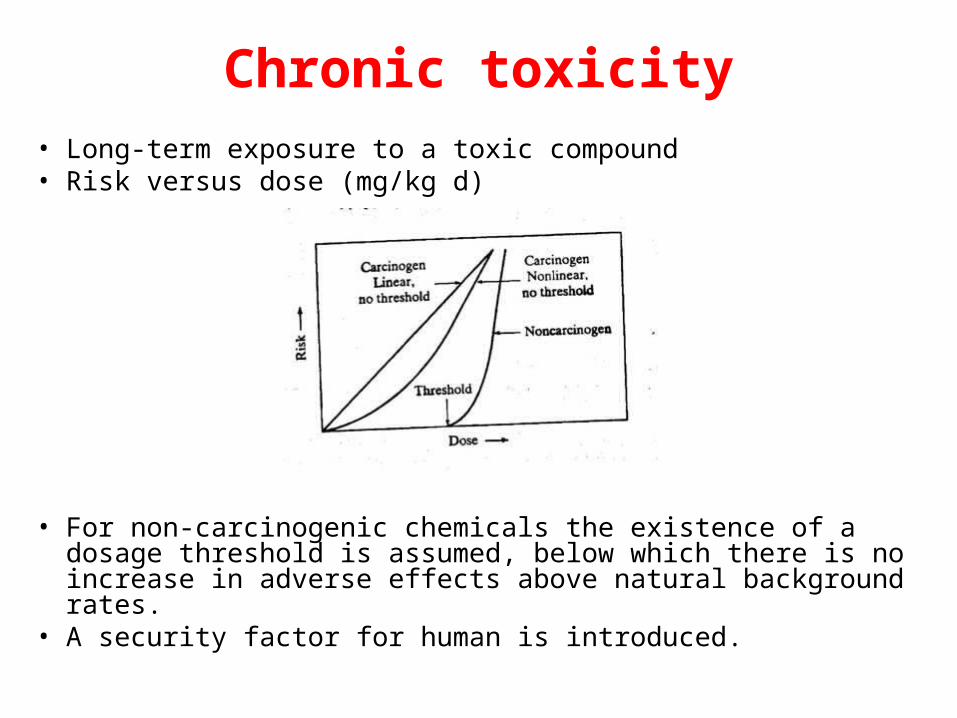
Chronic toxicity• Long-term exposure to a toxic compound• Risk versus dose (mg/kg d)
• For non-carcinogenic chemicals the existence of a dosage threshold is assumed, below which there is no increase in adverse effects above natural background rates.
• A security factor for human is introduced.
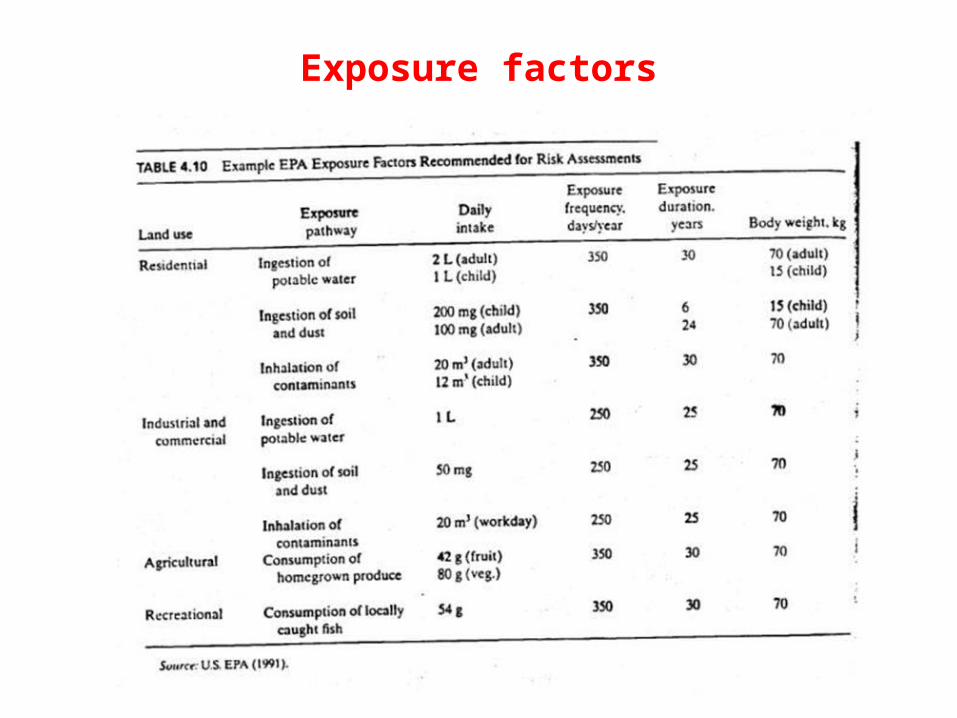
Exposure factors

Dose-response assessment relationship for a non-carcinogenic chemicals
• There is a threshold value• Lower dose with observable adverse effect level
(LOAELs)• Non observable adverse effect level (NOAELs)• Reference Dose (RfD) = Acceptable daily intake

Dose-response assessment relationship for a non-carcinogenic chemicals
• RfD = NOAEL/ Security factor (10)
• Dose (mg/kg d) is compared versus RfD
Hazard quotient (HQ) = Dose/RfDAcceptable risk for a non carcinogen = HQ < 1
• Where several chemicals are present at the same time, the HZ are summed to yield a Hazard index (HI)Hazard Index (HI) = (HQ)i

Reference Dose
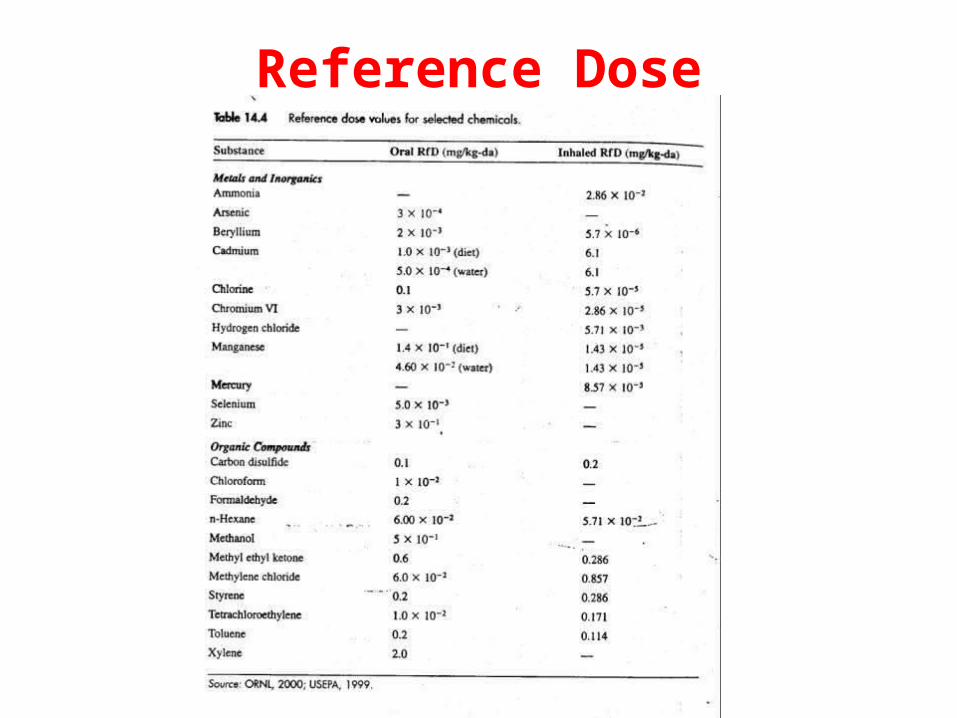
Reference Dose

Sources of uncertainty in risk assessment

Potency factor (Carcinogens)
• Chronic Daily Intake (CDI) is the average daily dose of a chemical over the lifetime of an individual– CDI (mg/kg d) = Daily Dose (mg/d)/Weight (kg)
• Potency Factor based on the dose-response curve– PF = Incremental cancer risk for a chronic daily intake
of 1 mg/kg d
• Incremental Risk, based on a lineal response– Incremental lifetime cancer risk = CDI x PF

Potency factor (Carcinogens)

Acceptable risk ?
• EPA considers acceptable a risk of 10-6
• Values higher than 10-3 are considered important and need an attention
• Risk between 10-4 and 10-6 can be accepted, although require a specific study

Bioconcentration• Accumulation of pollutants

Risk Management
• Risk management: Process to define the acceptable risk in a specific situation and decide on the best course of action to reduce, control or eliminate the risk
• There are four options to manage a risk:– Reduce or eliminate the source (removal of
contaminated soil, reduction of gas emissions)– Modify exposure (to avoid spread of by means of
barriers)– Reduce or eliminate human exposure (prohibit
access, evacuate the population)– Treat or compensate the effects (Less favorable
option)
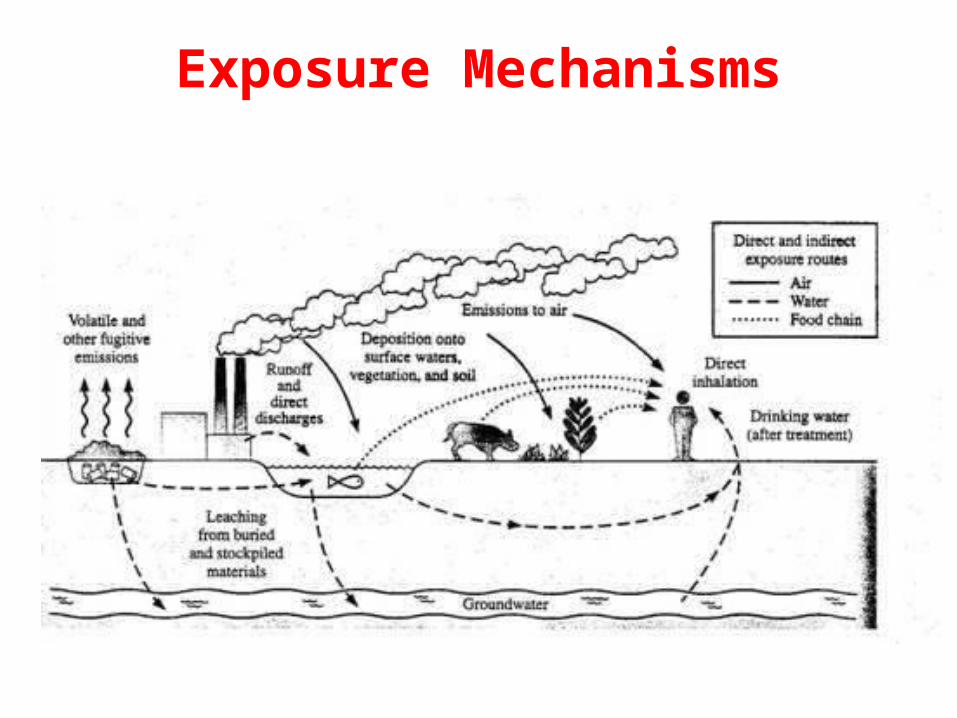
Exposure Mechanisms

Contaminated Sites
• There is a great experience in environmental risk assessment related with contaminated sites.
• It is necessary to reach an equilibrium between environment and health protection and the need of economical and technological resources.
• Risk assessment can lead to that the solution can be no treat the site (when the risk is acceptable)

Steps in the risk assessment and risk management for a contaminated site

Decision Analysis
• A la hora de tomar decisiones sobre una zona contaminada puede existir un número importante de opciones diferentes (desde no hacer nada a diferentes respuestas tecnológicas o institucionales)
• A veces la identificación de los factores que afectan una decisión puede ser complicada
• El análisis de decisiones es una herramienta útil para la toma de decisiones y para estructurar e identificar información relevante para decidir

Influence Diagrams
• Is a way of visualizing the important connections among different elements of a problem.
• In its simple form the diagram consist of a series of ovals representing the key variables that influence a decision
Influence of factors
over final grade in
Environmental Management
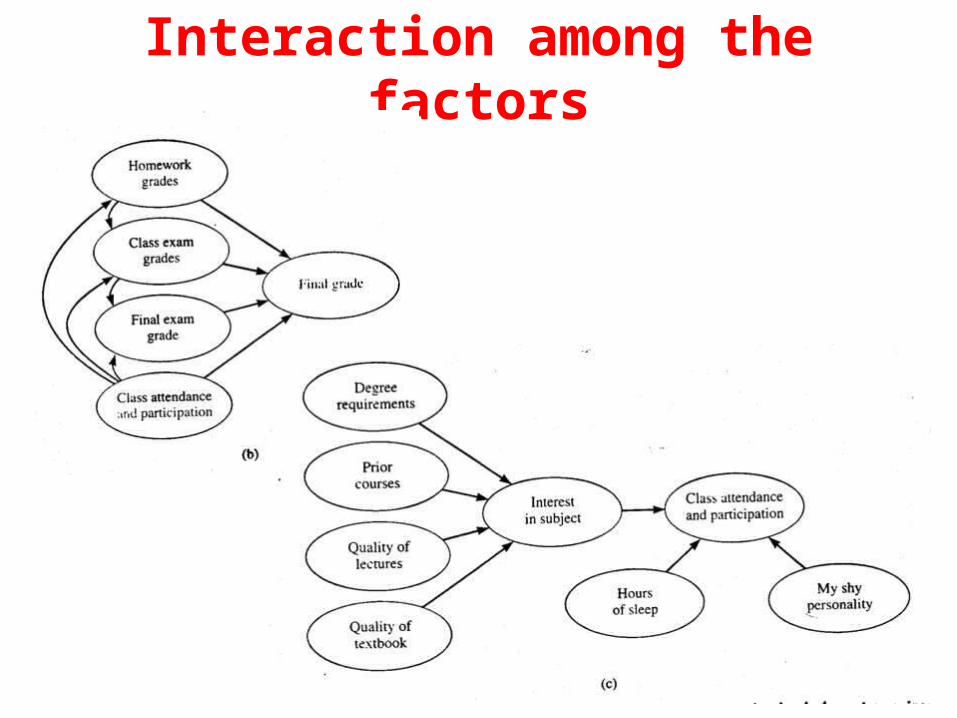
Interaction among the factors

Simbols

Decision trees
• Herramienta gráfica útil para el análisis de decisiones.
• Muestra las ramificaciones o decisiones alternativas e incertidumbres (Forma de árbol)
• Se construye a partir de 2 tipos de nodos:– Decisión (). Debe elegirse una rama– Posibilidad (o). Existen diferentes posibilidades
que cubren todo el espectro

Example• Your company wants to buy and develop a site to build a new
assembly plant for its production. Two available properties would serve equally well. The main difference is cost:– Site A costing 1,000,000 $. Site A is known to be uncontaminated– Site B costing 600,000 $. Site B may require cleanup
• A consulting firm has done a preliminary assessment and developed a mathematical model to predict the likelihood of environmental risk and potential cleanup cost, with the following results:– 80% chance the property is clean– 15% chance the land is partially contaminated (Cleanup effort costing
500,000 $)– 5% chance the land is highly contaminated (Cleanup effort costing
2,500,000 $)
• Draw a decision tree for this problem based on the information given

Example. Part 2
• Suppose that the consulting firm offers you the option of a more detailed site investigation with a cost of 100,000 $. This procedure will yield:– 85% chance of knowing conclusively whether the site
is safe or in need of either partial or major cleanup– 15% chancethat the deeper investigation will be no
more conclusively than the preliminary study
• Draw a decision tree for this problem based on the information given