Embed Size (px)
Citation preview

Risk and Returns to Policy-Created Assets in a Portfolio Context: California Dairy Quota
March 2002
Daniel A. Sumner Frank H. Buck, Jr. Professor
Department of Agricultural and Resource Economics University of California, Davis
One Shields Avenue Davis, CA 95616-8512 [email protected]
Norbert L. W. Wilson Auburn University
Department of Agricultural Economics and Rural Sociology 100 Comer Hall
Auburn, AL 36849 [email protected]
Risk and Returns to Policy-Created Assets in a Portfolio Context:
California Dairy Quota
The capitalization of farm program benefits and the effects of policy on the rate of return to
investments in farm assets have long been important to agricultural policy analysis. The issues
often arise in the context of the influence of policy on prices of farmland and other physical
assets, but also apply directly to policy-created assets such as farm program quota. Several years
ago, D. Gale Johnson assessed the literature as follows, “Roughly speaking, the discount rate
used to value future earnings from [farm-program created] quotas is approximately 25 percent.
Thus individuals who have recently purchased a quota do receive a net return from owning the
quota, but the net return can be reasonably said to be return to risk” (p. 202). Johnson’s
assessment was based on studies across a number of countries and commodity programs. (See
for example, Arcus, Barichello (1981), Seagraves, Sumner and Alston, Warley, among others in
the early literature.)
In this article we exploit particular characteristics of the California dairy quota program
and an unusually rich data set to study the capitalization of program benefits and risks associated
with farm policy. The design of the California dairy quota program helps make flow returns to
quota ownership and the capitalized value of the policy benefits more transparent compared to
most other agricultural programs. This transparency allowed us to assemble a more complete
data set on the flow of policy benefits and capital values than has been available for most other
government programs. In addition, the long policy history and the existence of monthly flow
return and asset price data are unusual for such markets. We are therefore able to measure the
contribution of quota ownership to variability of total returns in alternative portfolios.
1

Economists have used the term policy risk in two senses to discuss the rate at
which expected revenue streams attributed to farm policy are capitalized into asset values. The
first sense, “portfolio risk,” is the standard notion from the investment/finance literature. The
portfolio risk associated with an investment and hence the risk premium demanded is measured
by the contribution of that investment to the future variability of returns of the investor’s whole
portfolio of assets. The second sense, “default risk,” is related to the likelihood of a negative
shock in the future that reduces the expected value of an investment. This is analogous to the
way the term risk is used in the risk assessment literature and in informal discussions as, for
example, when someone says that rock climbing is a risky hobby. In the context of policy
analysis, default risk is related to the likelihood that a policy change that lowers the value of
policy-related assets will occur in the future.
These two senses of policy risk lead to two hypotheses about why the measured historical
rates of return to investments in farm-policy-created assets have been relatively high. The first
hypothesis is that, since the benefits of farm programs (such as returns to production quotas or
marketing quotas) are typically tied to production of a commodity, the benefits attributable to the
government program co-vary positively with returns to farming itself. Given typical farm
program rules, variability of returns to farm policy are not fully diversifiable. Therefore the rates
of return demanded for investments in such policy-created assets are relatively high in part
because these investments add to the risk of the portfolio held by farmers. The second
hypothesis is that farmers expect that there is a significant likelihood that the historical returns
associated with farm programs will fall in the future. Therefore, the expected value of the future
revenue stream is less than that reflected by historical returns to investments in policy-created
assets. This means that the measured historical rate of return on investments in these policy
2
created assets will be high relative to investments for which the chance of default is
lower or negligible.
This article provides clear evidence concerning the first of these hypotheses and thus
contributes to interpretation of farm policy benefits. Using our unique data, we find that the
historical rate of return to investments in California dairy quota has been about 27 percent per
year—quite similar to that for other farm-policy-created quotas. However, we show clearly that
this is not a result of portfolio risk. We establish for an important case, that the relatively high
historical rate of return to a farm-policy created asset do not derive from rules that limit the
ability of quota to be held by those with diversified. Of course, this does not mean that policy
risk plays an unimportant role. Indeed, we expect that the reason historical rates of return to
farm-policy-created assets have been “high” is that farmers see a non-trivial probability of a
significant and (from their point of view) negative change in the underlying policy. That is,
quota owners build substantial default risk into their estimate of the expected future return.
Measurement of Returns to Agricultural Quota
Previous researchers have attempted to compare the rates of return to investments in farm quotas
to the rates of return earned by investments in other assets. The modern literature began with
Seagraves, who calculated the rate of return for flue-cured tobacco allotment in North Carolina
from estimated flow returns to quota ownership and variations in land prices. Seagraves
estimated a high and declining rate of return over time and argued this decline was the result of
subsiding producer concerns about the future of tobacco production and the quota program (see
also Shuffett and Hoskins). Fifteen years later, Sumner and Alston noted that in 1982 the price
of flue-cured tobacco quotas was three to five times the lease rate of the time, suggesting a rate
of return of 0.20 to 0.33.
3
There are several estimates in the literature that deal with dairy marketing
quota. Moschini and Meilke calculated the rates of return for the dairy quota in Ontario from
1980 to 1986 to be in the range of 0.01 to 0.34, depending on the specific type of quota and year.
Barichello (1996) and Chen and Meilke found rates of return for Ontario dairy quota in the range
of 0.26 to 0.36. Colman, et al. reported annual quota prices, lease rates, and linked these to the
history of the dairy policy in the United Kingdom. In their data, the average ratio of the lease
rate to quota price, for the period 1986 through 1998, was 0.18, with a small increase at the end
of the period. (See also Arcus on the value of milk quota in British Columbia and Hubbard on
the returns to milk quota in the United Kingdom.)
In general, the measured rates of return for quotas have been higher than the rates of
return to investments in typical equity market indexes such as the S&P500. However, the cited
studies have relied on relatively limited data on both the asset values and the flow returns to the
quota asset to make these calculations.
Using the capital asset pricing model (CAPM), Lermer and Stanbury argued that the risk
associated with Canadian agricultural marketing quotas was separable into diversifiable and non-
diversifiable risk. Lermer and Stanbury pointed out that that most Canadian producers who
produced under a quota program had a high proportion of their wealth attached to the commodity
under quota. Furthermore, because Canadian programs established marketing or production
quotas, the asset value of the quota was tied directly to the profit in the industry. Finally,
restrictions on the transfer of quota limited producers from transferring quotas to others who had
more diversified portfolios relative to the farmer-quota owners. The limited ability to diversify
returns from the quota meant that producers incorporated an additional risk premium from the
risk that was not diversified through a broad portfolio. Lermer and Stanbury noted that this
4

limited ability to diversify “will be reflected in [the producer’s] unwillingness to
bargain up the price for quota rights” (p. 194). Lermer and Stanbury attributed the relatively
high rates of returns to quota ownership to an inability to diversify quota risk. However, they did
not test their hypotheses empirically. This article provides such a test of this diversification
hypothesis for the important case of California dairy quota.
Sumner, Alston, and Barichello (1996) represented policy risk primarily in terms of a
probability factor representing the likelihood of program elimination (or other reduction of in
policy benefits) that lowers the asset price by lowering the expected present value of the future
returns to the quota. Barichello (1996) stated, “This risk is manifested in a possible fall in the
expected value of the asset rather than an increase in the variance of its future returns, the risk
normally incorporated via a risk premium in the discount rate” (p. 294). However, Alston noted
that in the case of the risk-averse producer, a risk premium exists in addition to the effect on the
probability of program elimination on the expected value of future program benefits. And,
Sumner observed that, in the case of the tobacco production quota, the restriction “that buyers of
quota must be active tobacco producers also means that returns on investment in quota will be
highly correlated with the returns to the farming activity” (p. 130).
Overall, the literature has established that the measured rate of return to owning farm-
policy-created quota is relatively high. Some authors have explained that the measured rate of
return reflects both the expected value of the future stream of benefits associated with the quota
and the contribution of the quota to the risk of the quota owner’s full portfolio. The present
article is the first to measure explicitly the degree to which portfolio risk accounts for the high
historical rate of return to quota.
The Basic Operation of the California Dairy Quota Program
5
Before discussing characteristics of the market for California dairy quota, it
is important to appreciate how the program operates and how the returns to quota are generated.
The dairy quota program in California began in July 1969. Quota was initially allocated to
producers in proportion to their sales of milk for beverage consumption. However, milk revenue
for the industry is not affected by the existence or distribution of quota. As in the U.S. federal
milk marketing order system, dairy revenue in California is generated through price
discrimination by end-use and then pooled before being dispersed to producers. The California
quota program has no direct role in setting milk prices by end-use (price discrimination) or in
allocating milk among uses. The quota program affects only the dispersal of pool revenue
among producers. Quota ownership varies across farms, and the revenue of an individual farm
depends on the amount of quota that the farm owns, as well as that farms milk production and
the minimum class prices.
Prior to 1994, monthly returns for quota were calculated as the difference between the
weighted average of the prices of the higher-priced end-use classes of milk and the weighted
average of the prices of the lower-priced end-use classes of milk. For a typical month, the flow
return to quota ownership was the difference between the quota milk price, Pq, and the overbase
(non-quota) milk price, Pn (Sumner and Wolf, 1996). Milk prices Pq and Pn each varied widely
because the underlying class prices varied and the shares used created the weighted averages
varied. Thus, the per-unit flow of returns to quota varied over time because of variation in (1)
milk sales by end use, (2) amount of aggregate quota relative to total milk sales, and (3) end-use
class prices. Since 1994, the payment per unit of quota has been fixed. Under this system, the
first step in dispersing pool revenue is simply to allocate daily $0.195 per pound of solids-not-fat
(snf) for each pound of quota owned. For the aggregate quota quantity, Q, (in snf terms), the
6

total daily revenue assigned to quota is $0.195Q. Quota revenue for an individual is
$0.195Qi, where Qi varies from zero (for about 20% of producers) up to total milk of that farm’s
output (for a few producers in any month). The rest of the pool revenue, Rn, is dispersed to
individual producers according to milk production. The non-quota pool price per unit of snf is
therefore Pn=Rn/M, where M is total milk output in the program. The quota milk price (Pq) is
defined in snf terms as Pq=$0.195 + Pn and total revenue for producer i (Ri) is simply Ri=
MiPn+0.195Qi.
The quota asset market is regulated by the state of California. Key rules are as follows:
(1) Quota may be bought and sold, but only farmers who maintain a valid market milk permit
and produce market milk in California from at least five cows may own quota. (2) Minimum
holding periods limit short term speculative trading. (a) After a purchase of quota, a producer
may sell no quota for two years, except for cases of hardship; (b) a producer who sells quota may
not buy quota for two years; (c) newly allocated quota and quota purchased from cases of
hardship may not be sold for five years. New quota was allocated to current owners and new
producers intermittently, but no new quota has been allocated since 1992 (State of California).
Measurement of the Returns to Quota Ownership
We consider the return in period t to owning a pound of California dairy quota (in pounds of snf
per day) for a month (Quota Return) into three components:
First, Flow Returnt = [(Pqt - Pnt)Dt]/8.7, represents the monthly revenue flow from quota
in pounds of snf equivalent, where the prices are per hundredweight of milk so must be divided
by 8.7 to convert to pounds of snf. The total is multiplied by the number of days in the month
(Dt) to convert daily revenue to monthly revenue. Second, Capital Gaint = Vt – Vt-1, represents
the capital gain in month as the average price paid for quota purchased during month t, Vt, minus
7

the average price paid in the previous month, Vt-1. Third, New Quota Return =
(NtVt)/12Zt, represents the monthly value contribution of any annual disbursements of new quota
as simply the number of units of new quota distributed to existing producers, Nt, times the unit
price of quota, divided by the total quota already owned, Zt and divided by 12 to turn annual
value into a month flow equivalent1. Summing the components together yields the total monthly
return to quota: Quota returnt = Flow Returnt + Capital Gaint + New Quota Returnt.
Based on administrative records kept by the California Department of Food and
Agriculture we assembled observations on each variable for each month since the inception of
the program in July 1969. The first few months after the quota program began saw a rapid jump
in the value of quota, extreme variability in the quota price and were clearly not representative of
the next 29 years. Therefore, our sample period for empirical analysis begins in January 1970.
Additional data used for the empirical analysis includes the per unit milk return divided by the
unit cost for dairy production in California and the monthly rate of return to investments of a
market index of equities in the United States. See the appendix for detailed data definitions.
Applying a Capital Asset Pricing Model to Quota Market Data
In order to measure the role of variability in returns to quota in determining the price of quota
and the role of portfolio risk in the high rate of return to investments in quota, we must specify a
model for pricing these capital assets. Researchers in the finance literature have spent
considerable effort investigating the pricing of investments in a portfolio context. In the most
commonly used approach, the degree to which an investment adds to the risk of the full portfolio,
typically denoted as the beta, is measured as the covariance between the rate of return to a
specific investment and that of the overall market portfolio divided by the variance of the rate of
return to the market portfolio. (Classic contributions are Sharpe 1964, Lintner 1965, Black 1972,
8

Fama and Miller 1972, and Ross 1977). Using this definition, betaj is simply the
coefficient of the simple regression of the rate of return of the investment j on the rate of return
of the market portfolio.
Virtues of this framework are its simplicity, robustness and long track record. As a
descriptor of asset prices, the model assumes competition and the potential for portfolio
diversification. California dairy quota is available for trade each month among hundreds of
potential buyers and sellers. Furthermore, whereas holding-time rules limit short run
speculation, owners typically hold quota well beyond the required two-year (and even the five-
year) holding period. So these basic conditions seem to be approximately satisfied. Further,
after reviewing several different asset-pricing models (the consumption beta, Arrow-Debreu
securities, and the pure arbitrage version of the Arrow-Debreu securities models, as well as
CAPM), Varian concludes, “…in most asset pricing, the value of an asset ends up depending on
how it co-varies with other assets. What is surprising is how generally this insight emerges in
models that are seemingly very different.” (p. 370). Here we proceed with the simple CAPM
framework to determine the impact of portfolio risk on the value of the California dairy quota.
Returns and Risk of Investment in Dairy Quota
Table 1 provides the mean, standard deviation, and coefficient of variation for each component
of quota returns and the total returns to quota. Several facts stand out in the first four rows of
Table 1. First, in contrast to investments in stock market indexes, almost 90 percent of Total
Quota Return came from the monthly Flow Return to Quota—less than 10 percent of the quota
return was from Capital Gain. In a typical stock index most return in from capital gain not
dividends. (New Quota Return, which is analogous to a stock-split, provided only a very small
share of the benefit of owning quota.) Second, capital gains were the dominant contributor to the
9

monthly variation in returns. The coefficient of variation for the monthly Total
Quota Return (3.60) was dominated by positive or negative changes in the monthly price of
quota. Notice, also, that the coefficient of variation for the Flow Return, defined as Pq - Pn, was
larger than the coefficient of variation for the Overbase Milk Price, Pn, which means that the
Quota Milk Price, Pq, contributed variability to the Flow Return and that the two milk prices did
not always move together.
Table 1 also shows summary statistics on the Overbase Milk Price, Unit Cost of
production , and Per Unit Milk Return (defined as the Overbase Milk Price less Unit Costs). Per
Unit Milk Return had a higher coefficient of variation than its components indicating the less
than perfect correlation between the Unit Cost and Overbase Milk Price.
Finally, Table 1 summarizes the information in rate of return form and allows comparison of
return to quota to returns to other assets. Measured over 348 months, the Flow Rate of Return
(the Flow Return divided by the Quota Price) was 1.7 percent per month and the Total Quota
Rate of Return was 2.2 percent per month. Based on this monthly rate, the annual rate of return
was 27 percent for total return to quota ownership. Note that, over this 29 year period, the
historical rate of return to investments in quota was double the historical rate of return to
investments in a diversified portfolio of stocks as shown by the Market Index Rate of Return—
2.2 percent per month compared to 1.1 percent per month. This finding confirms that the
historical rate of return to investments in California dairy quota is similar to that of other policy-
created farm quotas and well above the rate of return to an index of stocks.
We next turn to measuring how California dairy quota performs in the context of a
portfolio of a diversified stock index. Column 1 of Table 2 provides the betas from the
regressions of the Flow Rate of Return and the Total Quota Rate of Return on the Market Index.
10

Analogous betas are commonly found in the finance literature for individual stocks
and other investments. Using a market portfolio as the base portfolio, common stock betas are
positive and usually range from 0.7 to 1.5 (Gallinger and Poe, 1995). In our case, the beta for
Flow Rate of Return is negative but not significantly different from zero2. The beta for the Total
Quota Rate of Return is 0.099. This value is also very small and not significantly different from
zero. These results show that investments in California dairy quota would have contributed
nothing to risk when held in a fully diversified portfolio of equities. Investments in California
dairy quota would contribute less risk to the market portfolio than would an investment in a
typical common stock and, would in that sense, be expected to offer a lower rate of return for the
same expected value of future benefits.
However, the betas associated with a diversified portfolio of common stock less relevant
when quota ownership is limited to California dairy producers. Therefore, let us consider the
investment in dairy quota in the context of investments more typically held by dairy producers.
No data exists on the portfolios held by California dairy producers over the past 30 years. We do
have some information, however. In 1996, USDA data indicated that California dairy producers
had 11 percent of their wealth invested outside of the farm, indicating some level of portfolio
diversification (USDA). Statistical and interviews with representative producers and other
experts suggests that investment in assets associated with farm production (cows, land,
equipment, machinery, etc.) represent the bulk of the portfolio owned by dairy producers
(USDA). Also, dairy farms in California tend to be quite specialized and almost all dairy farm
revenue in California comes from milk sales (USDA, Sumner and Wolf, forthcoming 2003). In
this context, the total value of dairy quota (about one billion dollars) is about five percent of the
magnitude of the approximate value of California dairy farms. As a polar case let us consider
11

how investments in quota perform in the context of a portfolio of investments in the
dairy farm production assets. The nature of these data precludes estimating a formal CAPM beta,
but as noted by Varian (1992), a beta-type of measure can be derived from a number of pricing
models where the market index may be represented by another relevant portfolio.
Obviously, monthly time series data on the rate of return to dairy farm assets are not
available. To implement this approach, we need a proxy for monthly returns to investments in
dairy production assets in California. As shown in Table 1, we were able to find data on the cost
of production for milk in California for the past three decades to match data on milk prices and
returns to quota. We therefore use variations in Relative Margin (Per Unit Milk Return divided
by the Unit Cost) as an instrument for the variations over time in returns to dairy farming in
California. The variations in Relative Margin over time reflect variation in milk prices, costs of
production, and yield per cow. These are obviously important components of variations in farm
net returns, and therefore we expect Relative Margin to co-vary positively with the unobservable
rate of return to investments in dairy farm assets. So long as relative margin co-varies positively
with the rate of return to investments in dairy farm assets, we may use this proxy to estimate
consistently the beta-type measure of the contribution of quota to portfolio risk in a portfolio
dominated by dairy production assets. In particular, the beta-type estimate in our regression will
obviously have the same sign as the true beta. Thus, the sign of the relationship between Quota
Rate of Return and Relative Margin, measured by regression parameter, reflects the sign of a
beta between rate of return to quota and rate of return to dairy production assets.
Table 2 presents the estimated beta-type measure between both Flow Return and Total
Quota Returns and Relative Margin. Both estimated coefficients are negative. The estimated
beta from the regression Flow Return on Relative Margin is large relative to its standard error
12

and statistically different from zero at a 0.01 level of significance. The flow return
estimate is important because most dairy farmers, in fact, make few quota transactions and for
them the fact that the monthly returns from owning quota smoothes their net revenue flow from
milk sales may contribute positively to the value of quota. The coefficient from the regression of
Total Quota Rate of Return on Relative Margin is also negative, but not large relative to its
estimated standard error.
To help interpret the role of quota in the context of a portfolio of dairy production assets,
let us consider the variability of the income stream for a farm with both dairy assets and quota.
Consider a dairy farmer who owns one unit of quota for every three units of milk production
from the farm—roughly the average for the state at the middle of our sample period. Over our
sample period the coefficient of variation of returns to this portfolio would have been 0.97. Note
that this is substantially smaller than the coefficient of variation for the returns to dairy farming
as shown in Table 1. The coefficient of variation for Relative Margin shown in Table 1 is 1.25.
Thus, quota ownership substantially lowers variability of total returns for California dairy farms
that own quota.
Summary and Implications
The measured rates of return to farm-policy-created quotas are typically found to be high relative
to the rate of return to other investments. One hypothesis for the high historical rates of return is
that policy rules typically require that quota be held by farm producers, and this is also true for
California dairy quota. The argument is that, with the lack of diversification typical of farm
producers, owning quota adds to the risk of the portfolio of assets owned by farmers, and
therefore quota earns a high rate of return to compensate for the additional portfolio risk. Under
production or marketing quotas, but not under California dairy quota, returns to quota ownership
13
are tied closely and positively to returns to farming (Lermer and Stanbury, Sumner,
Barichello 1996, and OECD 1996). In those cases, quota may be worth less to farmers than to
outsiders because quota indeed adds to the risk of the overall enterprise. But the magnitude of
this effect is the relevant question.
We find that over a 29-year period, the rate of return to California dairy quota has also
been high (2.2 percent on a monthly basis and about 27 percent per annum) compared to other
investments and similar to the rates of return observed for other agricultural quotas. The quota
return was double that of a diversified portfolio of stocks, although the variability of the quota
return was relatively small. We also find that returns to quota had a zero or negative covariance
with returns to other investments and generally lowered the risk in the overall portfolio for both a
market index of equities or a portfolio of dairy production assets.
Because of its covariance properties, an investment in California dairy quota lower the
variability of total returns and reduce overall portfolio risk for California dairy farmers. The
implications of this result are that Producers would pay extra for quota because of this negative
covariance property. Therefore, restrictions that only dairy farmers may own quota does little (or
nothing) to reduce the price of quota because California dairy quota is likely to be more valuable
to dairy farm owners than to those outside the business. Quota acts as a hedge in a portfolio
comprised of dairy production assets and in that sense the restriction on ownership by non-
farmers does not reduce the price of quota and furthermore the portfolio risk characteristics
should reduce not increase the measured rate of return to quota.
Portfolio risk cannot account for the high measured rate of return to California dairy quota
ownership. The Lermer and Stanbury hypothesis is rejected. And, since the California quota
rate of return is similar to that for other farm-policy-created quotas, this evidence suggests that
14

portfolio risk is a weak explanator for the high measure rate of return for other
similar quota assets. We therefore come back to the hypothesis that farmers assign a significant
probability that the future will be unlike the past and therefore farmers’ expected value of future
returns is substantially lower than the measured historical returns. That is, default risk not
portfolio risk accounts for the high historical rate of return to quota.
15

Endnotes
1. In July 1978, the CDFA disbursed new quota as a result of ad hoc legislation. To set the
value of this disbursal we multiplied the amount of quota disbursed by the July 1978 quota price,
divided by the total quota in the system at July 1978. We allocated one-sixth of this total to each
month from July 1978 through December 1978.
2. Scott and Brown argued that if the market portfolio and the error co-vary and the error is
autocorrelated, then the estimate of beta is biased and unstable. For all the regressions, we
checked for the covariance of the market portfolio and the error and autocorrelation. Our
estimate of the covariances was zero for all of the models. For the Flow Rate of Return
regressions, we discovered, using the Bruesch-Godfrey test that the error is autocorrelated. We
corrected for the third-order auotcorrelation using the Cochran-Orcutt procedure. The corrected
results are reported in Table 2.
16
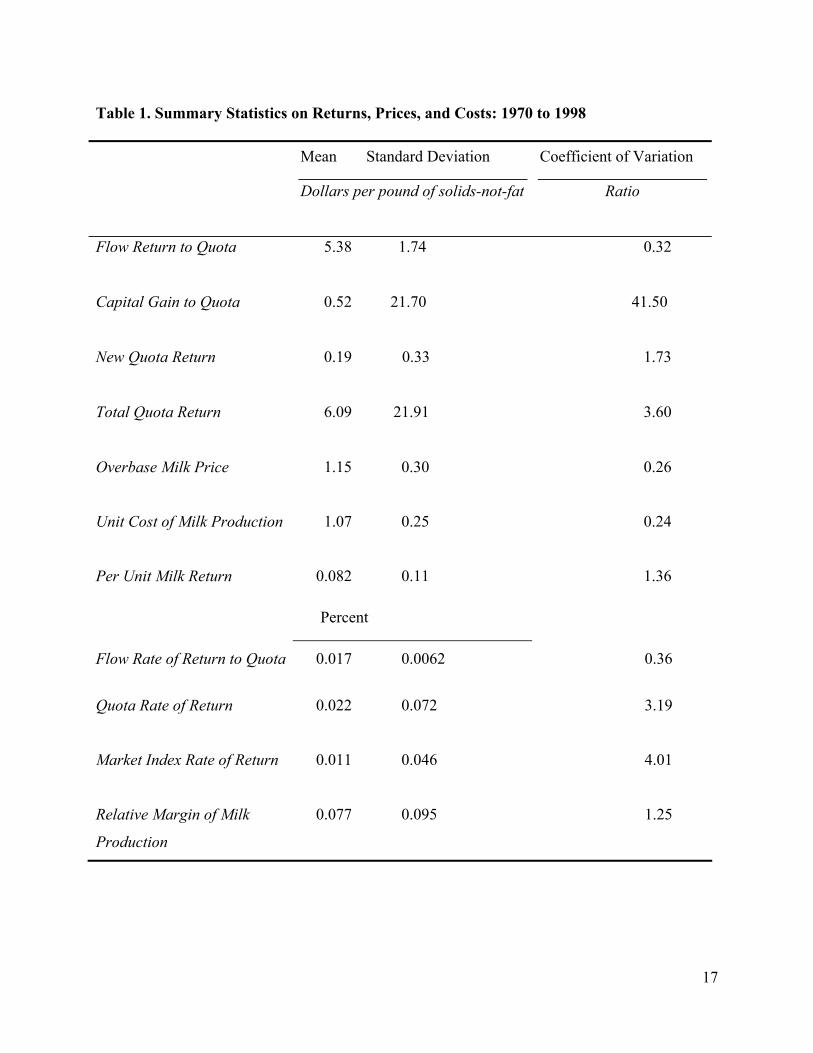
Table 1. Summary Statistics on Returns, Prices, and Costs: 1970 to 1998
Mean Standard Deviation Coefficient of Variation
Dollars per pound of solids-not-fat Ratio
Flow Return to Quota
5.38 1.74
0.32
Capital Gain to Quota
0.52 21.70 41.50
New Quota Return
0.19 0.33 1.73
Total Quota Return
6.09 21.91 3.60
Overbase Milk Price 1.15 0.30 0.26
Unit Cost of Milk Production 1.07 0.25 0.24
Per Unit Milk Return 0.082 0.11 1.36
Percent
Flow Rate of Return to Quota 0.017 0.0062 0.36
Quota Rate of Return 0.022 0.072 3.19
Market Index Rate of Return 0.011 0.046 4.01
Relative Margin of Milk
Production
0.077 0.095
1.25
17

Table 2. Covariance Relationships between the Rates of Return to Investments
in Quota and Investments in an Index of Equities and Dairy Production Assets
Estimated Betas1
Market Index2 Relative Margin3
Flow Rate of Return to Quota4 -0.0024
(0.0030)
-0.040
(0.0045)
Total Quota Rate of Return 0.099
(0.084)
-0.049
(0.040)
Notes:
1. The values in parentheses are the standard errors of the corresponding betas.
2. Entries in this column represent regression coefficients with Market Index (monthly rate of
return of the NYSE/AMEX/NASDAQ Value-Weighted Market Index) as the independent
variable and Flow Rate of Return or Quota Rate of Return as the dependent variables.
3. Entries in this column represent regression coefficients with Relative Margin [(Overbase Milk
Pricet-Unit Costt)/Unit Costt] as the independent variable and Flow Rate of Return or Quota Rate
of Return as the dependent variables.
4. Using the Breusch-Godfrey test, we rejected the null hypothesis of no autocorrelation for the
two regressions with Flow Rate of Return as the dependent variable. We used the Cochran-
Orcutt method for the regressions of Flow Rate of Return to correct for the third-order
autocorrelation.
18

References
Arcus, P. L. “The Values of Milk Quotas in British Columbia: An Economic Analysis.” Can. J.
Agr. Econ. 26 (1978): 62-71.
Alston, J. M. “Economics of Commodity Supply Constraints.” Eds. T. Becker, R. Gray, and A.
Schmitz. Improving Agricultural Trade Performance under the GATT. Kiel:
Wissenchaftsverlag Vauk Kiel KG, 1992.
Barichello, R. R. The Economics of Canadian Dairy Industry Regulation. Technical Report E/12,
Ottawa: Economic Council of Canada and the Institute for Research on Public Policy,
1981.
---. “Capitalizing Government Program Benefits: Evidence of the Risk Associated with Holding
Farm Quotas.” Eds. J. M. Antle and D. A. Sumner. The Economics of Agriculture,
Volume 2, Papers in Honor of D. Gale Johnson. Chicago IL: The University of Chicago
Press, 1996.
Black, F. “Capital Market Equilibrium with Restricted Borrowing.” J. Bus. 45 (July 1972): 444-
455.
Chen, K. and K. Meilke. “The Simple Analytics of Transferable Production Quota: Implications
for the Marginal Cost of Ontario Milk Production.” Can. J. Agr. Econ. 46 (1998): 37-52.
Colman, D., M. P. Burton, D. S. Rigby, and J. R. Franks. “Economic Evaluation of the UK Milk
Quota System.” Final Report to the Ministry of Agriculture, Fisheries and Food; The
University of Manchester, Centre for Agricultural, Food and Resource School of
Economic Studies, September 1998.
Fama, E. F. and Miller, M. H. The Theory of Finance. New York NY: Holt Rinehart, and
Winston, 1972.
Gallinger, G. W. and J. B. Poe. Essentials of Finance: An Integrated Approach. Englewood
Cliffs NJ: Prentice-Hall, Inc., 1995.
Hubbard, L. J. "Milk Quotas and Farm Asset Values." National Westminster Bank Quarterly
Review. (1992): 38-47.
Johnson, D. G. World Agriculture in Disarray. London: Macmillan Press LTD, Second Edition,
1991.
19
Lintner, J. “The Valuation of Risk Assets and the Selection of Risky Investments in
Stock Portfolios and Capital Budgets.” The Rev. of Econ. and Stat. 47 (February 1965):
13-37.
Lermer, G. and W. T. Stanbury. "Measuring the Cost of Redistributing Income by Means of
Direct Regulation." Can. J. Econ. 18 (February 1985): 190-207.
Moschini, G. and K. Meilke. “Sustainable Rates of Return From Milk Quotas in Ontario.” Can.
J. Agr. Econ. 36 (1988): 119-26.
OECD. “Farm Asset Values and Agricultural Support.” Working Party on Agricultural Policies
and Markets. Paris: Organization for Cooperation and Development, 1996.
Ross, S. A. “The Capital Asset Pricing Model (CAPM), Short-Sale Restrictions and Related
Issues.” J. Fin. 32 (March 1977): 177-183.
Seagraves, J. A. "Capitalized Values of Tobacco Allotments and the Rate of Returns to
Allotment Owners." Am. J. Agr. Econ. 51 (May 1969): 320-334.
Scott, E. and S. Brown. “Biased Estimators and Unstable Betas.” J. Fin. 35 (March 1980): 49-55.
Sharpe, W. F. “Capital Asset Prices: A Theory of Market Equilibrium under Conditions of Risk.”
J. Fin. 19 (September 1964): 425-442.
Shuffett, M. and J. Hoskins. “Capitalization of Burley Tobacco Allotment Rights into Farmland
Values.” Am. J. Agr. Econ. 51 (1969): 471-474.
State of California Department of Food and Agriculture Milk Pooling Branch. “Pooling Plan for
Market Milk as Amended.” Sacramento CA Effective September 1, 1994.
State of California Food and Agricultural Codes, Sacramento CA, 1997.
Sumner, D. A. “Stability and the Tobacco Program.” Ed. D. A. Sumner. Agricultural Stability
and Farm Programs: Concepts, Evidence, and Implications. Boulder CO: Westview
Press, Inc., 1988.
Sumner, D. A. and J. M. Alston. "Consequences of Elimination of the Tobacco Program."
Bulletin No.469. Raleigh NC: North Carolina Agricultural Research Service, 1984.
Sumner, D. A. and C. A. Wolf. "Quotas without Supply Control: Effects of Dairy Quota Policy
in California." Amer. J. Agr. Econ. 78 (May 1996): 354-366.
Sumner, D. A. and C.A. Wolf. “Diversification, Vertical Integration and the Regional Pattern of
Dairy Farm Size." Rev. Agri. Econ. Forthcoming 1993.
20

United States Department of Agriculture-Economic Research Service. Farm Costs
and Returns Survey, Dairy Version. Washington, D. C., 1996.
Varian, H. R. Microeconomic Analysis. New York: W. W. Norton & Company, Inc. Third
Edition, 1992.
Warley, T. K. "Canada's Agricultural and Food Trade Policies: A Synoptic View." Eds. D. G.
Johnson, K. Hemmi, and P. Lardinois. Agricultural Policy and Trade: Adjusting
Domestic Programs in an International Framework. Report to the Trilateral Commission,
No. 29. New York NY: New York University Press, 1985.
21

22
Appendix: Definitions for Variables in Table 1
Flow Return: the difference between the Quota Milk Price and the Overbase Milk Price in
dollars per hundredweight of milk times the number of days in the month, all divided by
8.7. The difference was fixed at $0.195 per day after December 1993.
Capital Gain: the average monthly Quota Price less Quota Price of previous month.
New Quota Return: the total new pounds of snf quota given out in January of selected years,
multiplied by the January quota price of that year, divided by the total pounds of snf
quota already in the system. The return is distributed at the rate of one twelfth per month.
Total Quota Return: the sum of the Flow Return, Capital Gain and New Quota Return.
Overbase Milk Price: Month pool price for milk in California determined as a weighted average
of the various minimum class prices, which vary monthly based on market conditions.
Unit Cost of Milk Production: the weighted average cost of production for market milk in
California from surveys by the California Department of Food and Agriculture Milk
Pooling Branch. This cost includes feed, hired labor, and miscellaneous costs (herd
replacement costs, taxes, insurance, operating costs, depreciation, and marketing costs
less miscellaneous income).
Per Unit Milk Return: the Overbase Milk Price less the Unit Cost of Milk Production.
Flow Rate of Return: the monthly Flow Return divided by Quota Pric..
Total Quota Rate of Return: the monthly Total Quota Return divided by Quota Price.
Market Index Rate of Return: the monthly rate of return of the NYSE/AMEX/Nasdaq Value-
Weighted Market Index from returns of the trades of the month. Source is the Center for
Research on Securities Prices.
Relative Margin: the Per Unit Milk Return divided by the Unit Cost.


![Conceptual issues raised by GI protection for ...aic.ucdavis.edu/research1/Anania_Montpellier.pdf · [Giovanni Anania, Montpellier, 26 June 2006] 1 Cal-Med I Workshop. Mediterranean](https://img.pdfslide.us/doc/110x75/5e5508bc2a935c7a6c1b0825/conceptual-issues-raised-by-gi-protection-for-aic-giovanni-anania-montpellier.jpg)