Embed Size (px)
Citation preview
Risk Analysis Tool for Safety Management of
Railway Grade Crossings in Canada
March 6, 2018
Lalita Thakali Postdoctoral Fellow
University of Waterloo
Overview
• Background
• About GradeX tool
• Crash Frequency Model
• Crash Severity Model
• Future research plan
3
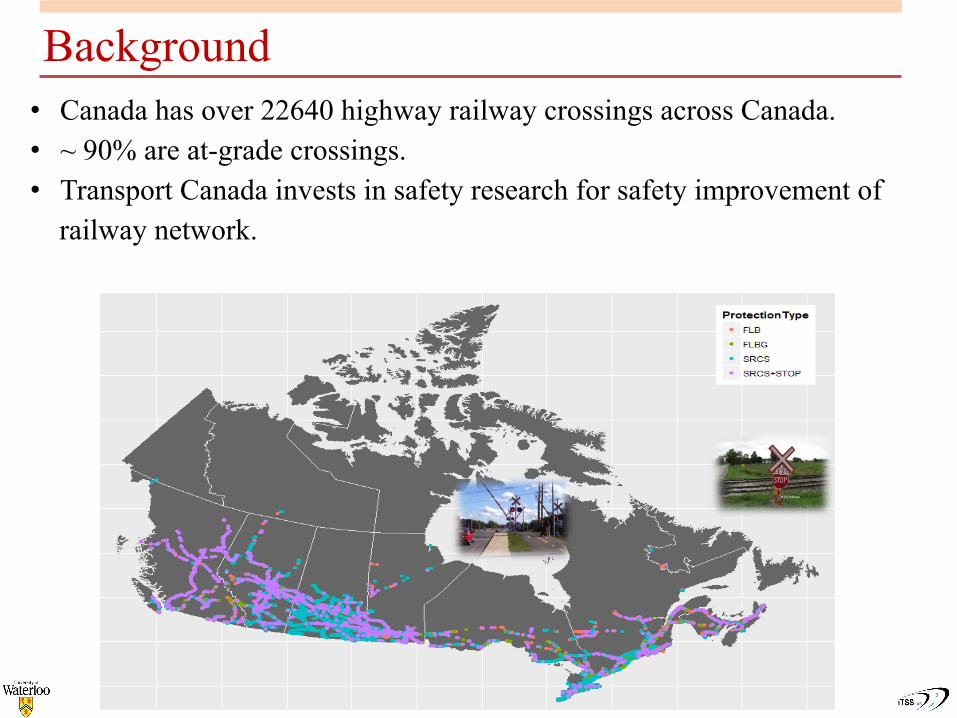
• Canada has over 22640 highway railway crossings across Canada. • ~ 90% are at-grade crossings. • Transport Canada invests in safety research for safety improvement of
railway network.
Background
Safety Research Projects funded by Transport Canada
v Collaborative research involving four Canadian universities o University of Waterloo o University of Alberta o York University o McGill University
v Total five subprojects (2018-19) 1. Update a risk assessment tool i.e., GradeX 2. Develop crossings inspection app 3. Conduct train derailment analysis 4. Perform safety analysis using video data 5. Explore connected vehicle technology for safety warning at grade
crossings
University of Waterloo plays the lead role for overall management of the projects
What is GradeX tool v GradeX is a tool used for risk assessment of grade crossings
v It has a bunch of frequency and severity models for risk assessment
v Transport Canada use GradeX for:
• Data visualization
• Identify high-risk crossings
• Inspection program
• Countermeasure analysis
• Resource allocation
v Previous GradeX models were calibrated using data from 2011 to 2013.
One of the Objectives of current project is to update collision frequency and severity models used in GradeX
v Data obtained from Transport Canada
v Two databases utilized:
o Crossing Inventory Database
o Crossing Collision Database
v Databases merged using unique crossing ID
Data Sources
Frequency Models
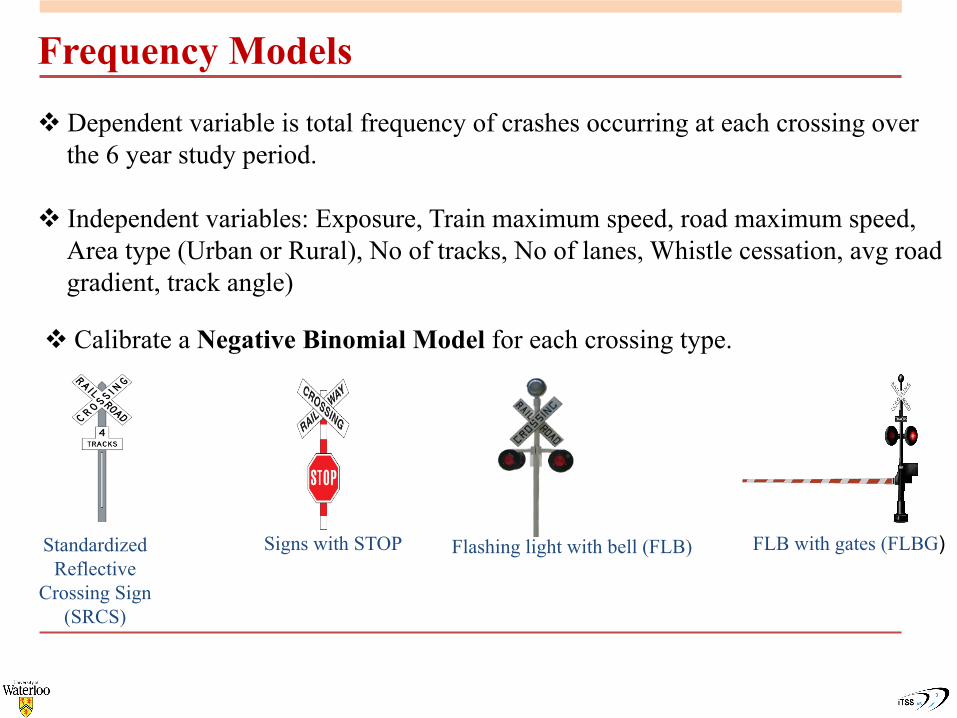
v Dependent variable is total frequency of crashes occurring at each crossing over the 6 year study period.
v Independent variables: Exposure, Train maximum speed, road maximum speed, Area type (Urban or Rural), No of tracks, No of lanes, Whistle cessation, avg road gradient, track angle)
Signs with STOP Flashing light with bell (FLB) FLB with gates (FLBG) Standardized Reflective
Crossing Sign (SRCS)
v Calibrate a Negative Binomial Model for each crossing type.
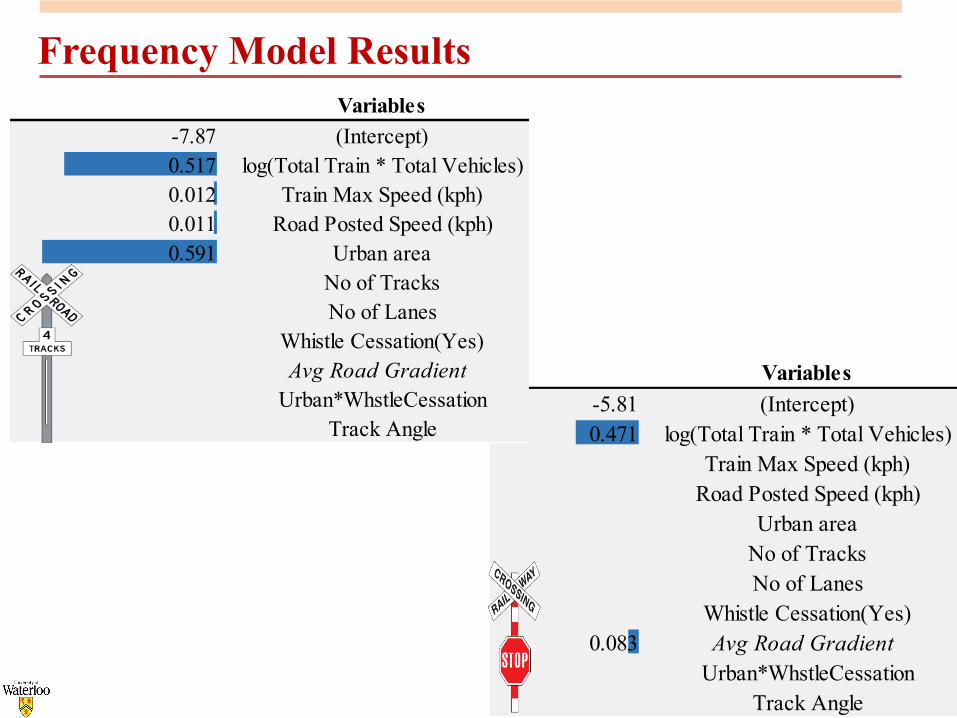
SRCS +STOP (New)Variables
-5.81 (Intercept)0.471 log(Total Train * Total Vehicles)
Train Max Speed (kph)Road Posted Speed (kph)
Urban areaNo of TracksNo of Lanes
Whistle Cessation(Yes)0.083 Avg Road Gradient
Urban*WhstleCessationTrack Angle
SRCS (New)Variables
-7.87 (Intercept)0.517 log(Total Train * Total Vehicles)0.012 Train Max Speed (kph)0.011 Road Posted Speed (kph)0.591 Urban area
No of TracksNo of Lanes
Whistle Cessation(Yes)Avg Road Gradient
Urban*WhstleCessationTrack Angle
Frequency Model Results
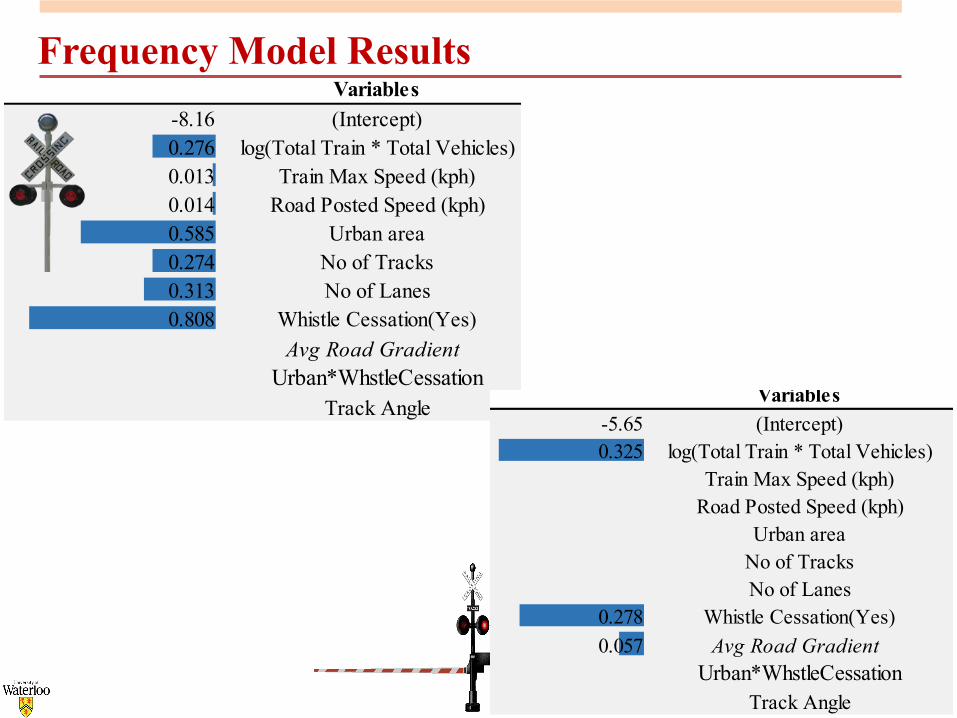
Frequency Model Results FLB (New)Variables
-8.16 (Intercept)0.276 log(Total Train * Total Vehicles)0.013 Train Max Speed (kph)0.014 Road Posted Speed (kph)0.585 Urban area0.274 No of Tracks0.313 No of Lanes0.808 Whistle Cessation(Yes)
Avg Road Gradient Urban*WhstleCessation
Track AngleFLBG (New)
Variables-5.65 (Intercept)0.325 log(Total Train * Total Vehicles)
Train Max Speed (kph)Road Posted Speed (kph)
Urban areaNo of TracksNo of Lanes
0.278 Whistle Cessation(Yes)0.057 Avg Road Gradient
Urban*WhstleCessationTrack Angle
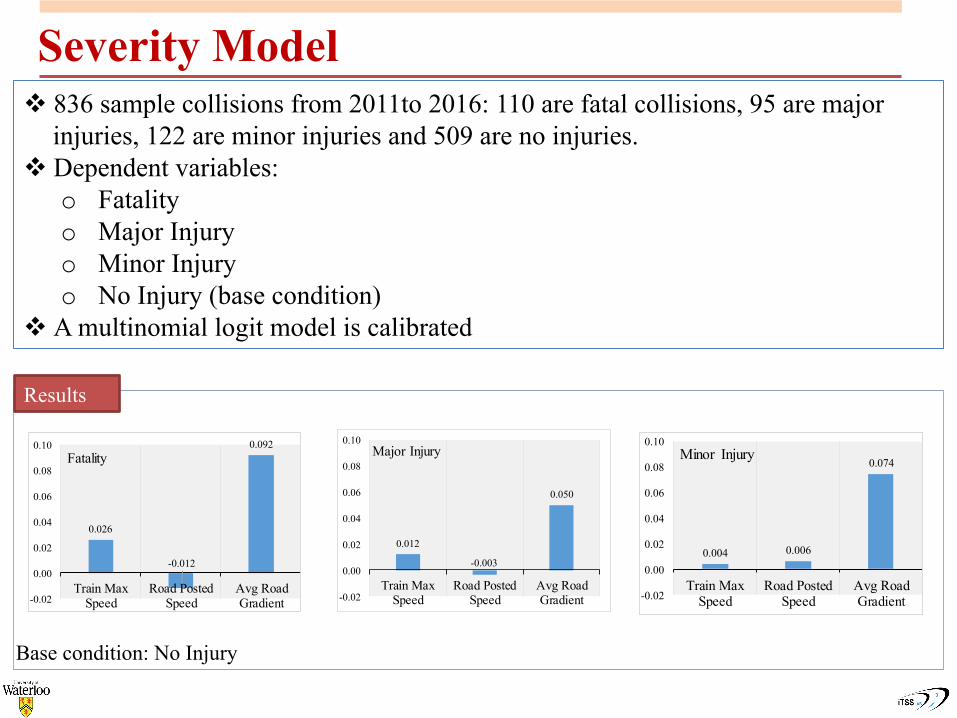
Severity Model v 836 sample collisions from 2011to 2016: 110 are fatal collisions, 95 are major
injuries, 122 are minor injuries and 509 are no injuries. v Dependent variables:
o Fatality o Major Injury o Minor Injury o No Injury (base condition)
v A multinomial logit model is calibrated
0.012
-0.003
0.050
-0.02
0.00
0.02
0.04
0.06
0.08
0.10
Train MaxSpeed
Road PostedSpeed
Avg RoadGradient
Major Injury
0.004 0.006
0.074
-0.02
0.00
0.02
0.04
0.06
0.08
0.10
Train MaxSpeed
Road PostedSpeed
Avg RoadGradient
Minor Injury
0.026
-0.012
0.092
-0.02
0.00
0.02
0.04
0.06
0.08
0.10
Train MaxSpeed
Road PostedSpeed
Avg RoadGradient
Fatality
Base condition: No Injury
Results
Future Research
v Conduct before-after analysis to know safety effectiveness of new
countermeasures
v Develop mathematical model for resource allocation
v There are many crossings
v There are many options for countermeasures
v There is a limited budget
Resource allocation model will help to find which countermeasure to implement
at which crossings to maximize the safety benefits.

Thanks you!