Embed Size (px)
Citation preview
(RISK-2142) "The Monte Carlo Method for Modeling & Mitigating Systemic Risk"
Dr David T. Hulett Ph.D., FAACE
Mr Waylon T Whitehead

PLEASE USE MICROPHONE FOR ALLQUESTIONS AND COMMENTS!
2
BIO of David Hulett
• Dr. David Hulett, FAACE, is a frequent contributor to AACE International conferences
• He is the principal author of two Recommended Practices and lead articles in Cost Engineering
• He has consulted and trained in project risk analysis, particularly quantitative schedule and cost risk analysis, as well as in scheduling, since 1990
• His clients are commercial and government agencies in North America, South America, Asia and Europe
• Something You Don’t Know About Him: He loves choral and barbershop singing
3

BIO of Waylon Whitehead
• Waylon Whitehead has 15 years of experience on oil, gas, and chemical projects greater than $2 BUSD in value
• Experience divided between onshore and offshore, and with EPC and owner organizations
• He consults and trains internally with ConocoPhillips in scheduling and project risk analysis
• His clients are commercial and government agencies in North America, South America, Asia and Europe
• Something You Don’t Know About Him: Compared to Hulett, pretty much everything!
4

INTRODUCTION
5

The Challenge to Monte Carlo Simulation
• Some within AACE have noted a supposed inability of Monte Carlo simulation (MCS) methods to represent systemic risks to project cost and schedule
• The claim is that the bottom-up approach of data collection in MCS-based analyses does not incorporate systemic risks
• This failing would be problematic given the large overruns in schedule and cost that can occur on mega-projects partially as a result of these risks
6

Response: that MCS can Incorporate Systemic Risk
• Systemic risks relate to the overarching issues such as:– Level of new technology– Degree of project definition– Project complexity– Project size– Organization’s ability to manage large projects
• Systemic risks are viewed as different in principal from project-specific risks that are identified during risk data collection based on discussion with project team members and other SMEs
• This presentation shows how Monte Carlo simulation methods can incorporate systemic risks as well as uncertainty and project specific risks for an inclusive approach and result
7
Purpose of the Presentation
• We present a method of combining:– Typical Monte Carlo Simulation methods
– Representing uncertainty and project-specific risks
– Including systemic risks
– Using the Risk Drivers Methodology
• We demonstrate the superiority of that approach for enabling effective mitigation
• The method requires:– Use of a rich database of project results on comparable
projects
– Assessment of the likelihood that the systemic risks will apply to the project being analyzed
8

RECENT DISCUSSIONS ABOUT SYSTEMIC RISK
9
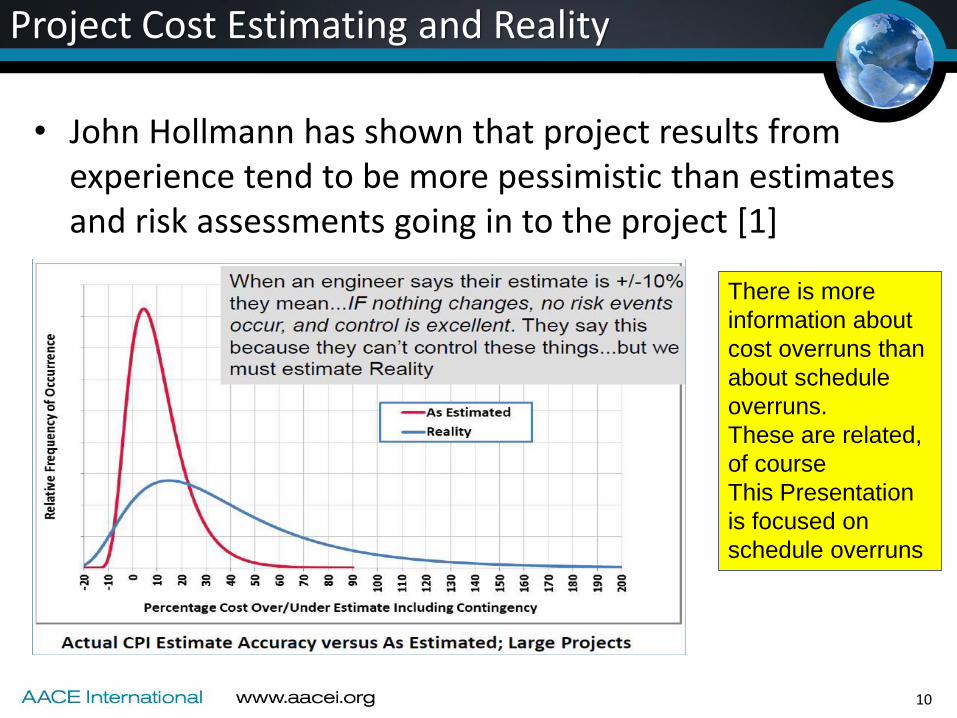
Project Cost Estimating and Reality
• John Hollmann has shown that project results from experience tend to be more pessimistic than estimates and risk assessments going in to the project [1]
There is more
information about
cost overruns than
about schedule
overruns.
These are related,
of course
This Presentation
is focused on
schedule overruns
10

• Ogilvie et. al., using the large database of process plant construction of Independent Project Analysis (IPA) have shown the same trends of overruns of cost compared to going-in estimates [2, also referenced in [1]]
There seems to be a serious
chance of overrunning by
50% to 80% shown by the
bi-modal distribution of
actual results
11

APPROACH TO SCHEDULE RISK ANALYSIS USING MONTE CARLO SIMULATION
12

Components of the MCS Analysis
• Variation of project results compared to project plans generally include:– Uncertainty, including inherent variation, estimating
error and estimating bias
– Project-specific risks
– Systemic risks
• This paper shows how these three types of risks are handled in a MCS approach to project schedule risk analysis
• A recent AACE International Recommended Practice dealt at length with the general method of MCS analysis applied to critical path method (CPM) schedules. [3]
13

Summary Schedule of a Megaproject
Offshore Gas Production Platform Construction Project
40 months duration, $1.7 billion
Schedule Driven Project
14

Add components of Risk - Uncertainty
• Uncertainty is akin to “common cause” variation in the six sigma management
• “Common cause variability is a source of variation caused by unknown factors that result in a steady but random distribution of output around the average of the data. Common cause variation is a measure of the process’s potential, or how well the process can perform when special cause variation is removed. ... Common cause variation is also called random variation, noise, non-controllable variation, within-group variation, or inherent variation.” [4]
15
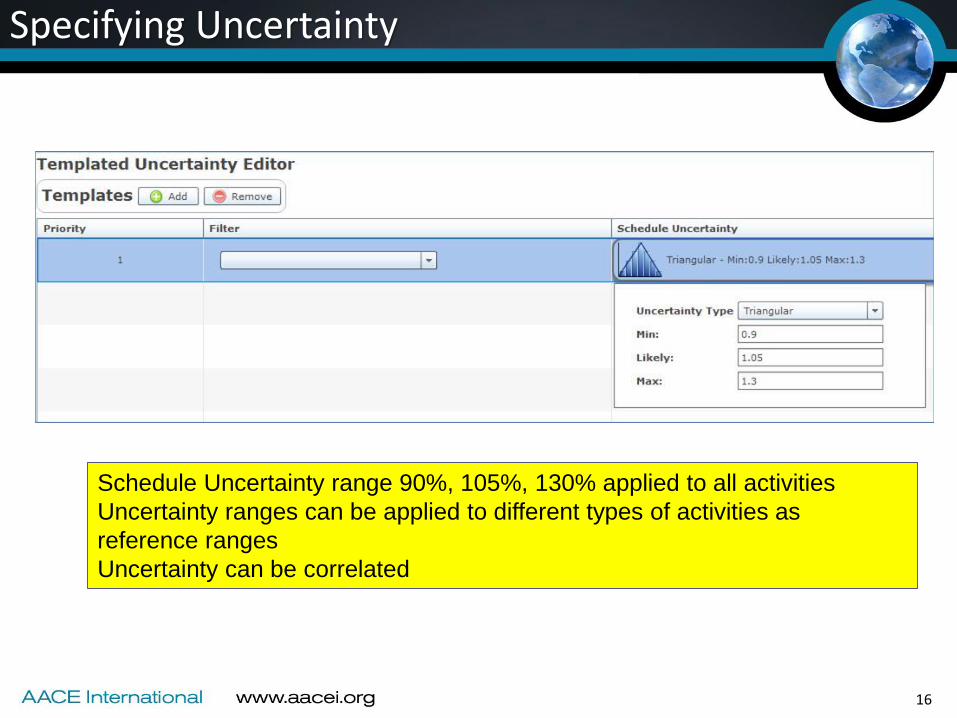
Specifying Uncertainty
Schedule Uncertainty range 90%, 105%, 130% applied to all activities
Uncertainty ranges can be applied to different types of activities as
reference ranges
Uncertainty can be correlated
16

Schedule Risk with Uncertainty Only
Scheduled completion
is April 4, 2019
With Uncertainty Only
the P-80 completion
is October 10, 2019,
P-80 is at 1,377
working days, + 187
days or +16% of
1,190 in the schedule
17

Adding Project-Specific Risks
• Project Specific Risks are like special cause risk in the Six Sigma world
• “… Special cause variation is caused by known factors that result in a non-random distribution of output…Special cause variation is a shift in output caused by a specific factor such as environmental conditions or process input parameters. It can be accounted for directly and potentially removed...” [5]
18

Introducing Project-Specific Risks as Risk Factors
Here are 8 project-specific risks that are assigned to activities in the schedule
Some risks are assigned to several activities, some activities have several risks
assigned
The risks are specified by probability and impact in multiplicative ranges. If they
happen in an iteration the factor is chosen at random and multiplies the duration
Probabilities
Duration Impacts
Activities
affected by
the selected
risk
19

Including Uncertainty and Project-Specific Risks
Scheduled completion is
1,190 working days
With Uncertainty Only
the P-80 completion is
October 10, 2019 and
16% overrun
With project-specific
risks the P-80 is March
18, 2020, for an
additional 5 months.
This is 1,518 days or
+28%
20

ADDING SYSTEMIC RISKS
21

Typical Systemic Risks
• Level of new technology
• Degree of project definition
• Degree of process definition
• Project complexity including interdependence of project phases, components and actors
• Project size
• Project organization’s ability to manage large projects
• Planned engineering-construction overlap
• Aggressiveness of requirements
• Team cohesiveness and commonality of purpose
• Ability to maintain funding
• Labor Availability in closed markets (i.e. Australia, Alberta)
22

Factors adding Stress to the Project Success
• Some factors can exacerbate the project at a systemic level
• One of these is schedule pressure
• Ed Merrow: “Schedule pressure dooms more megaprojects than any other single factor. When there is pressure to move a project along quickly from the outset, corners get cut and opportunists have a field day” [6]
23

Three Systemic Risks / Stressors Added
Schedule Impact Multipliers
Systemic Risk Probability Min Most Likely Max
The approach to the project is not well defined 10% 1.4 1.5 1.7
The project may use significant new technology 15% 1.4 1.45 1.6
Mega-project may have schedule pressure 8% 1.4 1.5 1.7
The Systemic Risks / Stressors are examples
Their probabilities of affecting this project are derived from the risk
interviews
Their impacts should be derived from historical databases and risk
interviews
24

Results with Three Systemic Risks Added
With systemic risks
added, the P-80 is now
May 3, 2021. Systemic
risks added ~ 19 months
The second mode is at
1,950 days which is 66%
overrun on the scheduled
1,190 days
25

Compare the Three Scenarios
Uncertainty, project specific risks and
systemic risks / stressorsUncertainty and
project specific risks
Uncertainty only
The three scenarios show how much contingency systemic risks could add at P-80.
These are results using hypothetical data that illustrate possible historical data’s
information on impact combined with the project team’s assessment of probability
26

PRIORITIZING RISKS FOR RISK MITIGATION
27
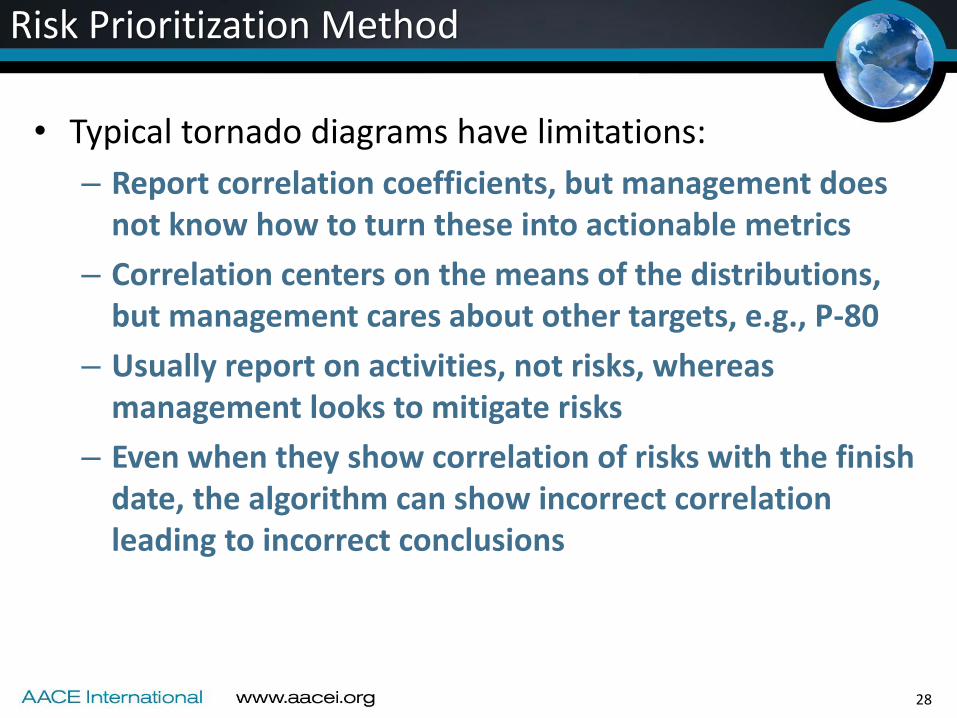
Risk Prioritization Method
• Typical tornado diagrams have limitations:
– Report correlation coefficients, but management does not know how to turn these into actionable metrics
– Correlation centers on the means of the distributions, but management cares about other targets, e.g., P-80
– Usually report on activities, not risks, whereas management looks to mitigate risks
– Even when they show correlation of risks with the finish date, the algorithm can show incorrect correlation leading to incorrect conclusions
28

Preferred Prioritization Method
Iterative Approach to Prioritizing Risks (Days Saved at P-80)
Risk # 1 2 3 4 5 6 7 8
Priority
Level
(Iteration #)
Abusive
Bids
Offshore
design
firm
Suppliers
Busy
Fab
productivity
Geology
unknown
Coordinati
on during
Installatio
n
Problems
at HUC
Resource
s may go
to other
projects
1 X X X X X X X 1
2 X X X 2 X X X
3 X 3 X X X X
4 X X X X 4
5 X 5 X X
6 X X 6
7 7 X
8 8
Iterative prioritization method requires many simulations to
order the risks correctly @ P-80 in Days Saved29

Risk Prioritization Results
30
Note Days Saved @ P-80
Systemic Risks

Risks, Systemic Risks and Uncertainty by Priority
31
UID Name Days Saved @ P-8010 The project may use significant new technology 221
8The organization has other priority projects so personnel and funding may be unavailable
102
9 The approach to the project is not well defined 7411 Megaproject may have excessive schedule pressure 35
2Engineering may be complicated by using offshore design firm
20
4Fabrication yards may experience lower Productivity than planned
16
3 Suppliers of installed equipment may be busy 21
7Fabrication and installation problems may be revealed during HUC
5
1 Bids may be Abusive leading to delayed approval 26 Installation may be delayed due to coordination problems 2
5The subsea geological conditions may be different than expected
0
Days saved by project-specific and systemic risks 498
Days contributed by uncertainty 187
Days contributed from risk combined with uncertainty 15
Total Days Contingency @ P-80 700

RISK MITIGATION
32

The 3 Questions of Risk Mitigation
• To mitigate risk we must answer 3 key questions:– What should we do?
– When must we do it?
– Who must act?
• Mitigation needs to go beyond a strategy
• The more specific the risk and the more tactical the mitigation, the more likely it is to be implemented
• The paper identifies the availability of labor in closed markets like Australia as a systemic risk and answering the 3 questions for this risk and it’s mitigations is insightful
33

What will we do to solve the problem?
• For the labor availability risk, we took the following major actions to mitigate the risk:
– Modularized significant parts of the facility to remove work hours from the site in Australia
– Awarded the LNG tank contract to a separate contractor with their own dedicated labor and supervision
– Cost sharing provisions with EPC contractor to pay more to attract labor if we had to
– Planned to pursue “block visas” for labor
34
When must we act?
• Using the Risk & Mitigation Timeline for the risk and each major mitigation focuses attention on when the risk occurs and when the solution must be in place in order to be effective
35

2009 2010 2011 2012 2013 2014 2015 2016
Q1 Q2 Q3 Q4 Q1 Q2 Q3 Q4 Q1 Q2 Q3 Q4 Q1 Q2 Q3 Q4 Q1 Q2 Q3 Q4 Q1 Q2 Q3 Q4 Q1 Q2 Q3 Q4 Q1 Q2 Q3 Q4
When – Modularization Strategy
Potential Labor Availability Issues Here
Site Selected / Layout Begins
EIS Lodged
Bechtel InksUnion Deal
Contract Signed & Project Sanction
Train 1 RFSU
Train 2 RFSU
Mod Strategy
EIS Approved
Site Work starts May 2011
36

When – LNG Tank Award
2009 2010 2011 2012 2013 2014 2015 2016
Q1 Q2 Q3 Q4 Q1 Q2 Q3 Q4 Q1 Q2 Q3 Q4 Q1 Q2 Q3 Q4 Q1 Q2 Q3 Q4 Q1 Q2 Q3 Q4 Q1 Q2 Q3 Q4 Q1 Q2 Q3 Q4
Potential Labor Availability Issues Here
Site Selected / Layout Begins
EIS Approved
Site Work starts May 2011
EIS Lodged
Bechtel InksUnion Deal
Contract Signed & Project Sanction
Train 1 RFSU
Train 2 RFSU
LNG Tanks
37

When – Cost Sharing Provision in EPC Contract
2009 2010 2011 2012 2013 2014 2015 2016
Q1 Q2 Q3 Q4 Q1 Q2 Q3 Q4 Q1 Q2 Q3 Q4 Q1 Q2 Q3 Q4 Q1 Q2 Q3 Q4 Q1 Q2 Q3 Q4 Q1 Q2 Q3 Q4 Q1 Q2 Q3 Q4
Potential Labor Availability Issues Here
Site Selected / Layout Begins
EIS Approved
Site Work starts May 2011
EIS Lodged
Bechtel InksUnion Deal
Contract Signed & Project Sanction
Train 1 RFSU
Train 2 RFSU
Compensation
38

When – Block Visas
2009 2010 2011 2012 2013 2014 2015 2016
Q1 Q2 Q3 Q4 Q1 Q2 Q3 Q4 Q1 Q2 Q3 Q4 Q1 Q2 Q3 Q4 Q1 Q2 Q3 Q4 Q1 Q2 Q3 Q4 Q1 Q2 Q3 Q4 Q1 Q2 Q3 Q4
Potential Labor Availability Issues Here
Site Selected / Layout Begins
EIS Approved
Site Work starts May 2011
EIS Lodged
Bechtel InksUnion Deal
Contract Signed & Project Sanction
Train 1 RFSU
Train 2 RFSU
Block Visa
39
Who Must Act?
• Who really “owns” the action for the mitigation? The paper discusses the tiered ownership of risk mitigation:
– Mitigation can be implemented wholly by the project team
– It can be implemented by a broader group of stakeholders
– Or it must be implemented by a party that is external and separate from the interests of the project
• Understanding the tiers provides insight into the likely degree of success in implementing the mitigation
40
Who Must Act? – Modularization and LNG tanks
• The project team was able to make the determination to implement the modularization of parts of the facility and this mitigation was successfully implemented though the impact was difficult to assess
• The project team decided to separate the LNG tanks from the main EPC contract, the mitigation was successfully implemented and the tanks were completed on time
41
Who Must Act? – Cost Sharing and Block Visas
• The cost sharing provisions for paying more for labor were included in the EPC contract, however, implementation required the owner, EPC contractor, and labor unions to align. The provision was never exercised.
• Block visas (457 visa program) are written into the laws in Australia, so in theory, project willingness to exercise that mitigation should have been an available mitigation. In practice, this requires agreement from labor unions and legislative bodies and these impediments prevented this mitigation from ever being seriously pursued.
42

Successful Mitigation
• Answer the what, when and who of mitigation
• Develop the Risk & Mitigation Timelines for major risks and mitigations
• Segregate the mitigations into tiers of ownership
• Assess alignment of risk mitigation owners with the projects goals
• Do not count on success when the mitigation owners are truly external to the project
• Reassess periodically or at pre-defined trigger points
43

References (1)
1. Hollmann, John K. 2012, “RISK.1026 Estimating Accuracy: Dealing with Reality” 2012 AACE International Transactions AACE International, Morgantown, WV
2. Ogilvie, Alexander, Robert A. Brown, Jr., Fredrick P. Biery and Paul Barshop, “Quantifying Estimate Accuracy for the Process industries, A Review of Industry Data,” 2012 Cost Engineering Journal, AACE International, Nov/Dec 2012
3. AACE International, Recommended Practice No. 57R-09, “Integrated Cost and Schedule Risk Analysis Using Monte Carlo Simulation of a CPM Model” May 26, 2011
44

References (2)
4. Six-sigma definition of common cause, http://www.isixsigma.com/dictionary/common-cause-variation/
5. Six-sigma definition of special cause. http://www.isixsigma.com/dictionary/variation-special-cause/
6. Merrow, Edward W., Industrial Megaprojects, Concepts, Strategies and Practices for Success, 2011, Wiley
7. Quotations from Secretary of Defense Donald Rumsfeld on “unknown unknowns” http://en.wikipedia.org/wiki/There_are_known_knowns
45

QUESTIONS/COMMENTS?(PLEASE USE MICROPHONE)
46