Embed Size (px)
Citation preview

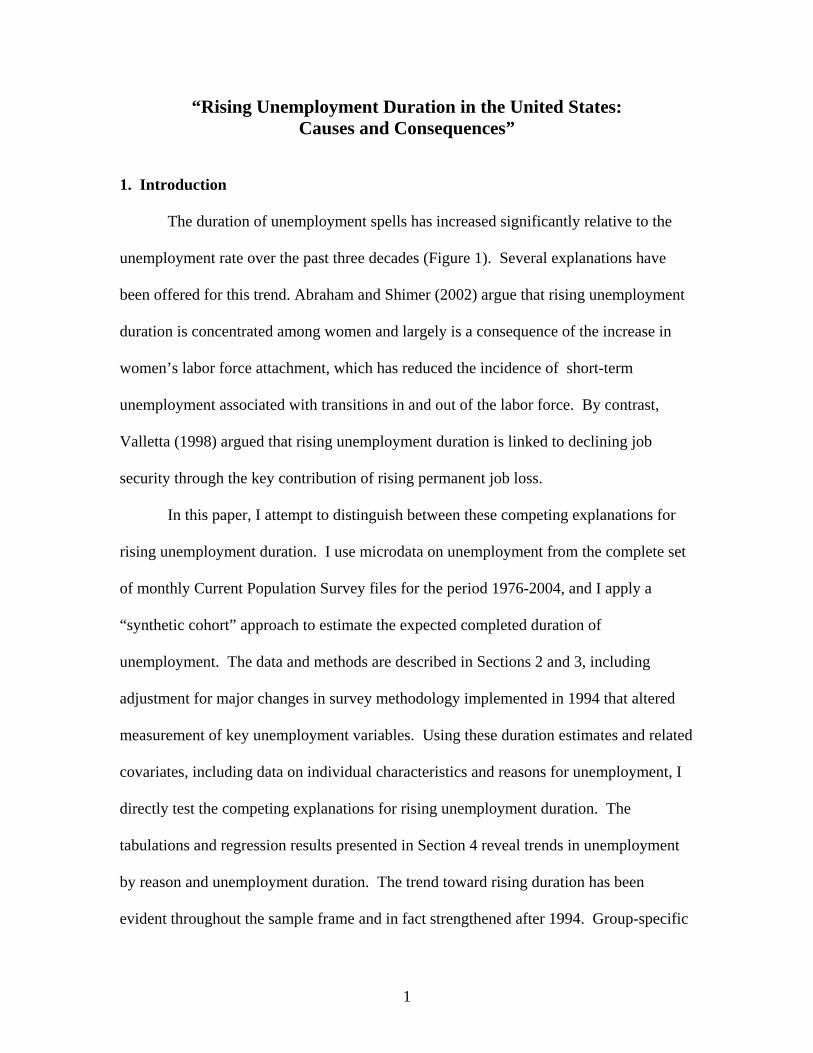
“Rising Unemployment Duration in the United States: Causes and Consequences”
Robert G. Valletta* Federal Reserve Bank of San Francisco
101 Market Street San Francisco, CA 94105-1579 USA
Phone: (415) 974-3345 Fax: (415) 977-4084
email: [email protected]
May 2005
ABSTRACT Since the mid-1970s, the duration of a typical unemployment spell in the United States has increased substantially relative to the unemployment rate. Using microdata on unemployment from the complete set of monthly Current Population Survey files for the period 1976-2004, I investigate the causes and consequences of rising unemployment duration. The duration of completed unemployment spells is formed using the synthetic cohort approach, and the data are adjusted for major changes in survey design that occurred in 1994. The empirical analysis focuses on two primary explanations for rising unemployment duration: changes in women’s labor force attachment (Abraham and Shimer 2002) and changes in the incidence and duration of permanent job loss that relate to declining job security (Valletta 1999). The results provide support for both explanations, although the link to changing labor force attachment for women is less clear than the link to permanent job loss. These results bolster recent findings (Campbell and Duca 2004) suggesting that rising unemployment duration has lowered the aggregate unemployment rate that is consistent with stable wage and price inflation (the “NAIRU”). * I thank Jaclyn Hodges and Geoffrey MacDonald for outstanding research assistance. The views expressed in this paper are those of the author and should not be attributed to the Federal Reserve Bank of San Francisco or the Federal Reserve System.
1
“Rising Unemployment Duration in the United States: Causes and Consequences”
1. Introduction
The duration of unemployment spells has increased significantly relative to the
unemployment rate over the past three decades (Figure 1). Several explanations have
been offered for this trend. Abraham and Shimer (2002) argue that rising unemployment
duration is concentrated among women and largely is a consequence of the increase in
women’s labor force attachment, which has reduced the incidence of short-term
unemployment associated with transitions in and out of the labor force. By contrast,
Valletta (1998) argued that rising unemployment duration is linked to declining job
security through the key contribution of rising permanent job loss.
In this paper, I attempt to distinguish between these competing explanations for
rising unemployment duration. I use microdata on unemployment from the complete set
of monthly Current Population Survey files for the period 1976-2004, and I apply a
“synthetic cohort” approach to estimate the expected completed duration of
unemployment. The data and methods are described in Sections 2 and 3, including
adjustment for major changes in survey methodology implemented in 1994 that altered
measurement of key unemployment variables. Using these duration estimates and related
covariates, including data on individual characteristics and reasons for unemployment, I
directly test the competing explanations for rising unemployment duration. The
tabulations and regression results presented in Section 4 reveal trends in unemployment
by reason and unemployment duration. The trend toward rising duration has been
evident throughout the sample frame and in fact strengthened after 1994. Group-specific

2
regressions and formal decompositions uncover little or no direct support for the
explanation based on women’s labor force attachment, although evidence is uncovered
suggesting that rising duration for labor force entrants has made an important
contribution to the overall increase. Support for the job loss explanation is stronger, with
the results largely confirming earlier findings of the key contribution of rising incidence
and duration of permanent job loss to rising unemployment duration in the United States.
These findings are of interest for several reasons. Rising unemployment duration
(at a given unemployment rate) is likely to have adverse implications for social welfare,
by increasing the burden of uninsurable labor-income risk on workers (Abraham and
Shimer 2002). Moreover, explaining the source of rising unemployment duration may
have important implications for aggregate dynamics and monetary policy. Rising
duration can raise or lower the wage pressures associated with a given unemployment
rate, thereby altering the natural or “non-accelerating inflation rate” of unemployment
(NAIRU). In the concluding section of the paper, these implications are discussed in
light of the paper’s specific findings.
2. CPS Unemployment Data
The data used in this study are constructed from the complete set of monthly
survey records from the U.S. Current Population Survey for the period January 1976
through December 2004 (data files obtained from Unicon Research Corporation).
Observations were pulled for all individuals identified as unemployed in the survey. The
analyses in this draft were restricted to individuals age 16 to 64, with alternative sample
3
restrictions imposed as described below. All tabulations were weighted by the sample
survey weights to render them representative of the broader U.S. population.
The key analysis variables are the individual duration of unemployment and
reasons for unemployment, along with identifiers for selected individual characteristics
(sex, age, and education). Unemployment duration is measured as the duration of in-
progress spells at the time of the survey. This variable is used to form estimates of
expected completed duration for an individual entering unemployment in a particular
month, as described in the next section. The reasons for unemployment identified in the
survey fall into five categories: job losers, for whom the survey distinguishes between
those on temporary layoff (i.e., those expecting recall to the firm from which they were
laid off) and permanent job losers (permanent layoffs, firings, or completion of temporary
jobs); voluntary job leavers; re-entrants to the labor force; and new entrants to the labor
force.
The U.S. Bureau of Labor Statistics (BLS) has published monthly figures on
unemployment duration since 1948 and monthly figures on unemployment by reason
since 1967. Although the analyses in this manuscript are limited by data availability
(Unicon CPS files and unemployment by reason) to years beginning in 1976, this not a
significant constraint, as past research (Valletta 1998) found that the upward trend in
duration was most pronounced beginning in the mid- to late-1970s.
Figure 2 displays several measures of unemployment duration that are published
by the BLS. No clear trend is evident in the average spell duration, as the peaks and
troughs in this series have been quite similar over the last three U.S. business cycles. On
the other hand, because the unemployment rate has trended downward over the sample

4
period (look ahead to Figure 3 for this series), average duration has been increasing
relative to the unemployment rate Moreover, average duration has remained high farther
into the last two recoveries than it did in the aftermath of the more severe 1982-1983
recession (consistent with descriptions of the two recent episodes as “jobless
recoveries”). The share of short-term unemployment in total unemployment
(unemployed <5 weeks) exhibits a slight downward trend. The share of very long-term
unemployment (at least 6 months) has been relatively flat. Like the average duration
measure, however, the decline in the overall unemployment rate over the past three
decades implies that long-term unemployment has become more significant at a given
unemployment rate. More precise measurement of the cyclical and trend properties of
unemployment duration can be obtained through the estimation of expected completed
duration, as described in the next section.
An important issue for these data is the impact of major redesign of the basic
monthly CPS survey beginning with the January 1994 survey. Using data from a parallel
survey administered in 1992-1993, Polivka and Miller (1998) found that the new survey
design generated a trend break in the measured duration of unemployment, increasing it
relative to its measurement using the earlier survey design, and also altered the
calculation of unemployment shares by reason. I use Polivka and Miller’s adjustment
factors to yield consistent time-series estimates of unemployment duration and
unemployment by reason for estimation purposes (see the Appendix for additional

5
details).1 These adjustments necessarily are imprecise and do not guarantee elimination
of survey redesign effects on the estimated trends. However, sub-sample results
discussed in section 4 indicate that main trends identified in this paper also are evident
when the analysis is stratified using the pre- and post-redesign periods, which suggests
little or no influence of the redesign on my key results.
3. Completed Duration Estimates from Grouped Data
The CPS data described in the previous subsection provide information on the
length of existing unemployment spells up to the date of the survey. The average
duration measure formed from these data (and published by the BLS) will not in general
correspond to the expected duration of a completed spell for a new entrant to
unemployment, particularly under changing labor market conditions such as rising
unemployment (i.e., “nonsteady state” conditions). The general nonsteady-state approach
to estimating expected completed duration using grouped duration data is a “synthetic
cohort” approach (see Kaitz 1970, Perry 1972, Sider 1985, Baker 1992a).2 This approach
relies on the estimation of monthly continuation rates—i.e., the probabilities that an
unemployment spell will continue from one month to the next. These rates in general
will vary over the length of a spell due to individual heterogeneity or underlying duration
1 Abraham and Shimer (2002) argue that estimated rates of long-term unemployment (15 weeks or more) were largely unaffected by the survey redesign. Rather than adjusting duration estimates, they restrict their analyses to the CPS “incoming rotation groups”, whose reported durations are unaffected by the introduction of dependent interviewing in the redesigned survey. Because I adjust the pre-1994 duration estimates upward based on Polivka and Miller’s (1998) results, my estimates of the upward trend in duration are conservative relative to Abraham and Shimer. 2 This is a “synthetic cohort” approach in that with a rotating monthly sample such as the CPS, the estimate of unemployment continuation probabilities is formed by comparing different groups over time, rather than by following the same individuals through time.

6
dependence, and they also will vary from month to month as economic conditions
change.
My application of the synthetic cohort approach to obtain nonparametric estimates
of expected completed duration from grouped duration data follows M. Baker (1992a);
see G. Baker and Trivedi (1985) for a more general overview. We begin with
continuation probabilities, defined as the conditional probability that individuals whose
unemployment spell has lasted (j-1) months at time (t-1) will remain unemployed into the
next period:
( , )( )( 1, 1)j
n j tf tn j t
=− −
(1)
where n(.) represents the sampled number of individuals unemployed for a given number
of months at the time of a particular monthly survey. In a rotating sample survey such as
the CPS, the sample used to calculate the numerator and denominator differs, but under
the assumption that each monthly sample represents the target U.S. population (as the
CPS is constructed), this expression provides an estimate of the continuation probability
for a fixed representative cohort.
The product of the continuation probabilities represent the empirical survivor
function, or the proportion of individuals entering unemployment at time (t-j) who remain
unemployed at time t:
0 1 2 3( ) ( ) ( ) ( ) ( )... ( )j jG t f t f t f t f t f t= (2)

7
In this expression, f0(t) is the continuation probability for the entering cohort, which is
defined identically as one. Assuming that the duration intervals are not all identical (e.g.,
not all one month), the expected completed duration in a particular month t, D(t), is
estimated as:
11
( ) 1 ( )*( )j
m
j j jj
D t G T T T −=
= + −∑ (3)
where the T’s represent duration intervals (measured in units of the monthly sampling
window) and Tm is the maximum duration measured or used.
Empirical implementation requires setting the width and number of duration
intervals used for estimation. I follow Baker (1992a) in using 6 unequally spaced
duration intervals and corresponding continuation probabilities:
f1(t): 5-8 weeks in month t to <5 weeks in (t-1) f2(t): 9-12 weeks in month t to 5-8 weeks in (t-1) f3(t): 13-16 weeks in month t to 9-12 weeks in (t-1) f4(t): 27-39 weeks in month t to 13-26 weeks in (t-3) f5(t): 53-78 weeks in month t to 27-52 weeks in (t-6) f6(t): 100+ weeks in month t to 53-99 weeks in (t-12)
Note the variation in duration intervals for f4(t)-f6(t), which must be incorporated into the
duration estimate based on equation (3). Then the expected completed duration is formed
as:
1 2 1 3 2 1 4 3 2 1 5 4 3 2 1 6 5 4 3 2 1( ) 1 3 6 12D t f f f f f f f f f f f f f f f f f f f f f= + + + + + + (4)

8
where the time identifier (t) has been suppressed on the right-hand side of (4) for
simplicity. D(t) is defined as the expected duration of unemployment (in months) for a
cohort that enters unemployment at t and faces current economic conditions throughout
the unemployment spells of cohort members.3 In the empirical work, I estimate expected
completed duration for the full sample and for various groups (demographic groups and
by reason for unemployment); estimation by group proceeds by first restricting the
unemployment sample to the specified group, than estimating expected completed
duration as described above.4
One additional estimation issue is “digit preference”—the tendency for
respondents to report durations as integer multiples of one month or half-years (i.e.,
multiples of 4 or 26). Following previous analysts, I adjust for digit preference by
allocating a fixed share (50 percent) of bunched observations to the next monthly interval
(see the Appendix for additional details, along with a discussion of changing top-coding
for the CPS duration variable). Baker (1992b) reports that although estimates of expected
completed duration are sensitive to the allocation rule, cyclical elasticity regression
results are not.
3 To relax the assumption that current economic conditions continue throughout cohort members’ spells, Corak and Heisz (1996) propose and estimate a forward-looking nonsteady-state estimator, which reflects the evolution of continuation probabilities into the future for individuals entering unemployment in the current month. They find that their estimator has desirable properties relative to the standard backward-looking nonsteady-state estimator. 4 The large sample size afforded by use of the complete set of monthly CPS records offers an advantage relative to the outgoing rotation group sample used by Baker (1992a), by enabling more reliable estimation of group-specific unemployment durations.

9
4. Results
Tabulations of Unemployment by Reason and Expected Duration
This sub-section displays and discusses the basic patterns in unemployment by
reason and estimated expected duration (yearly averages of monthly values for each
series).
Figure 3 shows the unemployment rate and the shares of layoffs and permanent
job loss in total unemployment incidence, each expressed in percentage points, for the
period 1977-2004.5 Job losers on average account for about 42 percent of the newly
unemployed, with permanent job losses outnumbering layoffs. The two series exhibit
only limited cyclicality. Layoff incidence increased in 1994 and 1995 and has remained
high; this is somewhat surprising, given declining shares of manufacturing employment
and that sector’s relative emphasis on temporary layoffs. Moreover, an upward trend is
evident for permanent job loss.
Figure 4 displays unemployment incidence shares for voluntary job leavers (quits)
and labor force entrants. Job leaving constitutes a relatively small share of
unemployment incidence—12.5 percent on average—but the series exhibits a pronounced
procyclical pattern. Re-entrant unemployment is frequent, although it exhibits a
pronounced downward trend, while new entrants have constituted a small and relatively
consistent share of unemployment incidence.
Figure 5 displays estimates of expected completed duration of unemployment, for
all unemployed and by job loss category.6 Each of these expected duration series exhibits
5 Incidence shares are measured as the share of a group in the pool of individuals identified as unemployed for less than five weeks. 6 Following past practice (e.g., Sider 1985), I multiplied estimates of expected duration in months by 4.3 to obtain expected duration in weeks for the charts.

10
noticeable counter-cyclicality. Permanent job losers on average endure long spells of
unemployment; during the period 1976-2004, the expected duration of unemployment
was 17 weeks for permanent job losers and 12 weeks for all unemployed individuals.
Figure 6 shows expected completed duration for all unemployed, quits, and labor
force entrants.7 Individuals unemployed for each of these reasons on average experience
durations around 10 weeks on average, slightly below the overall average, and all appear
to exhibit counter-cyclicality.
The patterns in Figures 3-6 can be summarized as follows. An upward trend in
permanent job loss is evident, with these individuals experiencing relatively long
unemployment spells on average. In addition, unemployment durations by reason each
exhibit substantial counter-cyclicality and have remained high since the 2001 recession
(with the exception of unemployment durations for individuals on temporary layoff).
These results suggest that the trend toward rising unemployment durations has been
uniform by reason for unemployment, although it may also relate to the rising share and
high durations for permanent job losers.
Regression Estimates of Cyclical and Trend Patterns
I use the regression framework of Sider (1985) and Baker (1992a) to estimate the
degree of rising unemployment duration and assess its sources. In this framework, the
monthly estimates of expected completed duration described above (corrected for the
1994 survey change) are regressed on the contemporaneous unemployment rate (not
7 I merged the re-entrant and new entrant duration series together (weighted by relative incidence), because they are nearly identical over my sample frame (including an upward jump between 1993 and 1994, which does not appear due to survey redesign).

11
seasonally adjusted), three season dummies, and a linear time trend; unemployment
duration and the unemployment rate are measured in natural logs.
The results for the full sample (all unemployed individuals age 16-64) are listed in
Table 1. The first row shows that expected duration exhibits substantial cyclicality; the
estimated elasticity with respect to the unemployment rate is about 0.7. Moreover, a
strong upward trend is evident in the expected duration conditional on the unemployment
rate (as suggested by Figure 1 earlier). This trend estimate implies that unemployment
duration rose by about 35 percent between 1976 and 2004.8
The second through fourth rows of Table 1 list results for alternative time periods.
The results in row two, which correspond to Baker’s (1992a) sample period, largely
replicate those earlier results, and they indicate that a small negative and statistically
insignificant time trend. By contrast, the subsequent two rows for the longer sub-periods
that eliminate any influence of the 1994 CPS survey redesign again reveal significant
upward time trends in expected duration. This slope of this upward trend approximately
doubled after 1993, consistent with the persistently high unemployment durations since
2001 that were depicted in Figure 5 and 6. The steeper time trend after 1994 constitutes
evidence against an explanation for rising duration based on women’s labor force
attachment, because the convergence of women’s and men’s labor market attachment and
experiences over the past few decades should largely eliminate the role of rising female
attachment in the recent time period (Abraham and Shimer 2002).
More careful assessment of the sources of rising unemployment duration requires
disaggregating the duration estimates and regressions by demographic group and reason

12
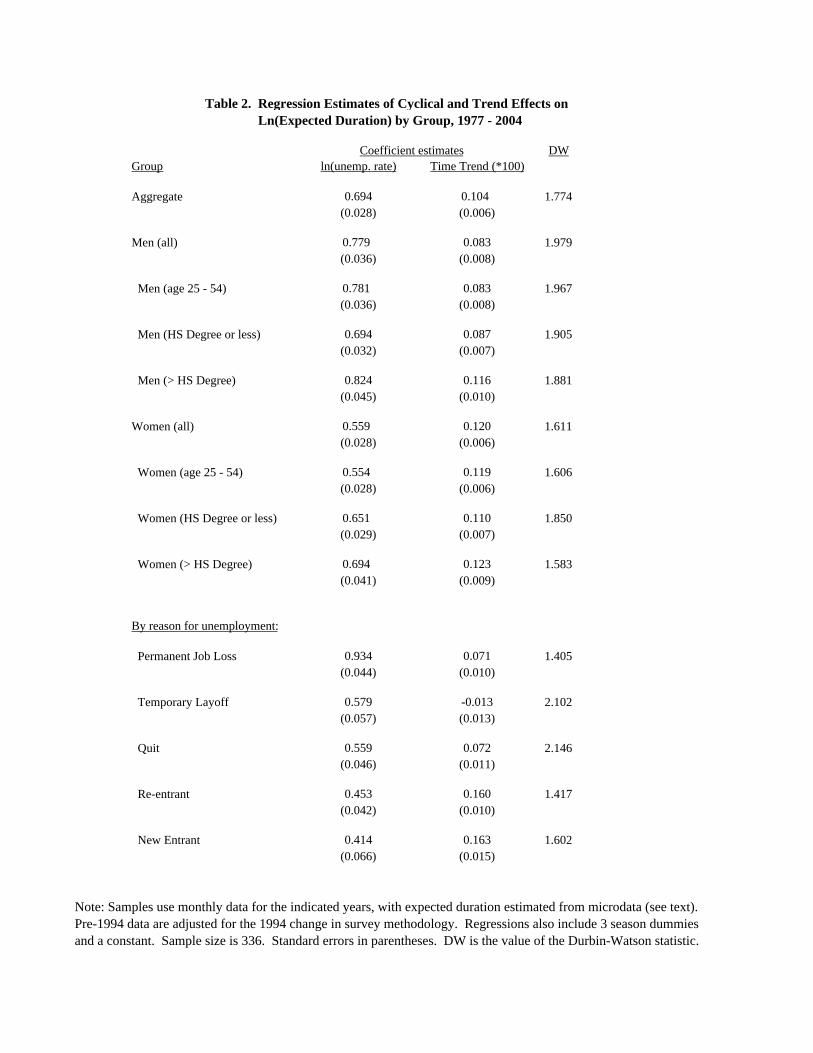
for unemployment. Table 2 lists regression results for these groups, which demonstrate
striking uniformity in the cyclical elasticity estimates and upward trend by sex, age, and
education group. The upward trend is somewhat greater for women than for men, but the
trend for men is large and statistically significant, which argues against an explanation for
rising duration based on changing labor force attachment of women. On the other hand,
the results in the bottom five rows of Table 2 show that the trend increase in expected
duration has been most pronounced for labor market re-entrants and new entrants. The
trend increase in expected duration is smaller but still pronounced for permanent job
losers and voluntary job leavers (quits), but no upward trend in duration is evident for
individuals on temporary layoff.
Understanding the contribution of duration by reason to the increase in overall
duration requires an analysis of changing shares of unemployment incidence by reason.
Table 3 lists regression results for linear probability models of unemployment incidence
shares by reason, otherwise using the same specification as the duration regressions.9
Permanent job losses and layoffs are strongly counter-cyclical; quits to unemployment
and labor market re-entrance are pro-cyclical; and new labor market entrants exhibit a
small and statistically insignificant counter-cyclical response to business cycle
conditions. The results also reveal upward time trends in the incidence shares of
permanent job loss (consistent with results using individual panel data in Valletta 1999)
and temporary layoffs, which are largely offset by a significant downward trend in the
8 The Durbin-Watson (DW) statistics indicate the presence of negative autocorrelation for most of the regression models, implying that the standard error estimates are conservative in most cases (i.e., the associated t tests mostly understate significance levels). 9 Baker (1992a) reports no difference between results based on linear probability and logistic models in this setting, probably because the incidence variables all are sufficiently well-bounded away from zero and one.

13
incidence of re-entrant unemployment. The trend coefficients imply about a 54 percent
increase in the incidence share of permanent job loss and a 50 percent decrease in the
incidence share of re-entrants between 1977 and 2004 (relative to the sample mean
incidence of these two unemployment types).
Decomposition Results
The regression results from the previous section suggest potentially important
links between rising overall unemployment duration and changing incidence and duration
by reason. I perform several decomposition analyses to investigate this link. I first apply
a simplified variant of the decomposition that Baker (1992a) used to test the
heterogeneity hypothesis of cyclical variability in unemployment durations, using
unemployment by reason as my measure of heterogeneity. Expected unemployment
duration across all groups can be expressed as a weighted average of expected duration
by reason, with the weights equal to the shares of unemployment incidence by reason.
This property enables decomposition of unemployment duration across all reasons for
unemployment into two components:
Dpc (“probability constant”) — expected completed duration holding expected
duration for each reason at its sample average, but allowing the shares of
unemployment incidence by reason to change
Dsc (“share constant”) — expected total duration holding the shares of
unemployment incidence by reason equal to their sample averages, but
allowing expected duration by reason to change.
14
Comparison of regressions using the constructed variables Dpc and Dsc with
regressions using the unadjusted duration measure indicates the relative roles of changing
duration by reason and changing shares by reason in the determination of the time-series
properties of total unemployment duration. These results are listed in Panel A of Table 4.
The first row repeats the results for the unadjusted duration measure (row 1 from Tables
1 and 2). The second row lists the results for the probability constant measure Dpc and
the third row lists the results for the share constant measure Dsc. A comparison of the
results in the final two rows indicates that virtually all of the cyclical variability in total
unemployment duration is due to cyclical variability in expected duration by reason
rather than variability in incidence by reason: the coefficient on the unemployment rate
is very small in the Dpc equation, which holds expected duration by reason constant, and
large in the Dsc equation, which holds incidence by reason constant. Essentially all of the
upward time trend also is attributable to rising duration by reason (the time trend
coefficient is very small in the Dpc equation).
The decomposition listed in Panel A of Table 4 groups all reasons for
unemployment together. Recall, however, that the key changes over time have been in
the incidence and duration of unemployment associated with permanent job loss and
labor force entrance. The first row of Panel B lists results from an alternative
decomposition that focuses on permanent job loss. The dependent variable used in the
first row of Panel B is formed by holding the incidence and duration of permanent job
loss constant at their respective sample averages. Comparison of these results with the
results in the first row of Panel A reveals the effect on overall expected duration of rising
incidence and duration of unemployment due to permanent job loss. The substantially
15
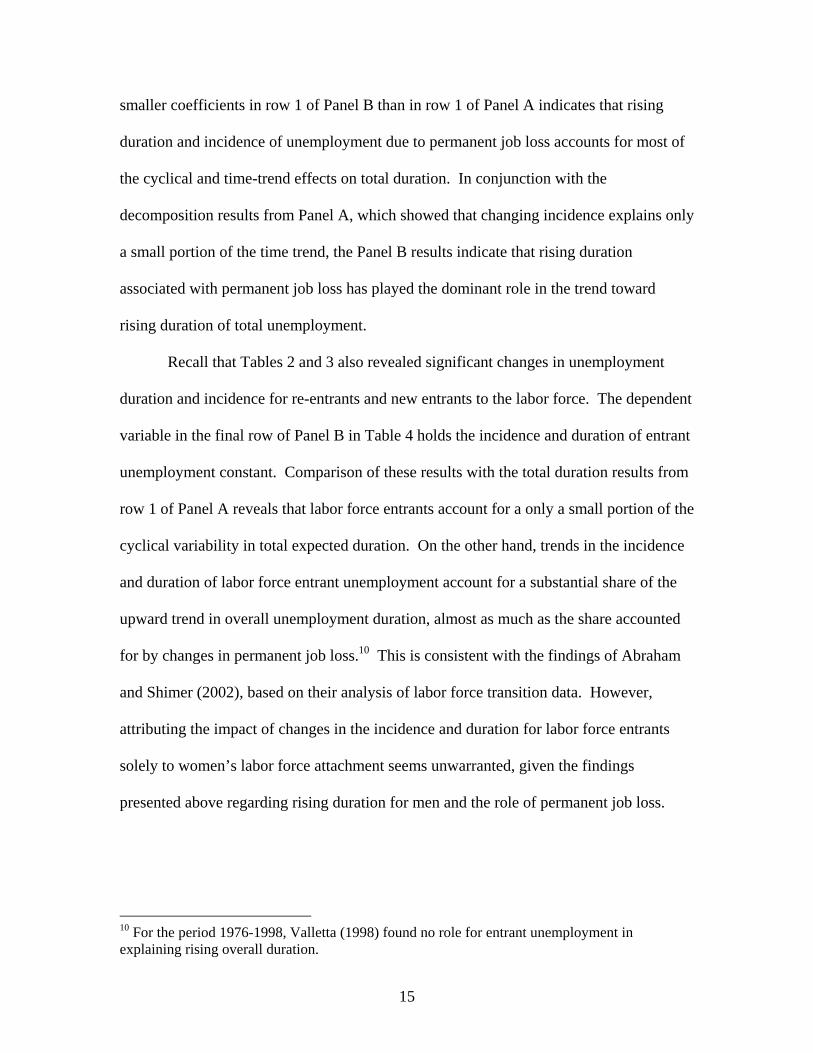
smaller coefficients in row 1 of Panel B than in row 1 of Panel A indicates that rising
duration and incidence of unemployment due to permanent job loss accounts for most of
the cyclical and time-trend effects on total duration. In conjunction with the
decomposition results from Panel A, which showed that changing incidence explains only
a small portion of the time trend, the Panel B results indicate that rising duration
associated with permanent job loss has played the dominant role in the trend toward
rising duration of total unemployment.
Recall that Tables 2 and 3 also revealed significant changes in unemployment
duration and incidence for re-entrants and new entrants to the labor force. The dependent
variable in the final row of Panel B in Table 4 holds the incidence and duration of entrant
unemployment constant. Comparison of these results with the total duration results from
row 1 of Panel A reveals that labor force entrants account for a only a small portion of the
cyclical variability in total expected duration. On the other hand, trends in the incidence
and duration of labor force entrant unemployment account for a substantial share of the
upward trend in overall unemployment duration, almost as much as the share accounted
for by changes in permanent job loss.10 This is consistent with the findings of Abraham
and Shimer (2002), based on their analysis of labor force transition data. However,
attributing the impact of changes in the incidence and duration for labor force entrants
solely to women’s labor force attachment seems unwarranted, given the findings
presented above regarding rising duration for men and the role of permanent job loss.
10 For the period 1976-1998, Valletta (1998) found no role for entrant unemployment in explaining rising overall duration.

16
5. Summary and Discussion
Using a synthetic cohort approach to estimate expected completed unemployment
duration, this paper documents an upward trend in unemployment duration (conditional
on the unemployment rate) over the period 1976-2004. Changes in CPS survey
methodology made little difference for this trend, as the analyses adjust for the survey
redesign. Indeed, it is striking to note that results from sub-period analyses—which
eliminate any redesign effects that can be captured by a single level adjustment at the
time of the redesign—show that the upward trend in relative duration accelerated after
1994. Continuation and acceleration of the upward duration trend in recent years
constitutes informal evidence against an explanation for rising duration based on chaning
labor force attachment for women, because the convergence of women’s and men’s labor
market attachment and experiences over the past few decades should largely eliminate the
role of rising female attachment in the recent time period.
Additional analyses tested explanations for rising duration based on changing
labor force attachment by women (Abraham and Shimer 2002) and changes in the
structure of unemployment that are consistent with declining job security (Valletta 1998,
1999). The results suggest an important role of rising duration for permanent job losers,
consistent with the link to declining job security. On the other hand, the regression and
decomposition evidence presented suggests that rising unemployment duration for labor
force entrants also explains a substantial portion of the increase in overall duration. Thus,
while it may be premature to attribute rising unemployment duration to rising labor force
attachment by women, changes in entrant behavior for both sexes appear to be important.
Future versions of this paper will attempt to pin down the roles of job loss and entrant

17
unemployment more precisely, using more comprehensive decompositions of changing
unemployment incidence and duration. Other planned methodological expansions
include more careful treatment of the sampling properties of estimated completed
duration and regression models of its determinants.
Pinning down the sources of rising unemployment duration may have important
implications for aggregate dynamics and monetary policy. Rising duration can raise or
lower the wage pressures associated with a given unemployment rate, thereby altering the
natural or “non-accelerating inflation rate” of unemployment (NAIRU). Abraham and
Shimer (2002) argued that the long-term unemployed may put less downward pressure on
wages than do the short-term unemployed, through hysteresis effects on the employment
prospects of the long-term unemployed. By contrast, Robert Solow (1970) argued that
“People who have been unemployed a long time put more downward pressure on wages
because they are more willing to undercut going wage rates in order to get a job.” The
theory and empirical findings in Campbell and Duca (2004) are consistent with Solow’s
view: they find that rising unemployment duration (and associated job insecurity) can
account for a significant estimated reduction in the NAIRU during the 1990s. My
findings regarding the important role of permanent job loss in the determination of rising
duration reinforces Campbell and Duca’s findings regarding the decline in the NAIRU.
18
Appendix: Data Adjustments
The text referred to several changes in CPS survey design and various data
handling issues that affect measurement of unemployment by reason and duration over
time.
Adjustments for the 1994 CPS Survey Redesign
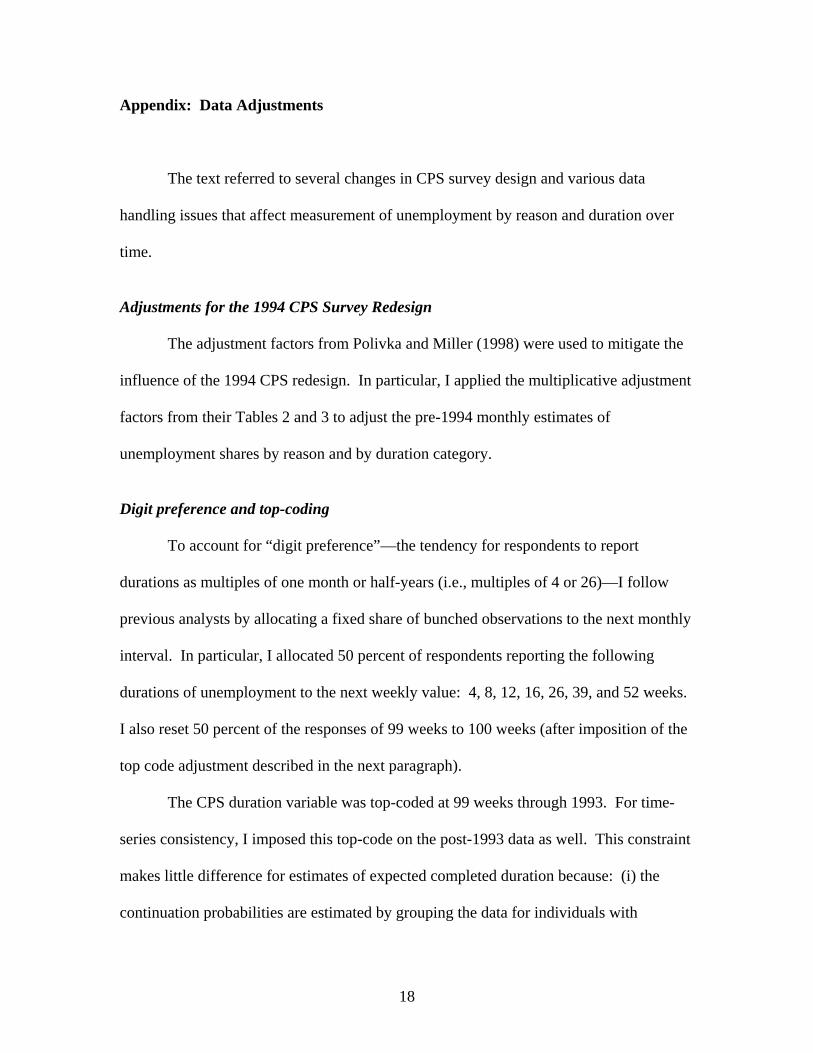
The adjustment factors from Polivka and Miller (1998) were used to mitigate the
influence of the 1994 CPS redesign. In particular, I applied the multiplicative adjustment
factors from their Tables 2 and 3 to adjust the pre-1994 monthly estimates of
unemployment shares by reason and by duration category.
Digit preference and top-coding
To account for “digit preference”—the tendency for respondents to report
durations as multiples of one month or half-years (i.e., multiples of 4 or 26)—I follow
previous analysts by allocating a fixed share of bunched observations to the next monthly
interval. In particular, I allocated 50 percent of respondents reporting the following
durations of unemployment to the next weekly value: 4, 8, 12, 16, 26, 39, and 52 weeks.
I also reset 50 percent of the responses of 99 weeks to 100 weeks (after imposition of the
top code adjustment described in the next paragraph).
The CPS duration variable was top-coded at 99 weeks through 1993. For time-
series consistency, I imposed this top-code on the post-1993 data as well. This constraint
makes little difference for estimates of expected completed duration because: (i) the
continuation probabilities are estimated by grouping the data for individuals with

19
durations longer than 99 weeks (see Section 3 in the text); (ii) only a small number of
observations (2-4%) are recorded as unemployed longer than 99 weeks after 1993, with
durations recorded up to 118 weeks.

20
References
Abraham, Katharine, and Robert Shimer. 2002. “Changes in Unemployment Duration and Labor Force Attachment.” In The Roaring Nineties, edited by Alan Krueger and Robert Solow. New York: Russell Sage Foundation.
Baker, Michael. 1992a. “Unemployment Duration: Compositional Effects and Cyclical
Variability.” American Economic Review 82(1): 313-321. Baker, Michael. 1992b. “Digit Preference in CPS Unemployment Data.” Economics
Letters 39 (1, May): 117-121. Baker, G.M., and P.K. Trivedi. 1985. “Estimation of Unemployment Duration from
Grouped Data: A Comparative Study.” Journal of Labor Economics 3(2): 153-174.
Campbell, Carl M., and John V. Duca. 2004. “The Impact of Evolving Labor Practices
and Demographics on Inflation and Unemployment.” Manuscript, Federal Reserve Bank of Dalla, June.
Corak, Miles, and Andrew Heisz. 1996. “Alternative Measures of the Average Duration
of Unemployment.” The Review of Income and Wealth 42(1, March), pp. 63-74. Kaitz, Hyman B. 1970. “Analyzing the length of spells of unemployment.” Monthly
Labor Review 93 (Nov.): 11-20. Perry, George L. 1972. “Unemployment Flows in the U.S. Labor Market.” Brookings
Papers on Economic Activity 3: 245-278. Polivka, Anne, and Stephen Miller. 1998. “The CPS After the Redesign: Refocusing
the Economic Lens.” In Labor Statistics Measurement Issues, edited by John Haltiwanger, Marilyn Manser, and Robert Topel, pp. 249-289. Chicago: University of Chicago Press.
Sider, Hal. 1985. “Unemployment Duration and Incidence: 1968-82.” American
Economic Review 75(3, June): 461-472. Solow, Robert. 1970. Comment on George L. Perry, “Changing Labor Markets and
Inflation.” Brookings Papers on Economic Activity 0(3): 1970, pp. 411-448. Valletta, Robert G. 1998. “Changes in the Structure and Duration of U.S.
Unemployment, 1967-1998.” Federal Reserve Bank of San Francisco Economic Review 3: 29-40.
Valletta, Robert G. 1999. “Declining Job Security.” Journal of Labor Economics 17(4,
part 2): S170-S197.

1.0
1.5
2.0
2.5
3.0
1977 1980 1983 1986 1989 1992 1995 1998 2001 2004
Ratio
Figure 1. Ratio of Expected Completed Unemployment Duration to the Unemployment Rate
Note: Author's calculations from U.S. BLS data (see text section 3 for duration methodology). Vertical bars denote recessions.
Figure 2. Alternative Measures of Unemployment Duration
5
10
15
20
1977 1980 1983 1986 1989 1992 1995 1998 2001 2004
Weeks
0
10
20
30
40
50
60Percent
Note: Published data from the U.S. BLS, based on duration of in-progress spells. Series measured in percent are calculated as the share of all unemployed. Vertical bars denote recessions.
Average Duration (left scale)
Unemployed <5 weeks (right scale)
Unemployed ≥27 weeks (right scale)

0
5
10
15
20
25
30
35
1977 1980 1983 1986 1989 1992 1995 1998 2001 2004
Perc
ent s
hare
of t
otal
inci
denc
e
0
2
4
6
8
10
12
Perc
ent
Permanent Job LossTemporary LayoffsUnemployment Rate (right scale)
Figure 3. Incidence of Involuntary Unemployment
Note: Annual averages of monthly data (author's tabulations of CPS microdata). Pre-1994 figures are adjusted for the 1994 change in survey methodology.
0
5
10
15
20
25
30
35
40
45
50
1977 1980 1983 1986 1989 1992 1995 1998 2001 2004
Perc
ent s
hare
of t
otal
inci
denc
e
0
2
4
6
8
10
12
Perc
ent
QuitsRe-entrantsNew EntrantsUnemployment Rate (right scale)
Note: Annual averages of monthly data (author's tabulations of CPS microdata). Pre-1994 figures are adjusted for the 1994 change in survey methodology.
Figure 4. Incidence of Voluntary Unemployment and Labor Force Entry

Figure 5. Expected Duration of Unemployment: All Unemployed and Job Losers
0
5
10
15
20
25
1977 1980 1983 1986 1989 1992 1995 1998 2001 2004
Weeks
0
2
4
6
8
10
12Percent
Duration (All)Duration (Permanent Job Loss)Duration (Layoff)Unemployment Rate (right scale)
Note: Annual averages of monthly data (author's tabulations of CPS microdata). Pre-1994 figures are adjusted for the 1994 change in survey methodology.
Figure 6. Expected Duration of Unemployment:All Unemployed, Quits, and Labor Force Entrants
0
2
4
6
8
10
12
14
16
18
1977 1980 1983 1986 1989 1992 1995 1998 2001 2004
Weeks
0
2
4
6
8
10
12Percent
Duration (All)Duration (Quits)Duration (Entrants)Unemployment Rate (right scale)
Note: Annual averages of monthly data (author's tabulations of CPS microdata). Pre-1994 figures are adjusted for the 1994 change in survey methodology.

DW NYears ln(unemp. rate) Time Trend (*100)
1977 - 2004 0.694 0.104 1.774 336(0.028) (0.006)
1980 - 1988 0.598 -0.043 1.801 108(0.051) (0.030)
1977 - 1993 0.690 0.075 1.812 204(0.034) (0.010)
1994 - 2004 0.705 0.169 2.045 132(0.050) (0.020)
Coefficient estimates
(Full sample, age 16 - 64)
Note: Samples use monthly data for the indicated years, with expected duration estimated from microdata (see text). Pre-1994 data are adjusted for the 1994 change in survey methodology. Regressions also include 3 season dummies and a constant. Standard errors in parentheses. DW is the value of the Durbin-Watson statistic.
Table 1. Regression Estimates of Cyclical and Trend Effects on Ln(Expected Duration)
DWGroup ln(unemp. rate) Time Trend (*100)
Aggregate 0.694 0.104 1.774(0.028) (0.006)
Men (all) 0.779 0.083 1.979(0.036) (0.008)
Men (age 25 - 54) 0.781 0.083 1.967(0.036) (0.008)
Men (HS Degree or less) 0.694 0.087 1.905(0.032) (0.007)
Men (> HS Degree) 0.824 0.116 1.881(0.045) (0.010)
Women (all) 0.559 0.120 1.611(0.028) (0.006)
Women (age 25 - 54) 0.554 0.119 1.606(0.028) (0.006)
Women (HS Degree or less) 0.651 0.110 1.850(0.029) (0.007)
Women (> HS Degree) 0.694 0.123 1.583(0.041) (0.009)
By reason for unemployment:
Permanent Job Loss 0.934 0.071 1.405(0.044) (0.010)
Temporary Layoff 0.579 -0.013 2.102(0.057) (0.013)
Quit 0.559 0.072 2.146(0.046) (0.011)
Re-entrant 0.453 0.160 1.417(0.042) (0.010)
New Entrant 0.414 0.163 1.602(0.066) (0.015)
Coefficient estimates
Table 2. Regression Estimates of Cyclical and Trend Effects on Ln(Expected Duration) by Group, 1977 - 2004
Note: Samples use monthly data for the indicated years, with expected duration estimated from microdata (see text). Pre-1994 data are adjusted for the 1994 change in survey methodology. Regressions also include 3 season dummies and a constant. Sample size is 336. Standard errors in parentheses. DW is the value of the Durbin-Watson statistic.

Reason for DWUnemployment ln(unemp. rate) Time Trend (*100)
Permanent Job Loss 0.071 0.040 1.655(0.007) (0.002)
Temporary Layoff 0.045 0.025 1.199(0.011) (0.002)
Quit -0.096 -0.006 1.215(0.006) (0.001)
Re-entrant -0.031 -0.055 1.482(0.011) (0.003)
New Entrant 0.010 -0.007 1.666(0.006) (0.001)
Coefficient estimates
Table 3. Regression Estimates of Cyclical and Trend Effects on Unemployment Incidence (entrance shares) by Reason, 1977 - 2004
Note: Samples use monthly data for the indicated years, with unemployment entrance shares estimated from microdata (see text). Pre-1994 data are adjusted for the 1994 change in survey methodology. Regressions also include 3 season dummies and a constant. Sample size is 336. Standard errors in parentheses. DW is the value of the Durbin-Watson statistic.
(Full sample, age 16 - 64)

DWDependent Variable ln(unemp. rate) Time Trend (*100)
ln(D) (unadjusted) 0.694 0.104 1.774(0.028) (0.006)
ln(Dpc) (probability constant) 0.026 0.010 1.646(0.004) (0.001)
ln(Dsc) (share constant) 0.658 0.104 1.693(0.029) (0.007)
DWDependent Variable ln(unemp. rate) Time Trend (*100)
ln(D), perm. job loss constant 0.283 0.025 2.220(0.023) (0.005)
ln(D), entrant constant 0.474 0.035 1.311(0.028) (0.007)
Note: Samples use monthly data for the indicated years, with expected duration estimated from microdata (see text). Pre-1994 data are adjusted for the 1994 change in survey methodology. Regressions also include 3 season dummies and a constant. Sample size is 336. Standard errors in parentheses. DW is the value of the Durbin-Watson statistic.
Table 4. Unemployment Duration Regressions, 1977 - 2004, Adjusted by Reason for Unemployment
Panel B: Incidence and Duration by Reason Held Constant
Coefficient estimates
Panel A: Decomposition (Probability and Share Constant), All Reasons
Coefficient estimates