Embed Size (px)
Citation preview
Rising Premiums:Economic Windfall or
Insurance Industry Meltdown?
The Legend of the Price-Gouging Insurer
Casualty Actuaries of Greater New York New York, NYJune 11, 2003
Robert P. Hartwig, Ph.D., CPCU, Senior Vice President & Chief EconomistInsurance Information Institute 110 William Street New York, NY 10038
Tel: (212) 346-5520 Fax: (212) 732-1916 [email protected] www.iii.org
Presentation Outline• Overview
URBAN LEGENDS OF THE HARD MARKET
• Insurers are Making a Killing
• Commercial Insurance is More Expensive than Ever
• Rate Hikes are to Make Up for 9/11 Losses
• Rate Hikes are Mostly Due to Bad Investments
• There’s No Connection Between Litigiousness & Rates
• Insurers are Drowning in Capital
• Insurers are “Redlining” Businesses post-9/11
• The Terrorism Problem is Fixed
• Investors are Satisfied with P/C Stock Performance
• Q&A
PRICING:Past, Present &
Future
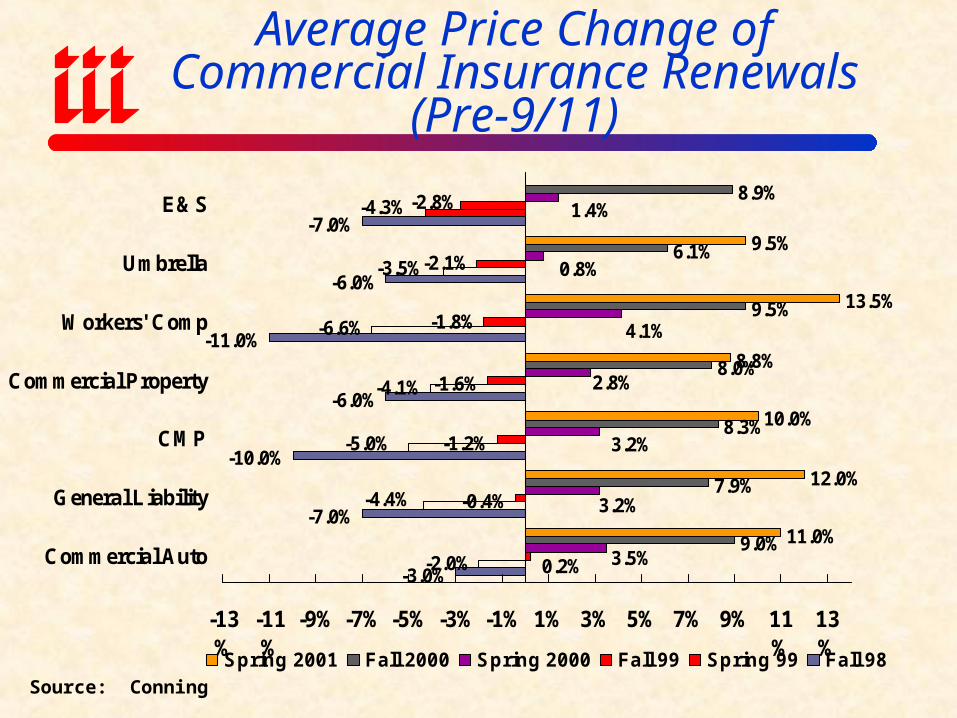
Average Price Change of Commercial Insurance Renewals
(Pre-9/11)
9.5%
13.5%
8.8%
10.0%
12.0%
11.0%
8.9%
6.1%
9.5%
8.0%
8.3%
7.9%
9.0%
-1.6%
-1.2%
-0.4%
-7.0%
-6.0%
-11.0%
-6.0%
-10.0%
-7.0%
-3.0%
1.4%
0.8%
3.5%
3.2%
3.2%
2.8%
4.1%
-2.1%
-2.8%
-1.8%
0.2%
-5.0%
-4.4%
-3.5%
-4.3%
-6.6%
-4.1%
-2.0%
-13%
-11%
-9% -7% -5% -3% -1% 1% 3% 5% 7% 9% 11%
13%
E&S
Umbrella
Workers' Comp
Commercial Property
CMP
General Liability
Commercial Auto
Spring 2001 Fall 2000 Spring 2000 Fall 99 Spring 99 Fall 98Source: Conning
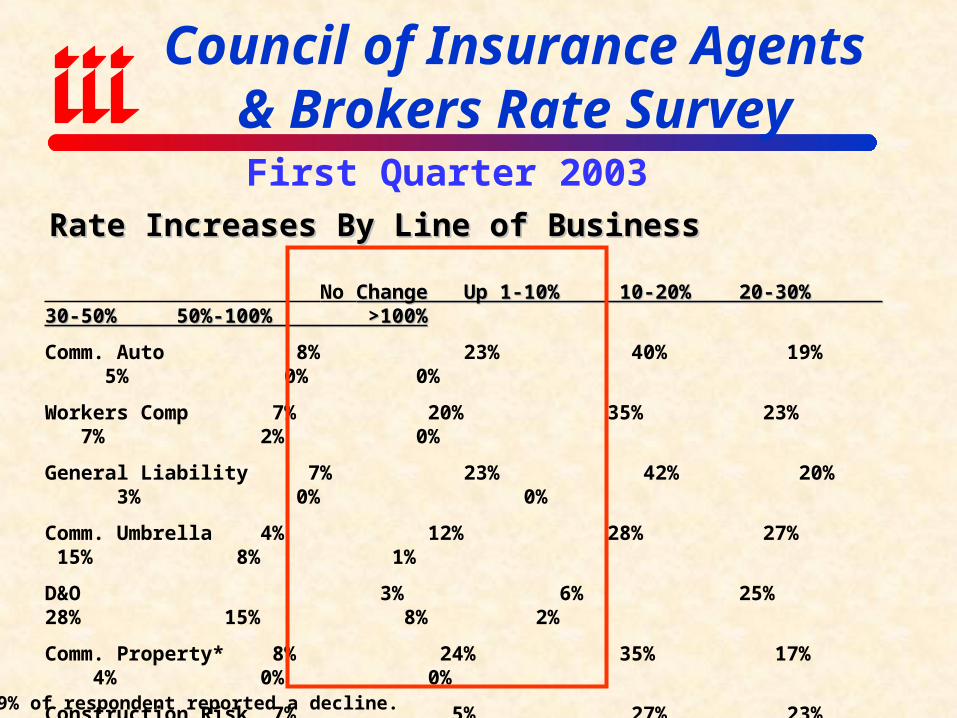
Council of Insurance Agents & Brokers Rate SurveyFirst Quarter 2003
Rate Increases By Line of BusinessRate Increases By Line of Business
No Change Up 1-10% 10-20% 20-30% 30-50% 50%-100% >100%Change Up 1-10% 10-20% 20-30% 30-50% 50%-100% >100%
Comm. Auto 8% 23% 40% 19% 5% 0% 0%
Workers Comp 7% 20% 35% 23% 7% 2% 0%
General Liability 7% 23% 42% 20% 3% 0% 0%
Comm. Umbrella 4% 12% 28% 27% 15% 8% 1%
D&O 3% 6% 25% 28% 15% 8% 2%
Comm. Property* 8% 24% 35% 17% 4% 0% 0%
Construction Risk 7% 5% 27% 23% 16% 3% 0%
Terrorism 13% 17% 19% 10% 2% 1% 1%
Business Interr. 13% 33% 28% 7% 1% 0% 0%
Surety Bonds 9% 14% 19% 10% 4% 0% 2%
Med Mal 2% 2% 5% 8% 18% 14% 8%
*9% of respondent reported a decline.
DEBUNKING URBAN LEGENDS OF THE HARD MARKET
Legend #1: Insurers are Exploiting the Current Hard Market and
Making a Killing
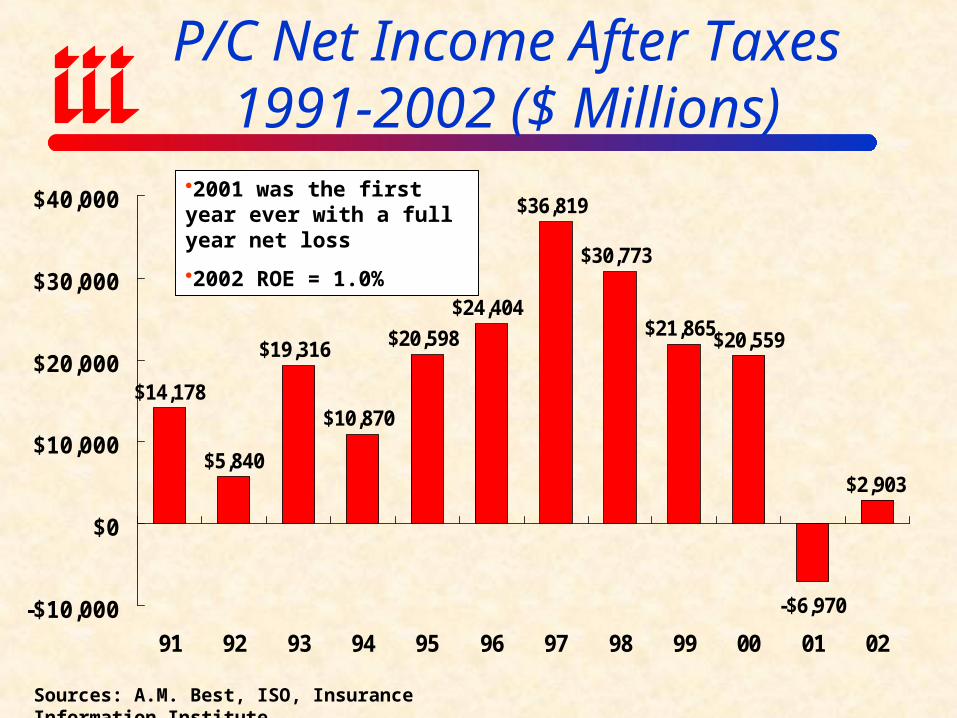
P/C Net Income After Taxes1991-2002 ($ Millions)
$14,178
$5,840
$19,316
$10,870
$20,598
$24,404
$36,819
$30,773
$21,865$20,559
-$6,970
$2,903
-$10,000
$0
$10,000
$20,000
$30,000
$40,000
91 92 93 94 95 96 97 98 99 00 01 02
Sources: A.M. Best, ISO, Insurance Information Institute.
2001 was the first year ever with a full year net loss
2002 ROE = 1.0%
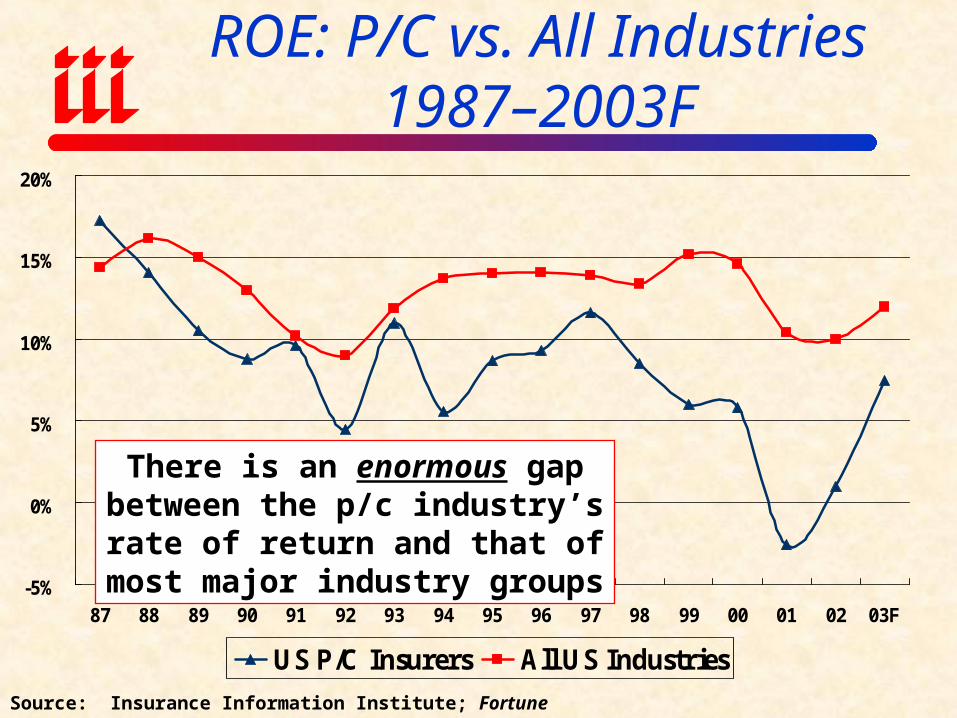
-5%
0%
5%
10%
15%
20%
87 88 89 90 91 92 93 94 95 96 97 98 99 00 01 02 03F
US P/C Insurers All US Industries
ROE: P/C vs. All Industries 1987–2003F
Source: Insurance Information Institute; Fortune
There is an enormous gap between the p/c industry’s rate of return and that of most major industry groups
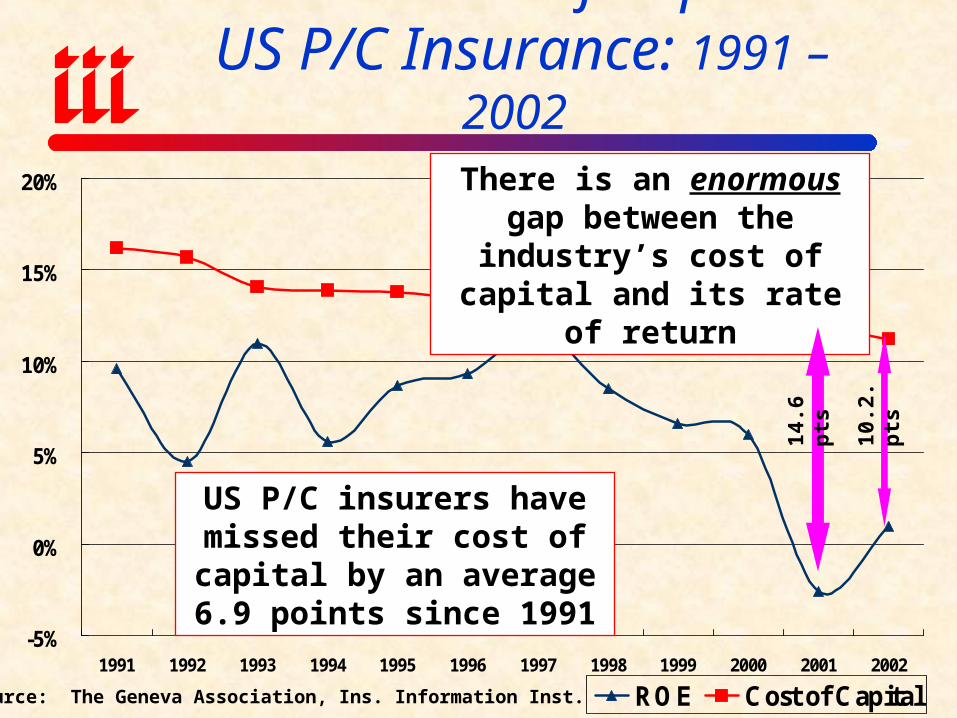
-5%
0%
5%
10%
15%
20%
1991 1992 1993 1994 1995 1996 1997 1998 1999 2000 2001 2002
ROE Cost of Capital
ROE vs. Cost of Capital: US P/C Insurance: 1991 – 2002
Source: The Geneva Association, Ins. Information Inst.
There is an enormous gap between the industry’s cost of capital and its rate of return
14.6
pts
10.2
. pts
US P/C insurers have missed their cost of capital by an
average 6.9 points since 1991
Underexposed: The Economic Cycle
Hurts Exposure Growth
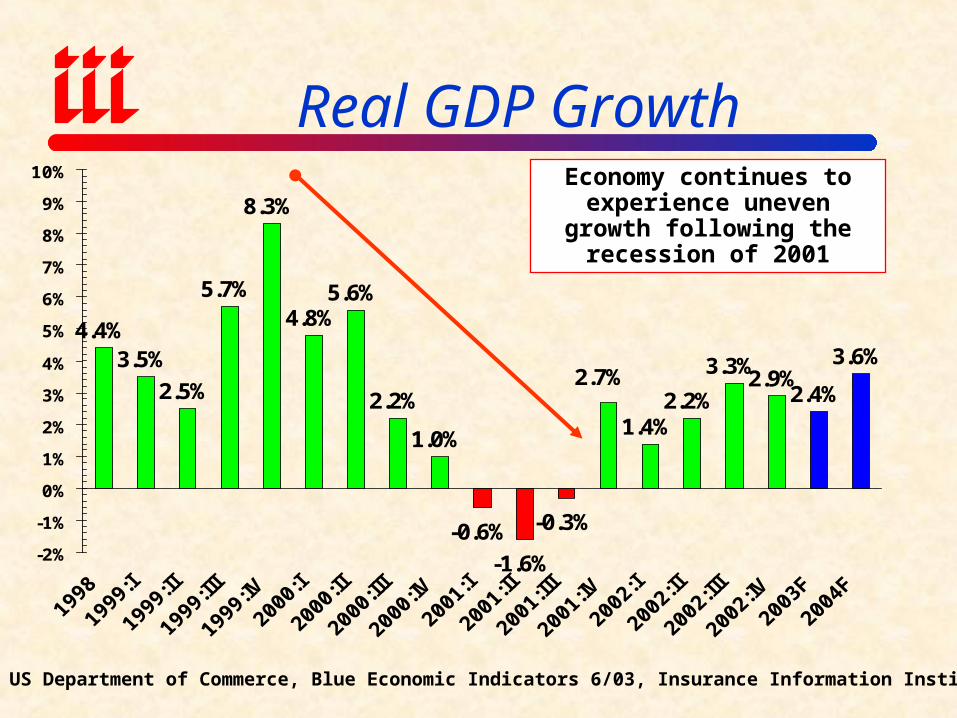
4.4%3.5%
2.5%
5.7%
8.3%
4.8%5.6%
2.2%
1.0%
-0.6%
-1.6%
-0.3%
1.4%2.2%
3.3%2.9%
2.4%
3.6%2.7%
-2%
-1%
0%
1%
2%
3%
4%
5%
6%
7%
8%
9%
10%
Real GDP Growth
Source: US Department of Commerce, Blue Economic Indicators 6/03, Insurance Information Institute.
Economy continues to experience uneven growth
following the recession of 2001
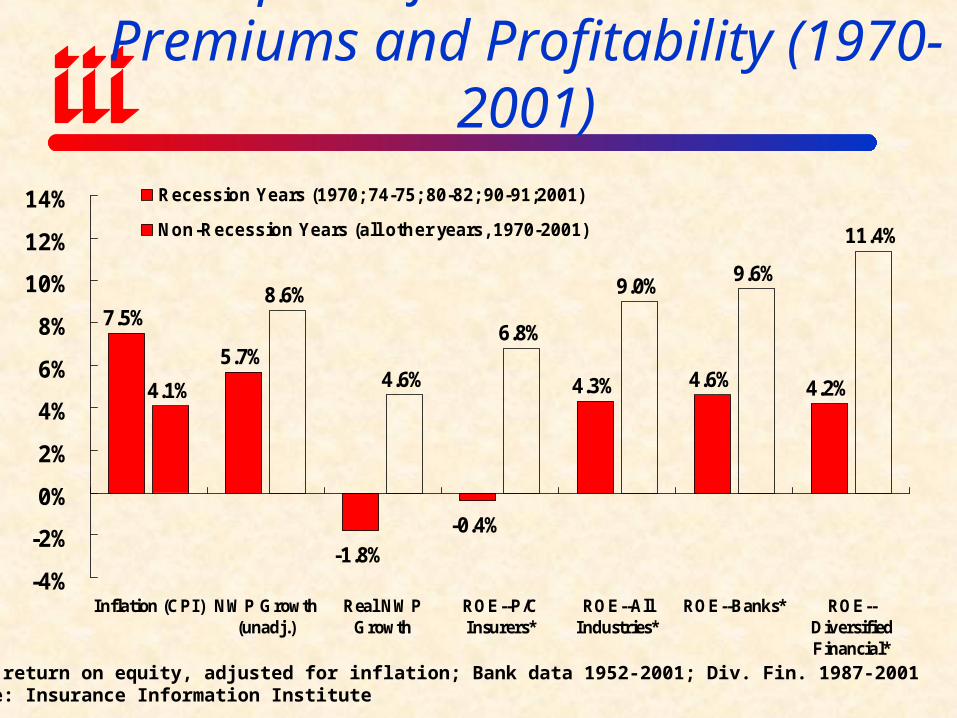
Impact of Recession on P/C Premiums and Profitability (1970-2001)
7.5%
5.7%
-1.8%
-0.4%
4.3% 4.6% 4.2%4.1%
8.6%
4.6%
6.8%
9.0%9.6%
11.4%
-4%
-2%
0%
2%
4%
6%
8%
10%
12%
14%
Inflation (CPI) NWP Growth(unadj.)
Real NWPGrowth
ROE--P/CInsurers*
ROE--AllIndustries*
ROE--Banks* ROE--DiversifiedFinancial*
Recession Years (1970; 74-75; 80-82; 90-91;2001)
Non-Recession Years (all other years, 1970-2001)
*GAAP return on equity, adjusted for inflation; Bank data 1952-2001; Div. Fin. 1987-2001Source: Insurance Information Institute
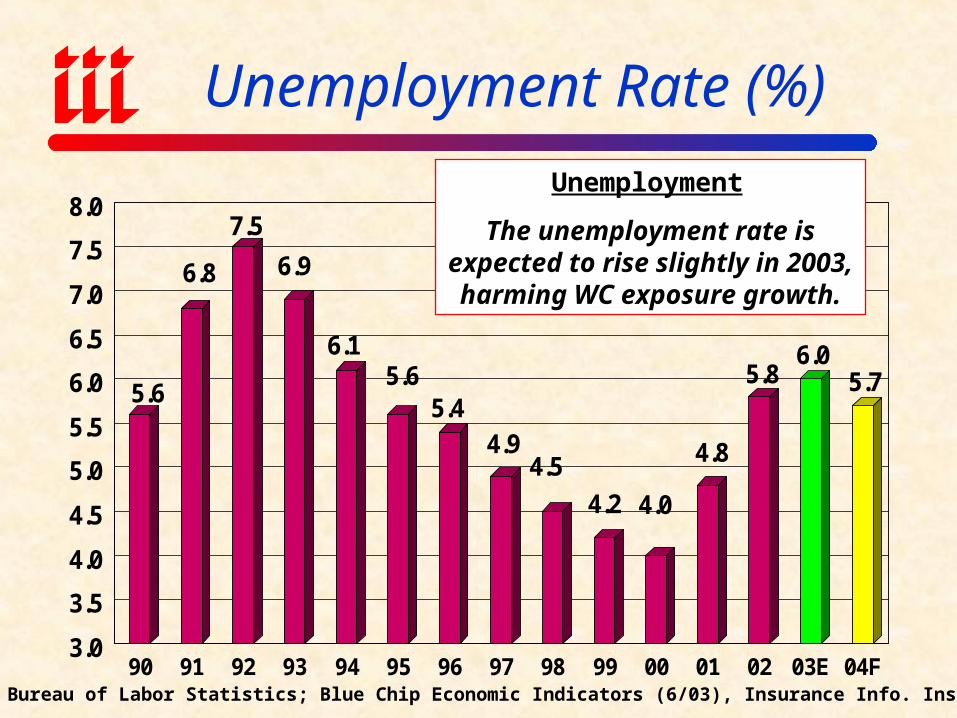
Unemployment Rate (%)
5.6
6.8
7.5
6.9
6.15.6
5.44.9
4.5
4.2 4.0
4.8
5.86.0
5.7
3.0
3.5
4.0
4.5
5.0
5.5
6.0
6.5
7.0
7.5
8.0
90 91 92 93 94 95 96 97 98 99 00 01 02 03E 04FSource: US Bureau of Labor Statistics; Blue Chip Economic Indicators (6/03), Insurance Info. Institute.
Unemployment
The unemployment rate is expected to rise slightly in 2003, harming WC
exposure growth.
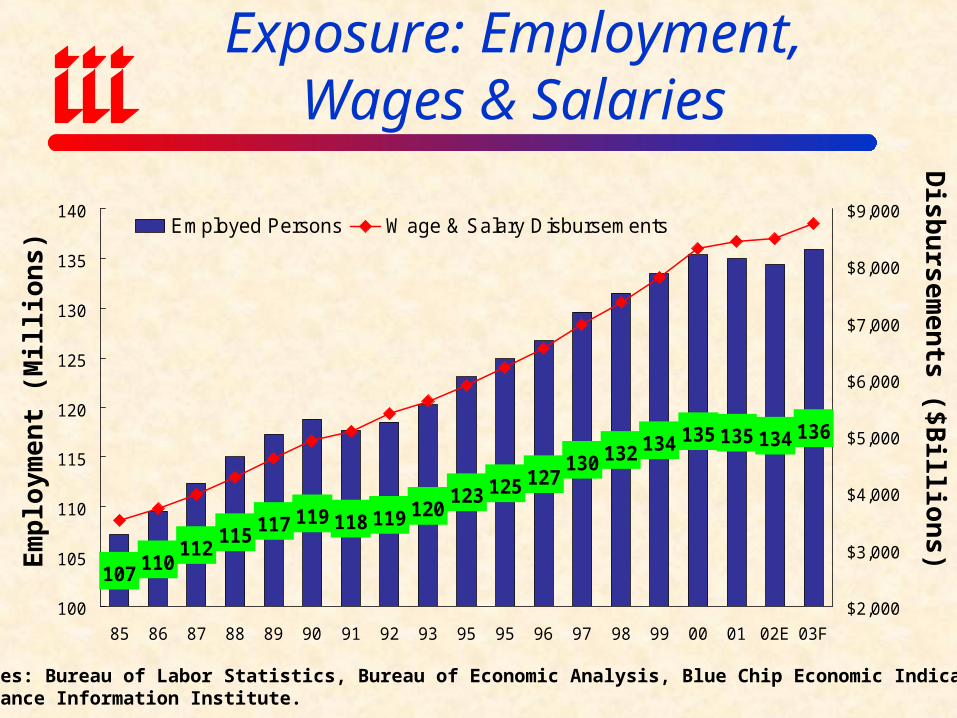
Exposure: Employment, Wages & Salaries
107112
115 117 119 118 119 120123 125 127
130 132 134 135 135 134 136
110
100
105
110
115
120
125
130
135
140
85 86 87 88 89 90 91 92 93 95 95 96 97 98 99 00 01 02E 03F
$2,000
$3,000
$4,000
$5,000
$6,000
$7,000
$8,000
$9,000Employed Persons W age & Salary Disbursements
Sources: Bureau of Labor Statistics, Bureau of Economic Analysis, Blue Chip Economic Indicators,Insurance Information Institute.
Disb
ursem
ents ($B
illions)
Em
plo
ymen
t (M
illio
ns)
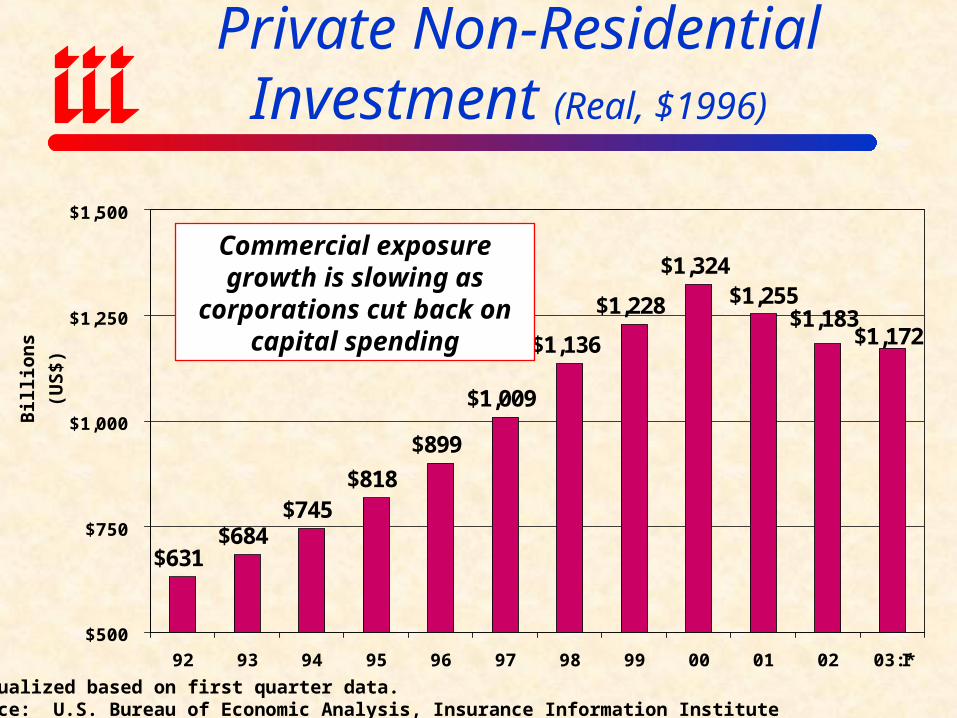
$631$684
$745$818
$899
$1,009
$1,136
$1,228
$1,324$1,255
$1,172$1,183
$500
$750
$1,000
$1,250
$1,500
92 93 94 95 96 97 98 99 00 01 02 03:I*
Private Non-Residential Investment (Real, $1996)
*Annualized based on first quarter data.Source: U.S. Bureau of Economic Analysis, Insurance Information Institute
Bil
lion
s
(US
$)
Commercial exposure growth is slowing as corporations cut
back on capital spending
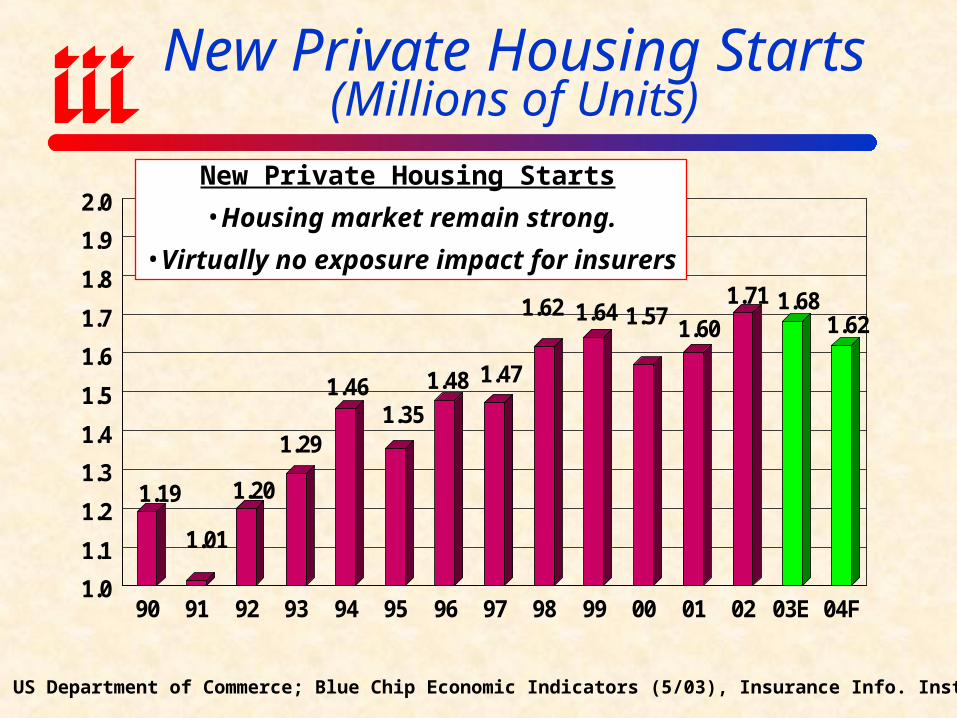
New Private Housing Starts(Millions of Units)
1.19
1.01
1.20
1.29
1.461.35
1.48 1.47
1.62 1.64 1.57 1.60
1.71 1.681.62
1.0
1.1
1.2
1.3
1.4
1.5
1.6
1.7
1.8
1.9
2.0
90 91 92 93 94 95 96 97 98 99 00 01 02 03E 04F
Source: US Department of Commerce; Blue Chip Economic Indicators (5/03), Insurance Info. Institute
New Private Housing Starts
•Housing market remain strong.
•Virtually no exposure impact for insurers
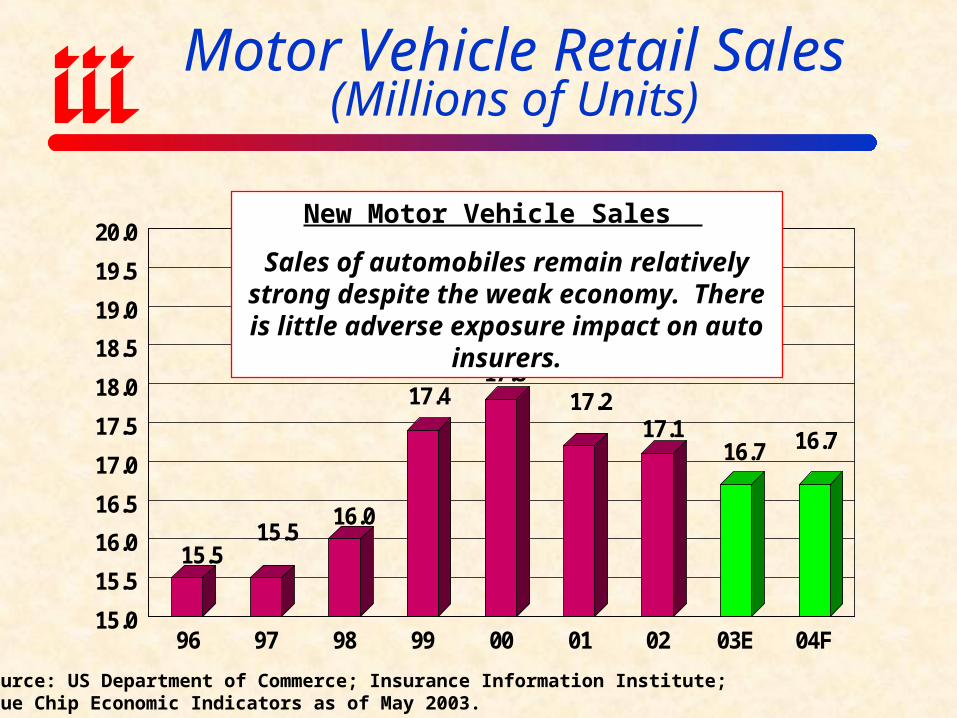
Motor Vehicle Retail Sales (Millions of Units)
15.515.5
16.0
17.417.8
17.217.1
16.7 16.7
15.0
15.5
16.0
16.5
17.0
17.5
18.0
18.5
19.0
19.5
20.0
96 97 98 99 00 01 02 03E 04F
Source: US Department of Commerce; Insurance Information Institute;Blue Chip Economic Indicators as of May 2003.
New Motor Vehicle Sales
Sales of automobiles remain relatively strong despite the weak economy. There is little
adverse exposure impact on auto insurers.
Legend #2: Insurance is More
Expensive than Ever and is Squeezing Businesses and
Families Alike
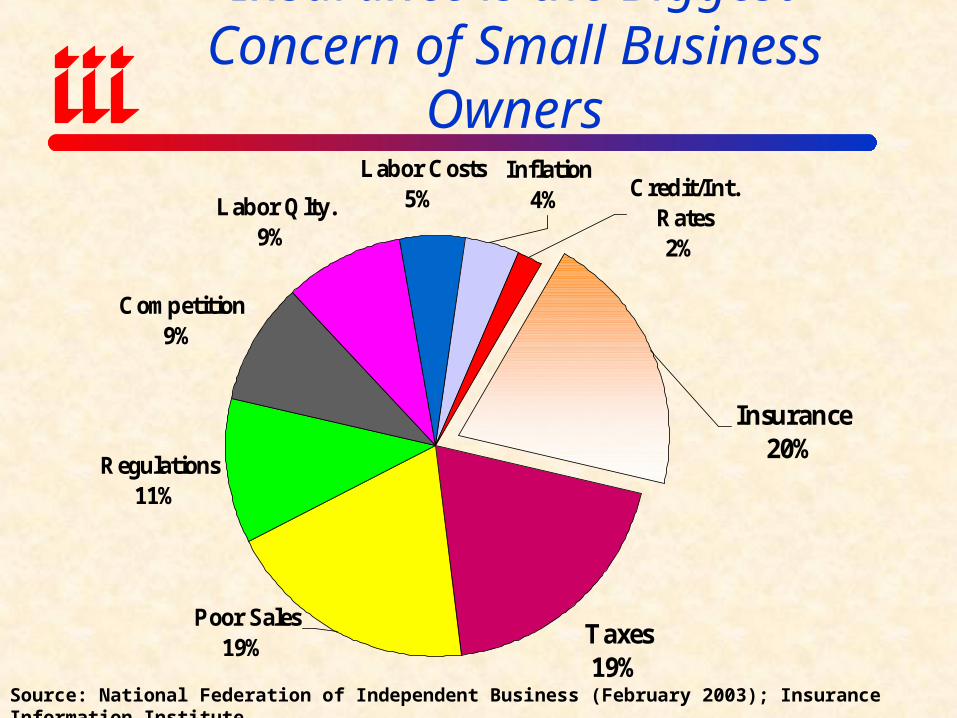
Insurance is the Biggest Concern of Small Business Owners
Regulations11%
Competition9%
Labor Qlty.9%
Taxes19%
Poor Sales19%
Labor Costs5%
Inflation4%
Insurance20%
Credit/Int. Rates2%
Source: National Federation of Independent Business (February 2003); Insurance Information Institute
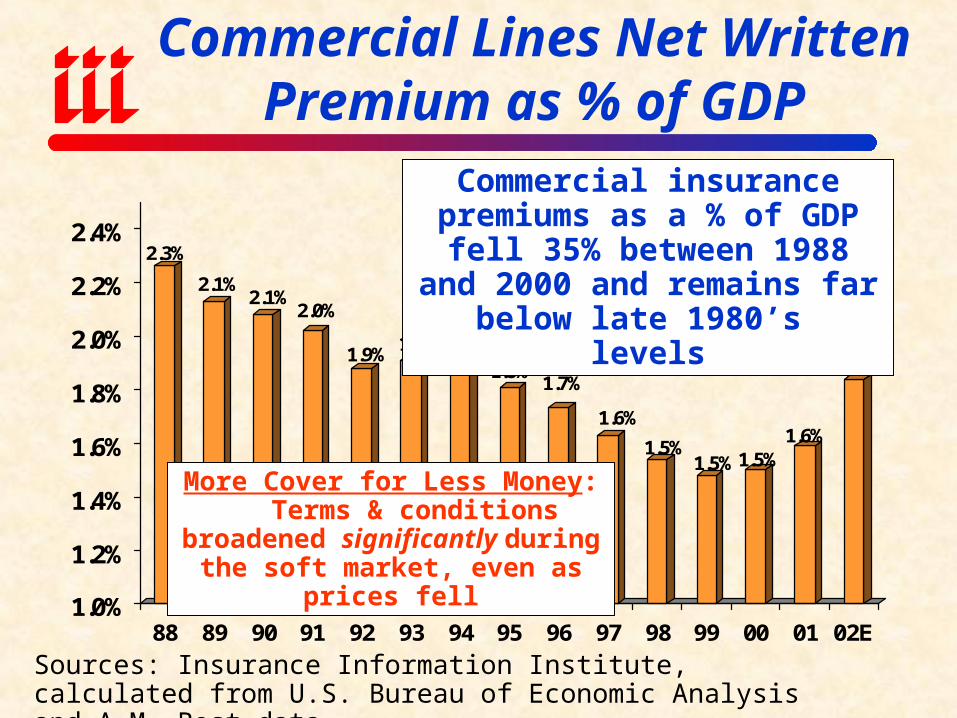
Commercial Lines Net Written Premium as % of GDP
2.3%
2.1%2.1%
2.0%
1.9%1.9%
1.9%1.8%
1.7%
1.6%
1.5%1.5%1.5%
1.6%
1.8%
1.0%
1.2%
1.4%
1.6%
1.8%
2.0%
2.2%
2.4%
88 89 90 91 92 93 94 95 96 97 98 99 00 01 02E
Sources: Insurance Information Institute, calculated from U.S. Bureau of Economic Analysis and A.M. Best data.
Commercial insurance premiums as a % of GDP fell 35% between 1988 and 2000 and remains far
below late 1980’s levels
More Cover for Less Money: Terms & conditions broadened
significantly during the soft market, even as prices fell
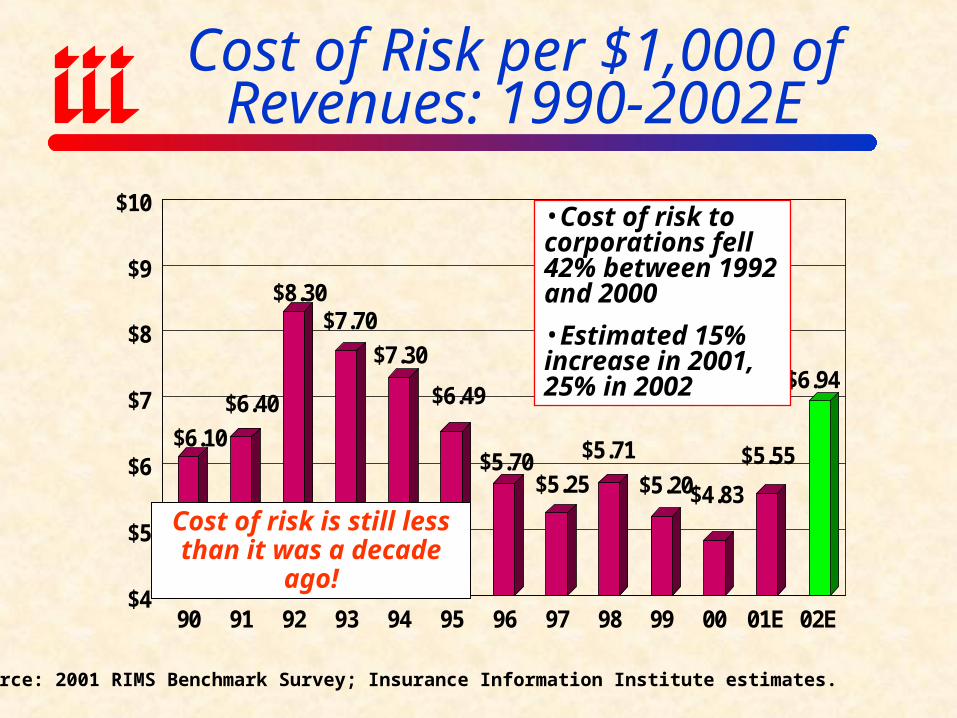
Cost of Risk per $1,000 of Revenues: 1990-2002E
$6.10
$6.40
$8.30$7.70
$7.30
$6.49
$5.70$5.25
$5.71
$5.20$4.83
$5.55
$6.94
$4
$5
$6
$7
$8
$9
$10
90 91 92 93 94 95 96 97 98 99 00 01E 02E
Source: 2001 RIMS Benchmark Survey; Insurance Information Institute estimates.
•Cost of risk to corporations fell 42% between 1992 and 2000
•Estimated 15% increase in 2001, 25% in 2002
Cost of risk is still less than it was a decade ago!
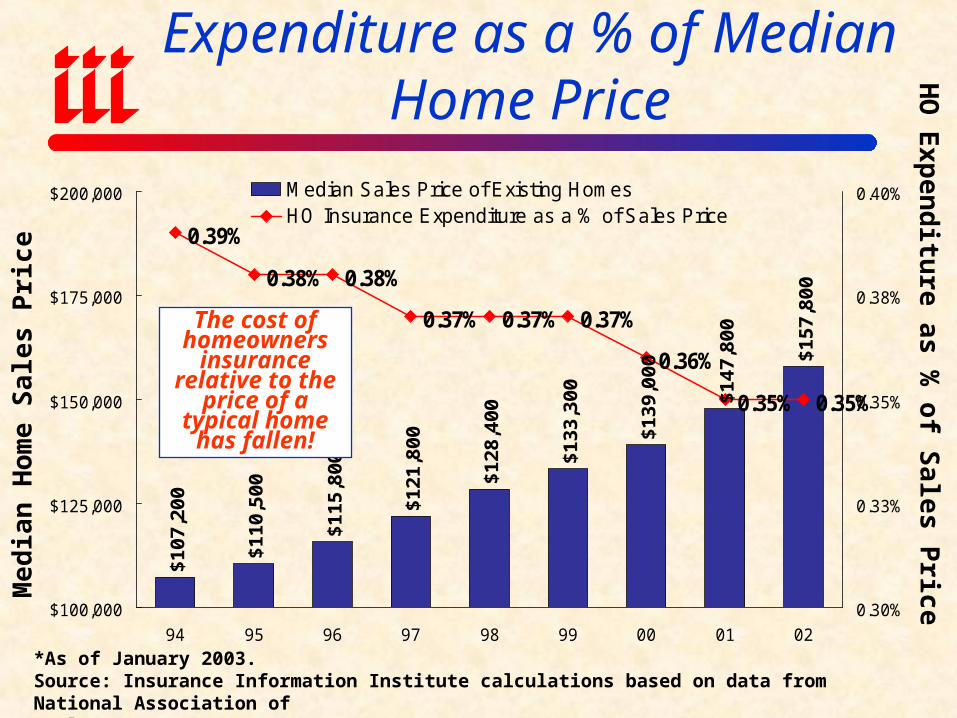
Homeowners Insurance Expenditure as a % of Median Home Price
$107
,200
$115
,800
$121
,800
$128
,400
$133
,300
$139
,000
$147
,800
$157
,800
$110
,500
0.39%
0.38% 0.38%
0.37% 0.37% 0.37%
0.36%
0.35% 0.35%
$100,000
$125,000
$150,000
$175,000
$200,000
94 95 96 97 98 99 00 01 02
0.30%
0.33%
0.35%
0.38%
0.40%Median Sales Price of Existing HomesHO Insurance Expenditure as a % of Sales Price
*As of January 2003.Source: Insurance Information Institute calculations based on data from National Association of Realtors, NAIC.
HO
Exp
end
iture as %
of Sales P
riceMed
ian
Hom
e S
ales
Pri
ce
The cost of homeowners
insurance relative to the
price of a typical home has fallen!
Legend #3: Insurers are Raising Rates to Make up for 9/11 Losses
-10%
-5%
0%
5%
10%
15%
20%
25%
19
70
19
71
19
72
19
73
19
74
19
75
19
76
19
77
19
78
19
79
19
80
19
81
19
82
19
83
19
84
19
85
19
86
19
87
19
88
19
89
19
90
19
91
19
92
19
93
19
94
19
95
19
96
19
97
19
98
19
99
20
00
20
01
20
02
20
03
Current $ Real $
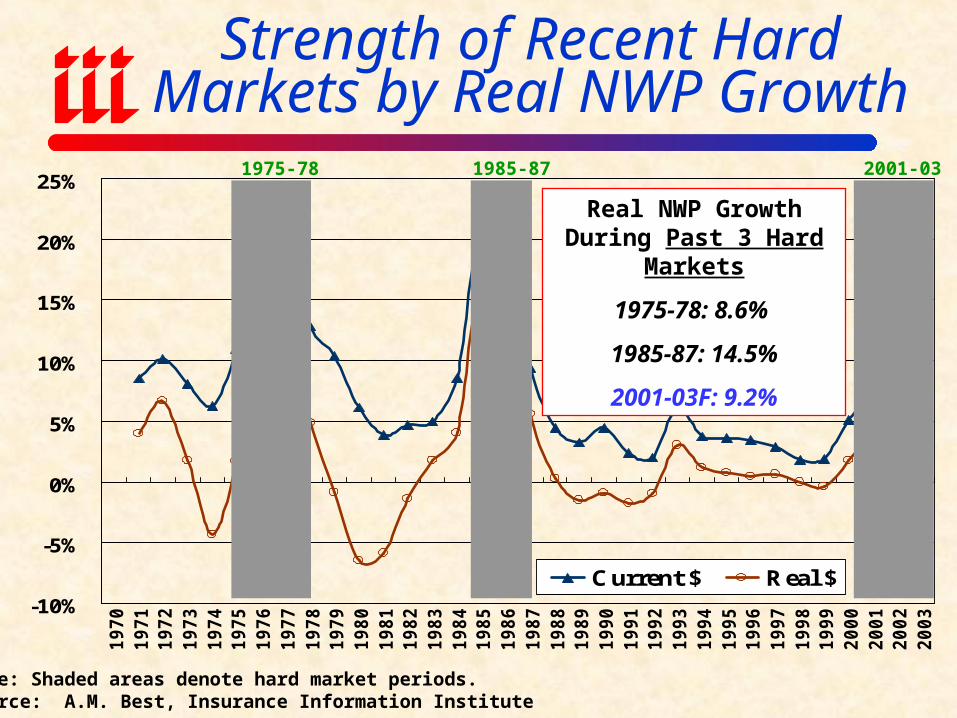
Note: Shaded areas denote hard market periods.Source: A.M. Best, Insurance Information Institute
Strength of Recent Hard Markets by Real NWP Growth
Real NWP Growth During Past 3 Hard Markets
1975-78: 8.6%
1985-87: 14.5%
2001-03F: 9.2%
1975-78 1985-87 2001-03
($60)
($50)
($40)
($30)
($20)
($10)
$0
$10
1975
1976
1977
1978
1979
1980
1981
1982
1983
1984
1985
1986
1987
1988
1989
1990
1991
1992
1993
1994
1995
1996
1997
1998
1999
2000
2001
2002
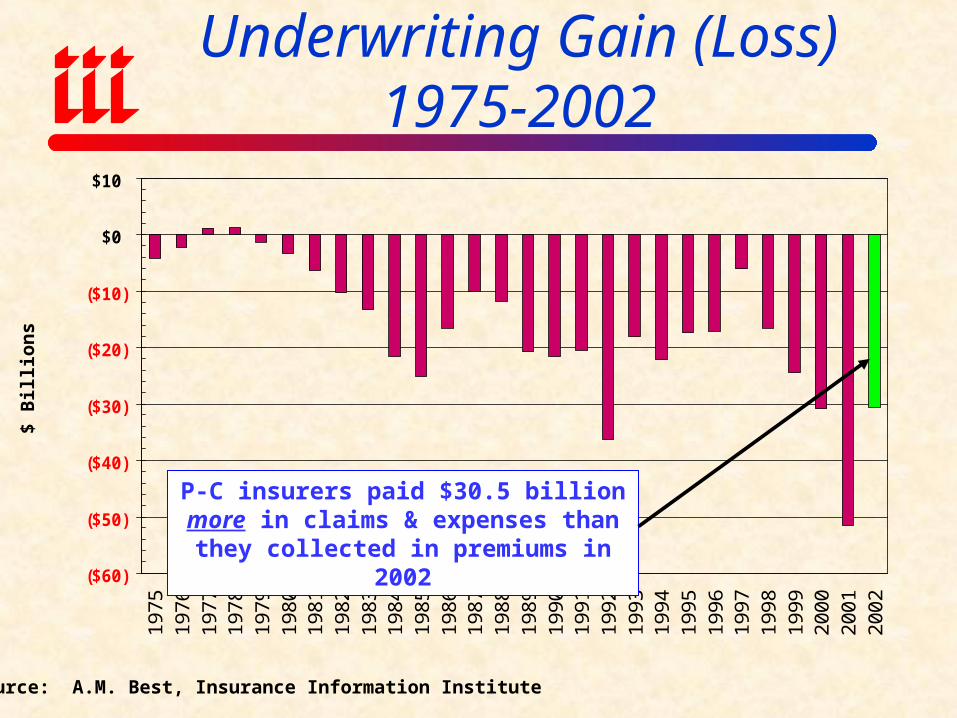
Underwriting Gain (Loss)1975-2002
Source: A.M. Best, Insurance Information Institute
$ B
illi
ons
P-C insurers paid $30.5 billion more in claims & expenses than they collected in
premiums in 2002
95
100
105
110
115
120
70
71
72
73
74
75
76
77
78
79
80
81
82
83
84
85
86
87
88
89
90
91
92
93
94
95
96
97
98
99
00
01
02
03
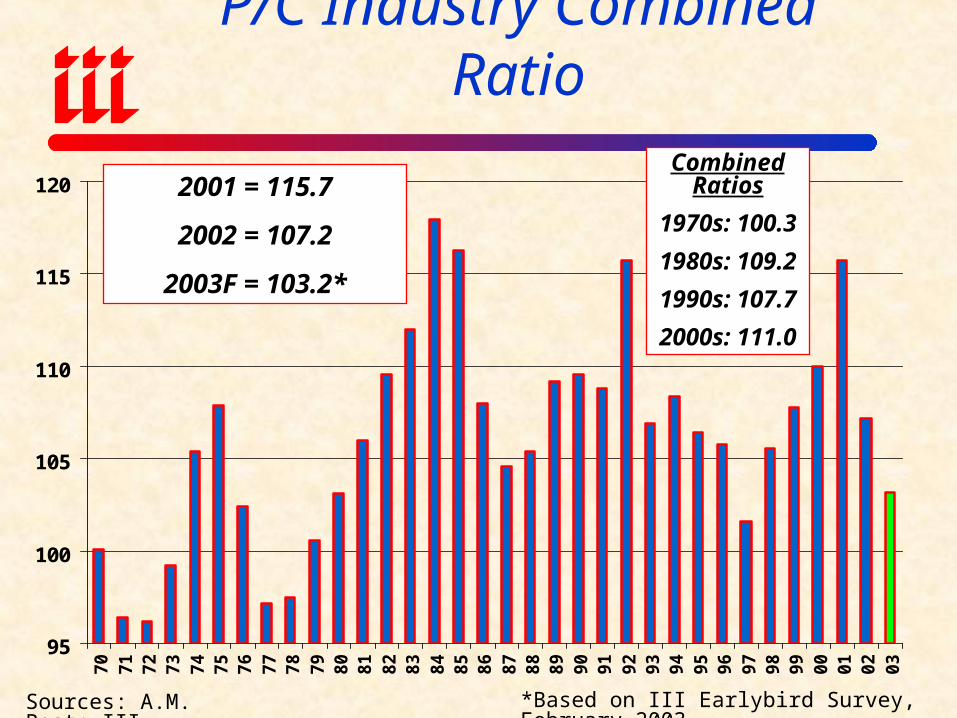
P/C Industry Combined Ratio
2001 = 115.7
2002 = 107.2
2003F = 103.2*
Combined Ratios
1970s: 100.3
1980s: 109.2
1990s: 107.7
2000s: 111.0
Sources: A.M. Best; III *Based on III Earlybird Survey, February 2003.
110.
5
105.
0 113.
6
119.
2
104.
8
100.
8
100.
5
114.
3
106.
5
121.
3
96.4
108.
8 115.
8
106.
9
108.
5
106.
5
105.
8
101.
6
105.
6
107.
7
110.
0
115.
7
107.
2
162.
5
126.
5
90
100
110
120
130
140
150
160
170
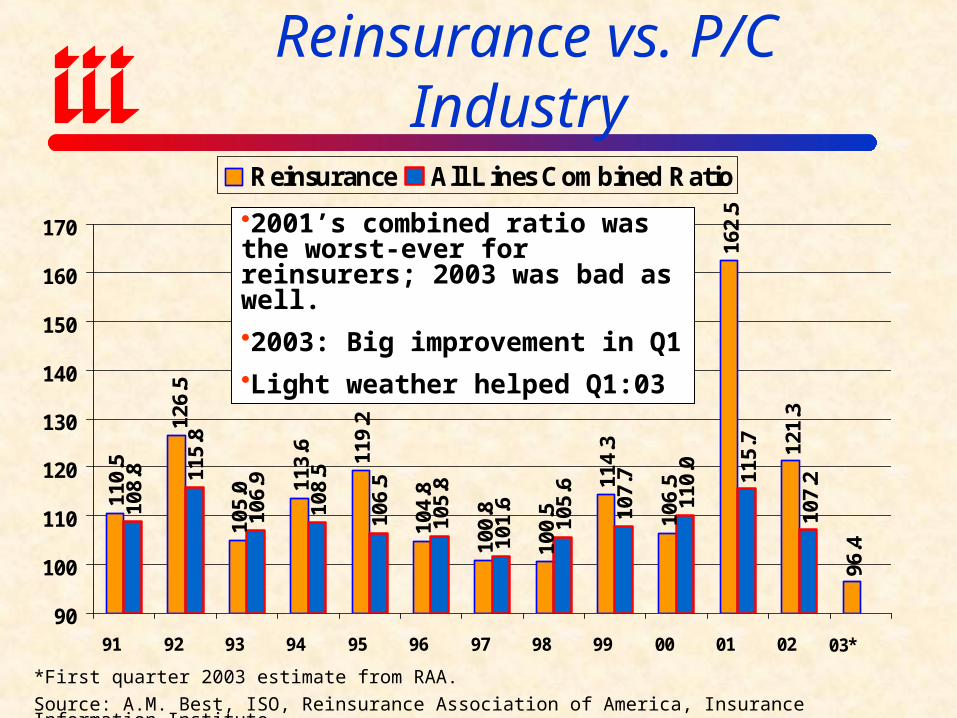
91 92 93 94 95 96 97 98 99 00 01 02 03*
Reinsurance All Lines Combined Ratio
Combined Ratio: Reinsurance vs. P/C Industry
*First quarter 2003 estimate from RAA.
Source: A.M. Best, ISO, Reinsurance Association of America, Insurance Information Institute
2001’s combined ratio was the worst-ever for reinsurers; 2003 was bad as well.
2003: Big improvement in Q1
Light weather helped Q1:03
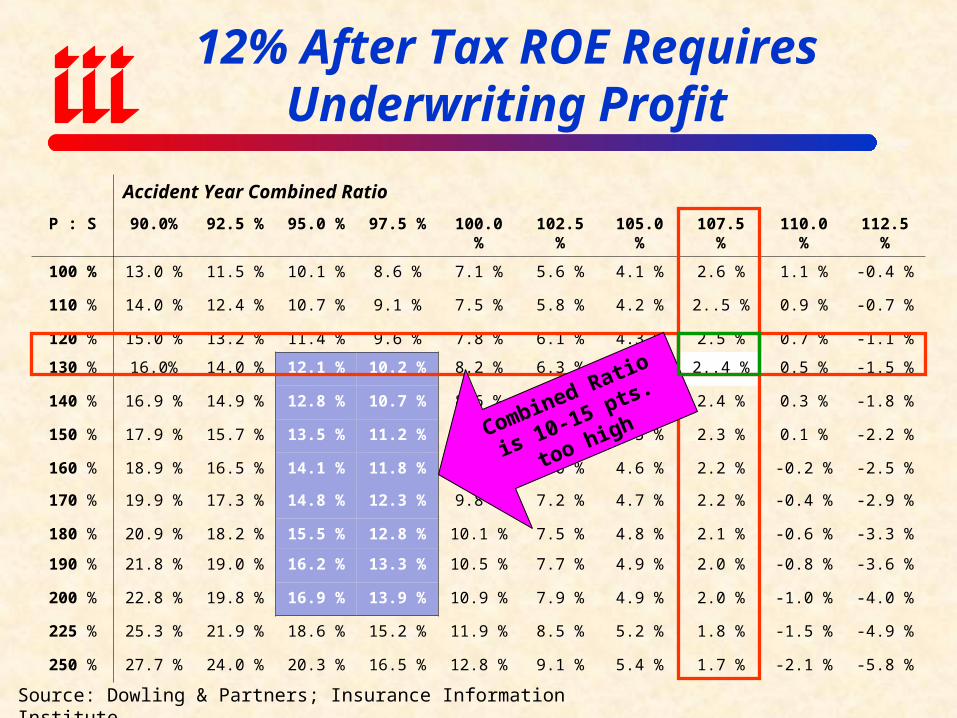
12% After Tax ROE Requires Underwriting Profit
Source: Dowling & Partners; Insurance Information Institute
Accident Year Combined Ratio
P : S 90.0% 92.5 % 95.0 % 97.5 % 100.0 % 102.5 % 105.0 % 107.5 % 110.0 % 112.5 %
100 % 13.0 % 11.5 % 10.1 % 8.6 % 7.1 % 5.6 % 4.1 % 2.6 % 1.1 % -0.4 %
110 % 14.0 % 12.4 % 10.7 % 9.1 % 7.5 % 5.8 % 4.2 % 2..5 % 0.9 % -0.7 %
120 % 15.0 % 13.2 % 11.4 % 9.6 % 7.8 % 6.1 % 4.3 % 2.5 % 0.7 % -1.1 %
130 % 16.0% 14.0 % 12.1 % 10.2 % 8.2 % 6.3 % 4.4 % 2..4 % 0.5 % -1.5 %
140 % 16.9 % 14.9 % 12.8 % 10.7 % 8.6 % 6.5 % 4.4 % 2.4 % 0.3 % -1.8 %
150 % 17.9 % 15.7 % 13.5 % 11.2 % 9.0 % 6.8 % 4.5 % 2.3 % 0.1 % -2.2 %
160 % 18.9 % 16.5 % 14.1 % 11.8 % 9.4 % 7.0 % 4.6 % 2.2 % -0.2 % -2.5 %
170 % 19.9 % 17.3 % 14.8 % 12.3 % 9.8 % 7.2 % 4.7 % 2.2 % -0.4 % -2.9 %
180 % 20.9 % 18.2 % 15.5 % 12.8 % 10.1 % 7.5 % 4.8 % 2.1 % -0.6 % -3.3 %
190 % 21.8 % 19.0 % 16.2 % 13.3 % 10.5 % 7.7 % 4.9 % 2.0 % -0.8 % -3.6 %
200 % 22.8 % 19.8 % 16.9 % 13.9 % 10.9 % 7.9 % 4.9 % 2.0 % -1.0 % -4.0 %
225 % 25.3 % 21.9 % 18.6 % 15.2 % 11.9 % 8.5 % 5.2 % 1.8 % -1.5 % -4.9 %
250 % 27.7 % 24.0 % 20.3 % 16.5 % 12.8 % 9.1 % 5.4 % 1.7 % -2.1 % -5.8 %
Combined Ratio is 10-
15 pts. too high
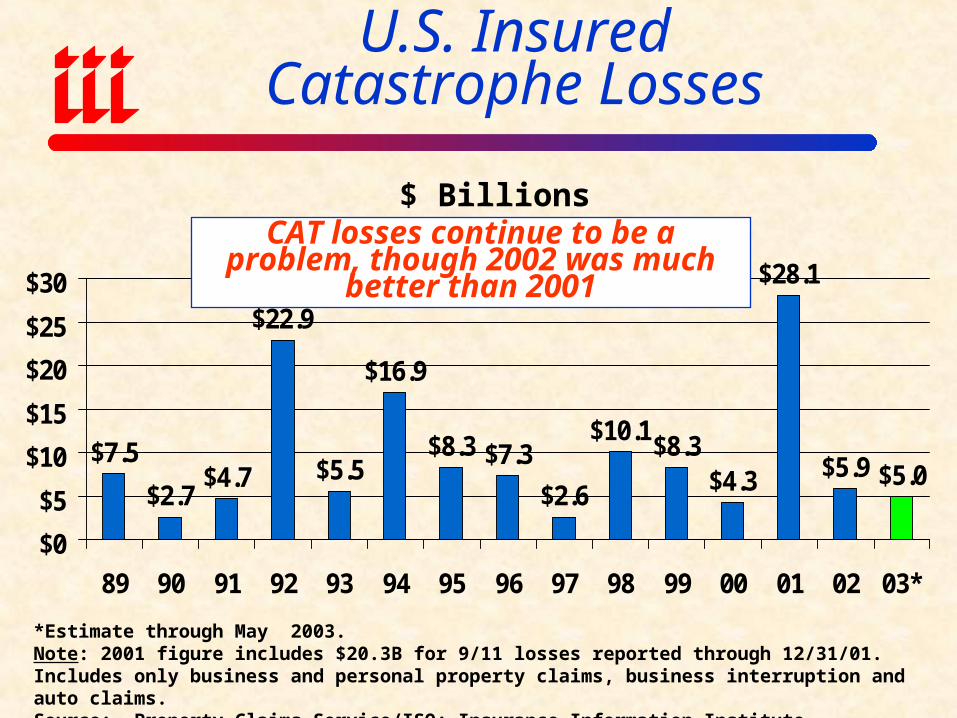
U.S. InsuredCatastrophe Losses
$7.5
$2.7$4.7
$22.9
$5.5
$16.9
$8.3 $7.3
$2.6
$10.1$8.3
$4.3
$28.1
$5.9 $5.0
$0
$5
$10
$15
$20
$25
$30
89 90 91 92 93 94 95 96 97 98 99 00 01 02 03*
*Estimate through May 2003.Note: 2001 figure includes $20.3B for 9/11 losses reported through 12/31/01. Includes only business and personal property claims, business interruption and auto claims.Source: Property Claims Service/ISO; Insurance Information Institute
$ BillionsCAT losses continue to be a problem,
though 2002 was much better than 2001
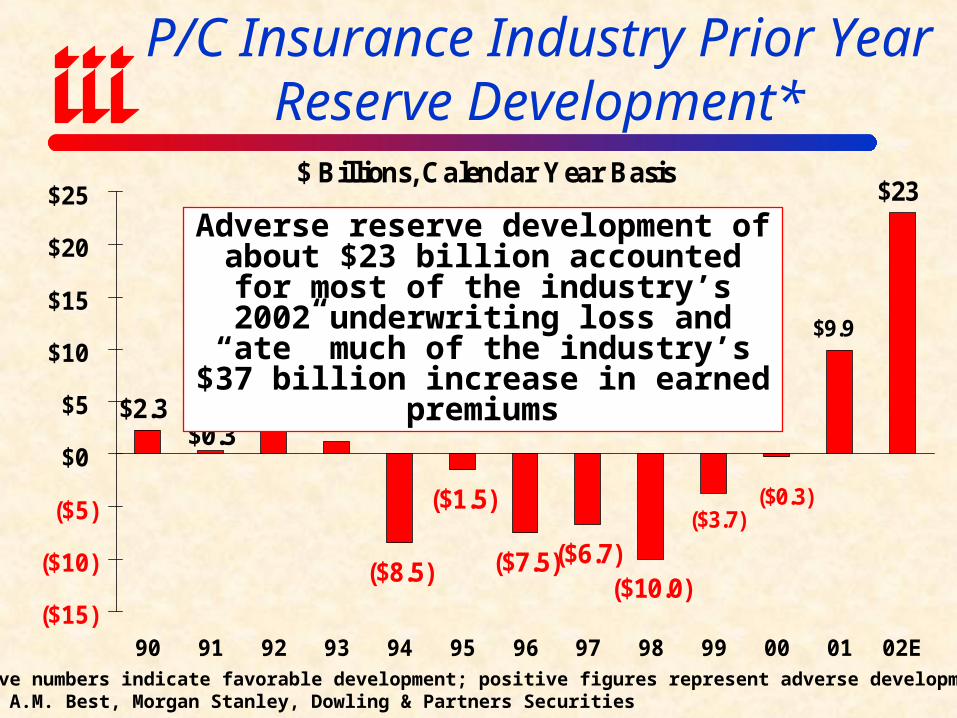
$ Billions, Calendar Year Basis
$2.3 $2.2 $1.2
($8.5)
($1.5)
($7.5)($6.7)($10.0)
$23
$0.3
($3.7)($0.3)
$9.9
($15)
($10)
($5)
$0
$5
$10
$15
$20
$25
90 91 92 93 94 95 96 97 98 99 00 01 02E
P/C Insurance Industry Prior Year Reserve Development*
*Negative numbers indicate favorable development; positive figures represent adverse development.Source: A.M. Best, Morgan Stanley, Dowling & Partners Securities
Adverse reserve development of about $23 billion accounted for most of the
industry’s 2002 underwriting loss and “ate” much of the industry’s $37 billion
increase in earned premiums
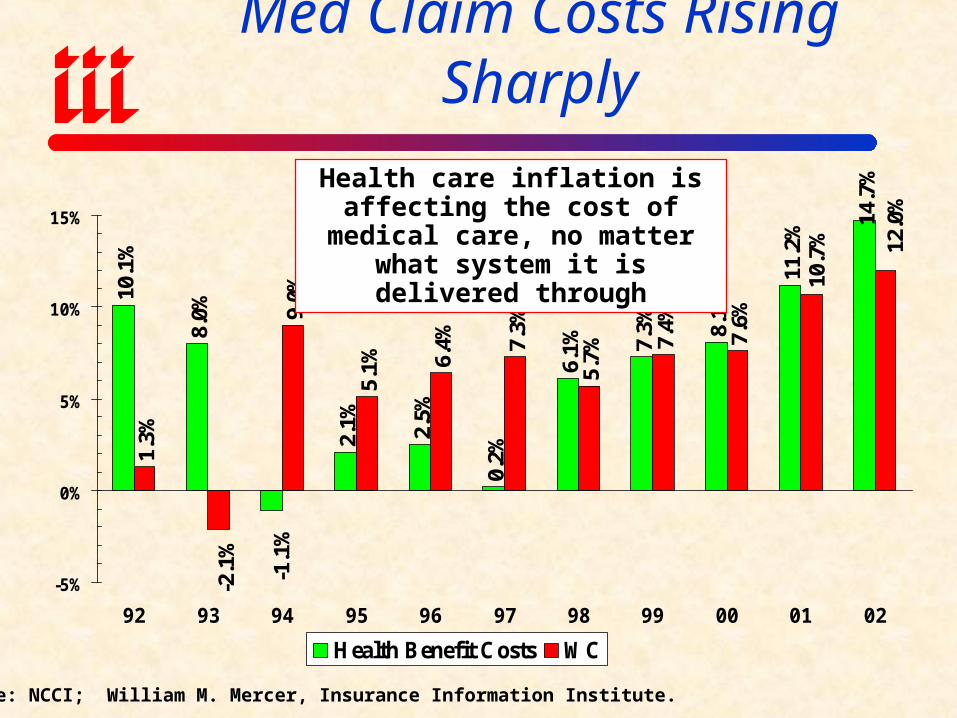
10.1
%
8.0%
2.1% 2.5%
0.2%
6.1% 7.
3% 8.1%
11.2
%
14.7
%
1.3%
9.0%
5.1% 6.
4% 7.3%
5.7%
7.4%
7.6%
-1.1
%
-2.1
%
10.7
% 12.0
%
-5%
0%
5%
10%
15%
92 93 94 95 96 97 98 99 00 01 02
Health Benefit Costs WC
Med Claim Costs Rising Sharply
Source: NCCI; William M. Mercer, Insurance Information Institute.
Health care inflation is affecting the cost of medical care, no matter
what system it is delivered through

Legend #4: Insurers’ Reckless
Investment Strategies are the Primary Reason Why Rates
are Rising Today
$0
$9
$18
$27
$36
$45
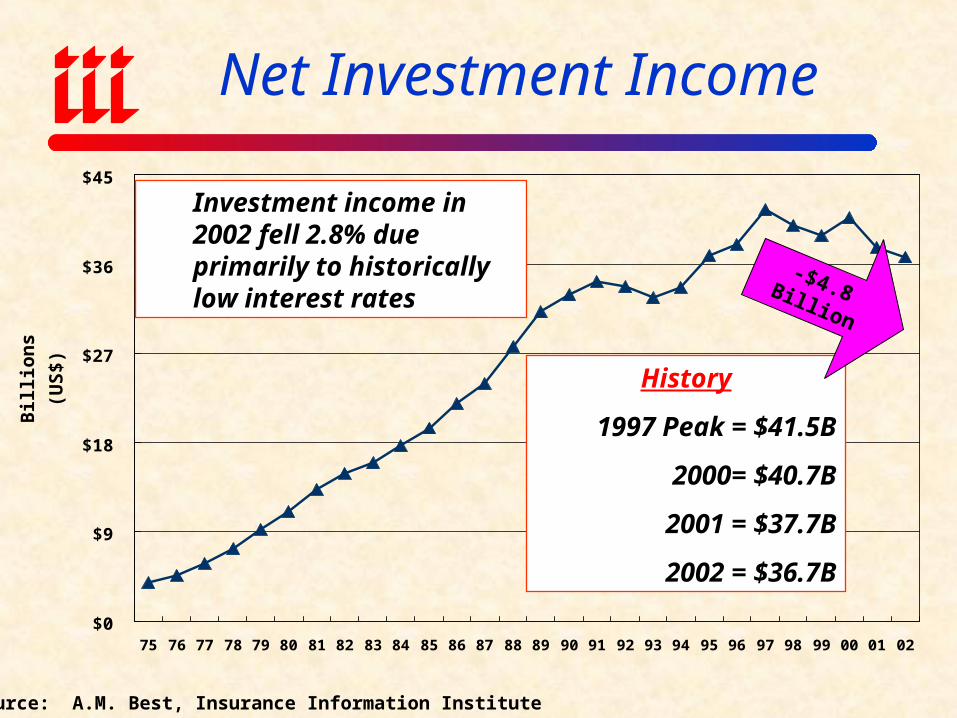
75 76 77 78 79 80 81 82 83 84 85 86 87 88 89 90 91 92 93 94 95 96 97 98 99 00 01 02
Net Investment Income
History
1997 Peak = $41.5B
2000= $40.7B
2001 = $37.7B
2002 = $36.7B
Bil
lion
s
(US
$)
Investment income in 2002 fell 2.8% due primarily to historically low interest rates
Source: A.M. Best, Insurance Information Institute
-$4.8 Billion
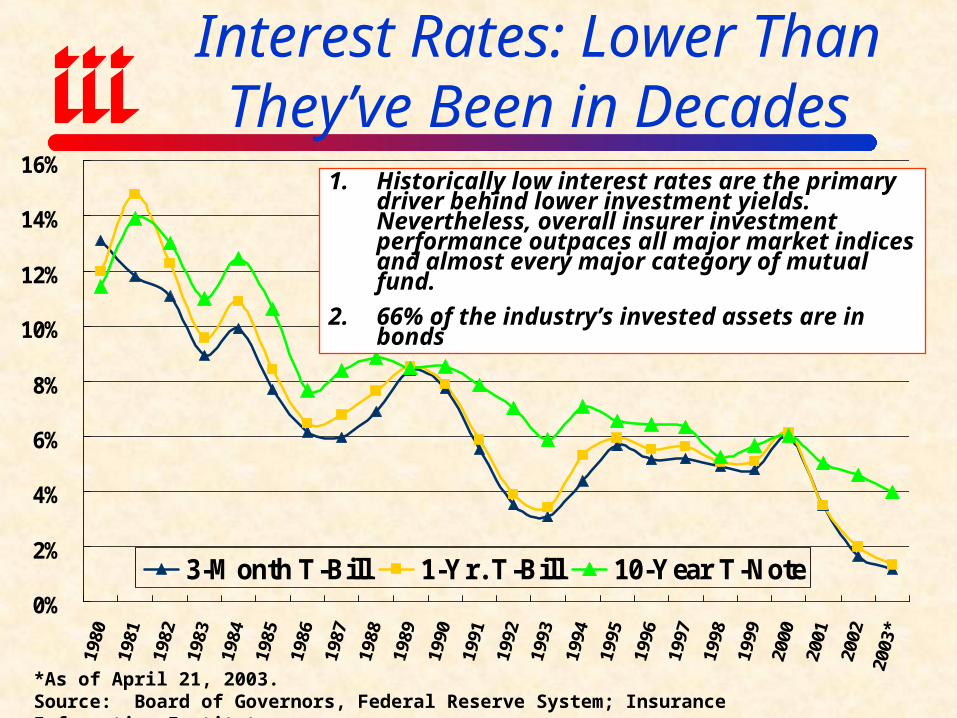
0%
2%
4%
6%
8%
10%
12%
14%
16%
3-Month T-Bill 1-Yr. T-Bill 10-Year T-Note
Interest Rates: Lower Than They’ve Been in Decades
*As of April 21, 2003.Source: Board of Governors, Federal Reserve System; Insurance Information Institute
1. Historically low interest rates are the primary driver behind lower investment yields. Nevertheless, overall insurer investment performance outpaces all major market indices and almost every major category of mutual fund.
2. 66% of the industry’s invested assets are in bonds
-30%
-20%
-10%
0%
10%
20%
30%
40%
19
70
19
72
19
74
19
76
19
78
19
80
19
82
19
84
19
86
19
88
19
90
19
92
19
94
19
96
19
98
20
00
20
02
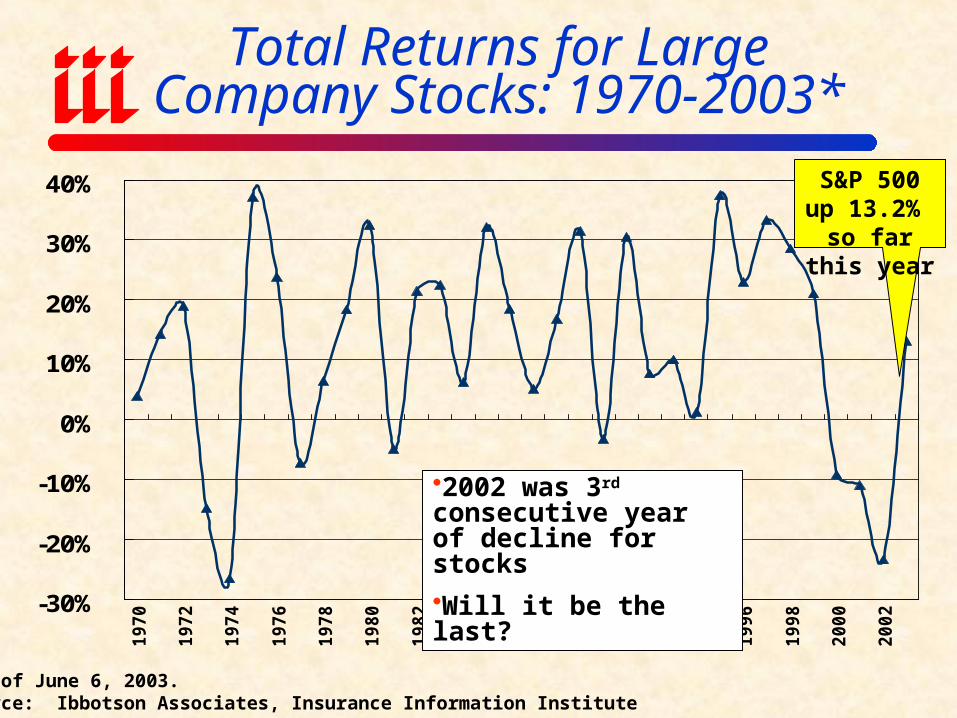
*As of June 6, 2003.Source: Ibbotson Associates, Insurance Information Institute
Total Returns for Large Company Stocks: 1970-2003*
2002 was 3rd consecutive year of decline for stocks
Will it be the last?
S&P 500 up 13.2% so
far this year
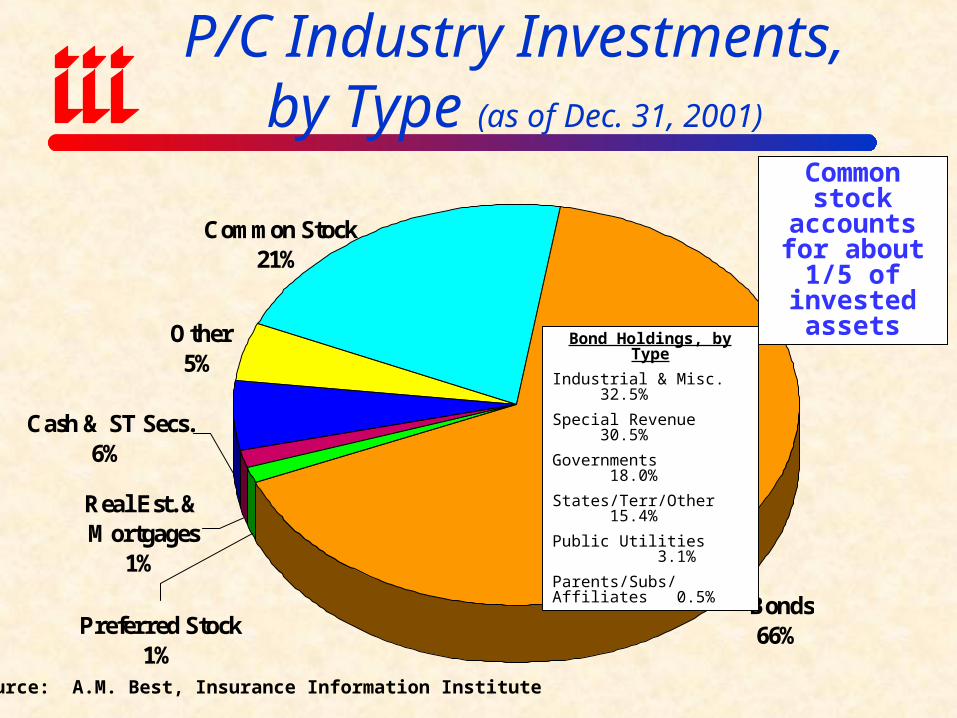
P/C Industry Investments,by Type (as of Dec. 31, 2001)
Other5%
Bonds66%
Real Est. & Mortgages
1%
Common Stock21%
Cash & ST Secs.6%
Preferred Stock1%
Bond Holdings, by Type
Industrial & Misc. 32.5%
Special Revenue 30.5%
Governments 18.0%
States/Terr/Other 15.4%
Public Utilities 3.1%
Parents/Subs/Affiliates 0.5%
Source: A.M. Best, Insurance Information Institute
Common stock accounts for about 1/5 of invested
assets
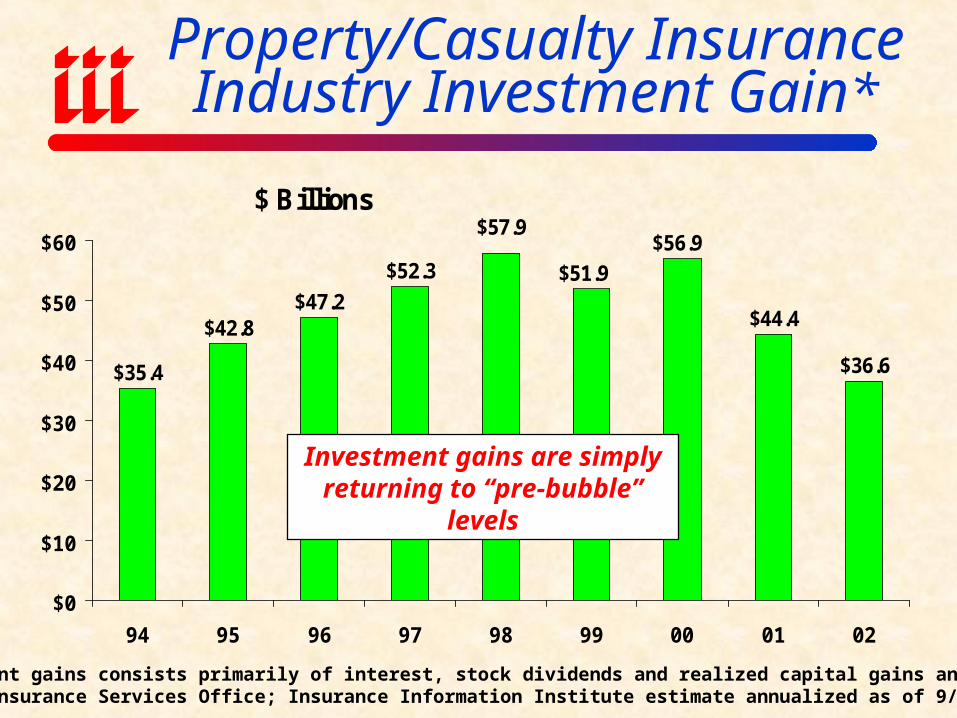
Property/Casualty Insurance Industry Investment Gain*
$ Billions
$35.4
$42.8$47.2
$52.3
$44.4
$36.6
$57.9
$51.9
$56.9
$0
$10
$20
$30
$40
$50
$60
94 95 96 97 98 99 00 01 02
*Investment gains consists primarily of interest, stock dividends and realized capital gains and losses.Source: Insurance Services Office; Insurance Information Institute estimate annualized as of 9/30/02.
Investment gains are simply returning to “pre-bubble” levels
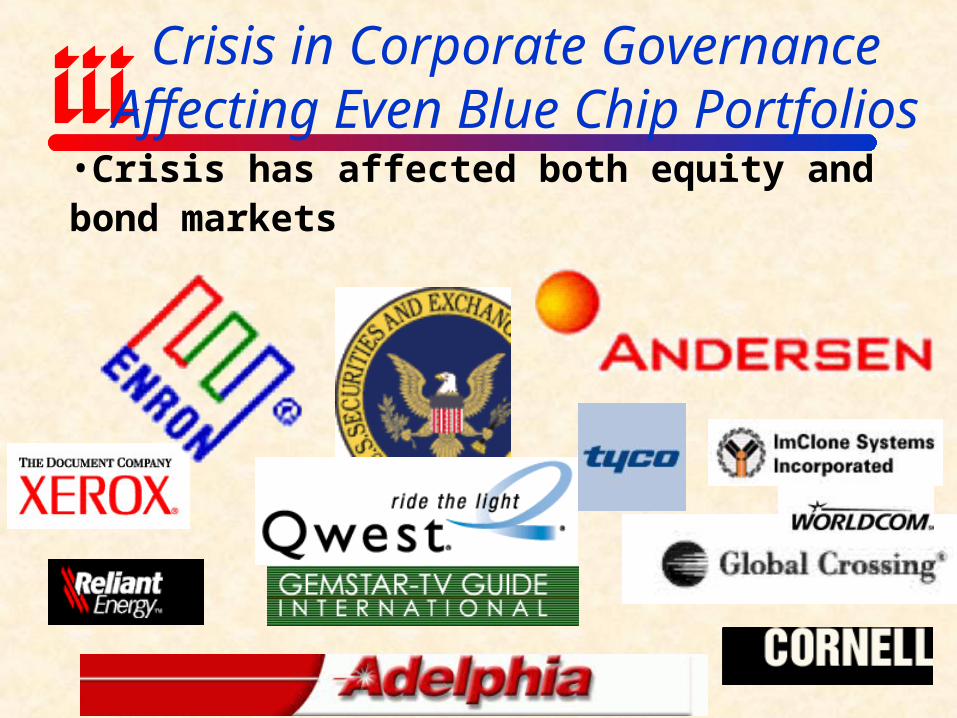
Crisis in Corporate Governance Affecting Even Blue Chip Portfolios
•Crisis has affected both equity and bond markets
Legend #5:There is No Relationship
Between Litigiousness and Rising Insurance Costs
(A Trial Lawyer Favorite)
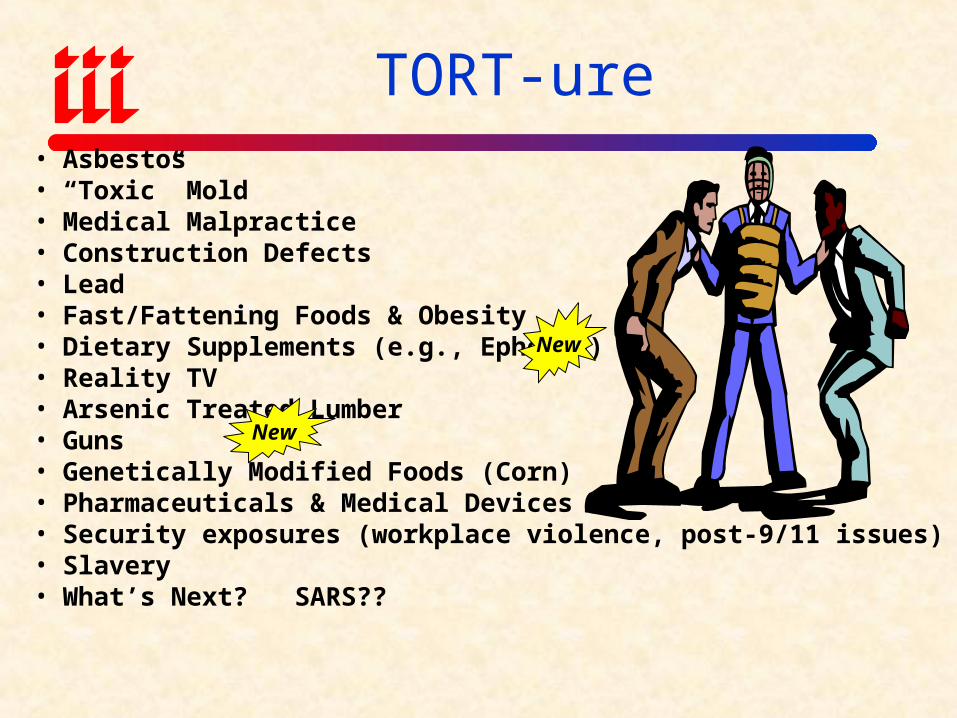
TORT-ure• Asbestos• “Toxic” Mold• Medical Malpractice• Construction Defects• Lead• Fast/Fattening Foods & Obesity• Dietary Supplements (e.g., Ephedra)• Reality TV• Arsenic Treated Lumber • Guns• Genetically Modified Foods (Corn)• Pharmaceuticals & Medical Devices• Security exposures (workplace violence, post-9/11 issues)• Slavery• What’s Next? SARS??
New
New
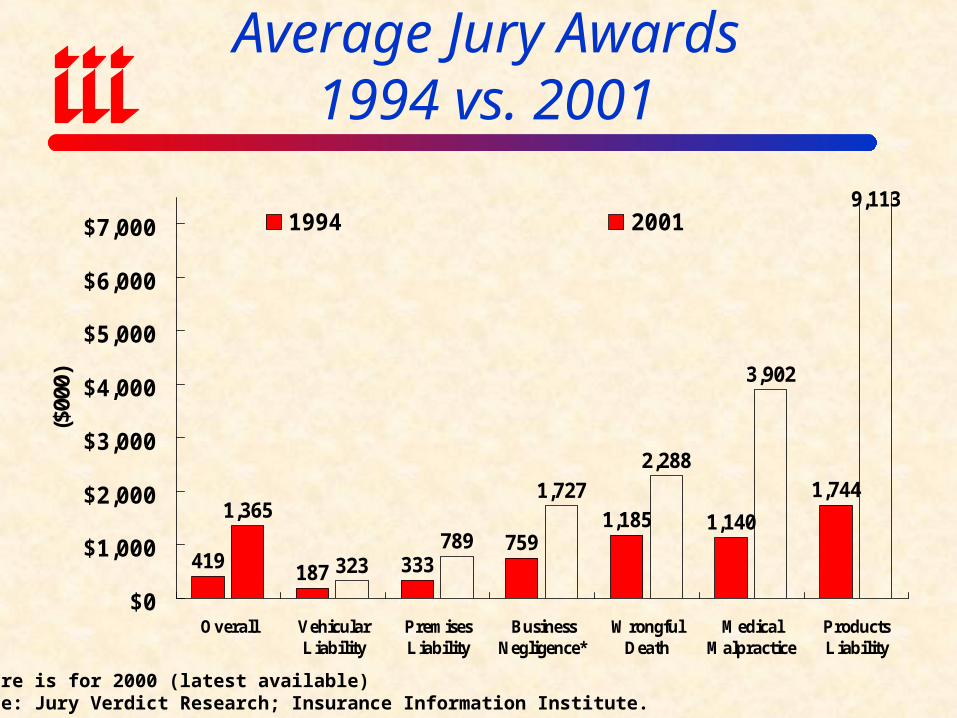
Average Jury Awards1994 vs. 2001
419187 333
7591,185 1,140
1,7441,365
323789
1,727
2,288
3,902
9,113
$0
$1,000
$2,000
$3,000
$4,000
$5,000
$6,000
$7,000
Overall VehicularLiability
PremisesLiability
BusinessNegligence*
WrongfulDeath
MedicalMalpractice
ProductsLiability
($00
0)
1994 2001
*Figure is for 2000 (latest available)Source: Jury Verdict Research; Insurance Information Institute.
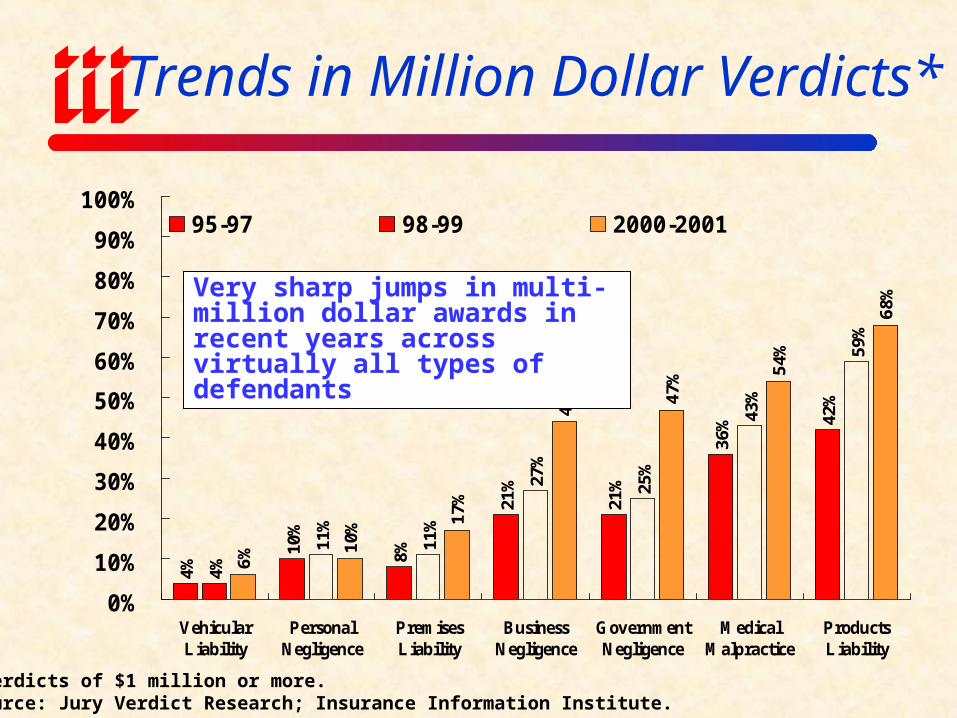
Trends in Million Dollar Verdicts*
4%
10%
8%
21%
21%
36% 42
%
4%
11%
11%
27%
25%
43%
59%
0%
10%
20%
30%
40%
50%
60%
70%
80%
90%
100%
VehicularLiability
PersonalNegligence
PremisesLiability
BusinessNegligence
GovernmentNegligence
MedicalMalpractice
ProductsLiability
95-97 98-99 2000-2001
*Verdicts of $1 million or more.Source: Jury Verdict Research; Insurance Information Institute.
Very sharp jumps in multi-million dollar awards in recent years across virtually all types of defendants
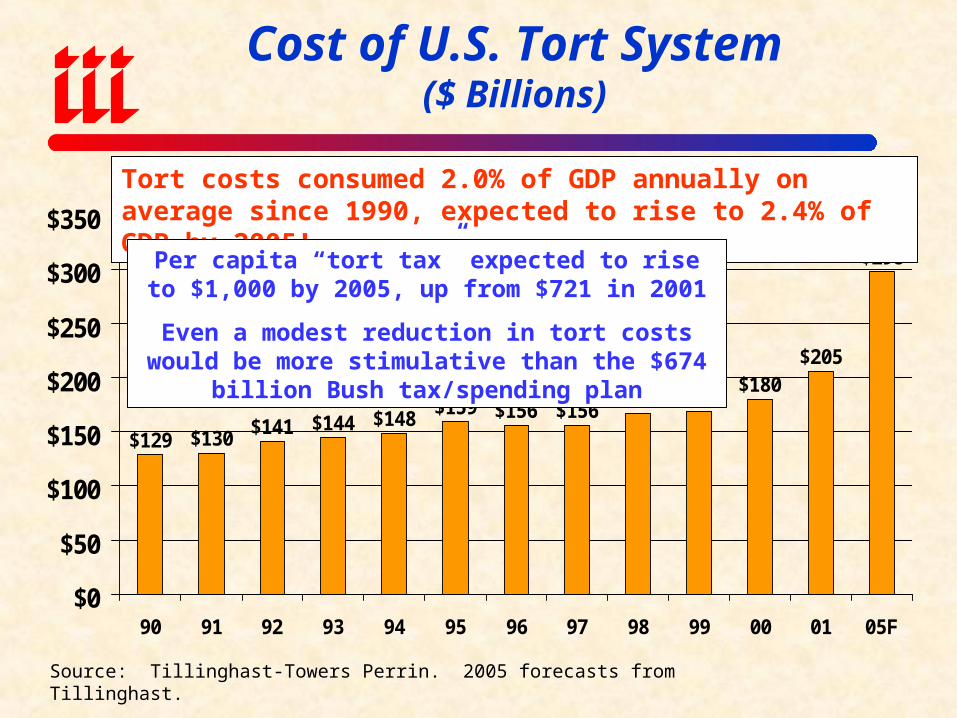
Cost of U.S. Tort System($ Billions)
Source: Tillinghast-Towers Perrin. 2005 forecasts from Tillinghast.
$129 $130$141 $144 $148
$159 $156 $156$167 $169
$180$205
$298
$0
$50
$100
$150
$200
$250
$300
$350
90 91 92 93 94 95 96 97 98 99 00 01 05F
Tort costs consumed 2.0% of GDP annually on average since 1990, expected to rise to 2.4% of GDP by 2005!
Per capita “tort tax” expected to rise to $1,000 by 2005, up from $721 in 2001
Even a modest reduction in tort costs would be more stimulative than the $674 billion Bush tax/spending plan
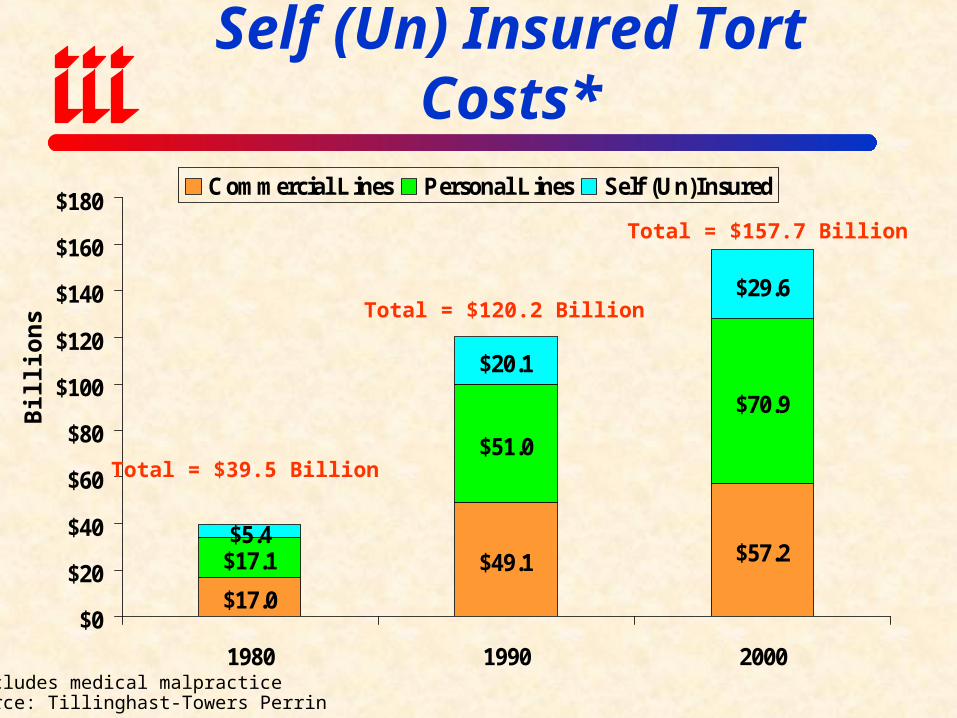
Personal, Commercial & Self (Un) Insured Tort Costs*
$17.0
$49.1 $57.2$17.1
$51.0
$70.9
$5.4
$20.1
$29.6
$0
$20
$40
$60
$80
$100
$120
$140
$160
$180
1980 1990 2000
Commercial Lines Personal Lines Self (Un)Insured
Bil
lion
s
Total = $39.5 Billion
*Excludes medical malpracticeSource: Tillinghast-Towers Perrin
Total = $120.2 Billion
Total = $157.7 Billion
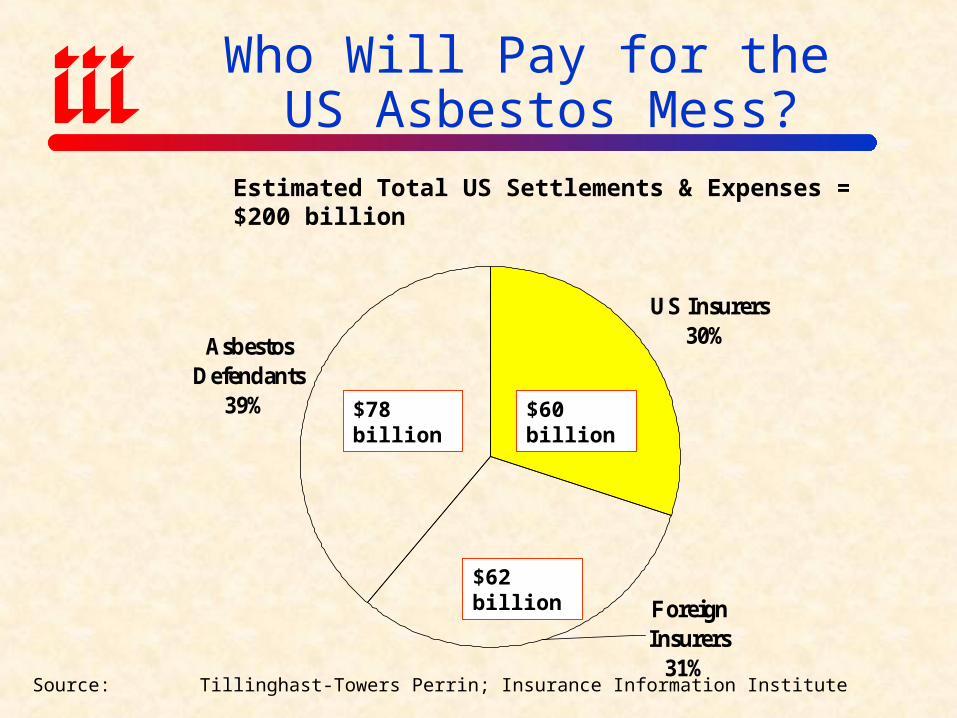
Who Will Pay for the US Asbestos Mess?
Source: Tillinghast-Towers Perrin; Insurance Information Institute
US Insurers30%Asbestos
Defendants39%
Foreign Insurers
31%
Estimated Total US Settlements & Expenses = $200 billion
$78 billion $60 billion
$62 billion
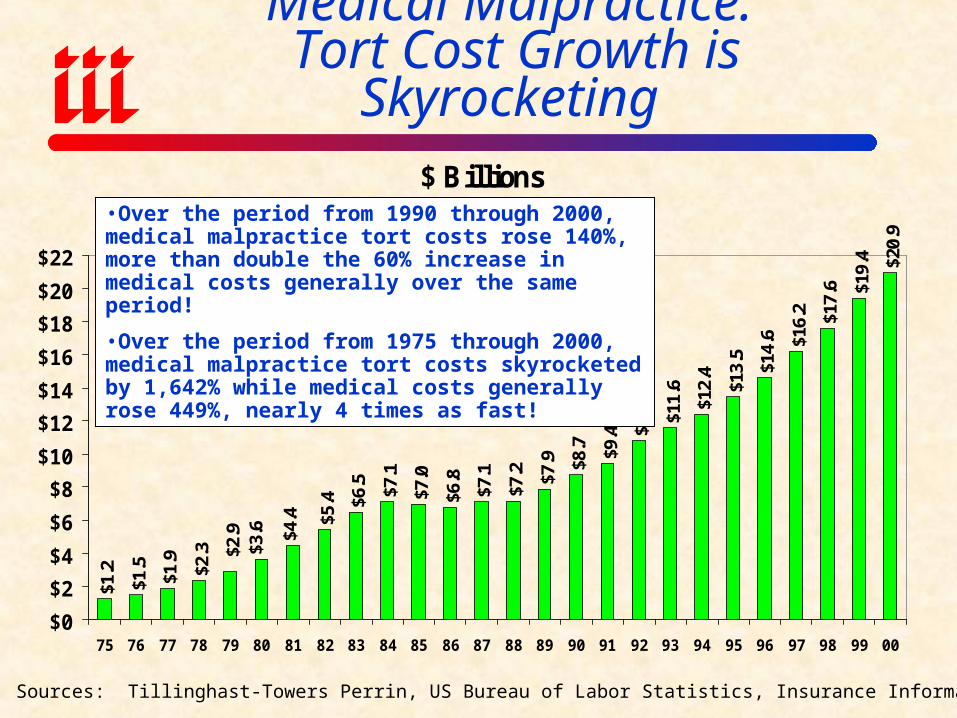
Medical Malpractice: Tort Cost Growth is Skyrocketing
$ Billions
$1.2
$1.5
$1.9
$2.3
$5.4 $6
.5 $7.1
$7.0
$6.8
$7.1
$7.2 $7
.9 $8.7 $9
.4 $10.
8
$11.
6
$12.
4
$13.
5
$14.
6 $16.
2 $17.
6 $19.
4 $20.
9
$2.9
$3.6 $4
.4
$0
$2
$4
$6
$8
$10
$12
$14
$16
$18
$20
$22
75 76 77 78 79 80 81 82 83 84 85 86 87 88 89 90 91 92 93 94 95 96 97 98 99 00
Sources: Tillinghast-Towers Perrin, US Bureau of Labor Statistics, Insurance Information Institute
•Over the period from 1990 through 2000, medical malpractice tort costs rose 140%, more than double the 60% increase in medical costs generally over the same period!
•Over the period from 1975 through 2000, medical malpractice tort costs skyrocketed by 1,642% while medical costs generally rose 449%, nearly 4 times as fast!
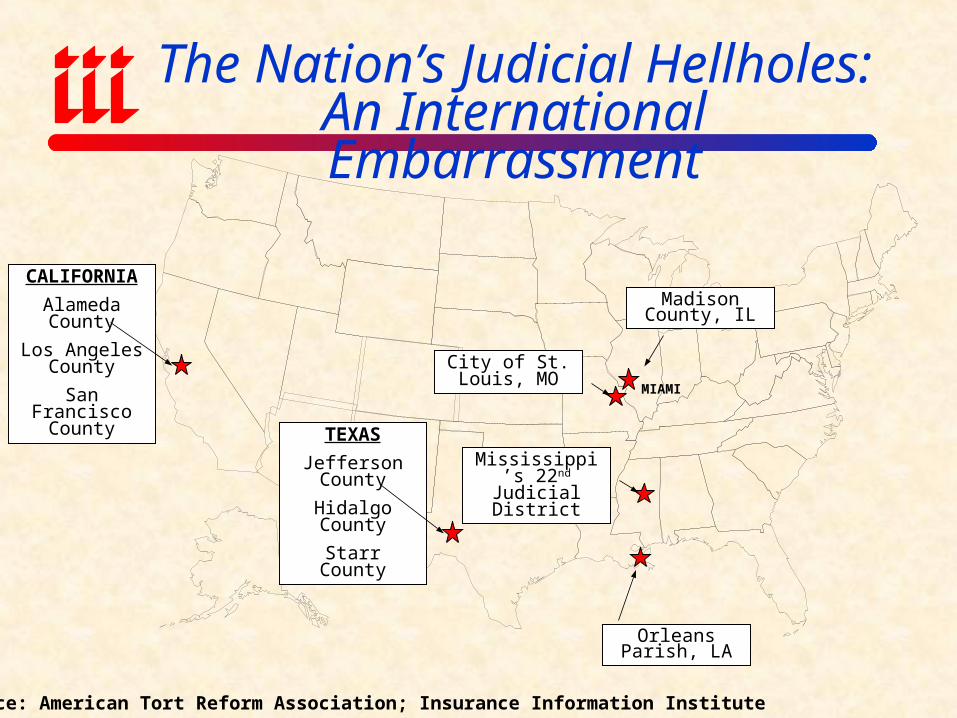
The Nation’s Judicial Hellholes:An International Embarrassment
Source: American Tort Reform Association; Insurance Information Institute
City of St. Louis, MO
CALIFORNIA
Alameda County
Los Angeles County
San Francisco County
Orleans Parish, LA
MIAMI
Madison County, IL
TEXAS
Jefferson County
Hidalgo County
Starr County
Mississippi’s 22nd Judicial
District
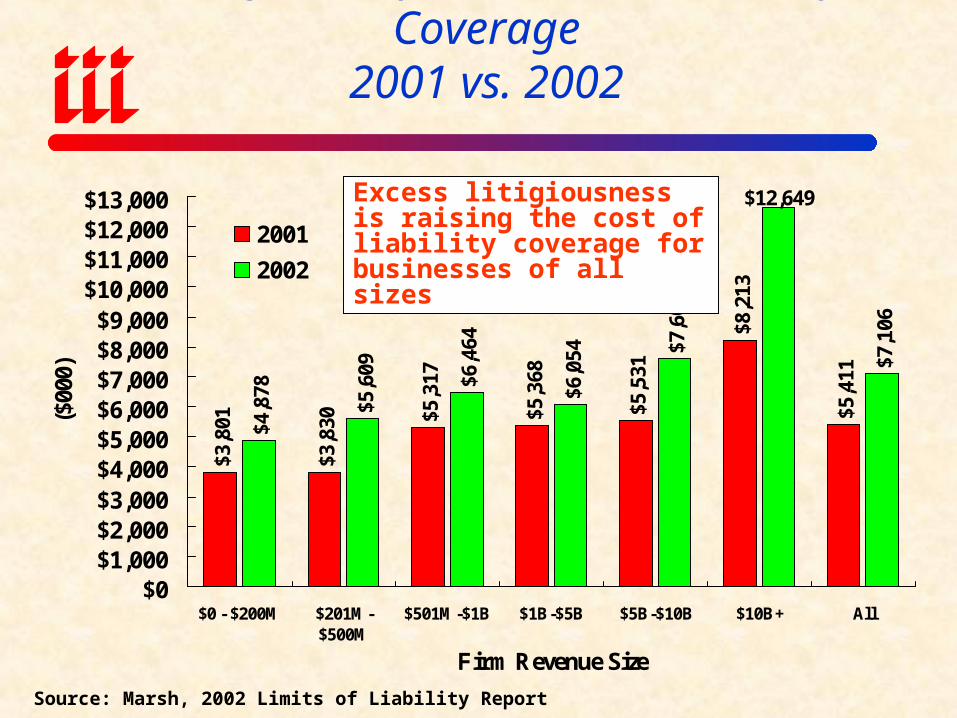
Average Cost per $1 Million Liability Coverage2001 vs. 2002
$3,8
01
$3,8
30 $5,3
17
$5,3
68
$5,5
31
$8,2
13
$5,4
11
$4,8
78
$5,6
09
$6,4
64
$6,0
54 $7,6
06
$7,1
06
$12,649
$0$1,000$2,000$3,000$4,000$5,000$6,000$7,000$8,000$9,000
$10,000$11,000$12,000$13,000
$0 - $200M $201M-$500M
$501M-$1B $1B-$5B $5B-$10B $10B+ All
Firm Revenue Size
($00
0)
2001
2002
Source: Marsh, 2002 Limits of Liability Report
Excess litigiousness is raising the cost of liability coverage for businesses of all sizes
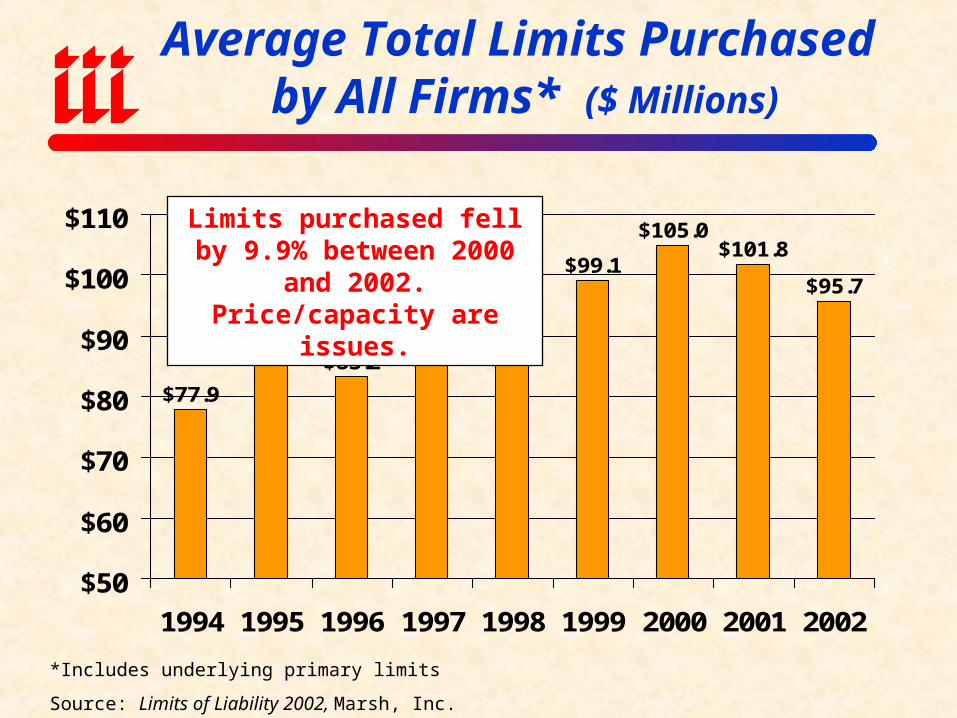
Average Total Limits Purchased by All Firms* ($ Millions)
*Includes underlying primary limits
Source: Limits of Liability 2002, Marsh, Inc.
$77.9
$85.8$83.2
$85.9$88.7
$99.1
$105.0$101.8
$95.7
$50
$60
$70
$80
$90
$100
$110
1994 1995 1996 1997 1998 1999 2000 2001 2002
Limits purchased fell by 9.9% between 2000 and 2002. Price/capacity are issues.
EXAMPLES
Medical Malpractice Asbestos
“Toxic” MoldObesitySARS
Medical Malpractice
ME
NH
MA
CT
PA
WVVA
NC
LA
TX
OK
NE
ND
MN
MI
IL
IA
ID
WA
OR
AZ
HI
NJ
RI
MDDE
AL
VT
NY
DC
SC
GA
TN
AL
FL
MS
ARNM
KYMOKS
SDWI
IN
OH
MT
CA
NV
UT
WY
CO
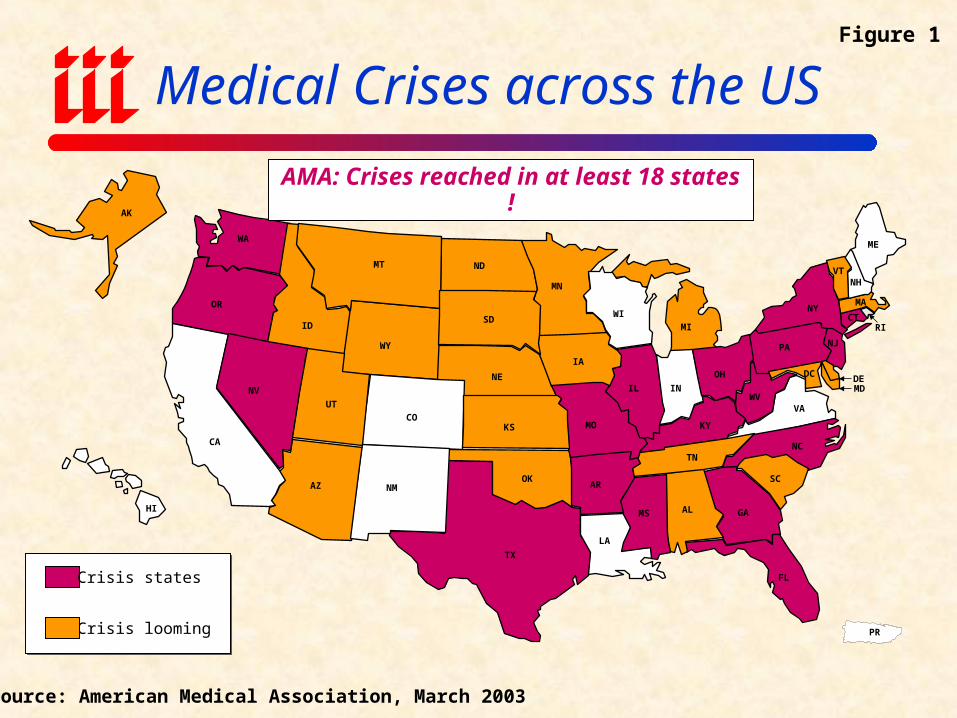
Medical Crises across the US
Crisis states
Crisis looming
AMA: Crises reached in at least 18 states !
PR
AK
Figure 1
Source: American Medical Association, March 2003
103.
7
108.
1
97.6 99
.7 106.
0
107.
9 115.
7
129.
5
133.
5
153.
3
165
108.
8 115.
7
106.
9
108.
4
106.
4
105.
8
101.
6
105.
6
107.
8
110.
0 115.
7
107.
2
127.
9
90
100
110
120
130
140
150
160
170
1991 1992 1993 1994 1995 1996 1997 1998 1999 2000 2001 2002E
Medical Malpractice All Lines Combined Ratio
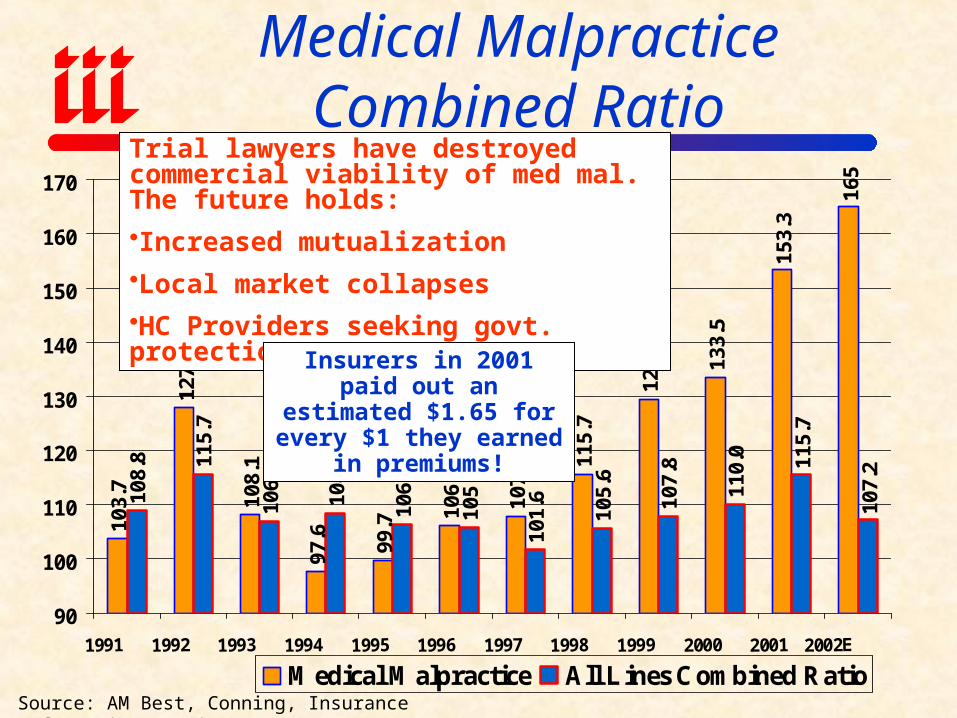
Medical Malpractice Combined Ratio
Source: AM Best, Conning, Insurance Information Institute
Trial lawyers have destroyed commercial viability of med mal. The future holds:
Increased mutualization
Local market collapses
HC Providers seeking govt. protection
Insurers in 2001 paid out an estimated $1.65 for every $1 they earned in premiums!
Asbestos
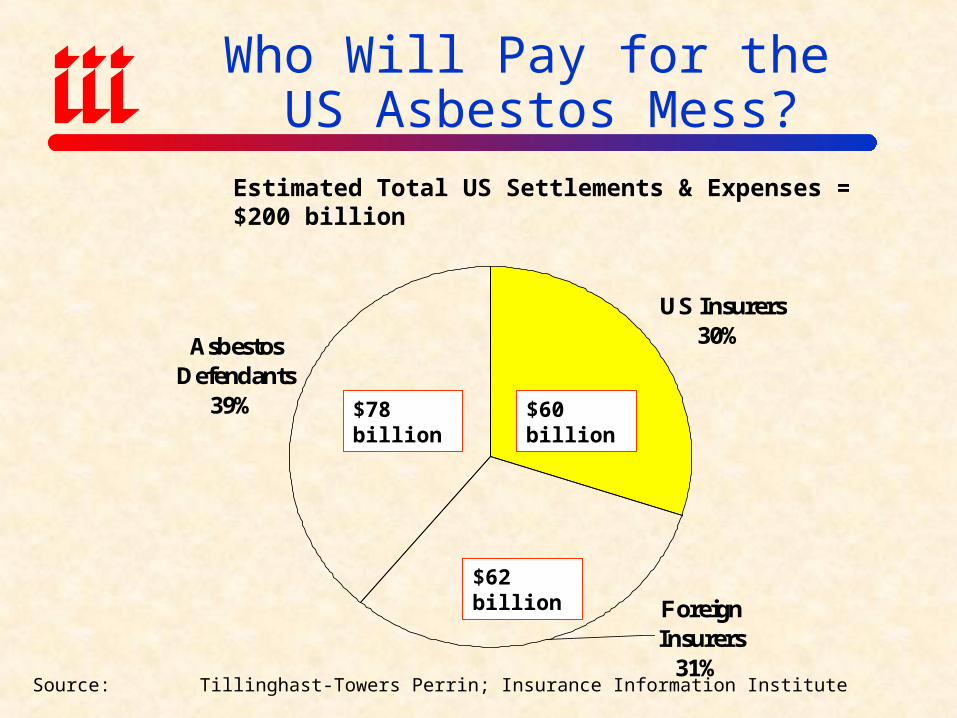
Who Will Pay for the US Asbestos Mess?
Source: Tillinghast-Towers Perrin; Insurance Information Institute
US Insurers30%Asbestos
Defendants39%
Foreign Insurers
31%
Estimated Total US Settlements & Expenses = $200 billion
$78 billion $60 billion
$62 billion
‘Toxic’ Mold
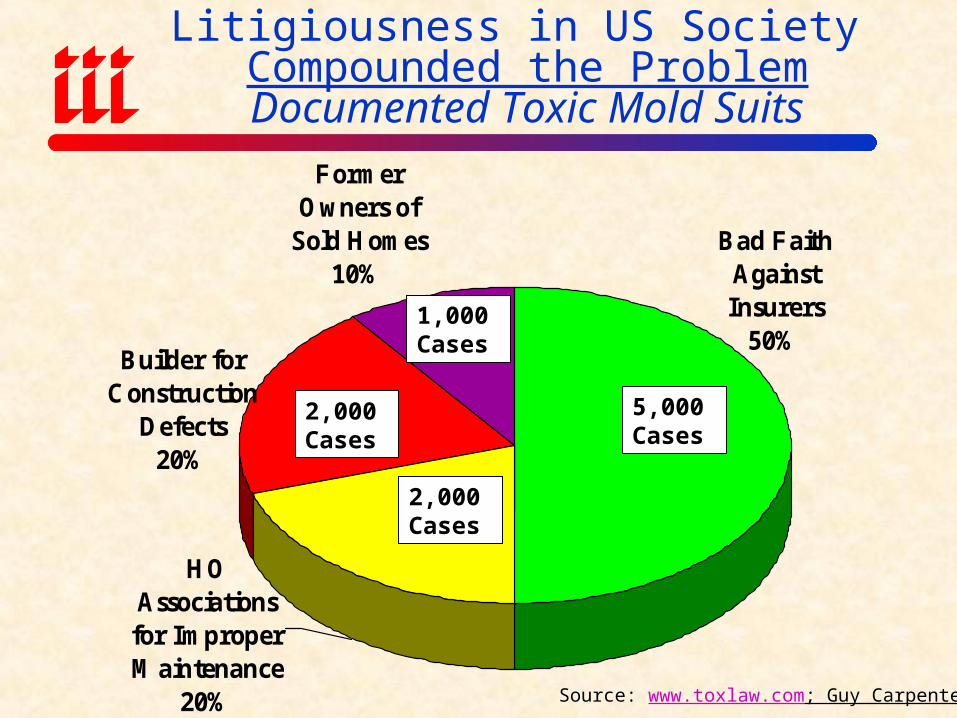
Litigiousness in US Society Compounded the Problem
Documented Toxic Mold SuitsFormer
Owners of Sold Homes
10%Bad Faith
Against Insurers
50%Builder for
Construction Defects
20%
HO Associations
for Improper Maintenance
20% Source: www.toxlaw.com; Guy Carpenter
1,000 Cases
2,000 Cases
5,000 Cases
2,000 Cases
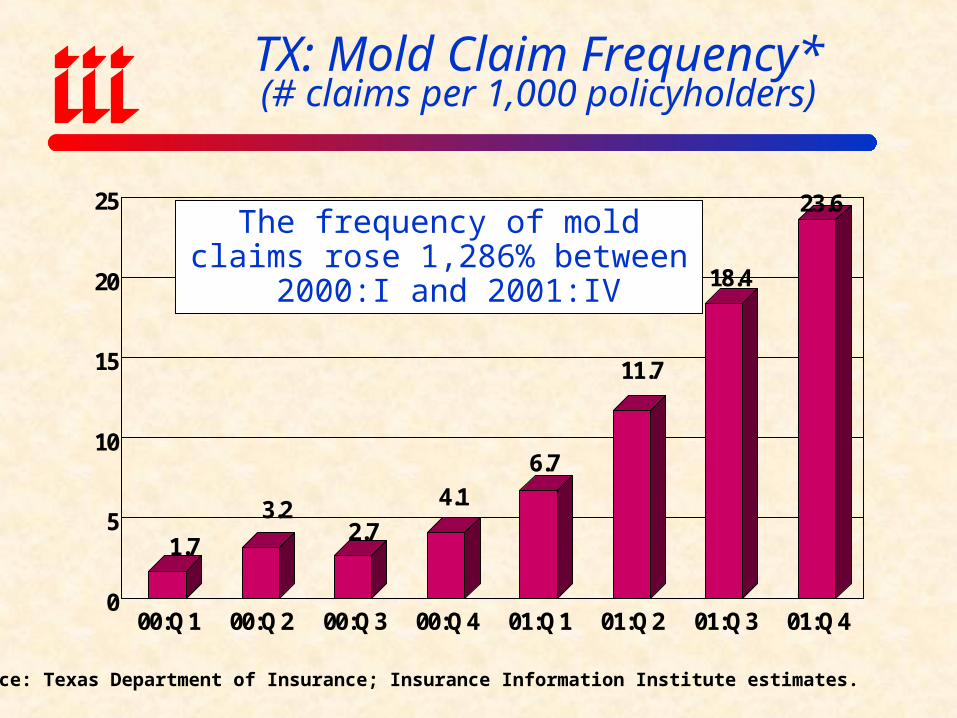
TX: Mold Claim Frequency*(# claims per 1,000 policyholders)
1.7
3.22.7
4.1
6.7
11.7
18.4
23.6
0
5
10
15
20
25
00:Q1 00:Q2 00:Q3 00:Q4 01:Q1 01:Q2 01:Q3 01:Q4
Source: Texas Department of Insurance; Insurance Information Institute estimates.
The frequency of mold claims rose 1,286% between 2000:I and 2001:IV
$0
$50
$100
$150
$200
$250
Wa
ter
Da
ma
ge
Pa
id L
os
se
s*
($M
illio
ns
)
0
5000
10000
15000
20000
25000
30000
Cla
im C
ou
nt
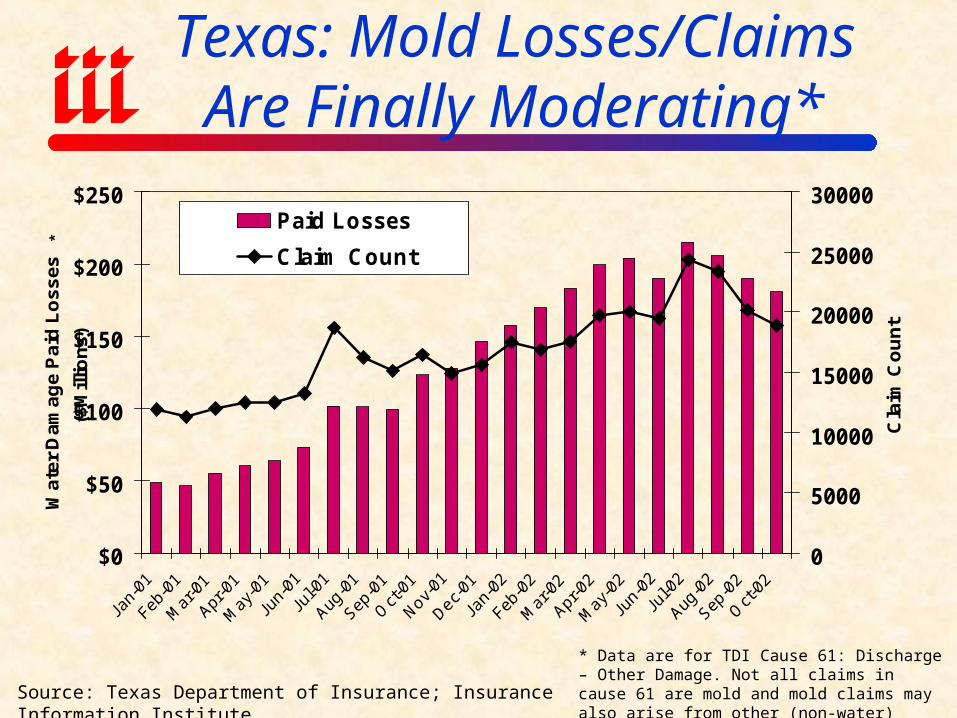
Paid Losses
Claim Count
Source: Texas Department of Insurance; Insurance Information Institute
* Data are for TDI Cause 61: Discharge – Other Damage. Not all claims in cause 61 are mold and mold claims may also arise from other (non-water) causes of loss.
Texas: Mold Losses/Claims Are Finally Moderating*
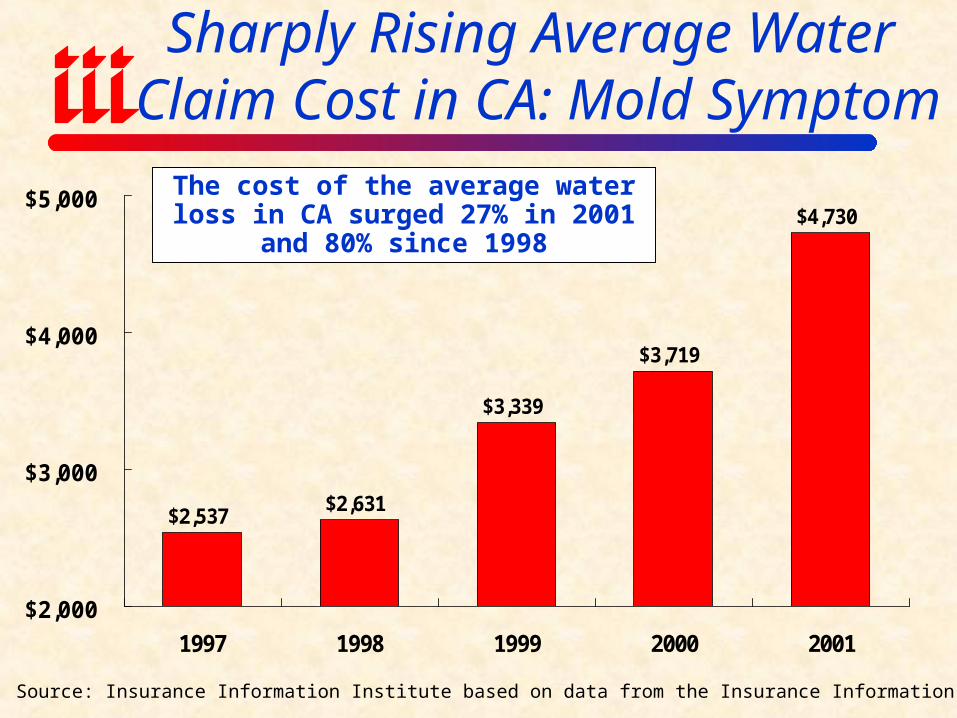
Sharply Rising Average Water Claim Cost in CA: Mold Symptom
$2,537$2,631
$3,339
$3,719
$4,730
$2,000
$3,000
$4,000
$5,000
1997 1998 1999 2000 2001
Source: Insurance Information Institute based on data from the Insurance Information Network of California;
The cost of the average water loss in CA surged 27% in 2001 and 80% since 1998
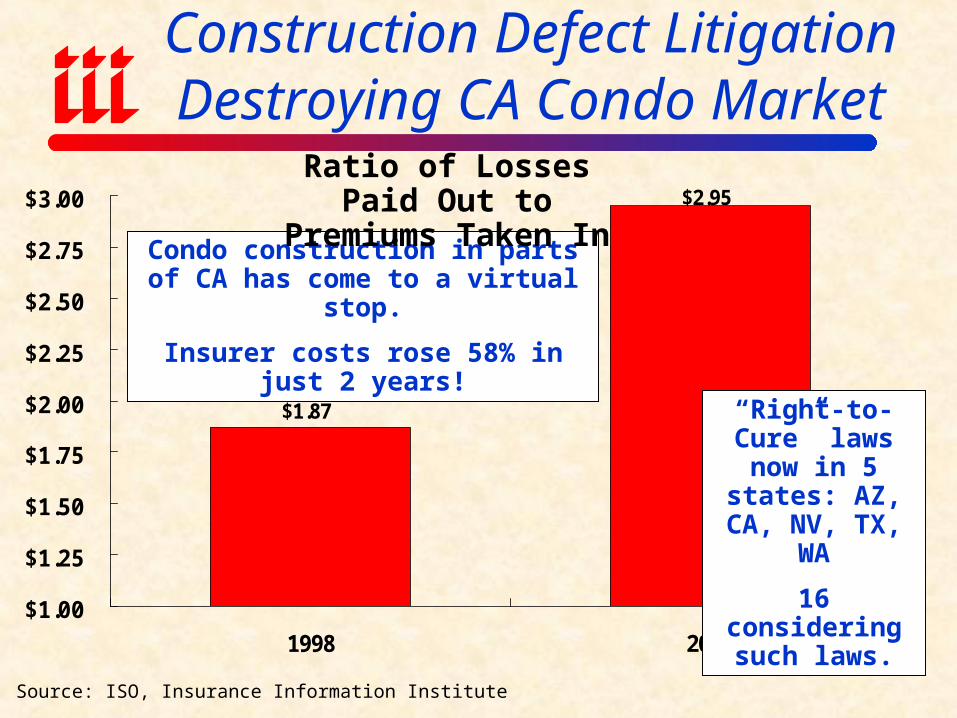
Construction Defect Litigation Destroying CA Condo Market
$1.87
$2.95
$1.00
$1.25
$1.50
$1.75
$2.00
$2.25
$2.50
$2.75
$3.00
1998 2000
Source: ISO, Insurance Information Institute
Condo construction in parts of CA has come to a virtual stop.
Insurer costs rose 58% in just 2 years!
Ratio of Losses Paid Out to Premiums Taken In
“Right-to-Cure” laws now in 5
states: AZ, CA, NV, TX, WA
16 considering such laws.
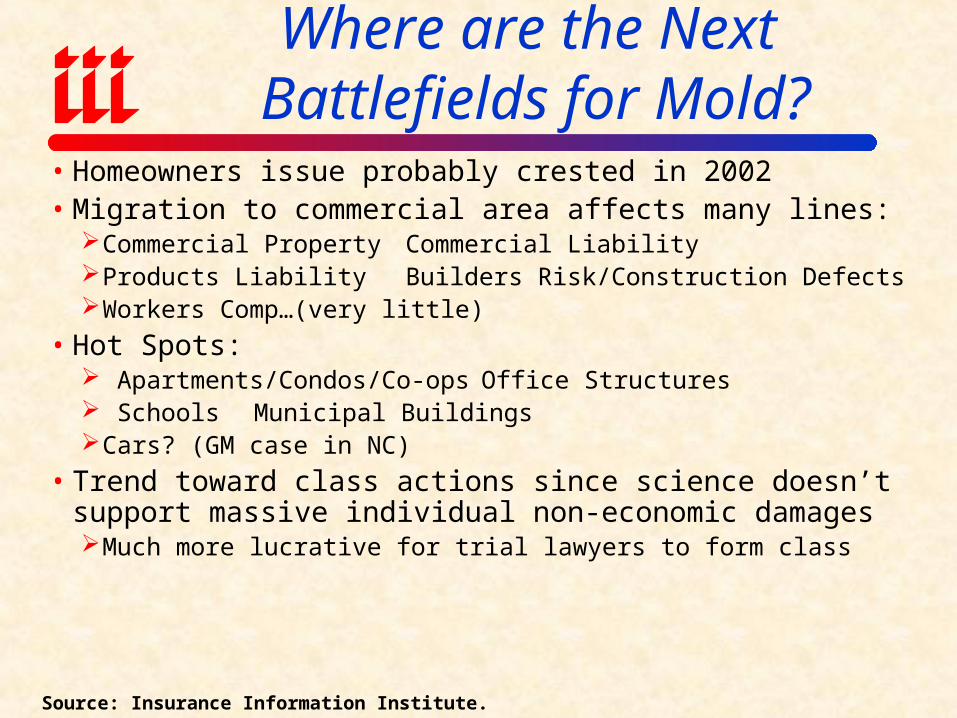
Where are the Next Battlefields for Mold?
• Homeowners issue probably crested in 2002• Migration to commercial area affects many lines:
Commercial Property Commercial LiabilityProducts Liability Builders Risk/Construction DefectsWorkers Comp…(very little)
• Hot Spots: Apartments/Condos/Co-ops Office Structures Schools Municipal BuildingsCars? (GM case in NC)
• Trend toward class actions since science doesn’t support massive individual non-economic damagesMuch more lucrative for trial lawyers to form class
Source: Insurance Information Institute.
Obesity
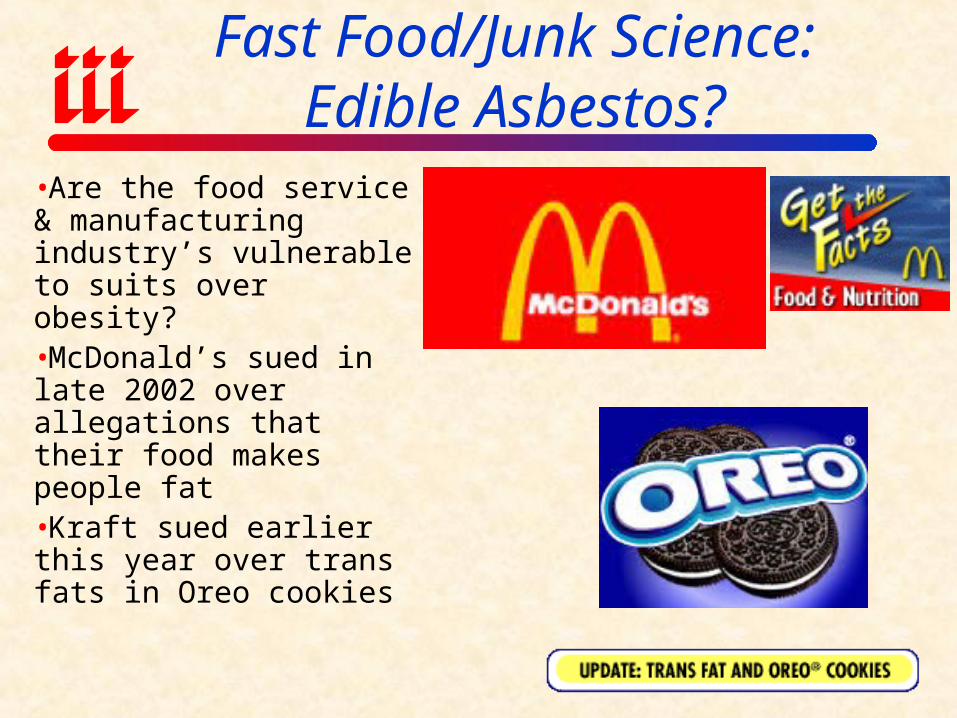
Fast Food/Junk Science:Edible Asbestos?
•Are the food service & manufacturing industry’s vulnerable to suits over obesity?•McDonald’s sued in late 2002 over allegations that their food makes people fat•Kraft sued earlier this year over trans fats in Oreo cookies
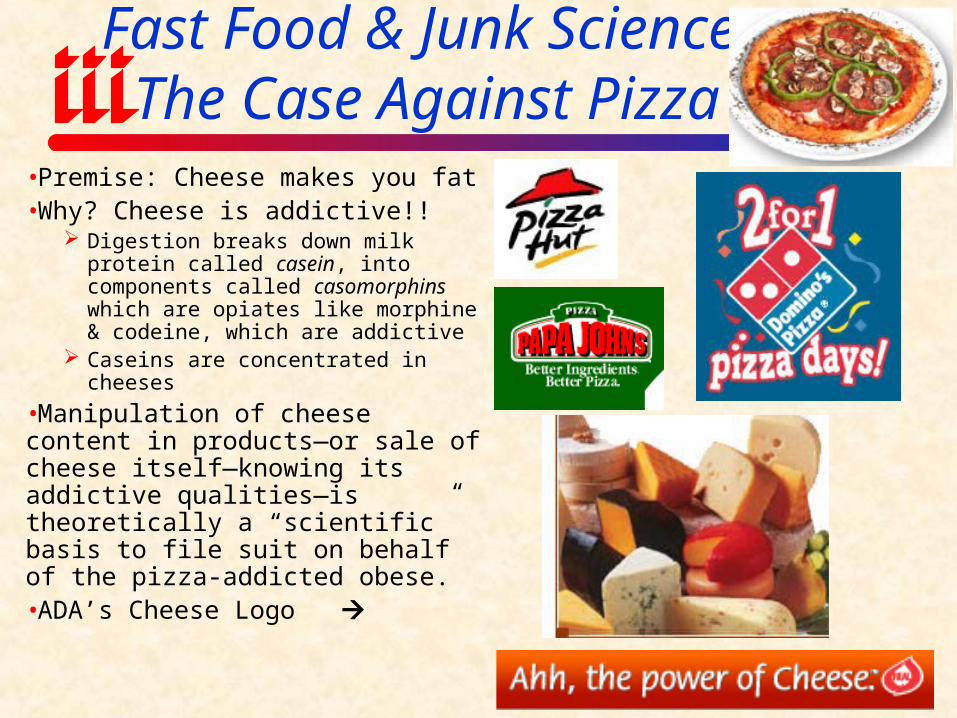
Fast Food & Junk Science:The Case Against Pizza
•Premise: Cheese makes you fat•Why? Cheese is addictive!!
Digestion breaks down milk protein called casein, into components called casomorphins which are opiates like morphine & codeine, which are addictive
Caseins are concentrated in cheeses
•Manipulation of cheese content in products—or sale of cheese itself—knowing its addictive qualities—is theoretically a “scientific” basis to file suit on behalf of the pizza-addicted obese.•ADA’s Cheese Logo
SARS:
A Threat to the P/C Insurance Industry?
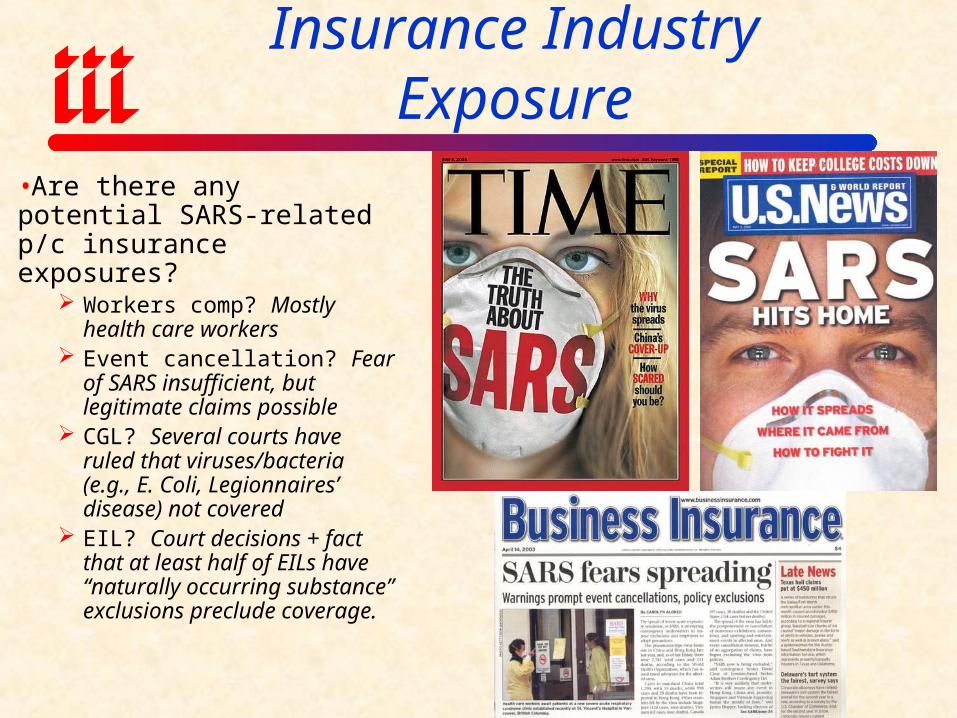
SARS: Limited P/C Insurance Industry Exposure
•Are there any potential SARS-related p/c insurance exposures?
Workers comp? Mostly health care workers
Event cancellation? Fear of SARS insufficient, but legitimate claims possible
CGL? Several courts have ruled that viruses/bacteria (e.g., E. Coli, Legionnaires’ disease) not covered
EIL? Court decisions + fact that at least half of EILs have “naturally occurring substance” exclusions preclude coverage.
Legend #6:Insurers are Awash in Cash and Have More Money than They Know What to Do With
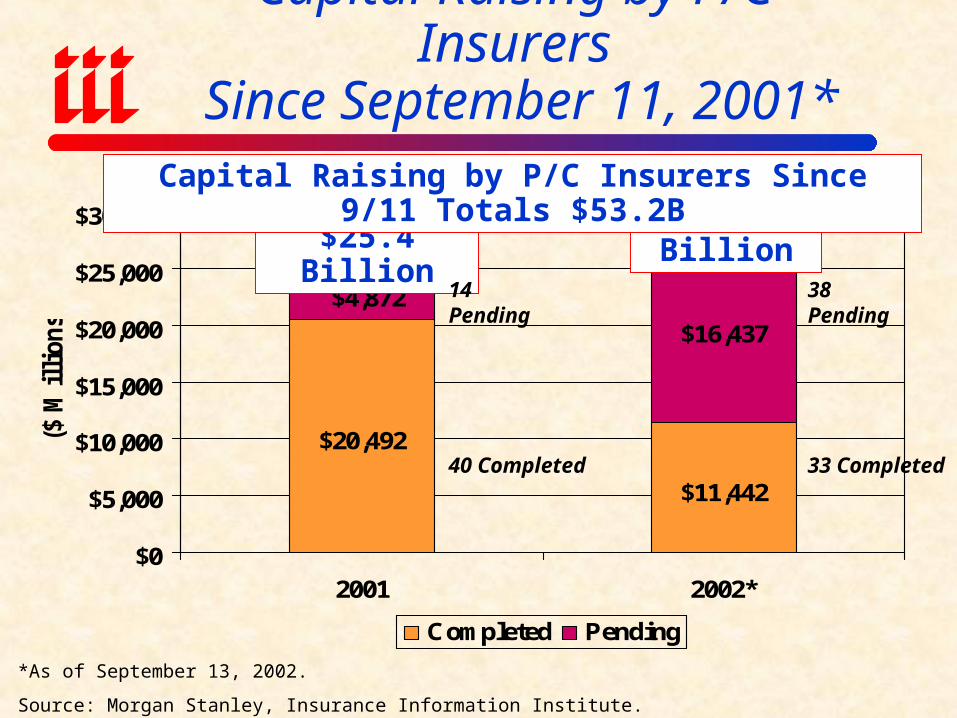
Capital Raising by P/C Insurers Since September 11, 2001*
$20,492
$11,442
$16,437
$4,872
$0
$5,000
$10,000
$15,000
$20,000
$25,000
$30,000
2001 2002*
($ M
illi
on
s)
Completed Pending
$25.4 Billion$27.9 Billion
*As of September 13, 2002.
Source: Morgan Stanley, Insurance Information Institute.
14 Pending 38 Pending
40 Completed 33 Completed
Capital Raising by P/C Insurers Since 9/11 Totals $53.2B
$0
$50
$100
$150
$200
$250
$300
$350
75 76 77 78 79 80 81 82 83 84 85 86 87 88 89 90 91 92 93 94 95 96 97 98 99 00 01 02
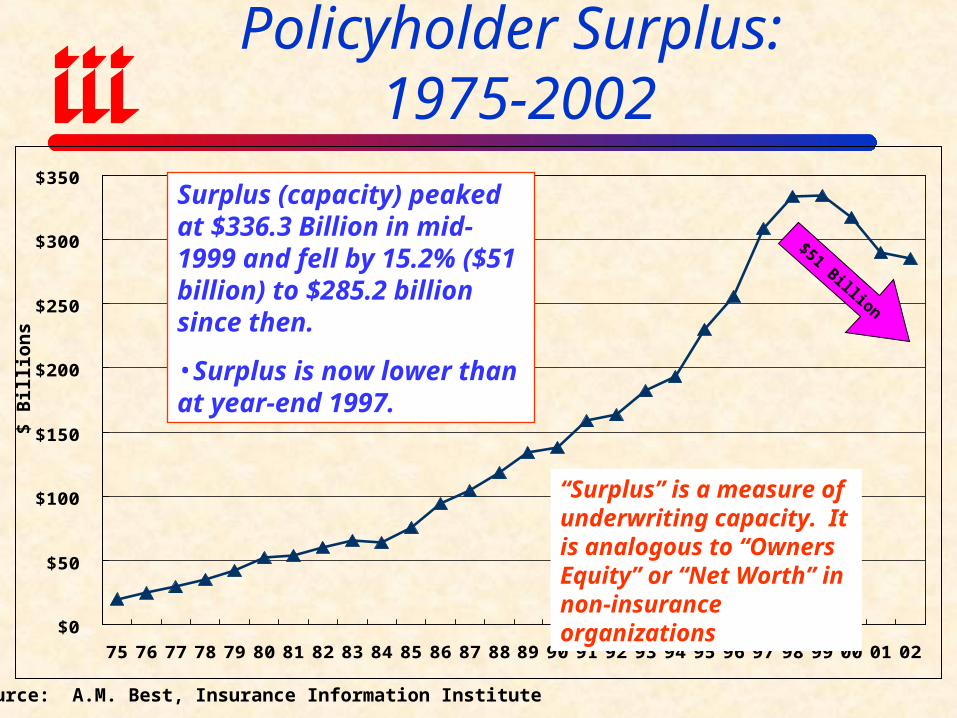
Policyholder Surplus: 1975-2002
Source: A.M. Best, Insurance Information Institute
$ B
illi
ons
Surplus (capacity) peaked at $336.3 Billion in mid-1999 and fell by 15.2% ($51 billion) to $285.2 billion since then.
•Surplus is now lower than at year-end 1997.
“Surplus” is a measure of underwriting capacity. It is analogous to “Owners Equity” or “Net Worth” in non-insurance organizations
$51 Billion
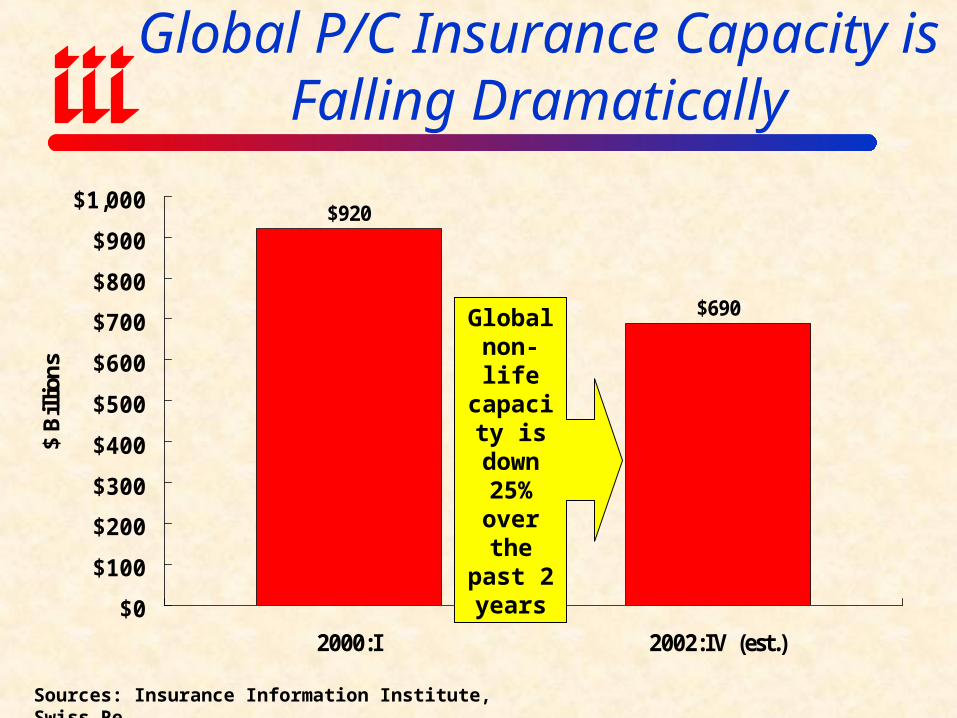
Global P/C Insurance Capacity is Falling Dramatically
$920
$690
$0
$100
$200
$300
$400
$500
$600
$700
$800
$900
$1,000
2000:I 2002:IV (est.)
$ B
illio
ns
Sources: Insurance Information Institute, Swiss Re
Global non-life capacity is down
25% over the past 2 years
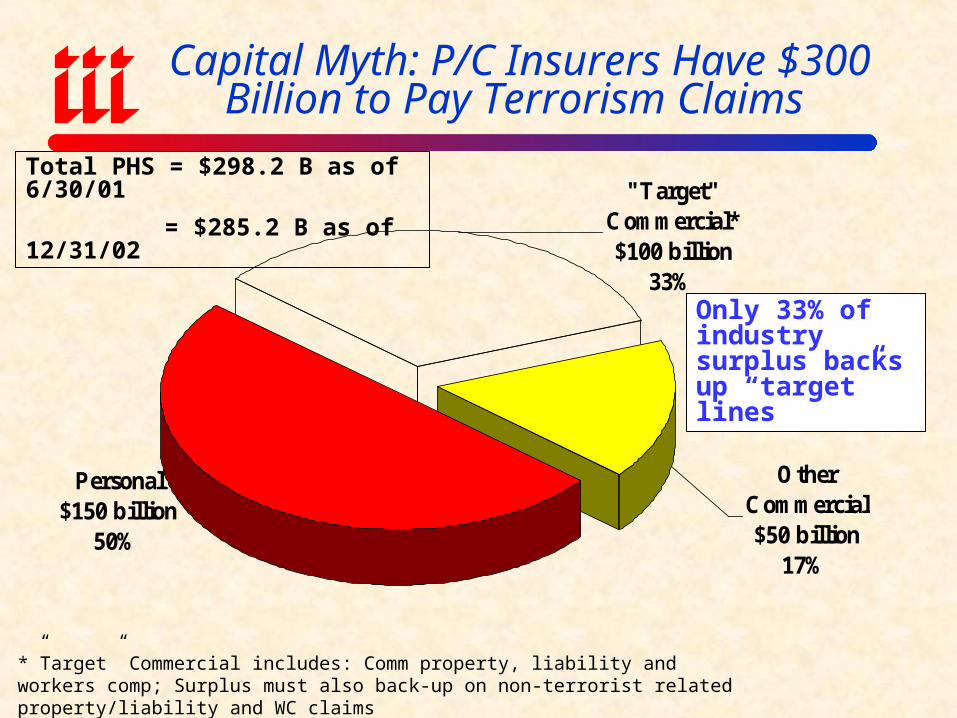
Capital Myth: P/C Insurers Have $300 Billion to Pay Terrorism Claims
"Target" Commercial*$100 billion
33%
Other Commercial$50 billion
17%
Personal$150 billion
50%
Total PHS = $298.2 B as of 6/30/01
= $285.2 B as of 12/31/02
*”Target” Commercial includes: Comm property, liability and workers comp; Surplus must also back-up on non-terrorist related property/liability and WC claimsSource: Insurance Information Institute
Only 33% of industry surplus backs up “target” lines
Legend #7: Insurers are “Redlining”
Businesses in the Wake of 9/11
89.9
%
85.5
%
81.1
%
69.2
% 84.2
%
51.1
%
73.3
%
65.1
%
85.0
%
82.4
%
79.2
%
67.2
% 82.5
%
49.2
%
69.9
%
63.6
%
0%
10%
20%
30%
40%
50%
60%
70%
80%
90%
100%
Prior to 9/11/01 Currently
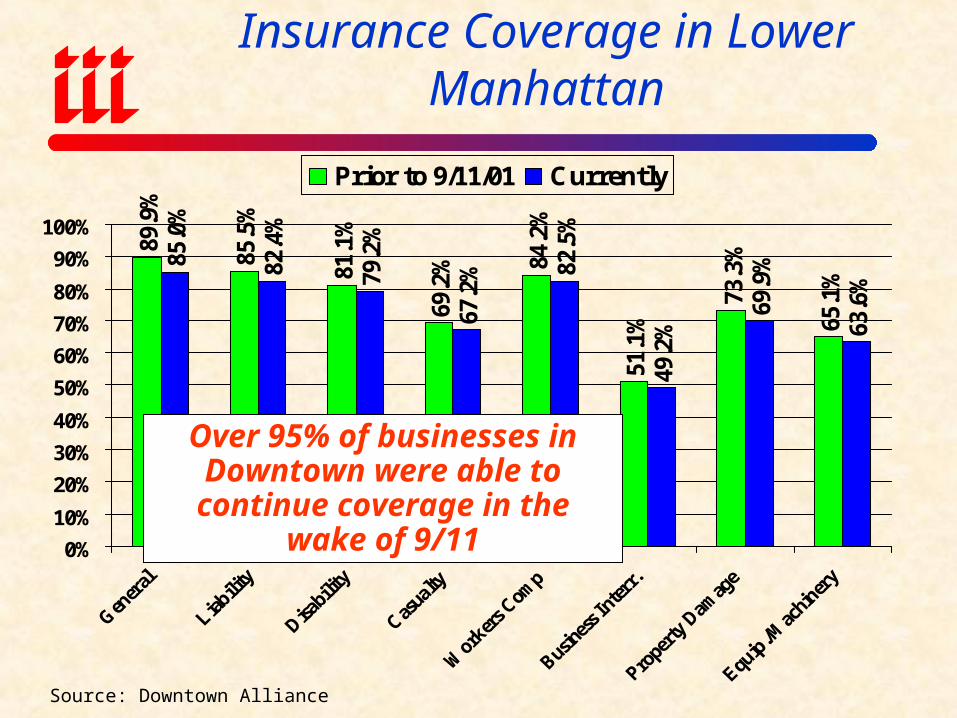
Insurance Coverage in Lower Manhattan
Source: Downtown Alliance
Over 95% of businesses in Downtown were able to continue
coverage in the wake of 9/11
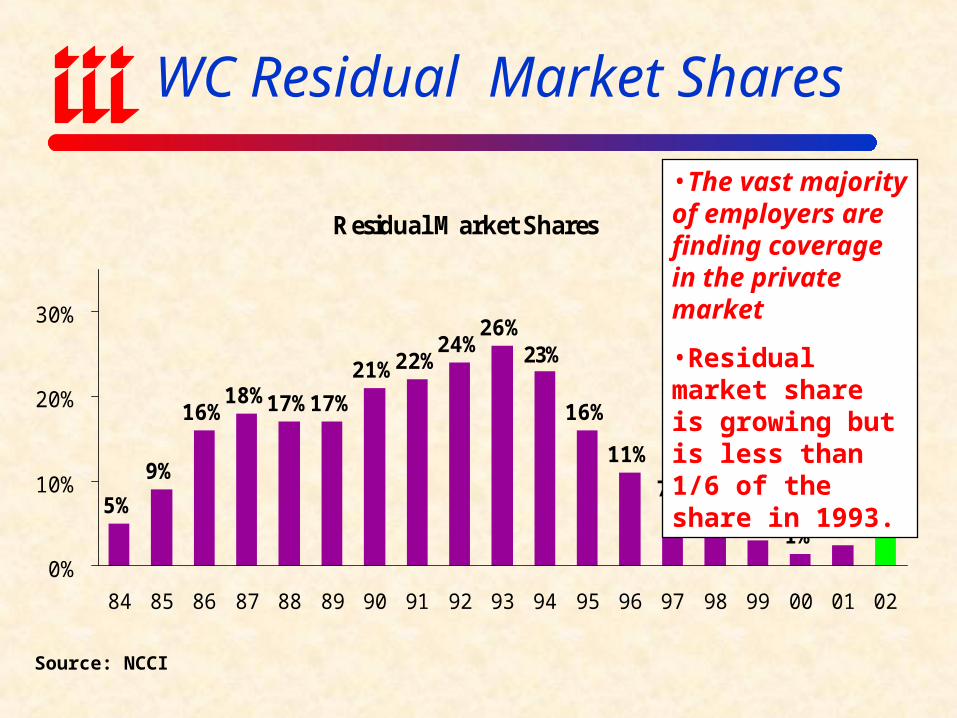
WC Residual Market Shares
Source: NCCI
Residual Market Shares
5%
9%
16%18%17%17%
21%22%24%
26%
16%
11%
7%4% 3%
1% 2%4%
23%
0%
10%
20%
30%
84 85 86 87 88 89 90 91 92 93 94 95 96 97 98 99 00 01 02
•The vast majority of employers are finding coverage in the private market
•Residual market share is growing but is less than 1/6 of the share in 1993.
Legend #8:TRIA Has Solved the Industry’s Terrorism Exposure Problems
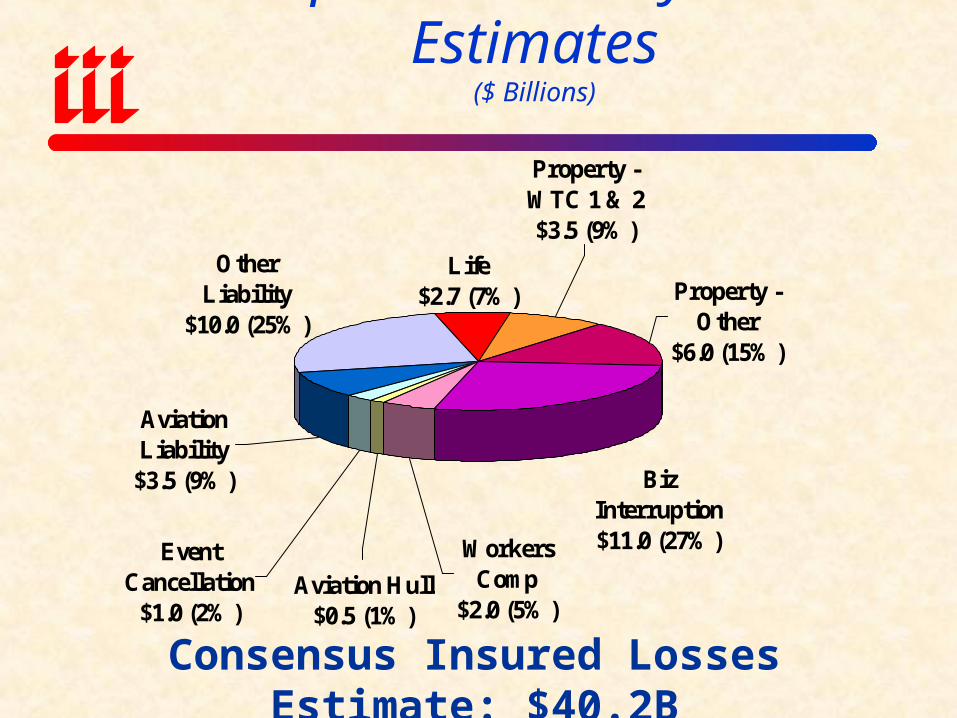
Sept. 11 Industry Loss Estimates($ Billions)
Life$2.7 (7%)
Aviation Liability$3.5 (9%)
Other Liability
$10.0 (25%)
Biz Interruption$11.0 (27%)
Property -WTC 1 & 2$3.5 (9%)
Property - Other
$6.0 (15%)
Aviation Hull$0.5 (1%)
Event Cancellation
$1.0 (2%)
Workers Comp
$2.0 (5%)
Consensus Insured Losses Estimate: $40.2BSource: Insurance Information Institute
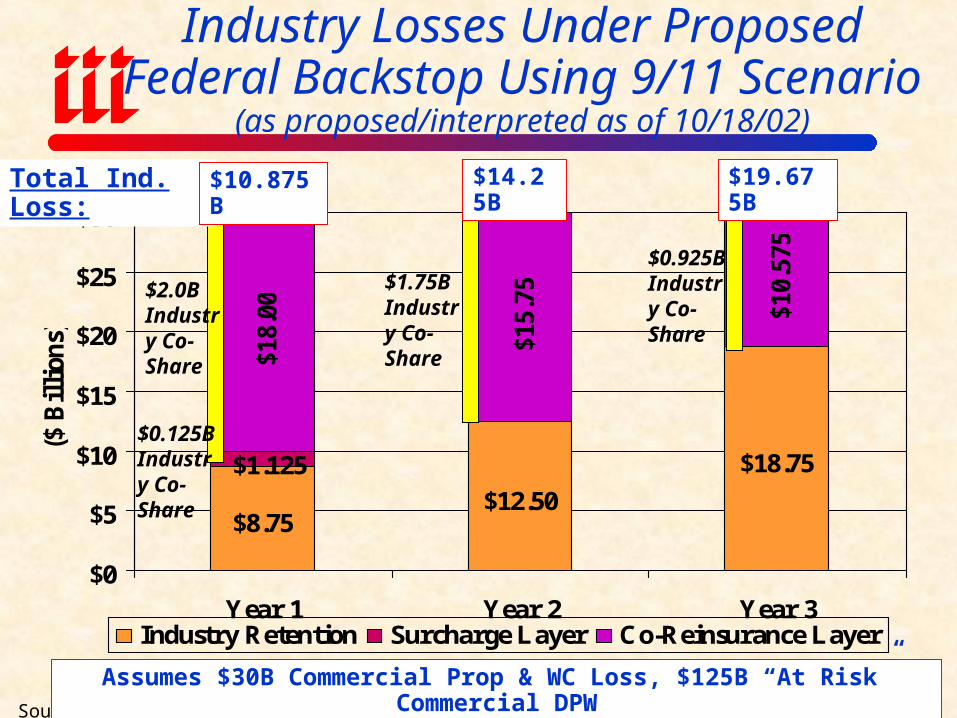
Industry Losses Under Proposed Federal Backstop Using 9/11 Scenario
(as proposed/interpreted as of 10/18/02)
$8.75$12.50
$18.75$1.125
$10.
575
$15.
75
$18.
00
$0
$5
$10
$15
$20
$25
$30
Year 1 Year 2 Year 3
($ B
illi
ons)
Industry Retention Surcharge Layer Co-Reinsurance Layer
Source: Insurance Information Institute.
$1.75B Industry Co-Share
Assumes $30B Commercial Prop & WC Loss, $125B “At Risk” Commercial DPW
$2.0B Industry Co-Share
$0.925B Industry Co-Share
$0.125B Industry Co-Share
Total Ind. Loss: $10.875B $14.25B $19.675B

Legend #9: Wall Street Investors Should
be Satisfied With Insurer Stock Performance
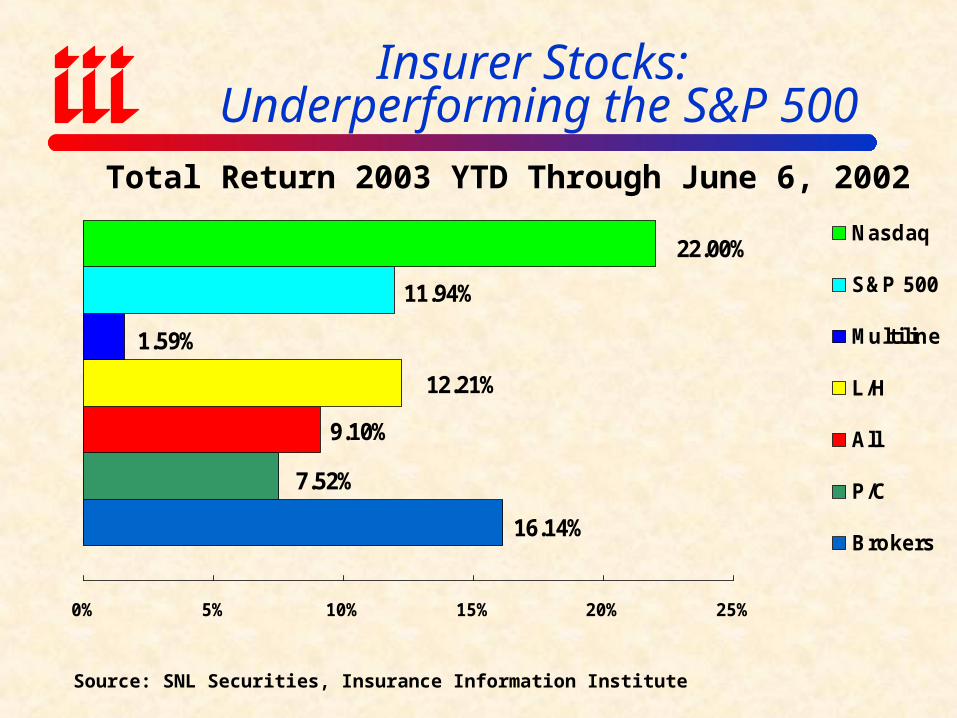
Insurer Stocks: Underperforming the S&P 500
16.14%
7.52%
9.10%
12.21%
1.59%
11.94%
22.00%
0% 5% 10% 15% 20% 25%
Nasdaq
S&P 500
Multiline
L/H
All
P/C
Brokers
Source: SNL Securities, Insurance Information Institute
Total Return 2003 YTD Through June 6, 2002
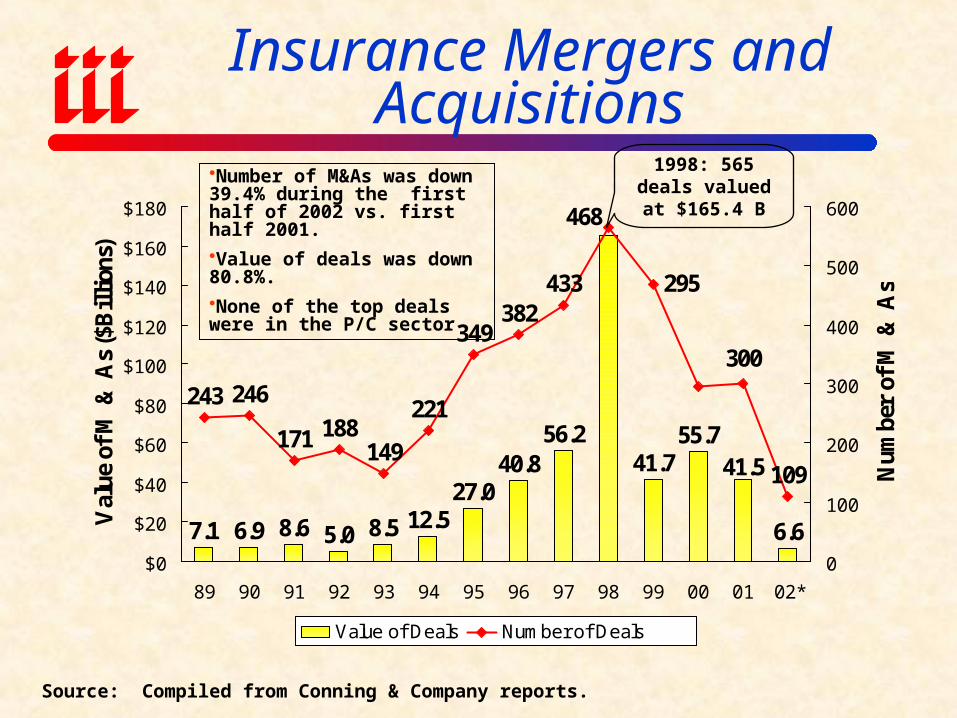
Insurance Mergers and Acquisitions
7.1 6.9 8.6 5.0 8.5 12.527.0
40.856.2
41.755.7
6.6
41.5
243 246
171 188149
221
349382
433
109
300
295
468
$0
$20
$40
$60
$80
$100
$120
$140
$160
$180
89 90 91 92 93 94 95 96 97 98 99 00 01 02*
Val
ue o
f M
& A
s ($
Bil
lion
s)
0
100
200
300
400
500
600
Num
ber
of M
& A
s
Value of Deals Number of Deals
Source: Compiled from Conning & Company reports.
1998: 565 deals valued at $165.4 B
Number of M&As was down 39.4% during the first half of 2002 vs. first half 2001.
Value of deals was down 80.8%.
None of the top deals were in the P/C sector

Insurance Information Institute On-Line
If you would like a copy of this presentation, please give me your business card with e-mail address