Embed Size (px)
Citation preview
Rising Auto CostsCasualty Actuarial Society Annual Meeting
November 7, 2017
James Lynch, FCAS MAAA, Chief Actuary
Insurance Information Institute 110 William Street New York, NY 10038 Tel: 212.346.5533 [email protected] www.iii.org

Personal Auto
Rising Frequency, Severity Pinching the Largest P/C Line
3
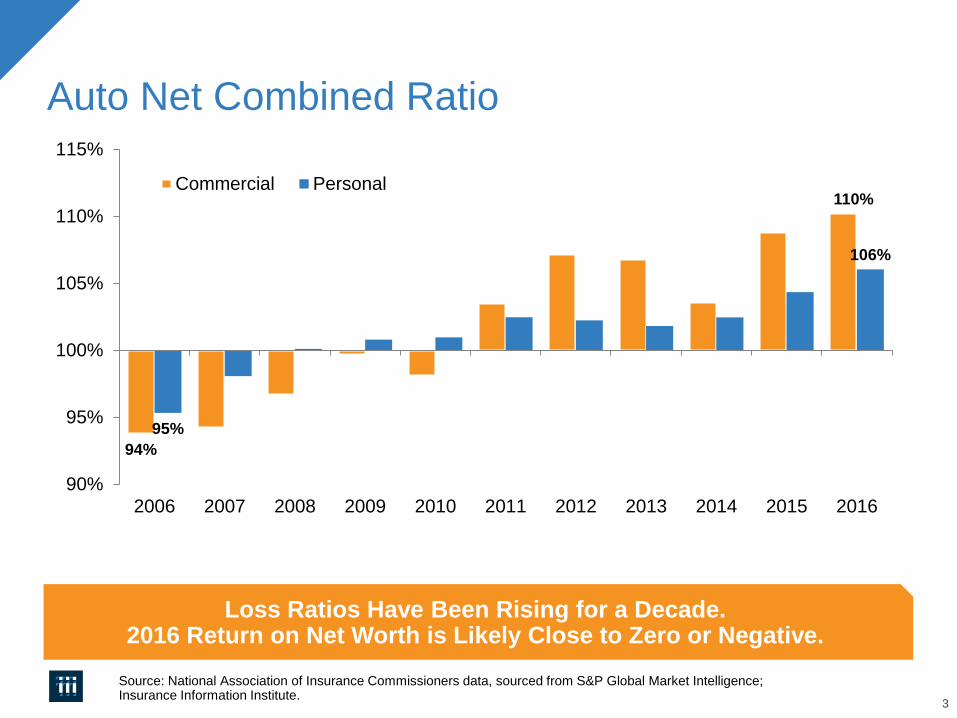
Auto Net Combined Ratio
Source: National Association of Insurance Commissioners data, sourced from S&P Global Market Intelligence;Insurance Information Institute.
Loss Ratios Have Been Rising for a Decade. 2016 Return on Net Worth is Likely Close to Zero or Negative.
94%
110%
95%
106%
90%
95%
100%
105%
110%
115%
2006 2007 2008 2009 2010 2011 2012 2013 2014 2015 2016
Commercial Personal
4
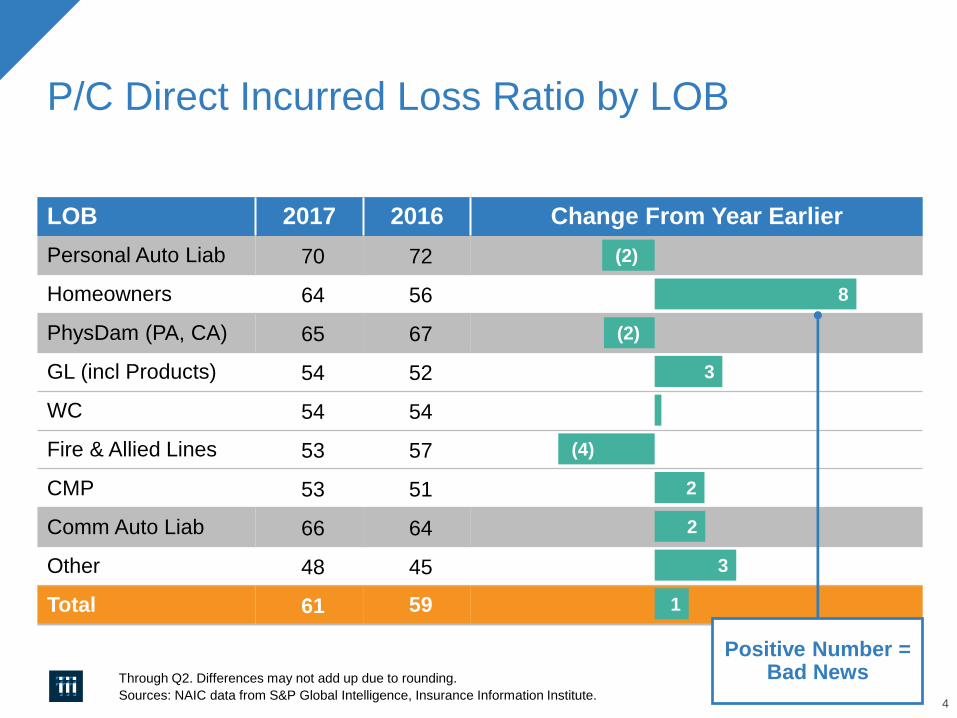
P/C Direct Incurred Loss Ratio by LOB
Through Q2. Differences may not add up due to rounding.
Sources: NAIC data from S&P Global Intelligence, Insurance Information Institute.
LOB 2017 2016 Change From Year Earlier
Personal Auto Liab 70 72
Homeowners 64 56
PhysDam (PA, CA) 65 67
GL (incl Products) 54 52
WC 54 54
Fire & Allied Lines 53 57
CMP 53 51
Comm Auto Liab 66 64
Other 48 45
Total 61 59
(2)
8
(2)
3
0
(4)
2
2
3
1
Positive Number = Bad News
5
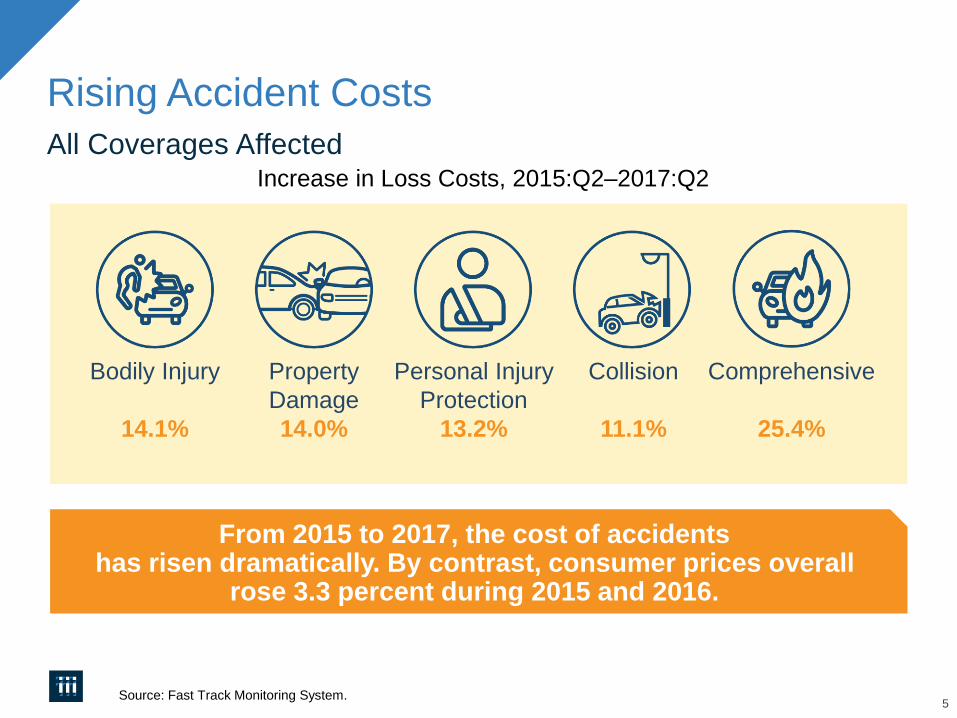
Rising Accident Costs
Source: Fast Track Monitoring System.
From 2015 to 2017, the cost of accidents has risen dramatically. By contrast, consumer prices overall
rose 3.3 percent during 2015 and 2016.
Increase in Loss Costs, 2015:Q2–2017:Q2
Bodily Injury
14.1%
Property
Damage
14.0%
Personal Injury
Protection
13.2%
Collision
11.1%
Comprehensive
25.4%
All Coverages Affected
6
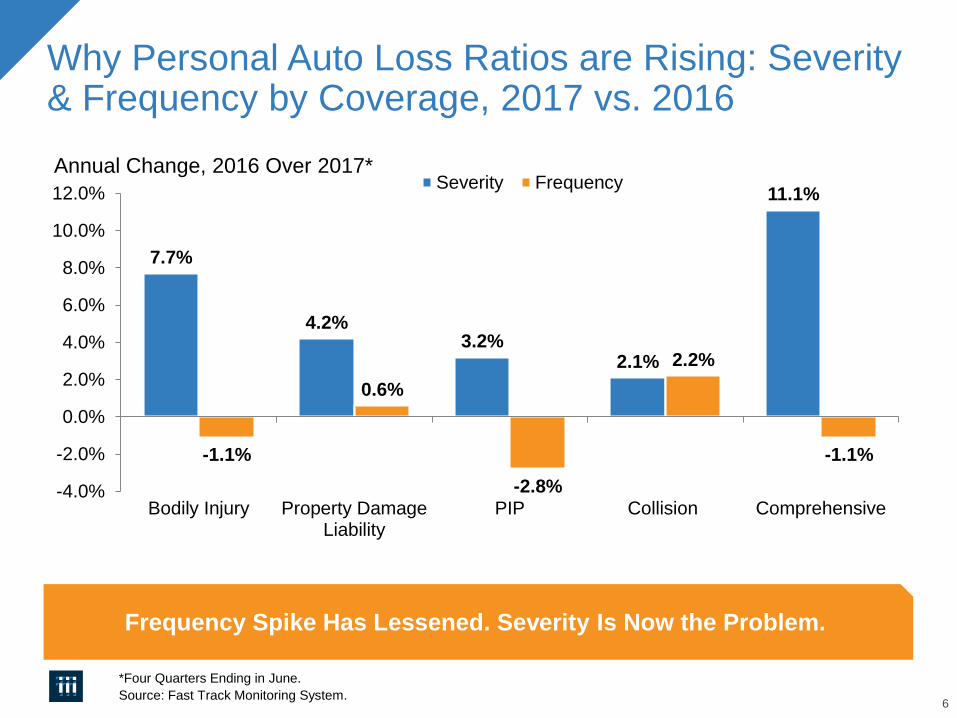
Why Personal Auto Loss Ratios are Rising: Severity & Frequency by Coverage, 2017 vs. 2016
*Four Quarters Ending in June.
Source: Fast Track Monitoring System.
Frequency Spike Has Lessened. Severity Is Now the Problem.
7.7%
4.2%3.2%
2.1%
11.1%
-1.1%
0.6%
-2.8%
2.2%
-1.1%
-4.0%
-2.0%
0.0%
2.0%
4.0%
6.0%
8.0%
10.0%
12.0%
Bodily Injury Property DamageLiability
PIP Collision Comprehensive
Severity FrequencyAnnual Change, 2016 Over 2017*
Claim Trends by Coverage
Focus on Collision
8
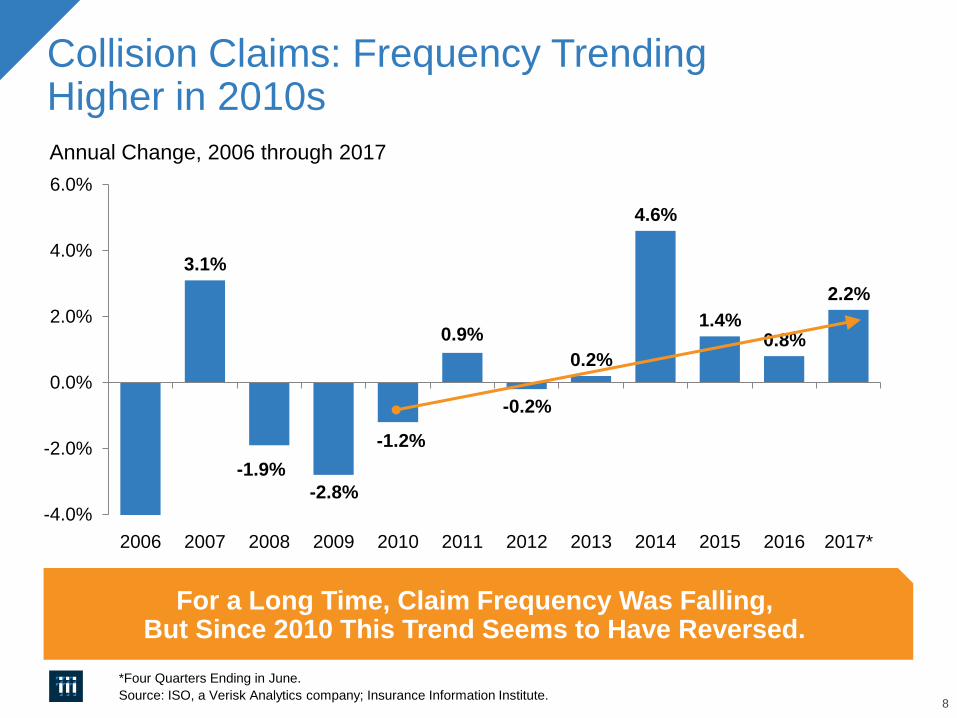
Collision Claims: Frequency TrendingHigher in 2010s
Annual Change, 2006 through 2017
*Four Quarters Ending in June.
Source: ISO, a Verisk Analytics company; Insurance Information Institute.
For a Long Time, Claim Frequency Was Falling, But Since 2010 This Trend Seems to Have Reversed.
3.1%
-1.9%
-2.8%
-1.2%
0.9%
-0.2%
0.2%
4.6%
1.4%0.8%
2.2%
-4.0%
-2.0%
0.0%
2.0%
4.0%
6.0%
2006 2007 2008 2009 2010 2011 2012 2013 2014 2015 2016 2017*
9
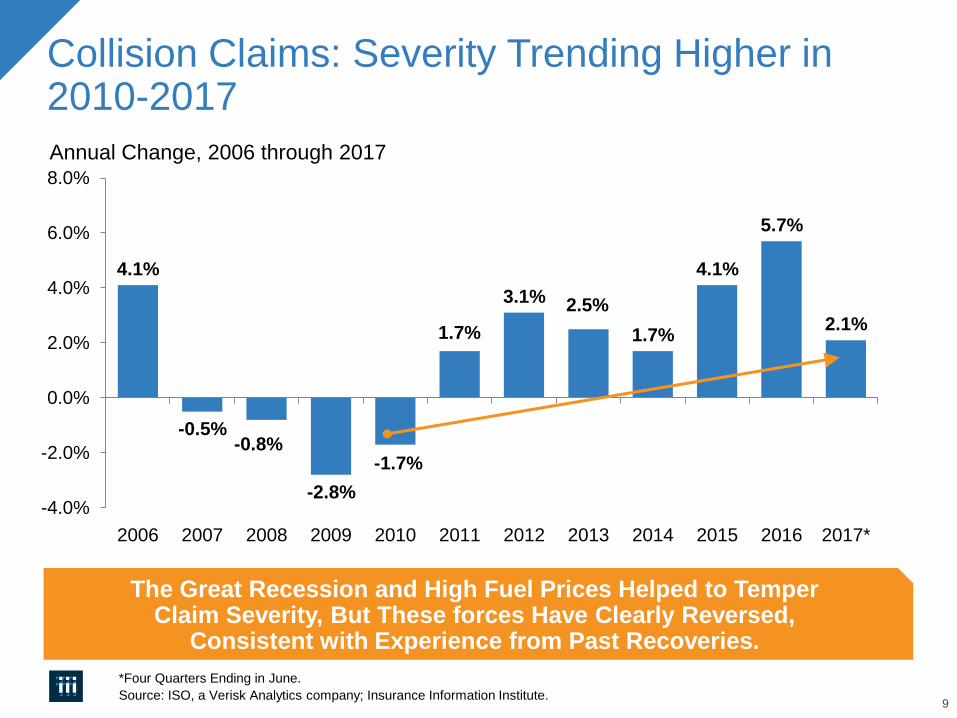
Collision Claims: Severity Trending Higher in 2010-2017
Annual Change, 2006 through 2017
*Four Quarters Ending in June.
Source: ISO, a Verisk Analytics company; Insurance Information Institute.
The Great Recession and High Fuel Prices Helped to Temper Claim Severity, But These forces Have Clearly Reversed,
Consistent with Experience from Past Recoveries.
4.1%
-0.5%-0.8%
-2.8%
-1.7%
1.7%
3.1% 2.5%
1.7%
4.1%
5.7%
2.1%
-4.0%
-2.0%
0.0%
2.0%
4.0%
6.0%
8.0%
2006 2007 2008 2009 2010 2011 2012 2013 2014 2015 2016 2017*
What’s Driving These Trends?
Frequency; Severity; Distraction?
11
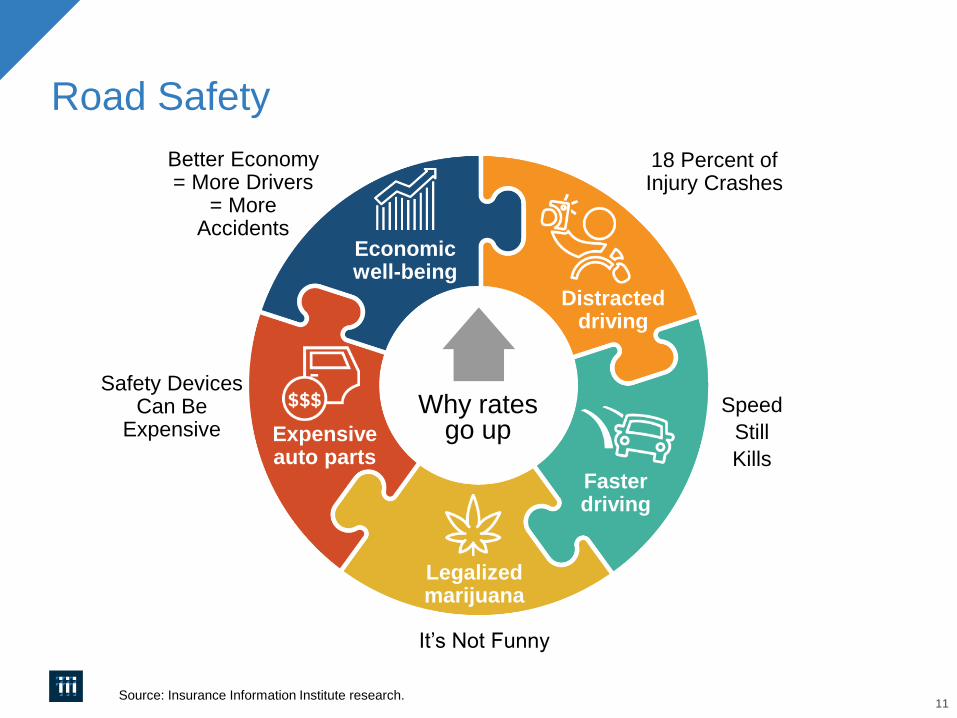
Road Safety
Source: Insurance Information Institute research.
Distracted driving
Faster driving
Economic well-being
Legalized marijuana
Expensive auto parts
Safety Devices Can Be
Expensive
Better Economy = More Drivers
= More Accidents
18 Percent of Injury Crashes
Speed
Still
Kills
It’s Not Funny
Why rates go up
12
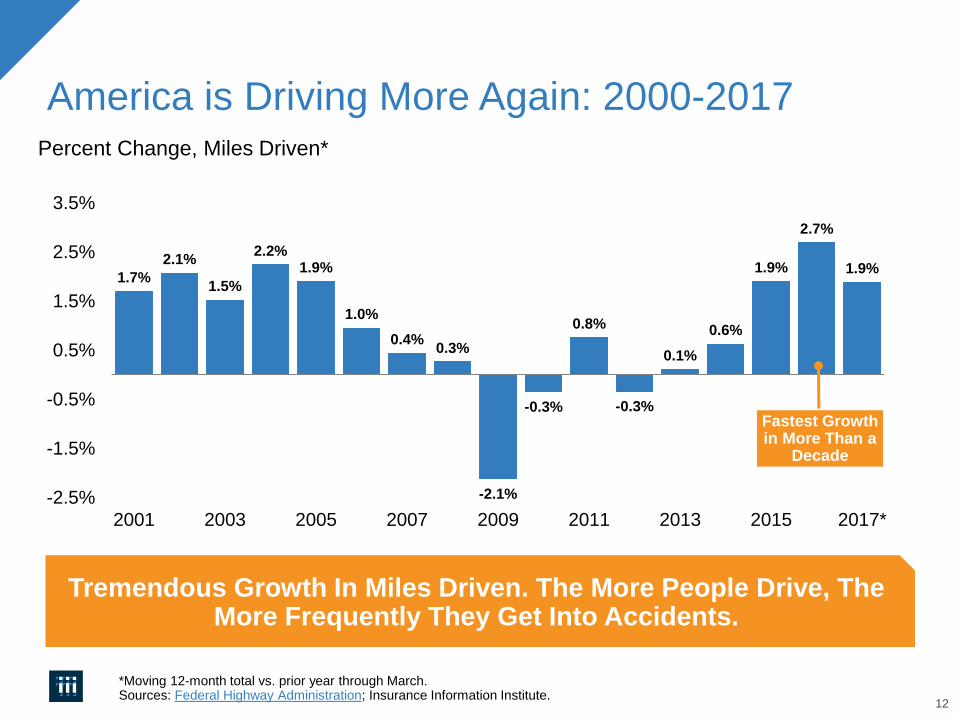
America is Driving More Again: 2000-2017Percent Change, Miles Driven*
*Moving 12-month total vs. prior year through March. Sources: Federal Highway Administration; Insurance Information Institute.
1.7%
2.1%
1.5%
2.2%1.9%
1.0%
0.4%0.3%
-2.1%
-0.3%
0.8%
-0.3%
0.1%
0.6%
1.9%
2.7%
1.9%
2001 2003 2005 2007 2009 2011 2013 2015 2017*
-2.5%
-1.5%
-0.5%
0.5%
1.5%
2.5%
3.5%
Fastest Growth in More Than a
Decade
Tremendous Growth In Miles Driven. The More People Drive, The More Frequently They Get Into Accidents.
13
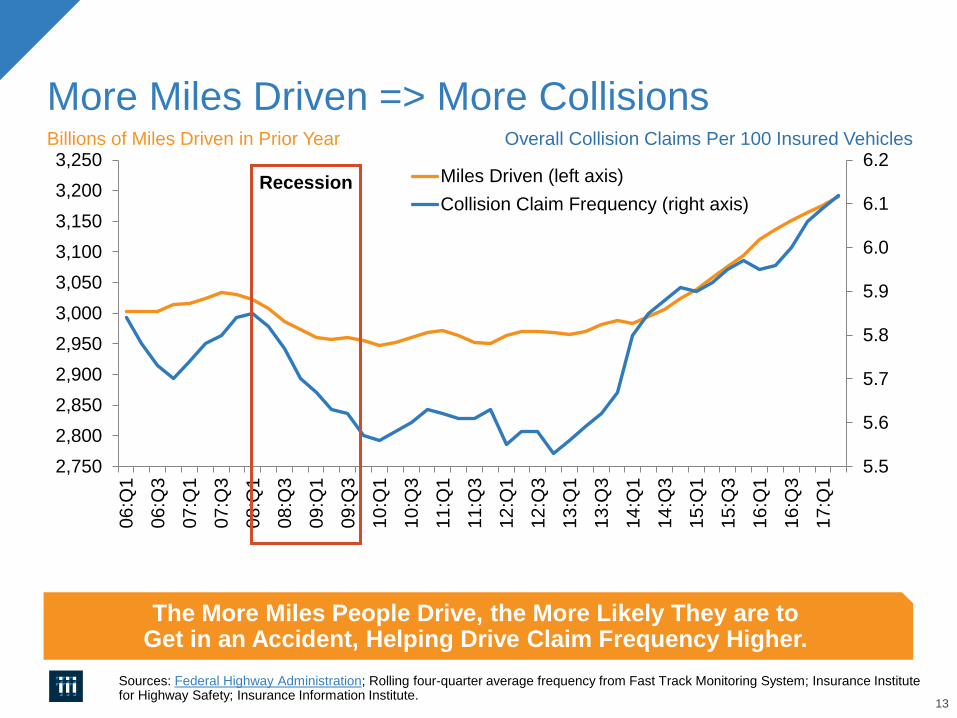
More Miles Driven => More CollisionsBillions of Miles Driven in Prior Year
Sources: Federal Highway Administration; Rolling four-quarter average frequency from Fast Track Monitoring System; Insurance Institute for Highway Safety; Insurance Information Institute.
The More Miles People Drive, the More Likely They are to Get in an Accident, Helping Drive Claim Frequency Higher.
5.5
5.6
5.7
5.8
5.9
6.0
6.1
6.2
2,750
2,800
2,850
2,900
2,950
3,000
3,050
3,100
3,150
3,200
3,250
06
:Q1
06
:Q3
07
:Q1
07
:Q3
08
:Q1
08
:Q3
09
:Q1
09
:Q3
10
:Q1
10
:Q3
11
:Q1
11
:Q3
12
:Q1
12
:Q3
13
:Q1
13
:Q3
14
:Q1
14
:Q3
15
:Q1
15
:Q3
16
:Q1
16
:Q3
17
:Q1
Miles Driven (left axis)
Collision Claim Frequency (right axis)
Overall Collision Claims Per 100 Insured Vehicles
Recession
14
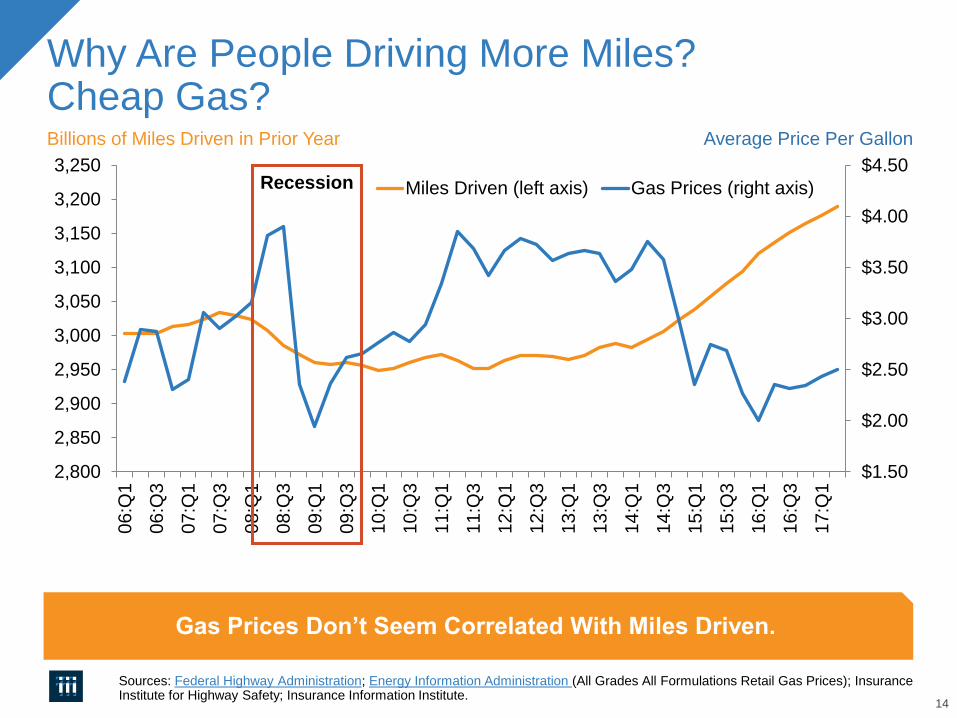
Why Are People Driving More Miles?Cheap Gas?Billions of Miles Driven in Prior Year
Sources: Federal Highway Administration; Energy Information Administration (All Grades All Formulations Retail Gas Prices); Insurance Institute for Highway Safety; Insurance Information Institute.
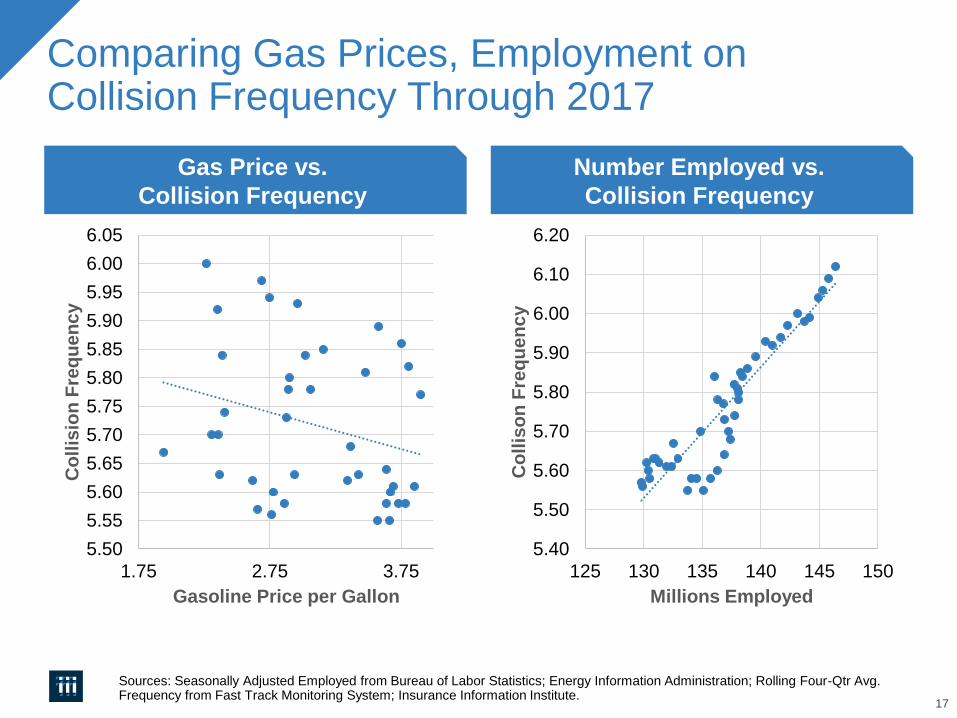
Gas Prices Don’t Seem Correlated With Miles Driven.
$1.50
$2.00
$2.50
$3.00
$3.50
$4.00
$4.50
2,800
2,850
2,900
2,950
3,000
3,050
3,100
3,150
3,200
3,250
06
:Q1
06
:Q3
07
:Q1
07
:Q3
08
:Q1
08
:Q3
09
:Q1
09
:Q3
10
:Q1
10
:Q3
11
:Q1
11
:Q3
12
:Q1
12:Q
3
13
:Q1
13
:Q3
14
:Q1
14
:Q3
15:Q
1
15
:Q3
16
:Q1
16
:Q3
17
:Q1
Miles Driven (left axis) Gas Prices (right axis)
Average Price Per Gallon
Recession
15
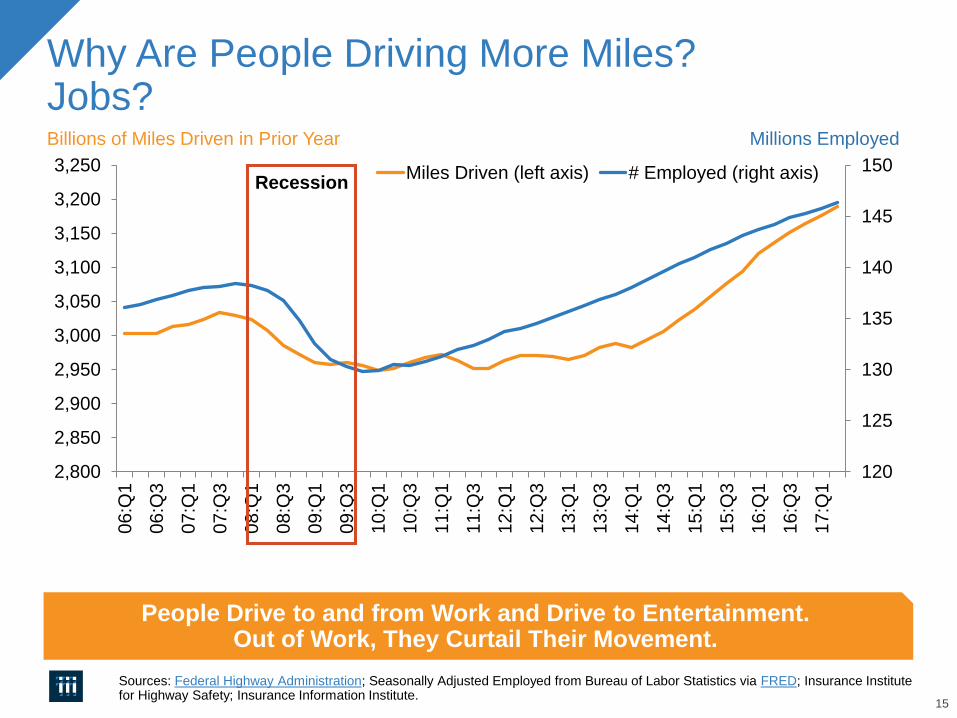
Why Are People Driving More Miles?Jobs?Billions of Miles Driven in Prior Year
Sources: Federal Highway Administration; Seasonally Adjusted Employed from Bureau of Labor Statistics via FRED; Insurance Institute for Highway Safety; Insurance Information Institute.
People Drive to and from Work and Drive to Entertainment. Out of Work, They Curtail Their Movement.
120
125
130
135
140
145
150
2,800
2,850
2,900
2,950
3,000
3,050
3,100
3,150
3,200
3,250
06
:Q1
06
:Q3
07
:Q1
07
:Q3
08
:Q1
08
:Q3
09
:Q1
09
:Q3
10
:Q1
10
:Q3
11
:Q1
11
:Q3
12
:Q1
12:Q
3
13
:Q1
13
:Q3
14
:Q1
14
:Q3
15:Q
1
15
:Q3
16
:Q1
16
:Q3
17
:Q1
Miles Driven (left axis) # Employed (right axis)
Millions Employed
Recession
16
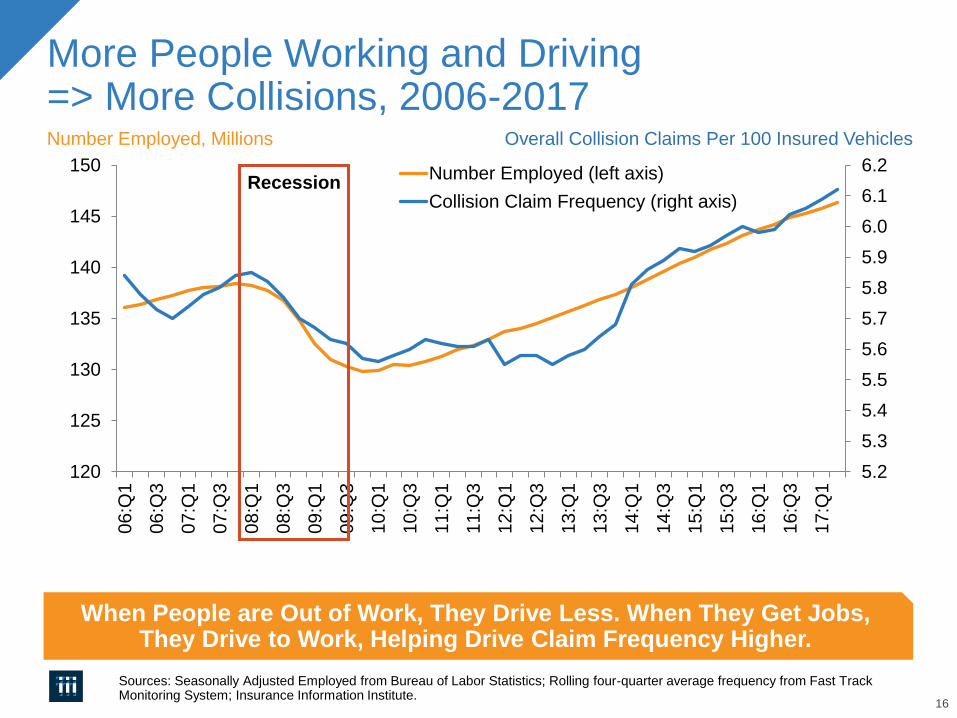
More People Working and Driving=> More Collisions, 2006-2017Number Employed, Millions
Sources: Seasonally Adjusted Employed from Bureau of Labor Statistics; Rolling four-quarter average frequency from Fast Track Monitoring System; Insurance Information Institute.
When People are Out of Work, They Drive Less. When They Get Jobs,They Drive to Work, Helping Drive Claim Frequency Higher.
5.2
5.3
5.4
5.5
5.6
5.7
5.8
5.9
6.0
6.1
6.2
120
125
130
135
140
145
150
06
:Q1
06
:Q3
07
:Q1
07
:Q3
08
:Q1
08
:Q3
09
:Q1
09
:Q3
10
:Q1
10
:Q3
11
:Q1
11
:Q3
12
:Q1
12:Q
3
13
:Q1
13
:Q3
14
:Q1
14
:Q3
15:Q
1
15
:Q3
16
:Q1
16
:Q3
17
:Q1
Number Employed (left axis)
Collision Claim Frequency (right axis)
Overall Collision Claims Per 100 Insured Vehicles
Recession
17
Comparing Gas Prices, Employment onCollision Frequency Through 2017
Sources: Seasonally Adjusted Employed from Bureau of Labor Statistics; Energy Information Administration; Rolling Four-Qtr Avg. Frequency from Fast Track Monitoring System; Insurance Information Institute.
Gas Price vs.
Collision Frequency
Number Employed vs.
Collision Frequency
5.50
5.55
5.60
5.65
5.70
5.75
5.80
5.85
5.90
5.95
6.00
6.05
1.75 2.75 3.75
Co
llis
ion
Fre
qu
en
cy
Gasoline Price per Gallon
5.40
5.50
5.60
5.70
5.80
5.90
6.00
6.10
6.20
125 130 135 140 145 150
Co
llis
on
Fre
qu
en
cy
Millions Employed
18
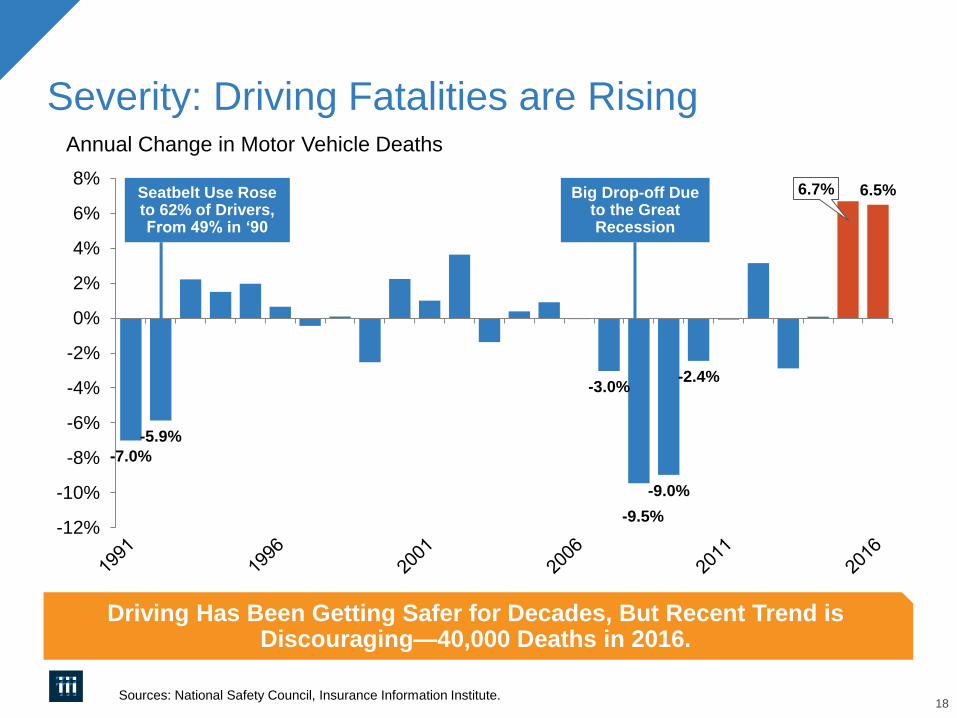
Severity: Driving Fatalities are RisingAnnual Change in Motor Vehicle Deaths
Sources: National Safety Council, Insurance Information Institute.
-7.0%
-5.9%
-3.0%
-9.5%
-9.0%
-2.4%
6.7% 6.5%
-12%
-10%
-8%
-6%
-4%
-2%
0%
2%
4%
6%
8%
Driving Has Been Getting Safer for Decades, But Recent Trend is Discouraging—40,000 Deaths in 2016.
Seatbelt Use Rose to 62% of Drivers, From 49% in ‘90
Big Drop-off Due to the Great Recession
19
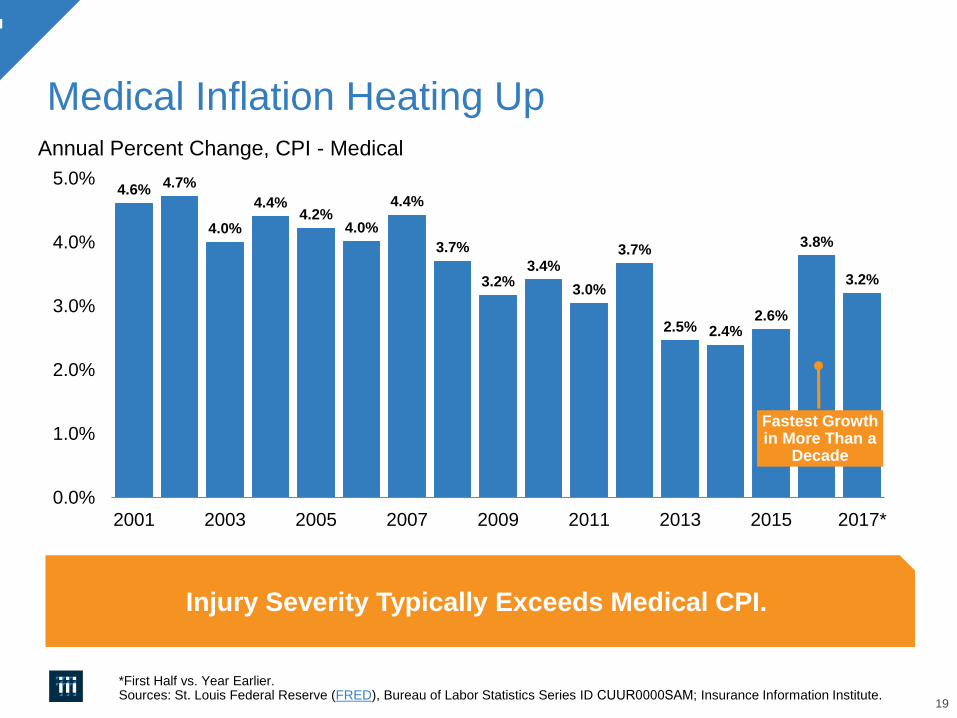
Medical Inflation Heating UpAnnual Percent Change, CPI - Medical
*First Half vs. Year Earlier. Sources: St. Louis Federal Reserve (FRED), Bureau of Labor Statistics Series ID CUUR0000SAM; Insurance Information Institute.
4.6%4.7%
4.0%
4.4%4.2%
4.0%
4.4%
3.7%
3.2%3.4%
3.0%
3.7%
2.5% 2.4%2.6%
3.8%
3.2%
2001 2003 2005 2007 2009 2011 2013 2015 2017*
0.0%
1.0%
2.0%
3.0%
4.0%
5.0%
Fastest Growth in More Than a
Decade
Injury Severity Typically Exceeds Medical CPI.
20
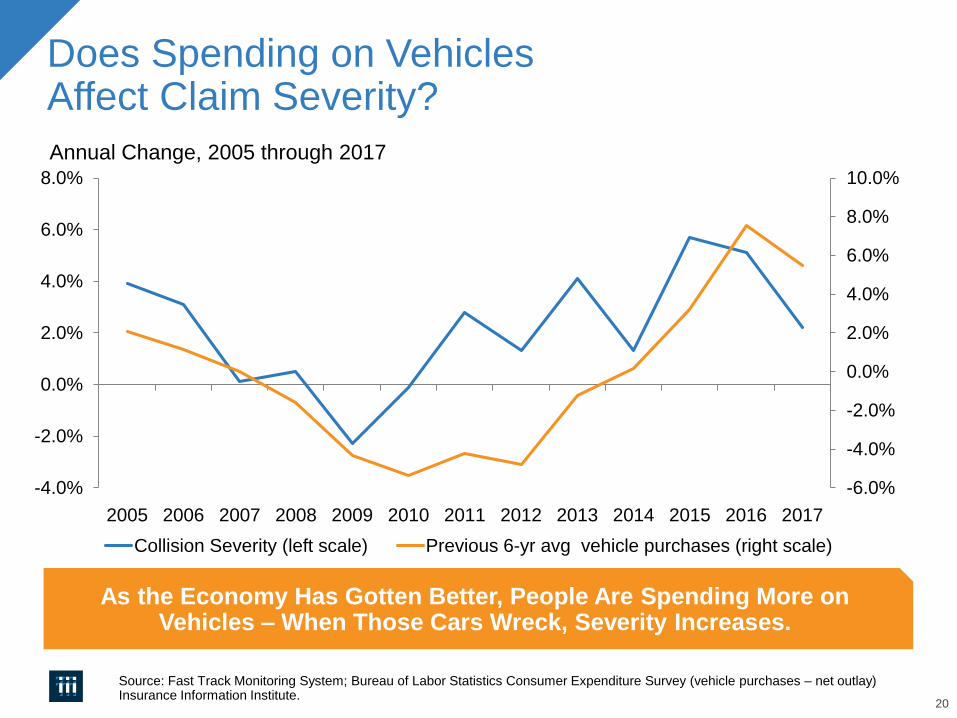
Does Spending on Vehicles Affect Claim Severity?
Annual Change, 2005 through 2017
Source: Fast Track Monitoring System; Bureau of Labor Statistics Consumer Expenditure Survey (vehicle purchases – net outlay) Insurance Information Institute.
As the Economy Has Gotten Better, People Are Spending More on Vehicles – When Those Cars Wreck, Severity Increases.
-6.0%
-4.0%
-2.0%
0.0%
2.0%
4.0%
6.0%
8.0%
10.0%
-4.0%
-2.0%
0.0%
2.0%
4.0%
6.0%
8.0%
2005 2006 2007 2008 2009 2010 2011 2012 2013 2014 2015 2016 2017
Collision Severity (left scale) Previous 6-yr avg vehicle purchases (right scale)
21
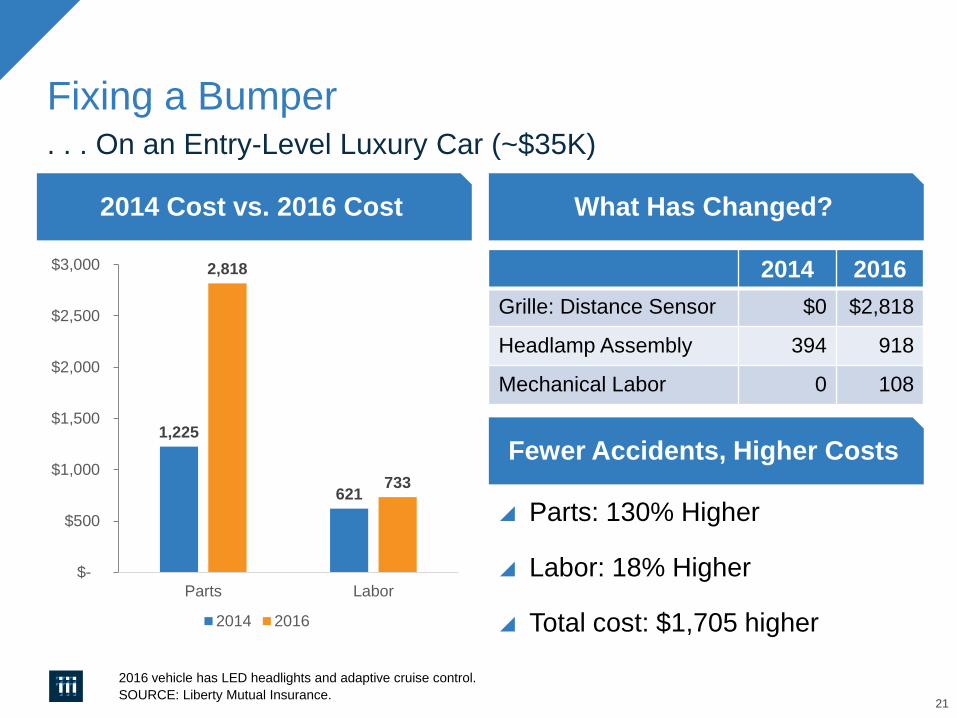
Fixing a Bumper. . . On an Entry-Level Luxury Car (~$35K)
2016 vehicle has LED headlights and adaptive cruise control.
SOURCE: Liberty Mutual Insurance.
What Has Changed?
Fewer Accidents, Higher Costs
2014 Cost vs. 2016 Cost
1,225
621
2,818
733
$-
$500
$1,000
$1,500
$2,000
$2,500
$3,000
Parts Labor
2014 2016
2014 2016
Grille: Distance Sensor $0 $2,818
Headlamp Assembly 394 918
Mechanical Labor 0 108
Parts: 130% Higher
Labor: 18% Higher
Total cost: $1,705 higher
22
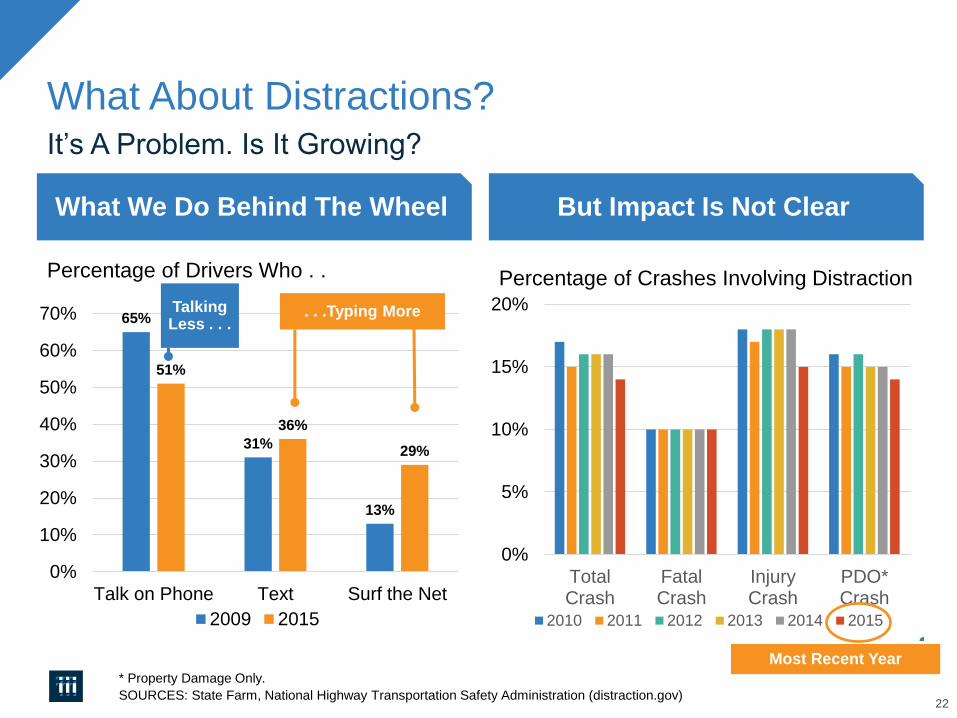
What About Distractions?It’s A Problem. Is It Growing?
* Property Damage Only.
SOURCES: State Farm, National Highway Transportation Safety Administration (distraction.gov)
What We Do Behind The Wheel But Impact Is Not Clear
65%
31%
13%
51%
36%
29%
0%
10%
20%
30%
40%
50%
60%
70%
Talk on Phone Text Surf the Net
2009 2015
. . .Typing More
Percentage of Drivers Who . .
0%
5%
10%
15%
20%
TotalCrash
FatalCrash
InjuryCrash
PDO*Crash
2010 2011 2012 2013 2014 2015
Percentage of Crashes Involving Distraction
Talking Less . . .
Most Recent Year
23
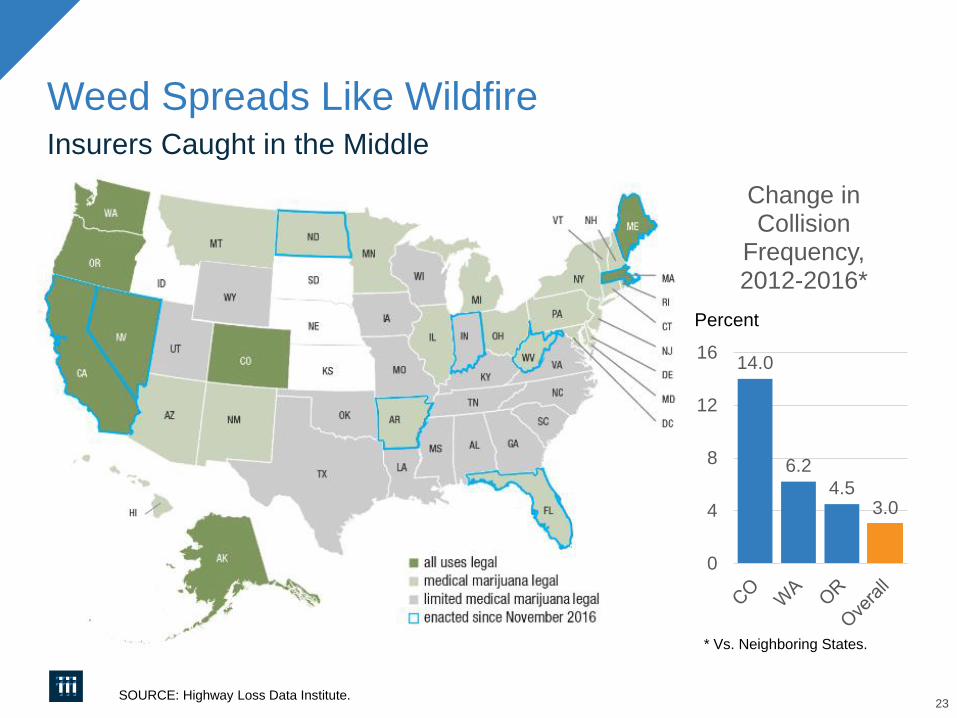
Weed Spreads Like WildfireInsurers Caught in the Middle
SOURCE: Highway Loss Data Institute.
14.0
6.2
4.53.0
0
4
8
12
16
Change in Collision
Frequency, 2012-2016*
Percent
* Vs. Neighboring States.