Embed Size (px)
Citation preview

RIS
ASEAN-India Centre at RIS
RIS A Think-Tankof Developing Countries
— Policy research to shape the international development agenda
Research and Information System for Developing Countries (RIS) is a
New Delhi-based autonomous policy research institute that
specialises in issues related to international economic development,
trade, investment and technology. RIS is envisioned as a forum for
fostering effective policy dialogue and capacity-building among
developing countries on global and regional economic issues.
The focus of the work programme of RIS is to promote South-South
Cooperation and collaborate with developing countries in
multilateral negotiations in various forums. RIS is engaged across
inter-governmental processes of several regional economic
cooperation initiatives. Through its intensive network of think tanks,
RIS seeks to strengthen policy coherence on international economic
issues and the development partnership canvas.
For more information about RIS and its work programme, please visit
its website: www.ris.org.in
RISResearch and Information Systemfor Developing Countries
Core IV-B, Fourth Floor, India Habitat Centre
Lodhi Road, New Delhi-110 003, India
Tel.: +91-11-2468 2177-80, Fax: +91-11-2468 2173-74
E-mail: [email protected]; [email protected]
Website: http://www.ris.org.in; http://aic.ris.org.in
ASEAN-India Centre at RIS
AS
EA
N-In
dia
Maritim
e C
on
nectiv
ity R
ep
ort

ASEAN-India Maritime Connectivity Report


ASEAN-India Maritime Connectivity Report
ASEAN-India
Centre at RIS
ASEAN-India Centre at RIS

Zone IV B, 4th Floor, India Habitat CentreLodhi Road, New Delhi 110 003, IndiaTel.: +91-11-24682177-80; Fax: +91-11-24682173-74E-mail: [email protected]; [email protected]: http://www.ris.org.in; http://aic.ris.org.in
RISResearch and Information System for Developing Countries
Published in 2014 by:
Copyright © AIC, 2014
ISBN: 81-7122-106-8
Cover design: Sachin Singhal
ASEAN-India
Centre at RIS
ASEAN-India Centre at RIS

Contents
Foreword .................................................................................................................................... vii
Acknowledgements .................................................................................................................. ix
Abbervations ...............................................................................................................................x
Executive Summary ...............................................................................................................xiii
Part I1. Introduction ..........................................................................................................1
2. Overview of ASEAN-India Connectivity .......................................................3
3. ASEAN-India Trade, RCEP and Trade Potential .........................................7
4. Removing Non-Tariff Measures (NTMs): Key to Economic Integration ..........................................................................17
5. Performance of Indian Maritime Sector .......................................................19
6. ASEAN-India Maritime Links ........................................................................35
7. Challenges to Maritime Connectivity ...........................................................49
8. Strengthening ASEAN-India Maritime Connectivity: List of Recommendations ............................................................................................55
Appendices ...................................................................................................................69
Part II
1. Agenda- National Seminar on ASEAN-India Maritime Transport Cooperation ..................................................................81
2. Opening Address by Ambassador Shyam Saran Chairman, AIC, RIS and NSAB .....................................................................83
3. Keynote Address by Ambassador Anil Wadhwa, Secretary (East), Ministry of External Affairs .............................................................................87
4. List of Participants .............................................................................................93
5. Summary .......................................................................................................... 101


Ambassador Shyam SaranChairman, AIC, RIS and NSAB
Foreword
The promotion of all-round connectivity is one of the priority areas where enhanced cooperation between India and ASEAN is envisaged. Connectivity, in this sense, covers cross-border road, rail, air and digital connectivity, as well as maritime links. Connectivity projects not only promote cross-border trade and traffic, but could also become catalysts for promoting economic development in the regions through which they traverse. In order to deepen the ASEAN-India economic relations, the availability of regular, efficient and affordable shipping is of critical importance.
Both India and ASEAN are maritime nations, with a rich and glorious history of maritime trade. It must be our endeavor to revive and energise those ancient links in a contemporary setting, so that they become a driving force in the Asian resurgence that we are witnessing today.
India has welcomed the Master Plan on ASEAN connectivity. Our effort is to align our plans for cross-border linkages with these important and ambitious platforms for regional integration. The ASEAN Connectivity Coordinating Committee (ACCC) has opened a comprehensive dialogue with India in 2013 to enhance all-round connectivity between India and ASEAN countries.

We must acknowledge that in shipping sector several ASEAN countries are ahead of India and Singapore is one of the world’s leading ports and container terminals. Other ASEAN countries are making rapid progress in modernising and expanding their ports and shipping services. India must keep pace with these developments even as it seeks to establish closer maritime links with its South East Asian neighbours.
ASEAN-India Maritime Connectivity Report, prepared by the ASEAN-India Centre at RIS under the guidance of Dr. Prabir De, analyses maritime cooperation as an integral component of ASEAN-India Strategic Partnership. It addresses the prospects and challenges concerning the ASEAN-India maritime relations and provides a framework for strengthening the maritime connectivity. This Report also provides a set of recommendations to strengthen maritime connectivity between India and ASEAN countries, and enhance economic integration between them.
ASEAN-India Maritime Connectivity Report is an outcome of a series of ASEAN-India connectivity studies undertaken at the ASEAN-India Centre at RIS with financial support of the Ministry of External Affairs, Government of India. I am thankful to Ambassador Anil Wadhwa, Secretary (East) and Ms. Renu Pall, Joint Secretary (ASEAN ML) in the Ministry of External Affairs, Government of India for their continuous support to the ASEAN-India Centre.
I trust that this Report will be a valuable reference for policymakers, academics and practitioners.
Shyam Saran
viii
ASEAN-India Maritime Connectivity Report

ACknowledgements
ix
The ASEAN-India Maritime Connectivity Report has been prepared by a research team, headed by Dr. Prabir De, Professor, RIS, and Coordinator, ASEAN-India Centre (AIC). Research assistance was provided by Mr. Sunando Basu, Research Associate, RIS. This Report has been benefitted from a background paper, written by the Indian National Shipowners’ Association (INSA), Mumbai.
We are grateful to Ambassador Shyam Saran, Chairman, RIS for his continuous guidance and encouragement. We are thankful to Ambassador Anil Wadhwa, Secretary (East), Ministry of External Affairs (MEA) and Ms. Renu Pall, Joint Secretary (ASEAN Multilateral), Ministry of External Affairs of India for their support and guidance. We are also grateful to the Ministry of Shipping and the Indian National Shipowners’ Association (INSA), Mumbai for making the participation in the National Consultation on ASEAN-India Maritime Transport Cooperation comprehensive. We would like to, in particular, acknowledge the cooperation from the INSA and its Chief Executive Office, Mr. Umesh C. Grover for their cooperation without which the National Consultation on ASEAN-India Maritime Transport Cooperation would not have been a success. In particular, we are grateful to Mr. Arvind Kumar, former Adviser, Ministry of Shipping, Government of India and Dr. Subrata Behera, Sr. Research Analyst, Drewry Maritime Research, New Delhi for their advice and discussions on Report.
ASEAN-India Maritime Connectivity Report benefitted from work done in support by the RIS Administration. Mr. Tish Kumar Malhotra coordinated the production of the Report with the support of Ms. Ruchi Verma. Ms. Kiran Wagh and Ms. Anu Bisht extended secretarial support. Mr. Sachin Singhal designed the Report. Views expressed in this Report are those of the authors and not the views of Governments of India or ASEAN countries, Research and Information System for Developing Countries (RIS), ASEAN-India Centre (AIC), or the Indian National Shipowners’ Association (INSA). Usual disclaimers apply.

AbbreviAtions
ACCC ASEAN Connectivity Coordinating Committee ADB Asian Development BankADBI Asian Development Bank InstituteAEC ASEAN Economic Community AFTA ASEAN Free Trade AreaAGV Automatic Guided Vehicle AH Asian HighwayAIC ASEAN-India CentreAIF ASEAN Infrastructure FundAIMTA ASEAN-India Maritime Transport Agreement AIS Automatic Identification System AITTA ASEAN-India Transit Transport AgreementASEAN Association of Southeast Asian NationsAPA ASEAN Ports AssociationAPEC Asia-Pacific Economic CooperationBOPS Balance of Payments StatisticsBOT Build-Operate-Transfer CADP Comprehensive Asia Development PlanCAGR Compound Annual Growth Rate CDC Continuous Discharge Certificate CLMV Cambodia-Lao PDR-Myanmar-Vietnam COC Certificate of Competency DCI Dredging Corporation of India DSEZ Dawei Special Economic Zone EAS East Asian Summit EC Electronic Commerce EDI Electronic Data Interchange ERIA Economic Research Institute for ASEAN and East Asia FASA Federation of ASEAN Shipowners’ AssociationFDI Foreign Direct InvestmentFEU Forty Equivalent UnitFIPB Foreign Investment Promotion Board FoB Freight on Board
x

FTA Free Trade AgreementFTAAP Free Trade Area of Asia PacificFTAAPX Free Trade Area of the Asia Pacific plus IndiaGDP Gross Domestic ProductGT Gross TonnageICD Inland Container Depot ICT Information and Communication TechnologyIDE Institute of Developing EconomiesIMF International Monetary Fund IMO International Maritime Organisation IMU India Maritime UniversityIMTTH India-Myanmar-Thailand Trilateral Highway INSA Indian National Shipowners’ AssociationIPA Indian Ports AssociationISPS International Ship and Port SecurityJNP Jawaharlal Nehru PortJV Joint VentureKDS Kolkata Dock SystemKMTTP Kaladan Multi-modal Transit Transport ProjectLDCs Least Developed CountriesLEP Look East PolicyLSCI Liner Shipping Connectivity IndexMCA Model Concession Agreement MEA Ministry of External AffairsMIEC Mekong-India Economic CorridorMoU Memorandum of UnderstandingMPAC Master Plan of ASEAN Connectivity MPA Maritime and Port Authority of SingaporeMRA Mutual Recognition AgreementMSDC Maritime States Development Council MTPA Metric Tonne Per Annum NTBs Non-Tariff BarriersNTDPC National Transport Development Policy Committee NMDP National Maritime Development Programme NSAB National Security Advisory Board NSICT Nhava Sheva International Container Terminal
xi
Abbreviations

NTMs Non-Tariff MeasuresPBDT Pre-Berthing Detention Time PCS Port Community System PCBs Policy and Cultural BarriersPOL Petroleum, Oil, and LubricantsPPP Public Private Partnership PSA Port of Singapore RCEP Regional Comprehensive Economic PartnershipRFID Radio Frequency Identification RIS Research and Information System for Developing CountriesRO-RO Roll-on/Roll-offSAR Service and RescueSCI Shipping Corporation of IndiaSEZ Special Economic ZoneSMA Singapore Maritime Academy SPV Special Purpose VehicleSTCW Standards of Training, Certification and Watchkeeping TAMP Tariff Authority for the Major PortsTEU Twenty Equivalent UnitTFA Trade Facilitation Agreement TH Trilateral HighwayTPP Trans-Pacific PartnershipUNCTAD United Nations Conference on Trade and DevelopmentVTMS Vessel Traffic Management System WEF World Economic ForumWSC World Shipping Council WTO World Trade Organisation
xii
ASEAN-India Maritime Connectivity Report

exeCutive summAry
y Maritime transportation helps strengthen the economic integration – global or otherwise. Countries which built good ports with excellent backend infrastructure remain competitive in the world market. Not only it plays an important role in the development of industries, port has been a direct ingredient in the development of an economy. Performance and efficiency of ports and shipping positively contribute to the growth of trade and vice versa.
y India presently has 212 seaports, of which 12 are major ports and 200 are non-major ports. Around 95 per cent of India’s merchandise trade by volume (70 per cent by value) is moved by sea. India has one of the largest merchant fleets in the developing world, and in terms of gross tonnage under its flag occupies 16th rank in the world.
y Barring Lao PDR, ASEAN countries and India have long coastline, dotted with many ports. However, the structural gap in terms of maritime and shipping infrastructure is quite visible within ASEAN and also between India and ASEAN. Within ASEAN, CLMV countries rank far behind of other ASEAN countries and India in cargo volume and shipping tonnage. Predominant ports in ASEAN are located in developing parts of ASEAN and have been growing faster than those are located in CLMV or Mekong sub-region. In the containerised cargo segment, out of world’s top 25 ports, seven ports come from ASEAN and only one from India, among which Singapore Port with 31.65 million TEUs in 2012 (about 5 per cent share in world total) occupies the 2nd position in the world. India’s Jawaharlal Nehru Port with 4.26 million TEUs ranks 21st position in the world. Indian ports have limited number of direct calls with ASEAN ports, except perhaps Singapore, Klang and Laem Chabang.
y With the FTA for trade in goods between India and ASEAN in effect from 1 January 2010, ASEAN-India Partnership has assumed greater economic depth. In 2012-13, two-way trade between ASEAN and India has crossed US$ 75 billion, with India
xiii

contributing US$ 33 billion, and ASEAN US$ 42 billion. ASEAN-India bilateral trade can achieve US$ 100 billion by 2015 and US$ 200 billion by 2020.
y India’s rising trade with ASEAN and China calls for a stronger maritime connectivity since the trade through ocean has increased rapidly in terms of both value and volume. This change in trade has also been accompanied by rise in value-volume ratio in last the 13 years, particularly in India’s export to China.
y India’s containerised trade with ASEAN countries has been growing, but at a slow rate. In 2011-12, India’s containerised trade, both export and import, with most of the ASEAN countries decelerated due mainly to slow recovery of economies in the aftermath of the global financial crisis. The sharpest fall was witnessed in case of India’s two-way containerised trade with Indonesia during 2009-10 and 2011-12. In contrast, India’s trade with China in value terms has exceeded US$ 60 billion 2012-13, and the same trend has been continuing in containerised trade. Today, India’s bilateral containerised trade volume with China is estimated to be over 4 million TEUs, thereby indicating service of about 15 container vessels every week between the two countries. This high volume ocean cargo between India and China passes through the Malacca Strait. Besides, cargo produced in India and destined for different locations in Southeast Asia typically moves through the transhipment hub located in Singapore, Tanjung Pelepas and Port Klang. Naturally, the dependency on the Strait of Malacca is high. This sea channel is very important for the world’s shipping movement as this connects the growing regions of South Asia and Africa to the economies on the east. Therefore, maritime security is as critical as performance of ports to the growth of merchandise trade between India and Southeast and East Asia. Maritime security must be an important agenda of the ASEAN-India maritime cooperation.
y Presently, the liner shipping between major ports of India and ASEAN follows ‘hub and spoke’ model. Singapore and Port Klang are the two hub ports in ASEAN. Besides direct calls,
ASEAN-India Maritime Connectivity Report
xiv

these two ports also have feeder services with ports in India and South Asia. Most of the foreign lines connect Indian ports with Singapore or Port Klang through direct call, whereas the further voyage inland is done through feeder services, which often takes relatively higher number of days.
y India’s maritime connectivity with Southeast and East Asia, which is at present in very initial stage of development, may appear to be a great facilitator of pan-Asian integration. Well connected ports along with efficiency of shipping services are the major catalysts to greater maritime connectivity between ASEAN and India. Today, only a few ports of India and ASEAN are directly connected by shipping lines. A large number of ports in India and ASEAN are yet to be connected. Transportation costs and time go up substantially when we ship our cargo through feeder routes to reach ports in Cambodia, Indonesia, Malaysia, Myanmar, Thailand and Vietnam, with which India’s trade has been growing fast. The opposite is also true. We need to build new shipping routes as the existing route through Malacca Strait is heavily congested and also relatively unsafe. As an alternative, economic corridor-based multimodal connectivity such as Mekong-India Economic Corridor may be promoted, which will connect Indian coast with unexplored Southeast Asian coast and beyond, at a shorter time and lesser cost.
y Ports and shipping are the backbone of ASEAN-India trade. Since trade between India and ASEAN is largely conducted through ocean, without a stronger maritime connectivity it would not be possible to realise the full potential of the regional free trade and cooperation agreements, which are already in place or are currently under negotiation. Moreover, ASEAN-India maritime connectivity is the key to production networks. Stronger maritime connectivity will spur global and regional value chains. ASEAN and India have been witnessing various economic corridors. A stronger maritime connectivity between India and ASEAN will enhance connectivity among various economic corridors between the two regions.
Executive Summary
xv

y India is one of the key partners of Regional Comprehensive Economic Partnership (RCEP) Agreement, which is being negotiated at present among ASEAN+6 countries. With both sides showing keenness to deepen and widen their economic partnership, there is need to dwell on a range of issues, including maritime connectivity. Building a common market between ASEAN and India may be achieved provided the trade liberalisation is adequately supported by trade facilitation and connectivity. India’s growing trade with Southeast and East Asia will depend on how well is our ports and how efficient is our shipping. As the economic integration between ASEAN and India has been witnessing a rise in cross-border production networks, ports and shipping in India and ASEAN have to be sufficiently developed to support the infrastructure demand since land transportation between India and ASEAN is yet to take a proper shape.
y One of the major obstacles to the expansion of trade between India and ASEAN is the high cost of moving goods across the borders. Improved maritime connectivity would reduce trade costs, raise competitiveness and trade flows, expand markets, reduced poverty, and increase country’s welfare and quality of life of its citizens. The challenges to ASEAN-India maritime connectivity include, to mention a few, shortage of port capacity, very few direct calls, high port handling charges, lack of skilled human resources, and absence of an institutional mechanism. In particular, the port facilities in some countries are well equipped with technical and electronic equipment, whereas in many countries of the region ports still belong to the ancient period and are far away from automation and modernization. Therefore, to create a functional single market in Asia, it is necessary to overcome the missing links in transportation, the lack of interoperability, and infrastructure gaps reducing the efficiency and weakening the global competitiveness of the Asian industry.
y The terminal handling charges of some ASEAN container ports are appeared to be higher than that of Indian ports. While efficiency of Singapore port is unparallel in the region, higher handling
ASEAN-India Maritime Connectivity Report
xvi

charges often negate the benefits of geographical links and trade liberalisation initiatives.
y Due to inadequate cargo availability and maintaining the time bound movement of cargo, major container shipping lines prefer not to call directly; rather they prefer to serve the Bay of Bengal market through their feeder alliances connected to the transshipment hubs. We need to connect ASEAN ports in Myanmar, Thailand and Vietnam with Indian ports with regular direct shipping services. At the same time, we also have to attract more feeder operators to link Indian ports such as Chennai, Ennore, Vizag, Kolkata and Haldia with ASEAN ports.
Selected Recommendations y Allowing coastal shipping (Short Sea Shipping) in Bay of Bengal
would perhaps help ASEAN LDCs to increase their market access in India and vice versa. The coastal trade agreement signed by Bangladesh and Myanmar in 2012 may be extended to India and Thailand to start with. Institutional links between ports and the shipping community, regional (and bilateral) short sea shipping, and training and capacity building may pave the way for stronger maritime links in the region.
y ASEAN and India may consider signing of Mutual Recognition Agreement (MRA) in shipping and logistics services once the ASEAN-India Services Trade Agreement is sealed and ratified. Deeper cooperation initiatives can surely play an important role to sign the MRAs.
y As explicitly stated in the Master Plan on ASEAN Connectivity, ASEAN puts emphasis on stronger connectivity with neighbouring countries, including India and other EAS countries. Connecting the archipelagic regions of ASEAN requires efficient and reliable shipping routes in order to enhance intra-ASEAN connectivity. India may join ASEAN’s RoRo sector and also cruise segment for brining the two coasts closer to each other. This will also boost the tourism between the two regions.
Executive Summary
xvii

y We need to identify and develop the maritime route between India’s east coast and CLMV countries. ASEAN and India may also decide the possibility of developing RoRo terminal in CLMV coast along MIEC and also in Indian coast in joint venture. To start with, container cargo operation in Chennai-Yangon-Chennai and Kolkata-Haldia-Chittagong-Yangon-Singapore shall be resumed. Once Sittwe port becomes ready for operation, it can be added as a new port of call.
y ASEAN is contemplating Single Shipping Market. India may explore joining the shipping market and may finalise a strategy for joining the ASEAN Single Shipping Market and develop the relevant framework for its implementation.
y Maritime connectivity between ASEAN and India would open considerable avenues and opportunities for trade. Operational efficiency of the ports has to be competitive and on par with the best ports in the world. Modern cargo handling equipment must be introduced to improve port performance. Efforts must be made to enhance the quality of service and productivity levels. In this regard, greater economic and/or commercial cooperation is desired from those ASEAN countries (e.g. Singapore) that have technological expertise on ports and shipping.
y The long coast of Myanmar provides closest and most direct point of maritime connection between India and Southeast Asia, across the Bay of Bengal. Consequently, developing infrastructure along the coast of Myanmar presents a major opportunity for connecting India to the rest of Southeast Asia through Myanmar. This will also enable Myanmar’s port-cities to develop and prosper, narrowing regional development gaps. India is rebuilding a port at Sittwe in Myanmar under the Kaladan Multi-modal Transit Transport project. India may also explore developing of the Dawei port and SEZ project in Myanmar in JV.
y Enhancing maritime connectivity between India and ASEAN is a multifaceted task that requires implementing strong policy initiatives. Development of this connectivity would open
ASEAN-India Maritime Connectivity Report
xviii

significant opportunities for industrial development in India and its trade potential with Southeast and East Asian countries. This connectivity would link the Chennai region to the rest of the world through its maritime infrastructure. Thus, Chennai and Ennore ports have great potential of becoming the gateway ports for India and function as a core node providing centre of business activities with industrial clusters and work as engine to promote regional economic growth.
y The cooperation with Myanmar could be in two functional areas – one being financial and the other being technical. Financial support in form of soft loan or infrastructural credit could be offered to Myanmar, Cambodia and Vietnam to build transportation infrastructure. The other form of cooperation is to make India’s presence in the region and build the port infrastructure. This may include capital dredging, berth creation, crane installation and other such infrastructural development.
y Initiating mainline calls in the Bay of Bengal will go long way in instilling confidence in the shippers and traders in east coast of India, Bangladesh and Myanmar, besides acting as a stepping stone in the area of mutual cooperation in maritime transportation. State-owned shipping lines like the Shipping Corporation of India (SCI) shall make the first move in this regard.
y Simple, harmonised and standardised trade and customs, processes, procedures and related information flows are expected to reduce transaction costs between ASEAN and India, which will enhance trade competitiveness and facilitate the regional integration. India and other dialogue partners of ASEAN also need to align customs and trade services with that of ASEAN (e.g., Customs Single Window).
y India may explore signing ASEAN-India Maritime Transport Agreement (AIMTA) with ASEAN subject to adequate safeguard to shipping services. This agreement will help both India and ASEAN to further cooperate and communicate with each other, eliminate barriers hindering maritime transport, and establish
Executive Summary
xix

regional maritime transport framework system with the aim to promote maritime transport facilitation between ASEAN and India and beyond.
y As ASEAN-India trade started growing, it is imperative for all the countries in the region to be competitive. India’s relation in the field of maritime transport with ASEAN is yet to be formally established. The key priority of ASEAN-India maritime cooperation should lead to achieve a safe, sustainable and efficient transport system in the region. Greater maritime connectivity with Southeast and East Asia is, therefore, a rewarding choice for Indian ports to build additional port capacity and Indian carriers to strengthen their fleets and vice versa. This would help not only to achieve higher performance and efficiency of maritime services but also to increase the growth of trade and investment between ASEAN and India.
ASEAN-India Maritime Connectivity Report
xx

1.1 India and Southeast Asia enjoy maritime relations that date back to ancient times.1 In the contemporary period, Southeast Asia is at the heart of India’s Look East Policy (LEP). ASEAN-India strengths lie in the fact that the region is home to 1.8 billion people having complementary resources and capacities. In 2012, ASEAN and India celebrated the 20th Anniversary of their Dialogue Partnership and the 10th Anniversary of Summit-level Partnership with, among others, a special “Commemorative Summit” on 20 December 2012 under the theme “ASEAN-India Partnership for Peace and Shared Prosperity”. Leaders from all ASEAN countries, who attended the Commemorative Summit in 2012, endorsed elevating ASEAN-India Dialogue Partnership to Strategic Partnership. ASEAN-India Eminent Persons’ Report recommends expansion of ASEAN-India connectivity to bring South Asia and Southeast Asia closer.2
1.2 Connectivity in its broadest sense encompasses road, rail, waterway, shipping and electronic connectivity. These provide the transmission channels through which development impulses can spread across the region and add dynamism to the economic and social development of both ASEAN countries
1 Introduction

2 ASEAN-India Maritime Connectivity Report
as well as India. India has welcomed ASEAN’s own connectivity projects for intra-ASEAN linkages. India is one of the two Dialogue Partners that shares both maritime and land borders with ASEAN. Given this close proximity, there is much potential for ASEAN and India to promote connectivity. A true deepening of partnership between ASEAN and India will only happen when regional connectivity and integration between the two are strengthened, particularly through cross-border physical and soft infrastructure such as multi-modal links and cross-border transport arrangements. Thus, enhancing our infrastructure is a cornerstone in the deepening of the ASEAN-India relations.
1.3 This Report presents an overview of the ASEAN-India maritime connectivity and recommends a series of measures to facilitate trade, promote investment and strengthen the martime relations between India and ASEAN.

2.1 India’s regional integration process with Southeast Asia has been following two major systems: Software (Single Window in Customs) and Hardware (ASEAN-India connectivity projects such as Trilateral Highway, Kaladan Multi-modal Transit Transport Project (KMTTP), Mekong-India Economic Corridor (MIEC), etc.). While the first system will lead us to achieve paperless trade, the second one will restore a seamless trade.3 India’s regional connectivity with Southeast Asia is being evolved on two axis – Northeastern India for land transportation and Southern India for multimodal transportation.
2.2 The potential gains from closer connectivity are no doubt large. As part of the work related to the Comprehensive Asia Development Plan (CADP), prepared by the Economic Research Institute for ASEAN and East Asia (ERIA) for the East Asian Summit (EAS) Group, the study found cumulative impacts over 5 per cent of GDP for Cambodia, Myanmar, Thailand and Vietnam, and over 2.5 per cent of GDP for India.4 In an earlier study, Asian Development Bank (ADB) estimated large gains (about US$ 260 billion, or 2 per cent of GDP) from an East and South Asian free trade area, under conservative assumptions.5
Overview of ASEAN-India Connectivity2

4 ASEAN-India Maritime Connectivity Report
2.3 Demand for improved connectivity between ASEAN and India has been rising rapidly. The big challenge is to secure finances for Asia’s large infrastructure needs. Asian Development Bank (ADB) and Asian Development Bank Institute (ADBI) in a study, Infrastructure for a Seamless Asia, estimated that Asia needs to invest approximately US$ 8 trillion in overall national infrastructure between 2010 and 2020. In addition, Asia needs to spend approximately US$ 290 billion on specific regional infrastructure projects in transport and energy that are in the pipeline.6 This study also shows that ASEAN countries will require infrastructure investments amounting to US$ 596 billion during 2006-2015, with an average investment of US$ 60 billion per year. Public funds may not be adequate to meet these huge investments, so Public-Private Partnership (PPP) has been encouraged. There is an important role for the cross-border funding, including of multilateral banks and possible new institutions.
2.4 The Heads of the States/Governments of ASEAN and India at the ASEAN-India Commemorative Summit 2012, endorsed enhancing ASEAN Connectivity by supporting the implementation of the Master Plan on ASEAN Connectivity (MPAC) and the ASEAN ICT Master Plan 2015. They agreed to infuse greater momentum to the growing trade and investment linkages between ASEAN and India by calling for an early completion of the India-Myanmar-Thailand Trilateral Highway (IMTTH) and an examination in an integrated manner of the additional possibilities such as its extension to Lao PDR and Cambodia and the new highway project connecting India-Myanmar-Lao PDR-Vietnam-Cambodia as well as developing the Mekong-India Economic Corridor (MIEC) connecting Southeast Asia to South Asia with the best use of all available resources, including financial and technical assistance, investment and public-private partnership to achieve physical, institutional and people-to-people connectivity.

5
2.5 ASEAN Connectivity Coordinating Committee (ACCC) has opened a comprehensive dialogue with India in 2013 to enhance air, sea and land connectivity between ASEAN and India. India is the third country, after Japan and China, to have this annual dialogue with the ACCC. Korea is the other country, which has opened dialogue with the ACCC. The Inter-Ministerial Group on Transport Connectivity with ASEAN, set up by India in 2012, has been participating in the ASEAN Land Transport Working Group and Maritime Transport Working Group meetings.
Overview of ASEAN-India Connectivity


ASEAN-India Trade, RCEP and Trade Potential
3.1 With the FTA for trade in goods between India and ASEAN in effect from 1 January 2010, ASEAN-India Partnership has assumed greater economic depth. This is set for further strengthening once the FTA for services and investment becomes effective. The trade in goods agreement focuses on tariff liberalisation on mutually agreed tariff lines from both the sides and is targeted to eliminate tariffs on 80 per cent of the tariff lines accounting for 75 per cent of the trade in a gradual manner starting from 1 January 2010.7 ASEAN and India already met the target of achieving bilateral trade volume of US$ 50 billion ahead of 2010. In 2012-13, two-way trade between ASEAN and India crossed US$ 75 billion, with India contributing US$ 33 billion, and ASEAN US$ 42 billion. Figures 1(a) and 1(b) present the trend of India’s exports to and imports from ASEAN, respectively. ASEAN and India expect tariff-free lines to increase beyond the existing level in subsequent years.8 There is no doubt that continuing economic uncertainties in the global economy have affected the bilateral trade as well. In 2012-13, two-way trade had declined by over 4 per cent. However, in the second half of 2013, ASEAN-India trade was back on its growth path. Despite these fluctuations in the growth, ASEAN-India bilateral trade can achieve US$ 100 billion by 2015 and US$ 200 billion by 2020.9
3.2 Intermediate and capital goods are driving the trade between India and ASEAN. Barring minerals and gems, jewellery,
3

8 ASEAN-India Maritime Connectivity Report
commodities such as electrical machinery, transmission apparatus, motor vehicles, etc., have emerged as important Indian exports to ASEAN. On the other hand, India’s imports from ASEAN are primarily driven by electronics, electrical machinery, palm oil, mineral fuels, gems and jewellery, etc. Tables 1(a) and 1(b) present India’s top 20 export and import products to and from ASEAN, respectively. However, India’s imports from ASEAN are relatively more diversified than its exports to ASEAN or ASEAN+3 countries. India’s trade with ASEAN+3 countries has witnessed a compositional shift in recent years. Over time, ASEAN+3 countries have appeared as major suppliers of capital goods to India, and witnessed a rising trend in trade in parts and components for capital goods.
Figure 1(a): Trend in India’s Exports to ASEAN
Figure 1(b): Trend in India’s Imports from ASEAN
Source: Direction of Trade Statistics, International Monetary Fund (IMF-DOTS).
0
50
100
150
200
250
300
350
US$
Bill
ion
ASEAN ASEAN+3 World Trade
0
100
200
300
400
500
600
1990
1991
1992
1993
1994
1995
1996
1997
1998
1999
2000
2001
2002
2003
2004
2005
2006
2007
2008
2009
2010
2011
2012
US
$ Bi
llion
ASEAN ASEAN+3 World Trade

9
Table 1(a): India’s Top 20 Exports to ASEAN
HS Code CommodityValue
2011-12(US$
Million)
Share* 2011-12
(%)
Value2012-13
(US$ Million)
Share* 2012-13
(%)
27101119 Other motor spirit 6331.69 17.23 4021.66 12.18
27101950 Fuel oil 2418.03 6.58 1941.66 5.88
2023000 Boneless meat of bovine animals frozen 1337.41 3.64 1616.19 4.90
27101930 High Speed Diesel 2495.66 6.79 1089.87 3.30
10059000 Other maize (corn) 715.21 1.95 1039.43 3.15
27101190 Other light oils and preparations 321.57 0.88 952.84 2.89
71023910Diamond (other than industrial) cut or otherwise worked but not mounted or set
803.92 2.19 922.48 2.79
89040000 Tugs and pusher craft 646.52 1.76 850.02 2.58
27101990Other petroleum oils and oils obtained from bituminous minerals
578.38 1.57 730.25 2.21
27101111
Special boiling point motor spirits (other than benzene Toulon) with nominal boiling point range 55-1150c
# # 710.77 2.15
89059090 Light-vessels, fire-floats, etc., floating docks & platforms, other 1457.51 3.97 703.62 2.13
12022010 Shelled groundnuts kernel 874.74 2.38 638.20 1.93
29024300 p-Xylene 640.59 1.74 631.24 1.91
23040030 Meal of soybean, solvent extracted (defatted) variety 537.61 1.46 608.10 1.84
87041010
Dumpers designed for off-highway use with net wt > 8 tons and maximum pay- load >=10 tons
294.9 0.80 411.81 1.25
52010015Indian cotton of staple length 28.5mm (1.4/32") and above but below 34.5mm kg
201.17 0.55 301.78 0.91
75021000 Nickel, not alloyed 277.24 0.84
87089900Other parts and accessories for motor vehicles (heading 8701-8705)
176.85 0.48 276.05 0.84
74031100 Refined copper: Cathodes and sections of cathodes 5.32 0.01 259.25 0.79
27101120 Natural Gasoline Liquid 240.99 0.73
Total 36744.35 33008.21
Note:s *Share in total exports to ASEAN. #No trade.Source: Export Import Data Bank, Department of Commerce, Government of India.
ASEAN-India Trade, RCEP and Trade Potential

10 ASEAN-India Maritime Connectivity Report
Table 1(b): India’s Top 20 Imports from ASEAN
HS Code Commodity
Value2011-12
(US$ Million)
Share* 2011-12
(%)
Value2012-13
(US$ Million)
Share* 2012-13
(%)
15111000 Crude palm oil and its fractions 5644.71 13.39 6637.46 15.48
27011920 Steam coal 3903.34 9.26 6003.27 14.00
27090000Petroleum oils and oils obtained from bituminous minerals crude
2560.51 6.07 2591.90 6.05
15119020 Refined bleached deodorised palmolein 1517.78 3.60 1414.30 3.30
26030000 copper ores and concentrates 1180.63 2.80 821.60 1.92
44039929 Wood & articles of wood, other 621.85 1.48 669.97 1.56
89052000 Floating/submersible drilling/production platforms # # 638.21 1.49
71081200 Other non-monetary unwrought forms of gold 250.7 0.59 637.66 1.49
85171290 Electric apparatus for line telephony, other 420.92 1.00 558.33 1.30
27101930 High Speed Diesel 1129.64 2.68 422.42 0.99
40012200 Technically specified natural rubber 364.46 0.86 419.28 0.98
85423100 Monolithic integrated circuits - digital 395.81 0.94 396.24 0.92
89040000 Tugs and pusher craft 316.64 0.75 388.66 0.91
84733010 Parts and accessories of microprocessors 465.73 1.10 362.39 0.85
7133100
Dried, shelled beans of species vigna mungo, hepper or Vigna radiate, wilczek, whether or not skinned or split
319.79 0.76 356.67 0.83
84717020 Winchester/hard disc drives 311.02 0.74 319.16 0.74
29024300 p-Xylene 301.2 0.71 318.85 0.74
29025000 Styrene 261.31 0.62 309.89 0.72
84082020 Engines of cylinder capacity>250 cc 207.2 0.49 304.12 0.71
40012100 Natural rubber in smoked sheets 392.87 0.93 304.08 0.71
Total 42158.84 42866.36Notes: *Share in total imports from ASEAN. #No trade.Source: Export Import Data Bank, Department of Commerce, Government of India.

11
3.3 At present, India has realised a bilateral trade of US$ 76 billion with ASEAN against a potential of US$ 135 billion. Table 2 shows India’s trade potential with ASEAN and ASEAN+3 countries. In case of ASEAN+3, India has achieved US$ 182 billion trade, out of an estimated potential of US$ 313 billion. Quite clearly, large amount of India’s trade with ASEAN and ASEAN+3 have remained unrealised. The highest unrealisation of trade comes from India’s trade with China (US$ 34 billion in 2012). The trade potential between ASEAN and India may touch US$ 169 billion in 2015 and US$ 202 billion in 2018, which in case of ASEAN+3 is estimated to cross US$ 445 billion in 2018.10
Table 2: India’s Trade Potential with ASEAN and ASEAN+3
Country2000 2009 2012 2012 2015 2018
Actual Actual Actual Potential Potential Potential(US$ billion)
Brunei 0.003 0.511 1.002 2.143 2.897 4.022
Cambodia 0.009 0.045 0.121 1.028 1.983 3.875
Indonesia 1.308 10.736 20.261 33.443 43.439 50.328
Lao PDR 0.005 0.021 0.168 0.845 1.439 3.023
Malaysia 1.957 8.387 14.171 27.663 34.435 38.825
Myanmar 0.227 1.405 1.875 6.308 8.983 11.559
Philippines 0.249 1.017 1.610 8.852 11.032 13.011
Singapore 2.308 12.769 22.487 26.909 31.122 35.276
Thailand 0.845 4.276 8.966 18.338 21.002 25.635
Vietnam 0.220 2.149 5.599 9.918 12.983 16.230
ASEAN 7.131 41.316 76.261 135.447 169.315 201.784
China 2.207 38.995 68.878 103.328 125.902 148.232
Japan 3.783 9.572 19.202 35.654 40.542 45.111
Korea 1.446 11.589 17.894 38.181 43.992 49.652
ASEAN+3 14.567 101.471 182.234 312.610 379.751 444.779
Note: Estimated potential is based on an augmented gravity model.
Source: De (2014).
3.4 ASEAN is negotiating the Regional Comprehensive Economic Partnership (RCEP) with its FTA partners, including India.11 Income gain from the RCEP for India is estimated to be
ASEAN-India Trade, RCEP and Trade Potential
12 ASEAN-India Maritime Connectivity Report
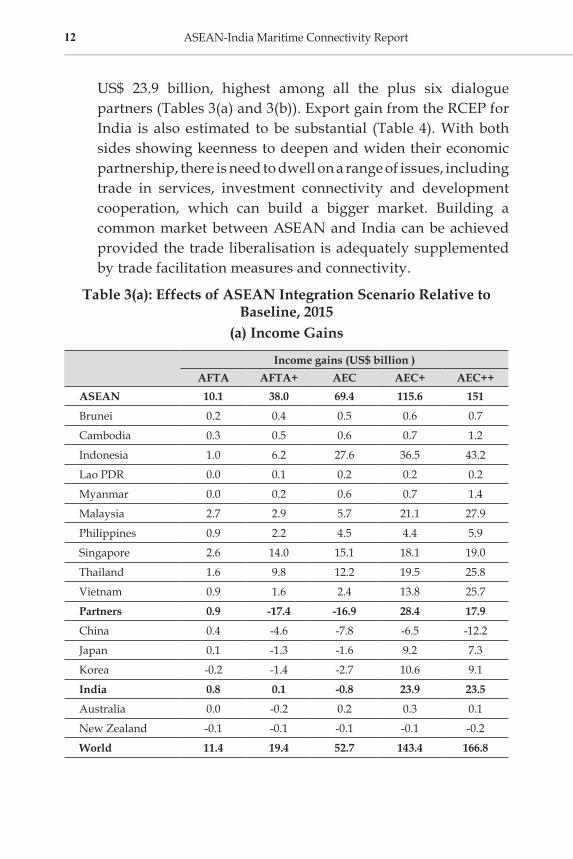
US$ 23.9 billion, highest among all the plus six dialogue partners (Tables 3(a) and 3(b)). Export gain from the RCEP for India is also estimated to be substantial (Table 4). With both sides showing keenness to deepen and widen their economic partnership, there is need to dwell on a range of issues, including trade in services, investment connectivity and development cooperation, which can build a bigger market. Building a common market between ASEAN and India can be achieved provided the trade liberalisation is adequately supplemented by trade facilitation measures and connectivity.
Table 3(a): Effects of ASEAN Integration Scenario Relative to Baseline, 2015
(a) Income Gains
Income gains (US$ billion )AFTA AFTA+ AEC AEC+ AEC++
ASEAN 10.1 38.0 69.4 115.6 151
Brunei 0.2 0.4 0.5 0.6 0.7
Cambodia 0.3 0.5 0.6 0.7 1.2
Indonesia 1.0 6.2 27.6 36.5 43.2
Lao PDR 0.0 0.1 0.2 0.2 0.2
Myanmar 0.0 0.2 0.6 0.7 1.4
Malaysia 2.7 2.9 5.7 21.1 27.9
Philippines 0.9 2.2 4.5 4.4 5.9
Singapore 2.6 14.0 15.1 18.1 19.0
Thailand 1.6 9.8 12.2 19.5 25.8
Vietnam 0.9 1.6 2.4 13.8 25.7
Partners 0.9 -17.4 -16.9 28.4 17.9
China 0.4 -4.6 -7.8 -6.5 -12.2
Japan 0.1 -1.3 -1.6 9.2 7.3
Korea -0.2 -1.4 -2.7 10.6 9.1
India 0.8 0.1 -0.8 23.9 23.5
Australia 0.0 -0.2 0.2 0.3 0.1
New Zealand -0.1 -0.1 -0.1 -0.1 -0.2
World 11.4 19.4 52.7 143.4 166.8

13
Table 3(b): Effects of ASEAN Integration Scenarios Relative to Baseline, 2015
(b) Change from BaselineChange from Baseline (%)
AFTA AFTA+ AEC AEC+ AEC++ASEAN 0.78 2.92 5.34 8.89 11.61Brunei 2.56 5.38 7.00 9.29 10.62Cambodia 2.74 5.42 6.26 7.23 12.34Indonesia 0.22 1.40 6.21 8.21 9.71Lao PDR 0.63 2.50 3.59 3.76 4.56Myanmar 0.33 1.22 4.39 4.8 9.31Malaysia 1.41 1.55 2.99 11.16 14.7Philippines 0.61 1.59 3.24 3.16 4.29Singapore 1.64 9.00 9.68 11.59 12.16Thailand 0.65 3.93 4.90 7.82 10.38Vietnam 1.10 1.81 2.82 16.00 29.83Partners 0.0 -0.04 -0.04 0.07 0.04China 0.01 -0.1 -0.16 -0.14 -0.26Japan 0.0 -0.02 -0.03 0.17 0.14Korea -0.02 -0.15 -0.27 1.07 0.92India 0.06 0.01 -0.06 1.67 1.64Australia 0.0 -0.02 0.03 0.03 0.01New Zealand -0.05 -0.07 -0.08 -0.05 -0.15World 0.02 0.04 0.10 0.26 0.30
Notes: AFTA: ASEAN Free Trade Area. Completion of AFTA by reducing all remaining tariffs on intra-ASEAN trade. AFTA+: Intensification of AFTA by removing NTBs, including regulatory barriers such as diverging standards and testing requirements (lacking detailed information on these measures, the simulation assumes a horizontal reduction of trade costs equal to 5 per cent of trade values). AEC: Further reforms that improve the investment climate, modelled via increasing FDI inflows to levels similar to those in the most open ASEAN countries. AEC+: Additional bilateral FTAs with other RCEP economies. AEC++: Additional bilateral FTAs with the United States and the EU.Source: Adapted from Petri and Plummer (2013).
3.5 India’s rising trade with ASEAN and China calls for a stronger maritime connectivity since the trade through ocean has increased rapidly in terms of both value and volume. Tables 5(a) and 5(b) present India’s export to and import from selected ASEAN countries, respectively, both in terms of value and volume. This change in trade has also been accompanied by rise in value-volume ratio in the last 13 years, particularly in India’s
ASEAN-India Trade, RCEP and Trade Potential

14 ASEAN-India Maritime Connectivity Report
export to China. Rise in value-volume ratio, in other words, support the notion that value-added maritime transportation services between India and ASEAN should be a core component of maritime development strategy.
Table 4: Export Effects of TPP, RCEP, and FTAAP
Economy
Export 2025 (US$
billion 2007)
Export gains (US$ billion 2007) Change from baseline (%)
TPP12 TPP16 RCEP FTAAPX TPP12 TPP16 RCEP FTAAPX
Brunei 9 0.2 0.3 0.9 1.2 2.6 3.8 10.5 13.3
China 4,597 -43.7 -107.8 638.3 1590.1 -1.0 -2.3 13.9 34.6
India 869 -5.2 -13.2 237.9 536.1 -0.6 -1.5 27.4 61.7
Indonesia 501 -3.9 98.3 52.6 119.3 -0.8 19.6 10.5 23.8
Japan 1,252 139.7 202.5 225.1 419 11.2 16.2 18.0 33.5
South Korea 718 -7.0 94.5 173.6 244.2 -1.0 13.2 24.2 34.0
Malaysia 336 40.0 44.2 20.2 56.1 11.9 13.2 6.0 16.7
Philippines 163 -1.4 33.5 10.8 27.5 -0.9 20.6 6.6 16.8
Singapore 712 -4.0 -17.5 -40.3 -5.0 -0.6 -2.5 -5.7 -1.9
Taiwan 476 -5.1 82.7 34.7 150.8 -1.1 17.4 7.3 21.2
Thailand 263 11.3 13.3 -5.7 74.6 4.3 5.1 -2.2 15.7
Vietnam 239 67.9 92.1 29.9 139.3 28.4 38.6 12.5 58.3
Australia 332 11.1 15.7 42.8 59.0 3.4 4.7 12.9 17.8
New Zealand 60 4.1 4.7 2.7 6.5 6.8 7.8 4.4 10.8
World 28,415 305.2 654.7 1383.7 4048 1.1 2.3 4.9 14.2
Memorandum
ASEAN 2,021 108.2 362.9 145.5 420.3 5.4 18 7.2 20.8
Notes: TPP: Trans-Pacific Partnership. TPP12: Current Trans-Pacific Partnership members comprising United States, Australia, Brunei Darussalam, Chile, Canada, Japan, Malaysia, Mexico, New Zealand, Peru, Singapore, and Vietnam. TPP16: TPP12 nations plus Korea, Indonesia, Philippines and Thailand. FTAAP: Free Trade Area of Asia Pacific. Members are Bangladesh, China, India, South Korea, Laos, Nepal, Sri Lanka and Philippines. RCEP: Regional Comprehensive Economic Partnership comprising ten ASEAN Member States and its Free Trade Agreement Partners Australia, China, India, Japan, the Republic of Korea and New Zealand. APEC: Asia-Pacific Economic Cooperation having 21 members. It includes Australia, Brunei, Canada, Chile, China, Hong Kong, Indonesia, Japan, Korea, Malaysia, Mexico, New Zealand, Papua New Guinea, Peru, Philippines, Russia, Singapore, Chinese Taipei, Thailand, United States and Vietnam. FTAAPX: Free Trade Area of the Asia Pacific plus India. It includes all economies that are members of TPP, RCEP, and/or APEC.Source: Adapted from Petri and Plummer (2013).

15
Table 5(a): India’s Export to Selected ASEAN Countries and China through Maritime Transport
Country 2012-13 2000-01CAGR 2000-12 (%)
Value-Volume ratio
2012-13 (US$ per TEU)
Value-Volume ratio
2000-01(US$ per TEU)
ChinaValue (US$ Million) 12909.90 638.56 28.47 2.10 1.68Quantity (Million TEUs) 2.71 0.11 30.90
ThailandValue (US$ Million) 2576.60 314.33 19.16 0.79 1.22Quantity (Million TEUs) 0.20 0.04 14.92
IndonesiaValue (US$ Million) 3146.44 365.39 19.65 1.23 2.13Quantity (Million TEUs) 0.39 0.08 14.31
Vietnam Value (US$ Million) 3760.11 192.91 28.08 0.89 2.68Quantity (Million TEUs) 0.33 0.05 16.81
Source: Calculated based on Export Import Data Bank, Department of Commerce, Government of India.
Table 5(b): India’s Import from Selected ASEAN Countries through Maritime Transport
Country 2012-13 2000-01CAGR 2000-12
(%)
Value-Volume ratio
2012-13 (US$ per TEU)
Value-Volume ratio
2000-01(US$ per TEU)
ThailandValue (US$ Million) 3455.45 266.38 23.81 0.75 0.50
Quantity (Million TEUs) 0.26 0.01 28.04
SingaporeValue (US$ Million) 3706.47 774.80 13.93 0.33 0.66
Quantity (Million TEUs) 0.12 0.05 7.66
MalaysiaValue (US$ Million) 5555.38 883.68 16.56 0.74 1.97
Table 5 (b) continued...
ASEAN-India Trade, RCEP and Trade Potential

16 ASEAN-India Maritime Connectivity Report
Quantity (Million TEUs) 0.41 0.17 7.49
IndonesiaValue (US$ Million) 8168.76 828.28 21.01 0.76 2.01
Quantity (Million TEUs) 0.62 0.17 11.56
VietnamValue (US$ Million) 1113.89 11.02 46.91 0.90 0.89
Quantity (Million TEUs) 0.10 0.00 46.97
Source: Calculated based on Export Import Data Bank, Department of Commerce, Government of India.
Table 5 (b) continued...

Removing Non-Tariff Measures (NTMs): Key to Economic Integration
4.1 Non-Tariff Measures (NTMs) have gained immense importance as tariff-based barriers to trade have gradually declined. Table 6 shows a comprehensive index of non-tariff measures for ASEAN+3 countries. The index ranges from 0 to 100, where a higher value indicates higher NTM. As on 2012, the Philippines has most NTMs, whereas Cambodia has the least. India has improved its rank from 48 in 2009 to 17 in 2012. India and ASEAN have to remove the impediments to trade and investment such as high NTMs, lack of connectivity – physical, digital and social, and regulatory barriers, to mention a few.12
Table 6: Non-Tariff Measures Index for ASEAN+3 (0-100 worst)
Year 2009 2010 2012Country Score Rank Score Rank Score RankCambodia 4.24 14 6.93 16 4.68 1China 22.63 35 23.77 34 n/a n/aIndia 34.09 48 29.88 44 37.64 17Indonesia 44.95 66 43.27 71 40.89 19Japan 65.39 88 61.99 84 63.18 29Malaysia 17.11 28 16.92 27 16.61 2Philippines 64.53 86 88.01 90 75.3 58Singapore 23.80 38 19.92 31 29.11 10Thailand 26.90 40 69.26 86 53.94 26Vietnam 34.89 50 21.56 32 22.36 5
Source: The Global Enabling Trade Report, World Economic Forum (2012).
4

18 ASEAN-India Maritime Connectivity Report
4.2 Since merchandise trade between India and ASEAN is largely conducted through ocean, without a stronger maritime connectivity it would not be possible to realise the full potential of the regional free trade, which are already in place or are currently under negotiation. Moreover, ASEAN-India maritime connectivity is the key to production networks. There are some appealing reasons for a stronger maritime connectivity between ASEAN and India such as:
• One, higher transaction costs and time at port would certainly diminish the potential of India (and ASEAN countries too) joining global or regional value chains.13
Since trade facilitation and logistics performance matter significantly more for trade in parts and components, which typically circulate within production networks, than for trade in final goods, stronger maritime connectivity will spur global and regional value chains.
• Two, ASEAN and India have been witnessing various economic corridors. A stronger maritime connectivity between India and ASEAN will also enhance connectivity among various economic corridors between the two regions.
• Three, according to the World Shipping Council (WSC), the emissions from ships are one sixth of that by road and one half of those emitted by rail. On environmental ground, ocean transportation is, therefore, relatively more preferred than other modes of transportation.

5.1 Ports are nodes for linking different modes of transport and important element in global supply chain. It is important to provide connectivity and other infrastructure both within the port and to hinterland. It allows goods to reach the consumers from source of production in shortest possible time and most cost-effective way. Linkage with ports can be through three modes, namely, rail, road and inland waterways. Ports and shipping are the major infrastructure responsible for merchandise trade between ASEAN and India.
5.2 India presently has 212 seaports, of which 12 are major ports and 200 are non-major ports.14 Indian ports are regulated by the Indian Ports Act 1908, where the Government of India looks after the major ports, and the non-major ports are managed by the Indian states. As noted in Table 7, Indian ports together handled 934.01 million tonnes of cargo in 2012-13, of which major ports had a share of 58.4 per cent (546 million tonnes) and non-major ports shared 41.57 per cent (388 million tonnes). Non-major ports in India have been growing much faster than the major ports. The volume and share of non-major ports in Indian total cargo have grown rapidly since beginning of the last decade, whereas the major ports have witnessed an opposite trend (Table 7).
Performance of Indian Maritime Sector
5

20 ASEAN-India Maritime Connectivity Report
Appendix 3 presents the time trend of cargo handled by major and non-major ports of India. Within major ports, Mumbai, Jawaharlal Nehru and Kandla ports are running with over capacity (Table 8). Kandla is the biggest port, which has over 17 per cent share in total cargo handled by all major ports of India.
Table 7: Cargo Handled by Indian Ports
Year
Major Ports Non-Major Ports All Ports
Volume Share* Volume Share* Volume Share*(Million tonnes) (%) (Million
tonnes) (%) (Million tonnes) (%)
2000-01 281.13 76.29 87.37 23.71 368.50 100.002005-06 423.57 73.83 150.12 26.17 573.69 100.002012-13 545.79 58.44 388.23 41.57 934.01 100.00CAGR 2000-12 (%) 5.68 13.23 8.06
Note: *Share in total cargo.Source: Calculated based on Update on Indian Port Sector (30 September 2013), Ministry of Shipping, Government of India..
Table 8: Trends in Port-wise Cargo Handled
Port
2000-01 2012-13
Traffic Share* Traffic Share* Capacity Share* Capacity Utilisation
(MT) (%) (MT) (%) (MT) (%) (%)
Kolkata 12.00 4.26 11.84 2.17 17.14 2.46 69.08Haldia 18.00 6.40 28.08 5.14 50.75 7.29 55.33Paradip 19.90 7.07 56.55 10.36 80.30 11.53 70.42Vizag 44.69 15.88 59.04 10.82 66.33 9.52 89.01Ennore # # 17.89 3.28 31.00 4.45 57.71Chennai 41.22 14.65 53.40 9.78 83.19 11.94 64.19Tuticorin 12.58 4.47 28.26 5.18 33.34 4.79 84.76Cochin 13.14 4.67 19.85 3.64 41.86 6.01 47.42New Mangalore 17.89 6.36 37.04 6.79 50.97 7.32 72.67Mormugao 19.63 6.98 17.69 3.24 41.90 6.02 42.22Mumbai 27.06 9.62 58.04 10.63 44.53 6.39 130.34Jawaharlal Nehru 18.58 6.60 64.49 11.82 64.00 9.19 100.77Kandla 36.74 13.05 93.62 17.15 91.22 13.10 102.63Total 281.43 100.00 545.79 100.00 696.53 100.00 78.36
Note: *Share in total. # Not in operation. MT - million tonnes. Source: Calculated based on Basic Port Statistics of India, various issues, Government of India.

21
5.3 Over the years, handling capacity of major ports has increased to cater to the growing volume of international trade. Today, Indian major ports handle 546 million tonnes of cargo against a capacity of 697 million tonnes, thereby showing 78 per cent utilisation of capacity in 2012-13 (Table 8). But, three ports acted differently, namely, Mumbai, Jawaharlal Nehru and Kandla; all of them witnessed overutilisation of capacity (Table 8). While ports in west coast have flourished more rapidly than the east coast over time, some major ports have also witnessed fall in their respective shares in Indian port sector such as Kolkata, Haldia, Vizag, Chennai, and Cochin; most of them are located along the east coast facing Southeast Asia. In sharp contrast, distribution of containerised cargo across Indian major ports appears to be relatively balanced, where east coast ports like Chennai, Vizag, etc., handle higher container cargo, compared to many west coast ports. With 4.26 million TEUs (55.25 per cent share in total container volume), Jawaharlal Nehru port has become India’s top container port (Table 9). Chennai port comes next. Incidentally, these are the two major ports, which are largely privatised since India adopted port reform process in late 1990s and are also relatively well connected with ports in Southeast and East Asia.
5.4 In case of composition of cargo handled at major ports in 2012-13, the largest commodity group (in terms of percentage share in total cargo handled) was POL (34 per cent), followed by container traffic (22 per cent), other cargo (19 per cent), coal (19 per cent), etc.15 Total container traffic at major ports has increased, both in terms of tonnage and number (TEUs) by 2.7 per cent and 1.3 per cent, respectively, in 2012-13, where Jawaharlal Nehru Port (JNP) has emerged as the leading container port with a share of 55 per cent in Indian total container traffic (Table 9).
5.5 Performance and efficiency of ports and shipping positively contribute to the growth of trade and vice versa.16 With rise in competition, performance of Indian ports has improved drastically in the last two decades. Noted in the Economic Survey 2012-13, some prominent port-related performance indicators in Table 10 show improvement over time. The average output
Performance of Indian Maritime Sector
22 ASEAN-India Maritime Connectivity Report
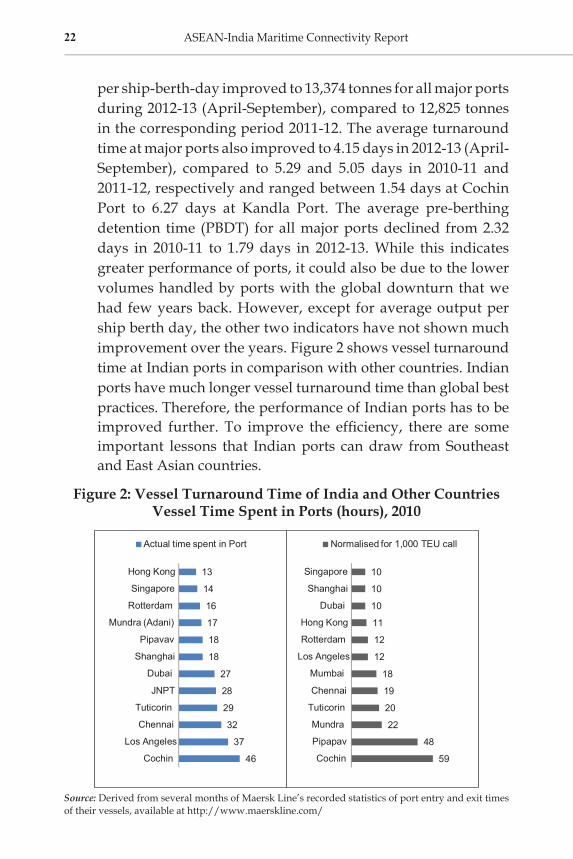
per ship-berth-day improved to 13,374 tonnes for all major ports during 2012-13 (April-September), compared to 12,825 tonnes in the corresponding period 2011-12. The average turnaround time at major ports also improved to 4.15 days in 2012-13 (April-September), compared to 5.29 and 5.05 days in 2010-11 and 2011-12, respectively and ranged between 1.54 days at Cochin Port to 6.27 days at Kandla Port. The average pre-berthing detention time (PBDT) for all major ports declined from 2.32 days in 2010-11 to 1.79 days in 2012-13. While this indicates greater performance of ports, it could also be due to the lower volumes handled by ports with the global downturn that we had few years back. However, except for average output per ship berth day, the other two indicators have not shown much improvement over the years. Figure 2 shows vessel turnaround time at Indian ports in comparison with other countries. Indian ports have much longer vessel turnaround time than global best practices. Therefore, the performance of Indian ports has to be improved further. To improve the efficiency, there are some important lessons that Indian ports can draw from Southeast and East Asian countries.
Figure 2: Vessel Turnaround Time of India and Other CountriesVessel Time Spent in Ports (hours), 2010
46
37
32
29
28
27
18
18
17
16
14
13
Cochin
Los Angeles
Chennai
Tuticorin
JNPT
Dubai
Shanghai
Pipavav
Mundra (Adani)
Rotterdam
Singapore
Hong Kong
Actual time spent in Port
59
48
22
20
19
18
12
12
11
10
10
10
Cochin
Pipapav
Mundra
Tuticorin
Chennai
Mumbai
Los Angeles
Rotterdam
Hong Kong
Dubai
Shanghai
Singapore
Normalised for 1,000 TEU call
Source: Derived from several months of Maersk Line’s recorded statistics of port entry and exit times of their vessels, available at http://www.maerskline.com/

23
Table 9: Container Traffic at Major Ports
Port2000-01 2006-07 2012-13 CAGR,
2000-13Volume Share* Volume Share* Volume Share*(MTEUs) (%) (MTEUs) (%) (MTEUs) (%) (%)
Kolkata 0.14 5.67 0.24 4.33 0.46 5.97 10.61
Haldia 0.05 2.02 0.11 1.99 0.14 1.82 8.58
Paradip 0.00 0.00 0.00 0.00 0.01 0.13 #
Vizag 0.02 0.81 0.06 1.08 0.25 3.24 23.30
Chennai 0.35 14.17 0.89 16.06 1.54 19.97 13.08
Tuticorin 0.16 6.48 0.38 6.86 0.48 6.23 9.68
Cochin 0.14 5.67 0.23 4.15 0.34 4.41 7.35
New Mangalore 0.00 0.00 0.02 0.36 0.05 0.65 30.32
Mormugao 0.00 0.00 0.01 0.18 0.02 0.26 14.35
Jawaharlal Nehru 1.19 48.18 3.30 59.57 4.26 55.25 11.21
Mumbai 0.32 12.96 0.14 2.53 0.06 0.78 -13.29
Kandla 0.09 3.64 0.18 3.25 0.12 1.56 2.10
Total 2.47 100.00 5.54 100.00 7.71 100.00 9.95
Notes: *Share in total. # Not applicable. MTEUs - million TEUs. Source: Calculated based on Basic Port Statistics of India, various issues, Government of India.
Table 10: Some Performance Indicators of Ports in India
Indicators 1990-91 2000-01 2008-09 2009-10 2010-11 2011-12 2012-13
Average Turnaround Time (Days) 8.1 4.24 4.2 4.63 5.29 4.8 4.15
Average Pre-berthing Detention Time (Days) 2.16 1.19 1.63 2.16 2.32 2.05 1.79
Average Output per Ship-berth-day (Tonnes) 3372 6961 9669 9215 9140 12825 13374
Source: Ministry of Shipping, Government of India.
5.6 A number of new technologies have been introduced to implement the International Ship and Port Security (ISPS) code. All the major ports in India are ISPS compliant. Table 11 shows some key maritime facilitation services started under this compliance programme. Various activities are performed for an efficient implementation of e-Governance in the DG Shipping and to comply with best international practices. Table 12 shows existing status of some e-Governance projects.
Performance of Indian Maritime Sector

24 ASEAN-India Maritime Connectivity Report
Table 11: Maritime Facilitation Services under ISPS
Name of the Project Details of the Project & Scope of Service
Maritime Security and Surveillance Systems: Automatic Identification System (AIS)
Maritime Surveillance System is used worldwide to collect information, classify and track threats, monitor the correct answer and personnel, and control entry to ports and inland waterways. Integration of this system with Automatic Identification System (AIS) technology provides situational awareness by identifying the approaching ships. The software analyses the data and identifies situations which are out of specification, and transmits alerts to the relevant authorities. When an unidentified ship approaches inland waters the operators are alerted with warnings. The system also provides support for emergency responders in emergency rescue and emergency situations. Maritime Surveillance System includes wireless monitoring, remote monitoring, night vision systems and video analysis. It compiles data from a variety of sensors and other sources and processes the data to critical decision support for coastal, port and waterway authorities.
Electronic Commerce (EC)/ Electronic Data Interchange (EDI)
EDI is an indispensable part for maintaining the efficient ports operation and for the entire trade and transport cycle.
Port Community System (PCS)
It combines the electronic flow of information and function as a central hub for Indian ports and other stakeholders, such as shipping lines or agency, surveyors, stevedores, banks, container freight stations, government regulators, customs house agents, importers, exporters and railways through a common interface. It is accessible through a secure and personalised web browser. PCS also works as a data repository for research and analysis. Ship, cargo, containers, transport finance related news and e-payment module with 12 banks are available online. Non-major ports like Pipavav, Mundra, and Dahej have adopted PCS. Efforts are on to transform other non-ports to PCS.
Source: Report of the Working Group for National Transport Development Policy Committee (NTDPC) (2012), Ministry of Shipping, Government of India.
Table 12: Implementation of e-Governance in DG Shipping
Name of the Project
Details of the Project & Scope of Service
e-Samudra project
This project is one of the most important e-Governance initiatives to be implemented in the Directorate and its allied offices. Scope of the project includes computerisation of various business functions of DG Shipping. It involves the development of different modules resulting in process automation and creation of huge database which contains important information about different business units such as ships, licenses, testing, Continuous Discharge Certificate (C.D.C.), etc.
Table 12 continued...

25
e-Pariksha Project
This project aims to implement online competitive examinations for nautical and technical wings. This project would be carried out over all the test centres across the country.
Vessel Traffic Management System (VTMS)
It is a real-time system providing full information on arrivals, departures and transits among the maritime parties. The information is used by the port authorities to manage port traffic and monitor waterways. The VTMS ensures safe navigation services for ships in port and serves as a command centre for crisis management operations, such as Service and Rescue (SAR), oil spill detection and anti-terrorism activities. Besides monitoring the waterways, regulatory compliance enforces safe navigation and protection of ships carrying dangerous cargo. VTMS systems collaborate with Coast Guard and other agencies to ensure safety in port waters. VTMS contains special sensors and systems for oil and gas connections to ensure safety of the ship during transit and sunlight.
Harbour Craft Transponder System
Maritime authorities of many countries, in cooperation with the Coast Guard and Navy follow implementation of the Harbour Craft Transponder System and monitor small powered harbour and pleasure craft. All harbour craft must carry a transponder that provides real-time data such as ship’s identity, position, speed, course and other information which are transmitted to the host system in shore by wireless network. The craft can also alert the control centre if there is a security threat or emergency.
Radio Frequency Identification (RFID) and Container Tracking System
Port of Singapore (PSA) employs RFID transponders in container yard to create a multi-dimensional tracking network. PSA tracks thousands of cargo containers and manages arrival and departure of up to 50 ships daily. A centralised system manages placement and location of the container ships. RFID transponder guides Automatic Guided Vehicles (AGVs). All container transfers are controlled by AVGs and unmanned cranes perform batch work without human intervention. RFID automated terminals are more efficient than their manned counterparts.
Source: Report of the Working Group for National Transport Development Policy Committee (NTDPC) (2012), Ministry of Shipping, Government of India.
5.7 In discussing maritime transport, a distinction must be made between the owner of the ship, on the one hand, and, the owner of the cargo, on the other. The two are rarely the same. Prior to 1973 (first oil crisis), most oil companies owned maritime transport subsidiaries. Today, major oil producers outsource maritime transport to specialist companies who are more flexible in their organisation. Although shipping plays an immensely important role in building merchandise trade,17 shipping of containerised cargo in India has been mostly managed by the foreign lines, primarily due to lack of fleet capacity of the Indian shipping lines. The composition of the Indian fleet is
Table 12 continued...
Performance of Indian Maritime Sector

26 ASEAN-India Maritime Connectivity Report
largely made up of bulk carriers and POL carriers. As noted in Table 13, foreign lines alone handled 9.49 million TEUs, out of a total of 10.02 million TEUs, in 2011-12. Indian lines, such as Shipping Corporation of India (SCI), handled a paltry volume of half a million TEUs.18 Private shipping lines in India have largely failed to strengthen adequate fleets. Barring Great Eastern Shipping, Mercator Lines and Essar Shipping and Logistics, the other companies are yet to make any presence in terms of gross tonnage or number of fleets (Table 14). Indian shipping companies face problems of restricted cash inflows due to very low charter hire and freight rates in all segments of shipping (INSA 2014). In other words, the shortage of adequate ships in Indian lines has actually contributed in favour of foreign lines. According to the Indian National Shipowners’ Association (INSA), the foreign container lines continue to carry India’s cargo without their participation in the Indian flag or creation of any shipping assets in India.19
Table 13: Container Traffic Handled by Shipping Lines at Major Ports
2000-01 2005-06 2011-12(million TEUs)
Export(i) Indian Lines 0.14 0.27 0.28(ii) Foreign Lines 1.25 2.31 4.72(iii) Total 1.39 2.58 5.00Import(i) Indian Lines 0.13 0.26 0.26(ii) Foreign Lines 1.17 2.33 4.76(iii) Total 1.31 2.59 5.02Total(i) Indian Lines 0.27 0.53 0.54(ii) Foreign Lines 2.42 4.64 9.49(iii) Total 2.70 5.17 10.02
Source: Ministry of Shipping, Government of India, New Delhi.
5.8 There has been a sharp decline in the share of Indian ships in the carriage of India’s overseas trade from about 40 per cent in the late 1980s to 10.4 per cent in 2011-12 with 17.05 per cent share in India’s oil imports. Given the relatively low participation of Indian ships in India’s trade and ageing of the Indian ships and the average age of the Indian fleet increasing from 15 years in 1999 to 16.83 years as on 31 December 2012 (with 41.59 per cent

27
of the fleet over 20 years and 11 per cent in the age group 16-20 years) – there is an urgent need to increase the shipping fleet so that it is at least adequate to meet India’s trade volumes. In order to make the Indian shipping industry more competitive at the international level, the Government of India has introduced tonnage tax regime for the shipping sector in 2004 by which taxation for Indian shipping companies has been brought in line with international fiscal regime. Further, the Indian shipping industry has been provided cargo support through right-of first refusal and policy of imports at fob rate for the Government-owned/controlled cargoes. Chartering of vessels for movement of cargo on private account is regulated through the Director General of Shipping, taking into consideration the availability of Indian flag vessels.
5.9 A large and modernised shipping fleet will not only lead to higher growth, employment and higher earning/saving of foreign exchange, but also increase India’s bargaining power with foreign liners who carry Indian cargo as per their schedule and also discriminate in the rates.20 India shall promote the growth of national shipping. Countries in Southeast and East Asia have built strong national shipping assets, which could provide important lessons to India, while strengthening domestic shipping lines as well as sourcing new fleets.
Table 14: Distribution of Indian Tonnage#
Sr. No. Name of the Company Ships Gross Tonnage (Million GT) Share* (%)
1 Shipping Corporation of India 86 3.3954 32.592 Great Eastern Shipping Co. Ltd. 35 1.4755 14.163 Essar Shipping & Logistics Ltd. 22 0.2703 2.594 Mercator Lines Ltd. 18 0.5669 5.446 Varun Shipping Co. Ltd. 8 0.3271 3.147 Sanmar Shipping Ltd. 6 0.1901 1.838 Radiant Shipping Ltd. 4 0.0906 0.879 Five Stars Bulk Carriers Ltd. 4 0.2059 1.9810 Chowgle Steamships Ltd. 3 0.0679 0.6511 West Asia Maritime Ltd. 3 0.0703 0.6812 Others 955 3.3753 32.40
Total 1154 10.4170 100.00
Notes: *Share in total. # As on 31 December 2012.Source: Ministry of Shipping, Government of India.
Performance of Indian Maritime Sector
28 ASEAN-India Maritime Connectivity Report
5.10 India has recently allowed domestic shipping lines to operate foreign flag vessels. So far, Indian operators were not allowed to own foreign flag vessels — at most, they could charter these for specified periods. Also, they could not employ foreigners on Indian flag-bearing ships. Essentially, removing the restriction would mean Indian companies will be able to register ships in these jurisdictions and yet operate them out of India. This will bring them on par with competition that extensively uses dual flags. The change in rules means that Indian ship owners will not have to set up foreign subsidiaries and the revenue from these operations will come to India. The tonnage carried would be counted towards the Indian company’s tonnage, helping them raise foreign funds more easily.
5.11 Within India, majority of the cargo augmentation occurs at the Jawaharlal Nehru Port. Shippers prefer this port due to availability of better mainline liner services along with competitive ocean freight rates. Mundra and Pipavav (both in the west coast) in recent years have attracted the attention of some of the major shipping lines, and as a result the cargo handling at these new ports has increased. However, on the east coast, containerised cargo volumes are low. This is due to lesser industrialisation (for finished goods) and lesser port handling capacity. Therefore, the presence of direct liner service in east coast is minimal, compared to the west coast. It has been observed that some shippers, located near the east coast ports, also prefer Jawaharlal Nehru port as gateway for their cargo due to better service availability and competitive freight rates. Developing adequate port capacity along with ancillary infrastructure is, therefore, essential, especially for the cargo destined to or originating from the eastern neighbour.21
5.12 The Maritime Agenda 2010-20 of the Government of India has indicated 1.21 billion tonnes of cargo for major ports of India in the year 2019-20. According to an RIS forecast, Indian major port traffic is likely to touch about 1 billion tonnes by turn of this decade and about 2 billion tonnes by 2030 (Figure 3).22 The volume may

29
go-up substantially if we factor in the cargo handled by the non-major ports, which we had to exclude in this study due to non-availability of statistical data. Commodity-wise traffic forecast is given in Figure 4. The bottom line is that the port capacity has to be augmented to cater to the rising traffic. The Government of India has been following the strategy of increasing investment in infrastructure through a combination of public investment and PPP. According to the Planning Commission, the Twelfth Five Year Plan with an outlay of Rs. 30.57 billion (gross budgetary support) for the port sector envisages an increase in the capacity of major ports to 1229.29 million tonnes by the end of 2016-17 from the pre-Plan base level of 696.5 million tonnes with 12 per cent average annual growth in capacity addition. The projected capacity, according to the Planning Commission, during the terminal year of the Twelfth Five Year Plan period for the major ports would be 1229.29 million tonnes, nearly 1.76 times of the existing capacity. The total Plan outlay projected to augment the capacity by 532.71 million tonnes is Rs. 672.96 billion; most of the investment is expected to flow from the private sector, i.e. Rs. 510.36 billion (76 per cent of total) and the remaining share of 24 per cent is anticipated from internal resources and budgetary support of the Government of India. Plan-wise projected investment is outlined in Figure 5. Therefore, it appears that most of this investment has to come from the private sector including foreign direct investment (FDI). FDI up to 100 per cent under the automatic route is currently permitted for construction and maintenance of ports and also for shipping.23
5.13 While efforts are being made to improve the port infrastructure, there is need to upgrade the facilities at existing ports with regard to cargo handling, stevedoring, pilotage services, bunkering services and warehousing facilities; increase the drafts to facilitate transhipment of Indian cargo, which otherwise take place outside the country; and rationalise the different port charges to make them comparable with best practice levels. The Maritime Agenda 2010-20 covers some of these issues like full mechanisation of cargo handling and movements, having draft of not less than 14m
Performance of Indian Maritime Sector

30 ASEAN-India Maritime Connectivity Report
in major ports and 17m in hub ports, and shifting of transhipment of Indian containers from foreign ports to Indian ports.24
Figure 3: Traffic Forecast for Major Ports of India, 2030
Note: *Forecast.Source: RIS.
Figure 4: Commodity-wise Traffic Projections, 2016-17 to 2031-32
Source: Working Group Report on Ports and Shipping, NTDPC (2012).
638.33 630.13872
1215.22
3355.68
12th Plan (2012-17) 13th Plan (2017-22) 14th Plan (2022-27) 15th Plan (2027-32 ) 2012-13 to 2031-32
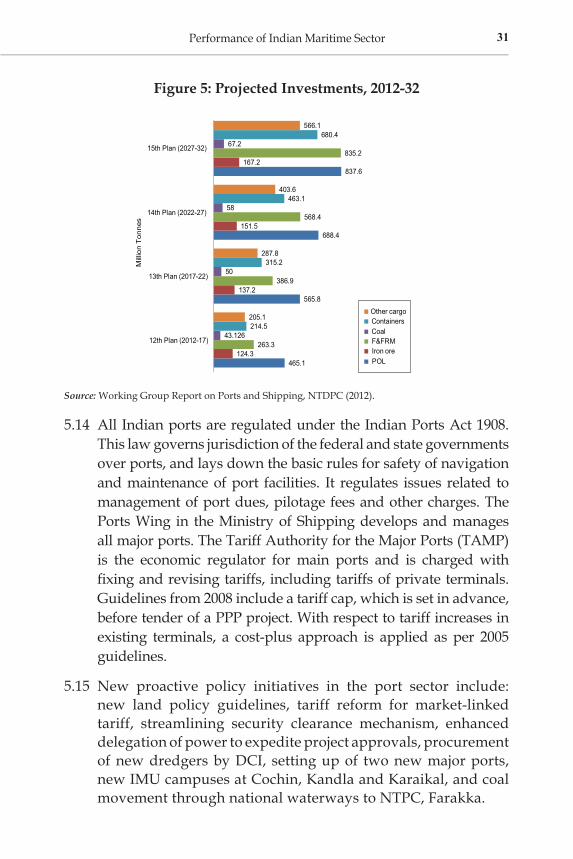
31
Figure 5: Projected Investments, 2012-32
Source: Working Group Report on Ports and Shipping, NTDPC (2012).
5.14 All Indian ports are regulated under the Indian Ports Act 1908. This law governs jurisdiction of the federal and state governments over ports, and lays down the basic rules for safety of navigation and maintenance of port facilities. It regulates issues related to management of port dues, pilotage fees and other charges. The Ports Wing in the Ministry of Shipping develops and manages all major ports. The Tariff Authority for the Major Ports (TAMP) is the economic regulator for main ports and is charged with fixing and revising tariffs, including tariffs of private terminals. Guidelines from 2008 include a tariff cap, which is set in advance, before tender of a PPP project. With respect to tariff increases in existing terminals, a cost-plus approach is applied as per 2005 guidelines.
5.15 New proactive policy initiatives in the port sector include: new land policy guidelines, tariff reform for market-linked tariff, streamlining security clearance mechanism, enhanced delegation of power to expedite project approvals, procurement of new dredgers by DCI, setting up of two new major ports, new IMU campuses at Cochin, Kandla and Karaikal, and coal movement through national waterways to NTPC, Farakka.
Performance of Indian Maritime Sector
465.1
565.8
688.4
837.6
124.3
137.2
151.5
167.2
263.3
386.9
568.4
835.2
43.126
50
58
67.2
214.5
315.2
463.1
680.4
205.1
287.8
403.6
566.1
15th Plan (2027-32)
14th Plan (2022-27)
13th Plan (2017-22)
12th Plan (2012-17)
Mill
ion
Ton
nes
Other cargoContainersCoalF&FRMIron orePOL

32 ASEAN-India Maritime Connectivity Report
5.16 Key projects awarded during 2013-14 include:
• Fourth container terminal at Jawaharlal Nehru Port, with an investment of Rs. 79.15 billion;
• Container terminal at Kamrajar Port, Ennore with an investment of Rs. 12.7 billion;
• Mechanised iron ore handling facility at WQ-1 at Visakhapatnam Port with an investment of Rs. 9.4 billion;
• Container terminal at Visakhapatnam Port with an investment of Rs. 6.33 billion;
• Mechanised container handling operations at KDS, Kolkata Port with an investment of Rs. 4.9 billion; and
• Oil jetty and ship bunkering terminal at Kandla Port with an investment of Rs. 2.33 billion.
5.17 Key Policy Developments in port sector include the following:
i) National Maritime Development Programme (NMDP): NMDP was created by the Ministry of Shipping in 2005 for capacity expansion and hinterland connectivity improvement at major ports. The programme states that over 60 per cent of the needed funds can be raised from private sector. Government has also shown intentions of delegating powers to Port Trusts for faster decision making and implementation. In addition, a number of measures were announced to promote foreign investment in the sector:• No approval required upto 51 per cent of foreign equity
for projects providing supportive services to water transport.
• Automatic approval of foreign equity upto 100 per cent in construction and maintenance of ports and harbours. However, the proposal needs to be referred to FIPB for investments more than Rs 15 billion.
• Invite open tender for private sector participation on Build-Operate-Transfer (BOT) basis.

33
• Grant permission for formation of joint ventures between major ports and foreign ports, major ports and non-major ports and major ports and companies.
ii) Model Concession Agreement (MCA): MCA was approved in 2008. MCA regulates the functioning of the major ports in terms of PPP projects. It consists of all the elements and problems that are usually part of an international terminal concession. Tariffs cannot be set by the concessionaire, but are dependent on decisions of TAMP. The new MCA (2009) allows a port trust to directly approach the inter-ministerial PPP Review Committee for final project approval without acquiring in-principle approval.
iii) B K Chaturvedi Committee Report: The committee found that tariff fixing process by TAMP sometimes led to delays, which slows down entire procurement process for the PPP projects. Also, performance standards used by TAMP and those agreed between the parties in concession agreements could differ. The Committee suggested following policy changes to TAMP:
• Short term: Enhancing tariff-setting mechanism through own capacity building and streamlining of procedures;
• Medium term (1-2 years): Delegation of tariff-setting to the main port trusts with TAMP acts as the appellate authority; and
• Long-term (2 years): Leave tariff setting mechanism to market forces. This can be implemented for port terminals where competitive environment already exist.
5.18 India’s merchandise trade with ASEAN has increased to over US$ 75 billion in 2012 from a mere US$ 7 billion in 2000. Greater maritime connectivity with Southeast and East Asia is, therefore, a rewarding choice for Indian ports to build additional port capacity and Indian carriers to strengthen their fleets. This would help not only to achieve higher performance and efficiency of maritime services, but would also lead to the growth of trade and investment between ASEAN and India.
Performance of Indian Maritime Sector


6.1 Shipping plays an important role in transport sector of India and ASEAN. Most of the merchandise trade by volume is moved by sea. India has one of the largest merchant fleets in the developing world, and, in terms of gross tonnage under its flag, the country occupies 16th rank in the world. Indian maritime sector facilitates not only transportation of national and international goods, but also offers a variety of other services such as cargo handling, shipbuilding and ship repairing, freight forwarding, light-house facilities and training of naval staff.
6.2 India had a fleet of 1071 ships with 10.45 million GT as on March 2011 (Table 15). Of these, 722 ships (67 per cent) with 1.02 million GT (9.8 per cent) were engaged in coastal trade and the remaining 349 vessels with 9.43 million GT in overseas trade. Thus, the tonnage for overseas trade is 90 per cent of India’s GT, compared to only 10 per cent of the tonnage used for the coastal trade. The Indian shipping tonnage was stagnant between 6 to 7 million GT till June 2004, but later increased to 10.45 million GT in March 2011. Figure 6 compares India’s GT of ships with selected Southeast and East Asian countries.
ASEAN-India Maritime Links
6

36 ASEAN-India Maritime Connectivity Report
Majority of the Indian tonnage was carried by the Shipping Corporation of India (SCI) with a share of 33.3 per cent (3.15 million GT with 83 ships).
Table 15: Growth of Indian Shipping (as on March 2011)
YearCoastal Overseas Total
Ships G.T.(Million) Ships G.T.
(Million) Ships G.T.(Million)
01-04-1971 66 0.23 184 2.21 250 2.4401-04-1981 59 0.25 331 5.49 390 5.7401-04-1991 163 0.52 255 5.52 418 6.0401-04-2001 316 0.70 230 6.12 546 6.8201-04-2010 678 1.00 327 8.69 1003 9.6931-03-2011 722 1.02 349 9.43 1071 10.45
Source: Various Issues of Review of Maritime Transport, UNCTAD.
Figure 6: Gross Tonnage for Select Countries, 1980-2012 Source: Review of Maritime Transport (2012), UNCTAD.
4
8
6
13
12
2
7
11
45
70
7
14
17
30
38
8
8
22
41
54
6
6
7
9
10
1980
1990
2000
2010
2012
Mill
ion
GT
India Singapore China Hong Kong Korea

37
6.3 Barring Lao PDR, the ASEAN countries and India have long coastline, dotted with many ports.25 However, the structural gap in terms of maritime and shipping infrastructure is quite visible within ASEAN as well as between India and ASEAN. Within ASEAN, the CLMV countries rank far behind the other ASEAN countries and India in cargo volume and shipping tonnage (Table 16). Predominant ports in ASEAN are located in the developing parts of ASEAN and have been growing faster than those located in CLMV or Mekong subregion. In the containerised cargo segment, out of world’s top 25 ports, seven ports come from ASEAN and one from India, among which Singapore Port with 31.65 million TEUs in 2012 (about 5 per cent share in world total) occupies the second position in the world. India’s Jawaharlal Nehru Port with 4.26 million TEUs ranks 21st in the world (Table 17). Appendix 5 presents the port-wise container cargo volume, whereas Appendix 6 presents India’s non-containerised cargo volume with ASEAN.
Table 16: Maritime Profile of ASEAN+4 Countries
Country Coastline (km)
Number of
Seaports
Number of Container
Ports
Container Port Traffic, 2011
(Million TEUs)
Gross Tonnage of
Shipping, 2010Brunei 161 1 1 0.11 9Cambodia 443 2 1 0.24 544Indonesia 54716 154 9 9.04 1340Malaysia 4675 25 12 19.91 315Myanmar 1930 1 1 0.20 29Philippines 36289 62 7 5.26 446Singapore 193 1 1 30.73 1599Thailand 3219 20 7 7.17 363Vietnam 3444 15 6 6.32 579China 14500 172 32 139.74 2030India 7517 212 16 9.98 340Japan 29751 292 40 18.89 684Korea 2413 16 9 20.83 786
Source: Based on ASEAN Secretariat Statistics, available at http://www.asean.org/resources/category/asean-statistics (2014).
ASEAN-India Maritime Links

38 ASEAN-India Maritime Connectivity Report
Table 17: Rank of ASEAN Ports by Container Volume, 2012
Rank Port, Country Volume (Million TEUs)
Share in World (%)
2 Singapore, Singapore 31.65 5.26
10 Port Kelang, Malaysia 10.01 1.66
14 Tanjung Pelepas, Malaysia 7.70 1.28
16 Laem Chabang, Thailand 5.93 0.99
17 Ho Chi Minh, Vietnam 5.19 0.86
21 Jawaharlal Nehru, India 4.26 0.71
22 Manila, Philippines 3.71 0.62
24 Tanjung Perak, Indonesia 2.85 0.47
World total 601.77
Source: RIS based on Containerization International Yearbook, 2013.
6.4 Major container ports in ASEAN are over-utilised; both Singapore and Port Klang have been running over 100 per cent of capacity.26 To add capacity, ASEAN and India are building new container ports. Major container ports in ASEAN are adding container handling capacity to manage additional 100 million TEUs by end of the ongoing decade (Table 18). India is also developing container terminals at New Mangalore, Ennore, Tuticorin, Chennai and Jawaharlal Nehru ports.27 Figure 7 shows product-wise capacity requirement at major and non-major ports of India. ASEAN-India maritime connectivity will be further strengthened with completion of the aforesaid projects.
Table 18: Container Capacity Addition in Major ASEAN Ports*
Port Country
Current traffic
(million TEUs)
Current capacity (million TEUs)
Utilisation rate (%)
Capacity addition
(million TEUs) 2013-18
Singapore Singapore 29.9 29.9 100 55
Klang Malaysia 9.5 8.0 119 10
Tanjung Pelepas Malaysia 7.5 8.4 89 10
Tanjung Priok Indonesia 5.7 5.9 97 18
Laem Chabang Thailand 5.7 10.5 54 11
Note: *Includes projects which are ongoing and some are in the pre-construction phase.Source: De (2012).

39
Figure 7: Capacity Required at Indian Ports, 2016-17
Source: Working Group Report on Ports and Shipping, NTDPC (2012).
6.5 Another striking development is the rise of container traffic in Vietnam. The recent economic progress of Vietnam is clearly matched by its rise in container cargo volume. From less than a million TEU in the middle of last decade, ports in Vietnam today handle more containerised cargo than that of India, Indonesia and the Philippines. Growing shipping market in ASEAN has attracted most of the prominent shipping lines of the world. Owing to large trade volume, most of the ASEAN container ports are now well connected with Chinese ports through many direct calls. In contrast, Indian ports have limited number of direct calls with ASEAN ports, except Singapore, Klang and Laem Chabang. In non-containerised segment, India’s bulk cargo handling ports, both POL (petroleum, oil and lubricants) and bulk solid are connected with major seaports in East and Southeast Asia. Therefore, India’s shipping links with non-traditional and emerging ASEAN ports have to be strengthened.
6.6 India’s containerised trade with ASEAN countries has been growing, but at a slow pace. In 2011-12, India’s containerised trade, both export and import, with most of the ASEAN countries decelerated mainly due to slow recovery of economies
218.5
65.6
116.5
22.6
167.5
137.7
728.4
246.6
58.7
146.8
20.5
47
67.5
587
465.1
124.3
263.3
43.1
214.5
205.2
1315.4
POL
Iron ore
Coal
Fer�liser & FRM
Containers
Other cargo
Total
Mill
ion
Tonn
es
Total Non-major Port Major Port
ASEAN-India Maritime Links

40 ASEAN-India Maritime Connectivity Report
in the aftermath of the global financial crisis. The sharpest fall was witnessed in case of India’s two-way containerised trade with Indonesia during 2009-10 and 2011-12 (Table 19(a)). India’s trade with China in value terms has exceeded US$ 60 billion 2012-13, and the same trend has been continuing in containerised trade. Today, India’s bilateral containerised trade volume with China is estimated to be over 4 million TEUs, thereby indicating service of about 15 container vessels every week between the two countries (Table 19 (b)). This high volume ocean cargo between India and China passes through the Malacca Strait. Besides, cargo produced in India and destined for different locations in Southeast Asia typically moves through the transhipment hub located in Singapore, Tanjung Pelepas and Port Klang. Naturally, the dependency on the Strait of Malacca is high. This sea channel is very important for the world’s shipping movement as it connects the growing regions of South Asia and Africa to the economies on the east. Therefore, maritime security is as critical as performance of ports to the growth of merchandise trade between India and Southeast and East Asia, and remains a key agenda of the ASEAN-India maritime cooperation.28
Table 19(a): India’s Containerised Trade with ASEAN*
Country2009-10 2010-11 2011-12
(million TEUs)Indonesia 0.97 0.58 0.26Malaysia# 0.50 0.51 0.47Philippines 0.07 0.06 0.03Singapore# 0.25 0.33 0.35Thailand 0.40 0.48 0.41Vietnam 0.29 0.31 0.26China 2.47 3.46 4.14Japan 0.35 0.76 0.72Korea 0.33 0.46 0.32Total above 5.64 6.93 6.96
Notes: *Estimated. #excluding transhipment cargo.Source: RIS based on Ministry of Shipping, Government of India.

41
Table 19(b): Container Vessels Operating between India and ASEAN*
CountryVessels per Week
2009-10 2010-11 2011-12Indonesia 4 2 1Malaysia# 2 2 2Philippines 0 0 0Singapore# 1 1 1Thailand 1 2 2Vietnam 1 1 1China 9 13 15Japan 1 3 3Korea 1 2 1Total 21 26 26
Notes: *Estimated. #excluding transhipment cargo.Source: RIS based on the Ministry of Shipping, Government of India.
6.7 The need for stronger maritime connectivity goes up when we consider trade in parts and components among India, ASEAN and China. India’s exports and imports of parts and components have witnessed moderate rise in the last decade. Presently, India’s imports of parts and components share over half of total bilateral imports from countries like Japan, Philippines and Vietnam, and have been also growing faster than the total bilateral imports. In particular, India’s imports of parts and components from Southeast Asian countries have gone up substantially. Volume-wise export of parts and components also resonates this. Notwithstanding above, the trend shows emerging production networks, sharing or fragmentation. Illustrated in Figure 8, India’s imports of parts and components from China have seen a massive growth, compared to 2000, whereas an opposite trend has been witnessed in case of India’s trade with Singapore. This normal trend has been witnessed, barring India’s export to Malaysia and India’s import from Thailand. It also calls for an appropriate transportation planning and connectivity to deal with the trade in high value products. In case of India’s trade in parts and components with Singapore, air transportation would be more effective than overland. Therefore, for moving
ASEAN-India Maritime Links

42 ASEAN-India Maritime Connectivity Report
trade through land and sea, the multimodal transportation would be economically advantageous.
Figure 8: India’s Parts and Components Trade with ASEAN Countries and China
Source: De (2014).
6.8 Presently, the liner shipping between major ports of India and ASEAN follows ‘hub and spoke’ model (Exhibit 1). Singapore and Port Klang are the two hub ports in ASEAN. Besides direct calls, these two ports also have feeder services with ports in India and South Asia. Map 1 presents current maritime networks between ports of ASEAN and India. Presently, private liner service (Maersk) takes about 19 days from Chennai port to Shanghai port (Exhibit 2). Most of the foreign lines connect Indian ports with Singapore or Port Klang through direct call, whereas the further voyage inland is being done through feeder services, which often take relatively higher number of days. Shipping Corporation of India (SCI) has weekly direct service from India’s west coast to central China, Korea, Hong Kong, Singapore and Malaysia, operated with five vessels of 2700-2900 TEUs, on a round voyage schedule of 35 days

43
(Box 1). Table 20 shows the number of container shipping carriers currently serving Indian ports and ASEAN countries.
Exhibit 1: Liner Shipping Network between ASEAN and India
Chennai
Singapore
Kolkata/ Haldia
Mumbai
*APL routes
Port Klang
Mundra
CochinJawaharlal
Nehru
Source: De (2012).
Map 1: Maritime Routes (Container) between India and ASEAN
ASEAN-India Maritime Links
KandlaMundra
Mumbai
JawaharlalNehru
CochinTuticorin
Colombo
Chennai
Ennore
Vizag
Paradip
Haldia
Kolkata Chittagong
Sittwe
Yangon
Laem Chabang
Sihanoukville
Hong Kong
Bintulu
Balikapapan
Banjarmasin
TanjungPriok
TanjungPerak
Manila
Ports with high container volume
Ports with low container volume
Source: ASEAN India Centre
Not in scale and not a political map.
Pipavav
Singapore
Port KlangPenang
Ho Chi Minh
Tanjung Pelepas
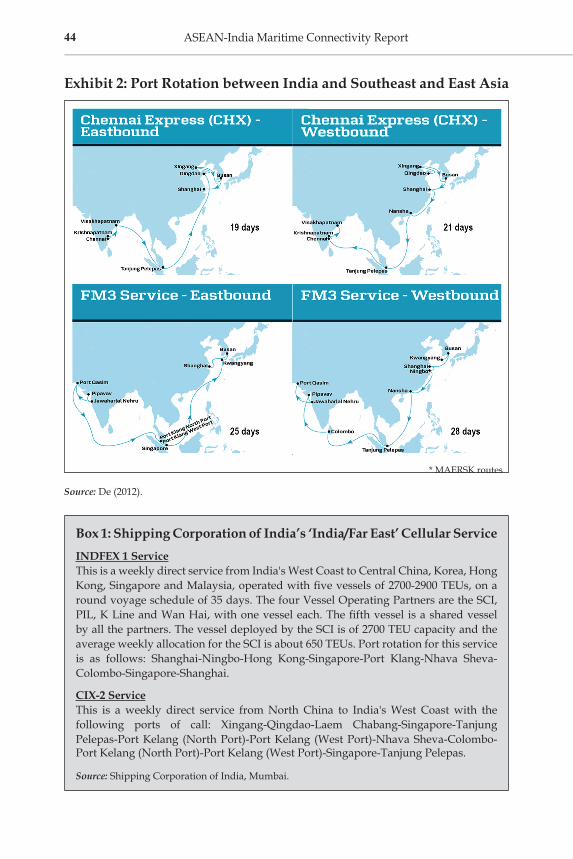
44 ASEAN-India Maritime Connectivity Report
Exhibit 2: Port Rotation between India and Southeast and East Asia
Source: De (2012).
Box 1: Shipping Corporation of India’s ‘India/Far East’ Cellular Service INDFEX 1 ServiceThis is a weekly direct service from India's West Coast to Central China, Korea, Hong Kong, Singapore and Malaysia, operated with five vessels of 2700-2900 TEUs, on a round voyage schedule of 35 days. The four Vessel Operating Partners are the SCI, PIL, K Line and Wan Hai, with one vessel each. The fifth vessel is a shared vessel by all the partners. The vessel deployed by the SCI is of 2700 TEU capacity and the average weekly allocation for the SCI is about 650 TEUs. Port rotation for this service is as follows: Shanghai-Ningbo-Hong Kong-Singapore-Port Klang-Nhava Sheva-Colombo-Singapore-Shanghai.
CIX-2 ServiceThis is a weekly direct service from North China to India's West Coast with the following ports of call: Xingang-Qingdao-Laem Chabang-Singapore-Tanjung Pelepas-Port Kelang (North Port)-Port Kelang (West Port)-Nhava Sheva-Colombo-Port Kelang (North Port)-Port Kelang (West Port)-Singapore-Tanjung Pelepas.
Source: Shipping Corporation of India, Mumbai.
* MAERSK routes

45
Table 20: Container Liner Service between India and ASEAN+3*
ASEAN+3/ Indian Ports
Che
nnai
Coc
hin
Hal
dia
Nha
va S
heva
Kol
kata
Mum
bai
Mun
dra
Pipa
vav
Vis
akha
patn
am
Tutic
orin
BruneiDarussalam 1 0 0 2 1 1 1 0 1 0
Cambodia 2 0 1 2 1 1 1 1 1 0China 8 4 4 21 5 1 15 11 4 4Indonesia 8 3 4 14 5 1 13 7 4 3Japan 8 4 4 19 5 1 12 10 4 4Korea 8 4 4 17 5 1 12 10 4 4Malaysia 7 4 4 15 5 1 12 9 3 4Myanmar 2 0 1 2 1 1 1 1 1 0Philippines 5 2 3 9 4 1 7 6 2 1Singapore 8 4 4 21 5 1 14 11 4 4Thailand 6 2 3 15 4 1 15 8 4 3Vietnam 7 3 4 14 5 1 15 8 4 3
Note: *As of March 2014.Source: Based on http://www.worldportsource.com/
6.9 Well connected ports along with efficiency of shipping services are the major catalysts to greater maritime connectivity between ASEAN and India. Today, only a few ports of India and ASEAN are directly connected by shipping lines. A large number of ports in India and ASEAN are yet to be connected. Transportation costs and time go up substantially, when we ship our cargo through feeder routes to reach ports in Cambodia, Indonesia, Malaysia, Myanmar, Thailand and Vietnam, with which India’s trade has been growing fast. We have to build an alternate shipping route as the existing route through Malacca Strait is heavily congested and relatively unsafe. Economic corridor-based multi-modal connectivity such as Mekong-India Economic Corridor may be promoted, which is designed to connect Indian coast with unexplored Southeast Asian coast and beyond, at a shorter time and lesser cost.
ASEAN-India Maritime Links

46 India-ASEAN Maritime Connectivity
6.10 Over the years, there has been a sharp decline in the share of Indian ships in the carriage of India’s overseas trade. Given the relatively low participation of Indian ships in India’s trade with Southeast and East Asia and given the fact that Indian ships are ageing, there is an urgent need to increase the shipping fleet so that it is at least large enough to meet India’s trade volumes with ASEAN and beyond. Strengthening Indian fleet with cheaper, adequate and easier access to finance is also very important. Some ASEAN and EAS countries such as Singapore have resources to meet India’s ocean shipping requirement. Deeper maritime cooperation with ASEAN could be an alternate feasible source for India to strengthen shipping assets.
6.11 Potential sites for mega ports should be based on detailed technical analysis. However, limited commercial analysis by the National Transport Development Policy Committee (NTDPC)suggests some possible locations (Gujarat being the main area) based on expected port traffic of POL and coal in next two decades. According to NTDPC Report, a possible location is on southern end of the Maharashtra coast, which could be used to serve Goa and Karnataka. Orissa, Andhra Pradesh and Tamil Nadu are potential states for the mega ports on the east coast.
6.12 A key reason to develop a mega port on the east coast is to link the growing markets of ASEAN, India and East Asia. ASEAN is one of the most important regions in the world trade, but its economic relationship with India is still limited. Main obstacle is high transport costs across the borders, which can be attributed to inadequate infrastructure for physical connectivity. Greater connectivity can help both sides to unlock the economic potentials and provide more economic opportunities for less developed areas like North East India. Earlier, ASEAN-India trade was primarily conducted through sea routes, while land transport connected large urban centres. Currently, an integrated transport system at the regional level is essential to boost connectivity. Comprehensive Asia Development Plan (CADP) recommends a strategy to improve a multi-modal, multi-function and multi-

47
tier approach for ASEAN-India connectivity. Following two main routes were proposed to improve ASEAN-India physical connectivity:
• Sea route along the Mekong-India Economic Corridor (MIEC); central to the project is development of Dawei port in Myanmar
• Land route along the Trilateral Highway (TH)/Asian Highway (AH1) connecting Thailand, Myanmar and India
6.13 A strategic mega port on the Indian east coast along MIEC should aim to benefit from emerging free trade areas. Some of the existing ports in the east coast having deeper drafts (suitable for mega port development) are Gangavaram (Andhra Pradesh), Paradip (Orissa), and Ennore (Tamil Nadu). Site selection for locating mega ports requires data on all types of port traffic (containers and other cargo) and cost of candidate ports development. Further, detailed modelling is required to examine costs and benefits of various alternates from the potential sites.
Map 2: Proposed Shipping Routes (Container) between ASEAN and India’s East Coast
ASEAN-India Maritime Links
Kyaukphyu
Dawei
Laem Chabang
KandlaMundra
Mumbai
JawaharlalNehru
CochinTuticorin
Colombo
Chennai
Ennore
Vizag
Paradip
Haldia
Kolkata Chittagong
Sittwe
Yangon
Sihanoukville
Hong Kong
Bintulu
Balikapapan
Banjarmasin
TanjungPriok
TanjungPerak
Manila
Source: ASEAN India Centre
Not in scale and not a political map.
Pipavav
Port KlangPenang
Ho Chi Minh
Tanjung Pelepas
Singapore

48 ASEAN-India Maritime Connectivity Report
6.14 Reliable connectivity through container lines is crucial for growth of trade in manufacturing goods. Apart from Thailand’s Laem Chabang port and ports of Malaysia and Singapore, there is no direct connection between India and the ASEAN. Commercial pressure and increase in vessel size over time poses a challenge to direct connection between India and the ASEAN.
6.15 The likely scenario of new shipping routes is very difficult to predict since liner shipping industry has been going under a huge transformation. However, between ASEAN and India, there will be several services in the Bay of Bengal and between the ports in India’s east coast and ASEAN’s west coast. Map 2 illustrates the proposed new shipping routes.
6.16 Finally, India’s merchandise trade with ASEAN has been carried out mainly through maritime routes, and challenges to the maritime connectivity have also increased manifold along with the rise in trade. Maritime transport cooperation is, therefore, one of the major areas for the promotion of relations between India and Southeast and East Asia. Understanding the emerging challenges that Indian ports and shipping services have been facing with ASEAN would help us not only in identifying the requisite policy actions, but also in building a strategy to enhance ASEAN-India maritime cooperation.

Challenges to Maritime Connectivity
7.1 One of the major barriers to the expansion of trade between India and ASEAN is the high cost of moving goods across the borders. Improved maritime connectivity would reduce trade costs, raise competitiveness and trade flows, expand markets, reduce poverty, and increase country’s welfare. The challenges to ASEAN-India maritime connectivity include, to mention a few, shortage of port capacity, very few direct calls, high port handling charges, lack of skilled human resources, and absence of an institutional mechanism. In particular, the port facilities in some countries are well equipped with technical and electronic equipment, whereas, in many countries of the region, ports still belong to the ancient period and are far away from automation and modernisation.29 Therefore, to create a functional single market, it is necessary to overcome the missing links in transportation, the lack of interoperability, and infrastructure gaps reducing the efficiency and weakening the global competitiveness of ASEAN and India.
7.2 There is a wide variation in shipping network within ASEAN and also between ASEAN and India. UNCTAD’s Liner Shipping
7

50 ASEAN-India Maritime Connectivity Report
Connectivity Index (LSCI)captures how well countries are connected to the global shipping networks (Table 21).30 China is well connected with the world, compared to other countries in the region; Singapore and Korea come next. However, six ASEAN countries, namely, Myanmar, Indonesia, Cambodia, Brunei, Philippines and Thailand, have a wide gap with Singapore and Malaysia. Philippines is the only country in ASEAN, which has witnessed a fall in liner shipping network in 2013, compared to previous years. India has been hovering in the middle portion in LSCI, but is much better off than seven ASEAN countries. It is a big challenge for ASEAN to narrow intra-ASEAN gap in liner shipping connectivity.
Table 21: Trends in Liner Shipping Connectivity Index
Year 2013 2008 2004
Brunei 4.61 3.68 3.91
Cambodia 5.34 3.47 3.89
Indonesia 27.41 24.85 25.88
Malaysia 98.18 77.6 62.83
Myanmar 6.00 3.63 3.12
Philippines 18.11 30.26 15.45
Singapore 106.91 94.47 81.87
Thailand 38.32 36.48 31.01
Vietnam 43.26 18.73 12.86
China 157.51 137.38 100
India 44.35 42.18 34.14
Japan 65.68 66.63 69.15
Korea 100.42 76.4 68.68
Source: UNCTAD statistics, available at http://unctadstat.unctad.org/
7.3 Transportation services are important components of trade in services. This has significant influence on competitiveness of a country’s export trade, price levels of imported goods and, therefore, on the economic welfare of the country. The fruitful integration of a county in the process of globalisation requires a competitive transportation services sector. In case

51
of India, sea transportation is the main vehicle through which international trade is conducted. However, there seems to be oligopolistic trends in port services privatisation and this affects the capacity utilisation and costs of port services. Further, an integrated policy involving manufacturing and port facilities is still lacking, which prevents exploitation of scale economies in these services.
7.4 India is a net importer of transportation services. Disaggregating freight transportation services tells us about India’s huge import of other sea transport services (US$ 35.75 billion in 2012 in Table 22), thereby contributing to the transportation services deficit.31 In a growing economy like India, international merchandise trade heavily relies on foreign vessels for transportation across the world, thus generating a payment of almost 59 per cent of import of transportation services in 2012. India has been earning from sea freight transportation at an increasing pace. For example, India’s export in the sea freight transportation was about US$ 7.22 billion in 2012, up from US$ 1.53 billion in 2001. In a static sense, the voluminous deficit in the sea freight transportation services weakens India’s maritime position.
Table 22: Trends in Sea Transportation Services Trade in India
Year
2000 2005 2012
Value (US$
million)
Share(%)
Value (US$
million)
Share(%)
Value (US$
million)
Share(%)
Sea Transport Freight
Export 1534.01 77.53 4244.64 73.77 7218.39 41.23
Import 6285.20 72.22 13759.80 66.54 6878.29 11.37
Other Sea Transport
Export 158.88 8.03 995.50 17.30 2726.02 15.57
Import 1202.66 13.82 2252.73 10.89 35754.60 59.13
TransportationExport 1978.71 5754.08 17506.70 100.00
Import 8703.16 20677.60 60471.30 100.00
Source: Based on IMF’s Balance of Payments Statistics (BOPS) (2014).
Challenges to Maritime Connectivity

52 ASEAN-India Maritime Connectivity Report
7.5 The terminal handling charges of some ASEAN container ports appeared to be higher than that of Indian ports (Table 23). Port of Singapore takes an average US$ 200 per TEU to handle an export container and US$ 250 per TEU for an import container. While efficiency of Singapore port is unparallel in the region, higher handling charges often negate the benefits of geographical links and trade liberalisation initiatives.
Table 23: Terminal Handling Charges of Selected Container Ports of ASEAN and India, 2012
PortExport Import
TEU FEU TEU FEU
Singapore-COC 141.96 210.60 141.96 210.60
Singapore-SOC- TP 89.70 136.50 89.70 136.50
Singapore-SOC-TP-OOG 273.00 409.50 273.00 409.50
Singapore-SOC-Local- LADEN 117.00 167.70 117.00 167.70
Singapore-SOC-Local- MTY 62.40 92.04 62.40 92.04
Singapore-SOC-Local- OOG 339.30 507.00 339.30 507.00
Singapore-SOC-Local- DG 179.40 257.40 179.40 257.40
Port Klang 100.50 150.00 100.50 150.00
Penang 100.50 150.00 100.50 150.00
Pasir Gudang 88.50 132.00 88.50 132.00
Thailand 78.00 117.00 78.00 117.00
Philippines 104.00 138.00 104.00 138.00
Philippines 155.00 155.00
Jakarta 95.00 145.00 95.00 145.00
Surabaya 95.00 145.00 95.00 145.00
Semarang 95.00 145.00 95.00 145.00
Vietnam 76.92 115.90 76.92 115.90
Jawaharlal Nehru 76.80 120.00 69.68 106.48
Chennai 67.60 101.27 67.60 101.27
Mundra 76.08 112.00 77.28 113.92
Tuticorin 50.08 70.64 50.08 70.64
Cochin 79.28 113.54 79.28 113.54
Notes: Above rates for Indian ports are excluding services taxes. TEU - Twenty Equivalent Unit. FEU - Forty Equivalent Unit.Source: Based on rates available from the Shipping Corporation of India.

53
7.6 Due to inadequate cargo availability and maintaining the time bound movement of cargo, major container shipping lines prefer not to call directly; rather they prefer to serve the ports located at the Bay of Bengal through their feeder alliances connected to the transhipment hubs. There is need to connect ports in Myanmar, Thailand and Vietnam with Indian ports with regular shipping services. We also have to attract more feeder operators to link Indian ports such as Paradip, Vizag, Kolkata and Haldia with ASEAN countries.
7.7 The age structure of Indian vessels shows the over-aged profile of the Indian fleet. More than 40 per cent of the fleet is above 20 years of age, and about 21 per cent in the age group of below 5 years (Table 24). In contrast, age profile of the world fleet (as per the Review of Maritime Transport 2010) reflects that more than 50 per cent of the global tonnage was less than nine years of age. The age profile of world shipping fleet is younger than the age profile of Indian shipping fleet, hence leading to higher efficiency and productivity of the tonnage.
Table 24: Age Composition of Indian Shipping Fleet
Category 0-5 years 6-10 years 11-15 years 16-20 years Above 20 years Total
Coastal 131(18.1) 76(10.5) 100(13.9) 84(11.6) 331(45.8) 722
Overseas 93(26.6) 39(11.1) 33(9.5) 54(15.5) 130(37.3) 349
Note: Data in parentheses are respective share in total.Source: Report of the Working Group on Ports and Shipping for the National Transport Development Policy Committee, Ministry of Shipping (2012).
7.8 Composition of tonnage of merchant fleet for India shows overwhelming share of oil tankers (55 per cent), followed by bulk carriers (26 per cent), with container ships accounting for mere 3 per cent share in the total tonnage. In contrast, the tonnage composition of China reflects 44 per cent in bulk carriers, followed by 18 per cent in oil tankers and about 15 per cent in container ships. The composition of world tonnage shows 29 per cent share of bulk carriers, 28 per cent share in oil tankers and 17 per cent share in container ships (Table 25).
Challenges to Maritime Connectivity

54 India-ASEAN Maritime Connectivity
Table 25: Composition of Merchant Fleet, 2010(Thousand GT)
Country Bulk carrier Container General cargo Oil tankers Others Total
India 2377 (26.3)
254 (2.8) 322 (3.6) 4972
(55.1)1102 (12.2) 9027
China 13315 (44.3)
4393 (14.6)
4702 (15.6)
5446 (18.1)
2221(7.4) 30077
Hong Kong 22366 (49.3)
8745 (19.3)
2742 (6.0)
10315 (22.8)
1170 (2.6) 45338
Korea 7864 (61.0)
688(5.3)
1334 (10.3)
1374 (10.7)
1633 (12.7)
12893(100.0)
Malaysia 290 (3.8)
703 (9.1)
496 (6.4)
2938 (38.1)
3292 (42.6) 7719
Developingcountries
69345 (32.2)
28306 (13.1)
31834 (14.8)
59476 (27.6)
26459(12.3)
215420(100.0)
Developed 27590 (15.3)
39408 (21.8)
23701 (13.1)
50674 (28.0)
39406(21.8) 180779
Open Res. 154404 (32.9)
77515(16.5)
46209 (9.8)
137688 (29.3)
54000(11.5)
469816(100.0)
World 253191 (28.7)
145544 (16.5)
107591 (12.2)
250999 (28.4)
125310(14.2) 882635
Note: Number in parentheses is respective share in the total.Source: Review of Maritime Transport, UNCTAD (2010).
7.9 India is amongst the few nations, which has not experienced “flagging out” or migration to flags of convenience or open registries. In India, the share of foreign flags in its total fleet as on 2010 is around 17 per cent, compared to 92 per cent for Japan, 61 per cent for China, 58 per cent for Korea, 87 per cent for Taiwan and 29 per cent for Malaysia (UNCTAD 2010). The share of Indian registered ships in conveyance of India’s overseas merchandise trade has fallen to around 8 per cent.

Strengthening National Policy8.1 Apart from investments in capacity addition and efficiency
improvement, the Government of India shall envisage certain policy related improvements such as setting up a specialised maritime finance corporation to acquire overseas maritime assets, build bigger ports to accommodate over 15,000 TEUs container vessel, etc.
Allowing Short Sea Shipping in Limited Scale8.2 Allowing coastal shipping (Short Sea Shipping) in Bay of Bengal
would perhaps help ASEAN LDCs to increase their market access in India and vice versa. The coastal trade agreement signed by Bangladesh and Myanmar in 2012 may be converted into a regional agreement with participation of India and Thailand to start with. Institutional links between ports and the shipping community, regional (and bilateral) short sea shipping, and training and capacity building may pave the way for stronger maritime links within the region and beyond.
Removal of Customs Duty8.3 Removal of customs duty on marine fuel for vessels carrying
cargo for transhipment may attract bigger container ships to serve Indian coast. In conventional wisdom, the benefit to the
8Strengthening ASEAN-India Maritime Connectivity: List of Recommendations

56 ASEAN-India Maritime Connectivity Report
economy from such duty reduction would be manifold. India levies about 25 to 30 per cent customs duty on bunker, or marine fuel. Removing the duty would attract bigger container vessels to Indian coasts. At present, such mainline carriers often berth at Colombo or Singapore and use smaller feeder vessels to carry cargo from and to India. There will be revenue loss for such reduction in duty but it would facilitate investment in shipping industry, generate employment and reduce transaction time and cost. Ultimately, this would lead to transhipment trade in India without even changing the cabotage (coastal movement) rules that restrict the movement of foreign vessels on coastal routes. India’s containerised export to ASEAN and East Asia may benefit from such duty reduction.
Seafarer’s Taxation8.4 Indian sailors in foreign or Indian ships operating outside Indian
territorial waters for 182 days or more in a year are entitled for non-residence status and tax exemption. This does not apply to officers and seamen on coastal vessels. Similarly, Indian and foreign sailors in Indian territorial waters for 182 days or more are treated as Indian resident and subject to income tax. Sailors’ income is exempt from personal taxation in some countries of ASEAN (Malaysia, Philippines, Singapore and Thailand). Ship-owners have the right to withhold certain percentage of income tax and social security payment of sailors as an incentive to recruit European seafarers by offsetting part of the high wage payment in some European countries. Labour is a factor of production and seafarers income could face a lower fixed/flat tax regardless of their residential status (work inside or outside Indian territorial waters). Such a tax will reduce the attraction of foreign flag and help coastal shipping.
Incentives for Coastal Shipping8.5 Fiscal incentive may be provided to consignors who shift
cargo from road and rail for coastal shipping. Given the need for competition and growth in containerisation and current inadequacy of Indian coastal fleet, some relaxations in cabotage

57
policy might be needed till coastal shipping grows sufficiently. More desirable cabotage policy might be imposed after a certain growth in national tonnage and achievement of desired outcomes.
Increase Vessel Capacity 8.6 According to UNCTAD, there is a clear indication that global
container trade is becoming consolidated. Despite a 200 per cent increase in global container volume, number of services operated and number of service providers reduced by 20 per cent during 2004-13. Therefore, it is necessary to develop sufficient vessel capacity and ability to control freight within India.
8.7 For Break Bulk and Over Dimensional cargo, opportunities for long-term COA should be explored to assist member countries for increasing ship tonnage. For Dry Bulk and Liquid Bulk cargoes, governments should be made to support their own tonnage under mutually beneficial terms. Such agreements will be designed to assist shipping companies for the acquisition of tonnage with employment guarantee at minimal margins and commitment to trade. A small portion of the current trade volume could be identified for such an agreement. Coal and iron ore constitute significant portion of Dry Bulk trade. Coal is imported in large quantities from Indonesia. Iron ore is exported to China and Japan. There is opportunity for a large number of packets of these two commodities in India-ASEAN trade, if ASEAN+6 is able to work out arrangements on multiple routes and secure the supply chain.
8.8 Unlike container business, comparatively modest growth of large Dry Bulk world trade will help owners and charterers to achieve a win-win formula for long-term agreement of mutual benefit. ASEAN countries having more exports in commodity trade should proactively find all ways to use delivery services of Indian companies for over all trade balance. Large networks of feeder services in the ASEAN region offer the opportunity for growth in Indian tonnage. Specialised vessels for carrying project
Strengthening ASEAN-India Maritime Connectivity: List of Recommendations

58 ASEAN-India Maritime Connectivity Report
cargoes are not present in India. These ships are high revenues earner, but provide irregular employment opportunities. Associated high cost of capital has been recovered only in few trips.
Signing MRAs with ASEAN8.9 Countries may consider signing of Mutual Recognition
Agreement (MRA) in shipping and logistics services once the ASEAN-India Services Trade Agreement is sealed. Deeper cooperation can surely play an important role to sign the MRAs in shipping sector between India and ASEAN.
Joining ASEAN Ro-Ro and Cruise Network, and Promoting Tourism 8.10 As explicitly stated in the Master Plan on ASEAN Connectivity,
ASEAN puts an emphasis on stronger connectivity with neighbouring countries, including India and other EAS countries.32 Connecting the archipelagic regions of ASEAN requires efficient and reliable shipping routes in order to enhance intra-ASEAN connectivity. The results of the initial impact assessment of the Philippines Nautical Highway (also referred to as Roll-on/Roll-off (RoRo)) System demonstrate significant benefits in terms of reduction in transport costs, the creation of new regional links and expansion of regional markets, more efficient shipment of goods and people that have particularly benefited the poorer provinces in the maritime routes, acceleration of local area development, realignment of logistical practices with more frequent deliveries, and greater competitive pressure on the domestic shipping industry. ASEAN has been planning to develop cruise corridors. India may join ASEAN’s Ro-Ro sector and also cruise segment for bringing the two coasts closer to each other. This will also boost the tourism industry.
8.11 ASEAN and India may also decide the possibility of developing Ro-Ro terminal in CLMV coast along MIEC and also in Indian coast in joint venture.

59
Connecting to ASEAN Single Shipping Market8.12 ASEAN is contemplating single shipping market. ASEAN has
adopted policies to support privatisation/commercialisation of port operation, support simplification and harmonisation of port documentation and enhance the capacity of the 47 designated ports. India may explore joining the shipping market. India may finalise the strategy for joining the ASEAN single shipping market and develop the relevant framework for its implementation. Bringing ASEAN+3 and ASEAN+6 under one platform will enable use of larger container ships for connecting India and the ASEAN+5 countries with other direct services. However, proactive approach should be followed to incentivise direct sailing services. Alternatively, feeder network can be managed by promoting of India and the ASEAN flag vessels by all member countries.
Cooperation for Improving Efficiency of Ports 8.13 Proposed connectivity between ASEAN and India would throw
many challenges for its development. The link would open considerable avenues and opportunities for trade between the regions. Indian ports are heading for a better future with growing international trade. Thus, operational efficiency of the ports have to be competitive and on par with the best ports in the world. Modern cargo handling equipments must be introduced to improve port performance. Efforts must be made to enhance the quality of service and productivity. In this regard, greater economic and/or commercial cooperation is desired from the ASEAN countries that have technological expertise on ports and shipping (e.g. Singapore).
Establish an Integrated Multimodal Transport System 8.14 The long coast of Myanmar provides closest and most direct point
of maritime connection between India and Southeast Asia, across the Bay of Bengal. Consequently, developing infrastructure along the coast of Myanmar presents a major opportunity for
Strengthening ASEAN-India Maritime Connectivity: List of Recommendations

60 ASEAN-India Maritime Connectivity Report
connecting India to the rest of Southeast Asia through Myanmar. Acting as a crucial intermediary between these two hubs will also enable Myanmar’s port-cities to develop and prosper, thereby narrowing the regional development gaps.33 India is rebuilding port at Sittwe in Myanmar under the Kaladan Multi-modal Transit Transport project. India may also explore developing of the Dawei port and SEZ project in Myanmar in JV. As illustrated in Exhibit 3, the Mekong-India Economic Corridor (MIEC) involves integrating the four Mekong countries (Myanmar, Thailand, Cambodia and Vietnam) with India. It connects Ho Chi Minh City (Vietnam) with Dawei (Myanmar) via Bangkok (Thailand) and Phnom Penh (Cambodia) and further linking to Chennai in India. Due to the strategic location of the city on the Southeast coast of Myanmar, a deep sea port would have the potential to open up new shipping routes to India, the Middle East and Europe, as well as reduce shipping congestion in the Malacca Strait.
Exhibit 3: Map of MIEC
Source: ADB.
Building Chennai and Ennore as Gateway Ports8.15 Enhancing maritime connectivity between India and ASEAN
is a multifaceted task that requires implementing strong policy initiatives. Development of this connectivity would open

61
significant opportunities for industrial development in India and its trade potential with Southeast and East Asian countries. This connectivity would link the Chennai region to the rest of the world through its maritime infrastructure. Thus, Chennai and Ennore have great potential to become the gateway ports for India, providing centre of business activities with industrial clusters and working as engine to promote regional economic growth.
Promoting Myanmar as ‘Landfall’ Port8.16 The cooperation with Myanmar could be in two functional
areas – one being financial and the other being technical. Financial support in form of soft loan or infrastructural credit could be offered to Myanmar, Cambodia and Vietnam to build transportation infrastructure. The other form of cooperation is to make India’s presence in the region and build the port infrastructure. This may include capital dredging, berth creation, crane installation and other such infrastructural development.
Building a Stronger Ocean Shipping Network8.17 Being on the main east-west trade lane, Indian ports (especially
on the west coast) are directly connected with the countries in Southeast Asia through the transhipment hubs discussed above. However, direct ocean connectivity through mainline service hardly exists between India and its eastern neighbours. Due to inadequate cargo availability and maintaining the time bound movement of cargo, major container shipping lines prefer not to call directly. Instead, they prefer to serve the ports in Bay of Bengal through their feeder alliances connected to the transhipment hubs. Initiating mainline calls in the Bay of Bengal will go long way in instilling confidence in the shippers and traders in east coast of India, Bangladesh and Myanmar, besides acting as a stepping stone in the area of mutual cooperation in maritime transportation. State-owned shipping lines like the Shipping Corporation of India (SCI) shall make the first move in this regard.
Strengthening ASEAN-India Maritime Connectivity: List of Recommendations

62 ASEAN-India Maritime Connectivity Report
Allowing Indian Companies to Own and Register Vessels in ASEAN8.18 Indian companies may be allowed to own ASEAN vessels subject
to some conditions. This will increase the tonnage under Indian control. This will also ensure that the vessels are Indian-owned, employment and increase training slots for Indian seafarers. Vessels may serve the coasts of India and Southeast and East Asia.
Financial Incentive to Raise Fleet Capacity8.19 The Indian shipping industry has raised various taxation issues
which impact the competitiveness of Indian shipping. Despite the introduction of the tonnage tax in India in April 2004, the average tax rate paid as a percentage of profit is much higher in the case of Indian companies compared to companies operating in Singapore.34 Rationalisation of tax structure may likely to help Indian shipping companies to strengthen fleet capacity, thereby strengthening the maritime connectivity.
ASEAN-India Comprehensive Trade Facilitation Mechanism 8.20 Simple, transparent, harmonised and standardised trade and
customs, processes, procedures and related information flows are expected to reduce transaction costs between ASEAN and India, which will enhance trade competitiveness and facilitate the regional integration. India and other dialogue partners of ASEAN also need to align customs and trade services with that of ASEAN (e.g. Customs Single Window).
Stronger Coordination 8.21 Regional connectivity has made progresses within different
regional frameworks in recent past and ASEAN’s dialogue partners are getting increasingly involved and contributed in their efforts in support of Master Plan of ASEAN Connectivity (MPAC). MPAC projects require US$ 600 billion worth of financing.35 ASEAN Infrastructure Fund (AIF) is a potential source of financing and set to start commercial lending. At this

63
stage, five infrastructure projects, valued at US$ 150 million, have been approved. Additional resources are, therefore, required to support the connectivity projects, and the ASEAN acknowledges the important role of dialogue partners in achieving greater connectivity in ASEAN. ASEAN Secretariat and ASEAN Connectivity Coordinating Committee (ACCC) hope to achieve concrete outcomes from its engagement with a number of dialogue partners including India. Dialogue partners of ASEAN were requested by ACCC to share their experiences with connectivity projects and also to present their plans and proposals on involvements and contributions in support of MPAC. A stronger coordination between ASEAN Secretariat and Indian Ministry of External Affairs would be helpful in building connectivity.
Financing New Projects8.22 The region needs to develop mechanisms for the financial
intermediation between its large savings and its equally large investment needs. The region should encourage the use of PPPs for investment in maritime infrastructure and creation of a large regional infrastructure development fund to channel its foreign exchange reserves into much needed infrastructure investments. There are alternate sources, which can also be utilised to fund development of new projects.
Increase Development Assistance to CLMV in Maritime Connectivity8.23 The cooperation in development of landside infrastructure is
a crucial part of any ocean transportation linkage. Developing port infrastructure in Myanmar is a ‘win-win’ situation for all ASEAN countries and India since Myanmar has all the potential to provide an alternate gateway to the South China Sea.
Cooperation Between Private Sector Organisations8.24 We should facilitate cooperation between private industry
assocaitions. For example, Indian National Shipowners’
Strengthening ASEAN-India Maritime Connectivity: List of Recommendations

64 ASEAN-India Maritime Connectivity Report
Association (INSA) and Federation of ASEAN Shipowners’ Association (FASA) may consider signing MoU for promoting shipping activities between India and ASEAN. Similarly, Indian Ports Association (IPA) may sign MoU with ASEAN Ports Association (APA) to facilitate cooperation and development of ports between India and ASEAN. These MoUs would enhance collaborative projects within the region.
Signing ASEAN-India Maritime Transport Agreement
8.25 Finally, India may explore signing ASEAN-India Maritime Transport Agreement with ASEAN subject to ASEAN becoming a single port community and single shipping market.36 This agreement will help both India and ASEAN to further cooperate and communicate with each other, eliminate barriers hindering maritime transport, and establish regional maritime transport framework system with the aim to promote maritime transport facilitation between ASEAN and India.

Endnotes1 For a detailed account of ASEAN-India maritime links, please visit https://www.
aseanindia.com 2 Refer, ASEAN-India Eminent Persons’ Report to the Leaders, 2012, co-chaired by
Amb. Shyam Saran and Dr. Kao Kim Hourn.3 Refer, for example, ASEAN–India Eminent Persons Group Report 2012, available at
http://www.aseanindia.com4 Refer, Kumagai and Isono (2012), who used the IDE/ERIA Geographical Simulation
Model to estimate impacts on the cumulative increase of GDP of countries in the two subregions from 2010 to 2030 relative to the base case for a number of connectivity projects, including the Mekong-India Economic Corridor (MIEC), the Kyaukphyu deep seaport in Myanmar, and the India-Myanmar-Thailand Trilateral Highway (IMTTH).
5 Using a slightly different regional unit of analysis (ASEAN+3 and South Asia) estimates large gains (about US$ 260 billion, or 2 per cent GDP) from an East and South Asian free trade area, under conservative assumptions. Refer, for example, François, Rana, and Wignaraja (2009).
6 Refer, Asian Development Bank (ADB)-Asian Development Bank Institute (ADBI) (2009).
7 The Agreement has provided flexibilities to India and ASEAN countries to exclude some of the products from the tariff concessions or eliminations to address their respective domestic sensitivity. India on its part has excluded 489 items from the list of tariff concessions and 590 items from the list of tariff elimination to address sensitivities in agriculture, textiles, auto, chemicals, crude and refined palm oil, coffee, tea, pepper etc. ASEAN countries have also maintained similar exclusion list from the proposed tariff concessions or eliminations.
8 Refer, Vision Statement, ASEAN-India Commemorative Summit 2012, available at http://www.aseanindia.com
9 In the recent past, bilateral trade between ASEAN and India has grown at over 20 per cent annually. At this rate of growth (business as usual scenario), achieving US$ 200 billion trade by 2020 may not be beyond our reach, ceteris paribus. Refer, for example, RIS (2013).
10 Estimated based on an augmented gravity model. Refer, De (2013)11 The RCEP is a Free Trade Agreement between ASEAN nations and ASEAN’s FTA
partners. The agreement is between 16 countries, which make up 45 per cent of world population and contribute 1/3rd of world’s total GDP.
12 Refer, for example, RIS (2013).13 Tariff equivalent of transaction cost across ASEAN countries are as high as 438 per
cent in Myanmar (See Appendix 1). 14 Appendix 2 illustrates major and intermediate ports of India15 Based on Update on Indian Port Sector (30 September 2013), Ministry of Shipping,
New Delhi.16 For a detailed discussion on causality between port performance and port traffic, refer
De (2009).17 About 95 per cent of India’s trade by volume and 68 per cent in terms of value is
transported by sea.

66 ASEAN-India Maritime Connectivity Report
18 As on 31 January 2013, India had a fleet strength of 1158 ships with GT of 10.45 million, with the public-sector Shipping Corporation of India having the largest share of 32.60 per cent. Of this, 356 ships with 9.37 million GT cater to India’s overseas trade and the rest to coastal trade (Indian National Shipowners’ Association (INSA), Mumbai).
19 Refer, for example, INSA (2014).20 Refer, Economic Survey 2012-13, Government of India.21 Refer, Behera (2013).22 Forecast done by RIS based on standard log-linear OLS. 23 According to Government of India (2013), up to January 2013, 22 projects have been
awarded. These 22 projects involve a capacity addition of 97.34 Metric Tonne Per Annum (MTPA) and investment of Rs. 57.56 billion.
24 Refer, Maritime Agenda 2010-20, Ministry of Shipping, Government of India, New Delhi.
25 Appendix 4 presents major ports of ASEAN.26 Refer, for example, De (2012).27 For example, development of standalone container handling facility with a quay
length of 330m North of NSICT and 4th container terminal. Refer, Government of India (2013).
28 Incidence of piracy has been of great concern to the government. The Government has deployed naval vessels for assistance to merchant vessels in the piracy-affected areas, particularly off Somalia coast.
29 Refer, for example, RIS (2012).30 It is computed by the United Nations Conference on Trade and Development
(UNCTAD) based on five components of the maritime transport sector: number of ships, their container-carrying capacity, maximum vessel size, number of services, and number of companies that deploy container ships in a country’s ports. For each component a country’s value is divided by the maximum value of each component in 2004, the five components are averaged for each country, and the average is divided by the maximum average for 2004 and multiplied by 100. The index generates a value of 100 for the country with the highest average index in 2004. For further details, please refer UNCTAD (2013).
31 Services that are auxiliary to transport and not directly provided for the movement of goods and persons. These services includes charges of loading and unloading containers, storage and warehousing, packing and repacking, cleaning performed in ports, salvage operations and agents’ fees associated with passenger and freight transport (e.g., freight forwarding and brokerage services). For further details, please refer, IMF BOPS Manual.
32 Refer, for example, ASEAN Secretariat (2012), Kimura and Umezaki (2012), etc.33 Refer, for example, Bridel (2012). 34 According to INSA (2014)35 Refer, for example, speech of Mr. Adnan Jaafar, Dy. Permanent Secretary, Ministry
of Foreign Affairs and Trade of Brunei Darussalam at the workshop on “Enhancing Connectivity through Multi-layered Regional Framework”, held at Bangkok on 19 July 2013. Refer, RIS (2013).
36 China had already signed maritime transport cooperation agreement with ASEAN in 2007.

ReferencesADB–ADBI. 2009. Infrastructure for Seamless Asia. Asian Development Bank and
Asian Development Bank Institute (ADBI), Manila and Tokyo.
ASEAN Secretariat. 2012. ASEAN-India Eminent Persons’ Report to the Leaders. ASEAN Secretariat, Jakarta
Behera, Subrata. 2013. “India’s Development Cooperation in South East Asia: A Case of Ocean Transportation”. Drewry Shipping Consultants (India), Gurgaon
Bridel, Anna. 2012. “ASEAN-India Connectivity: Maritime Connectivity and Perspective”, Centre for Public Policy Studies (CPPS), Kuala Lumpur.
De, Prabir. 2009. Globalisation and the Changing Face of Port Infrastructure: The India Perspective. Bern: Peter Lang AG.
De, Prabir. 2012. “Cargo and Container Movement between ASEAN and India”. Presentation Made at the Seminar on ‘Development of an Integrated Transport and Logistics System in ASEAN Countries and Pacific Subregion’. Organised by UNESCAP. Held at Bangkok on 21-23 November 2012.
De, Prabir. 2014. “South Asia-Southeast Asia Connectivity: India Country Study”. Asian Development Bank Institute (ADBI), Tokyo
Francois, J., P.B. Rana, and G. Wignaraja (eds.). 2009. Pan-Asian Integration: Linking East and South Asia. Basingstoke: Palgrave Macmillan.
Government of India. 2012. Report of the Working Group in Ports and Shipping. National Transport Development Policy Committee (NTDPC), New Delhi.
Government of India. 2013. Annual Report 2013-14. Ministry of Shipping, New Delhi.
IMF. 2014. Balance of Payment Statistics CD-ROM. International Monetary Fund (IMF), Washington, D.C.
INSA. 2014. “Indian Shipping Industry”. Background Paper prepared for ASEAN- India Maritime Connectivity Report, Indian National Shipowners’ Association (INSA), Mumbai.
Kimura, F. and S. Umezaki (eds.). 2012. ASEAN-India Connectivity: The Comprehensive Asia Development Plan (CADP) Phase II. Economic Research Institute for ASEAN and East Asia (ERIA), Jakarta.
Kumagai, S. and I. Isono. 2012. “Economic Impacts of Enhanced ASEAN-India Connectivity: Simulation Results from IDE/ERIAGSM” in F. Kimura and S. Umezaki (eds.), ASEAN-India Connectivity: The Comprehensive Asia Development Plan, Phase II, ERIA Research Project Report 2010-7. Economic Research Institute for ASEAN and East Asia (ERIA), Jakarta.
Petri, Peter A. and Michael Plummer. 2012. “The Trans-Pacific Partnership and Asia-Pacific Integration: Policy Implications”. Policy Briefs PB12-16, Peterson Institute for International Economics (PIIE), Washington, D.C.
Petri, Peter A. and Michael Plummer. 2013. “ASEAN Centrality and the ASEAN-US Economic Relationship”. Advance Copy of the Policy Studies 69, East West Centre, Honolulu.
68 ASEAN-India Maritime Connectivity Report
RIS. 2012. ASEAN-India Connectivity Report: India Country Study. Research and Information System for Developing Countries (RIS), New Delhi.
RIS. 2013. “Background Paper”, 2nd Round Table of ASEAN-India Network of Think-Tanks (AINTT). Held in Vientiane on 10 September 2013.
UNCTAD. 2010. Review of Maritime Transport. United Nations Conference on Trade and Development (UNCTAD), Geneva.
UNCTAD. 2012. Review of Maritime Transport. United Nations Conference on Trade and Development (UNCTAD), Geneva.
UNCTAD. 2013. Liner Connectivity Index. United Nations Conference on Trade and Development (UNCTAD), Geneva.
World Economic Forum (WEF). 2012. The Global Enabling Trade Report, World Economic Forum, Geneva.

Appendices
Appendix 1: Tariff Equivalents of PCBs (%)*
Country Food Textile Machinery Automobile Others
Indonesia 162.9 42.2 105.0 326.0 189.4
Malaysia 108.6 18.6 69.4 202.0 108.5
Philippines 127.9 27.1 82.2 244.5 136.3
Thailand 144.6 34.4 93.2 282.6 161.2
Bangladesh 184.7 51.3 118.9 379.5 223.9
Brunei 132.3 29.1 85.1 254.4 142.8
Cambodia 188.6 52.9 121.4 389.5 230.4
China 152.2 37.6 98.1 300.5 172.8
Hong Kong 123.4 25.2 79.3 234.3 129.7
India 204.5 59.5 131.4 430.1 256.5
Japan 91.7 11.0 58.0 166.2 84.8
Korea 97.6 13.7 62.0 178.6 93.0
Laos 185.9 51.8 119.7 382.6 225.9
Myanmar 207.9 60.9 133.5 438.9 262.1
Singapore 34.2 0.0 17.8 56.7 11.5
Vietnam 148.5 36.0 95.7 291.7 167.1
Note: *Quantifying Policy and Cultural Barriers (PCBs): Estimate of transport cost includes cost for transportation time, cost for transhipment time (holding time), physical transport cost, and physical transhipment cost. These costs are collectively called GSM transport cost. However, some important components of the broadly defined transport costs remain excluded from nth estimate. This comprises tariffs, non-tariff trade barriers (e.g. quota restriction), procedures before shipping, costs arising from political situations or some certain risks, cost arising from preference differences and cost arising from commercial custom differences. Those costs are called PCBs. Tariff equivalents of PCBs for ASEAN and India are provided as in Table. Source: Adapted from Kumagai and Isono (2012).

70 ASEAN-India Maritime Connectivity Report
Appendix 2: Major and Intermediate Ports of India
Source: Chennai Port Trust.

71
Appendix 3: Trends in Total Cargo Handled
YearInternational
(Overseas) Domestic (Coastal) Total
Import Export Total Import Export Total Import Export Total
(Million Tonnes)
Major Ports
2000-01 127.2 66.2 193.4 51.55 36.18 87.73 178.75 102.38 281.13
2005-06 199.48 133.64 333.12 44.22 46.23 90.45 243.7 179.87 423.57
2011-12 306.76 147.56 454.56 55.98 49.89 105.53 362.74 197.45 560.19
CAGR (%)2000-01/2011-12
8.33 7.56 8.08 0.75 2.96 1.69 6.65 6.15 6.47
Non-Major Ports
2000-01 43.73 17.59 61.32 10.86 15.19 26.05 54.59 32.78 87.37
2005-06 69.58 48.69 118.27 16.47 15.38 31.85 86.05 64.07 150.12
2011-12 210.17 90.38 300.55 28.68 24.51 53.19 238.85 114.89 353.75
CAGR (%)2000-01/2011-12
15.34 16.04 15.55 9.23 4.45 6.70 14.36 12.08 13.56
All Ports
2000-01 170.93 83.79 254.72 62.41 51.37 113.78 233.34 135.16 368.5
2005-06 269.06 182.33 451.39 60.69 61.61 122.3 297.43 223.29 573.69
2011-12 516.93 237.94 755.11 84.66 74.4 158.72 601.59 312.34 913.93
CAGR (%)2000-01/2011-12
10.58 9.95 10.38 2.81 3.42 3.07 8.99 7.91 8.61
Source: RIS based on Basic Port Statistics of India 2011-12, Ministry of Shipping, New Delhi.
Appendices

72 ASEAN-India Maritime Connectivity Report
Appendix 4: Major Ports of ASEAN
Source: Drawn in Google Maps with help of ASEAN port data from ASEAN Secretariat.
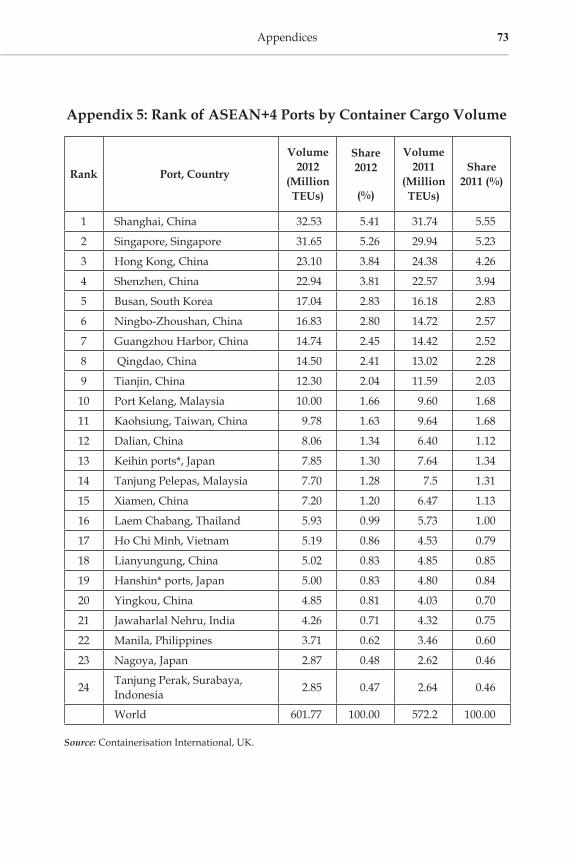
73
Appendix 5: Rank of ASEAN+4 Ports by Container Cargo Volume
Rank Port, Country
Volume 2012
(Million TEUs)
Share 2012
(%)
Volume 2011
(Million TEUs)
Share 2011 (%)
1 Shanghai, China 32.53 5.41 31.74 5.55
2 Singapore, Singapore 31.65 5.26 29.94 5.23
3 Hong Kong, China 23.10 3.84 24.38 4.26
4 Shenzhen, China 22.94 3.81 22.57 3.94
5 Busan, South Korea 17.04 2.83 16.18 2.83
6 Ningbo-Zhoushan, China 16.83 2.80 14.72 2.57
7 Guangzhou Harbor, China 14.74 2.45 14.42 2.52
8 Qingdao, China 14.50 2.41 13.02 2.28
9 Tianjin, China 12.30 2.04 11.59 2.03
10 Port Kelang, Malaysia 10.00 1.66 9.60 1.68
11 Kaohsiung, Taiwan, China 9.78 1.63 9.64 1.68
12 Dalian, China 8.06 1.34 6.40 1.12
13 Keihin ports*, Japan 7.85 1.30 7.64 1.34
14 Tanjung Pelepas, Malaysia 7.70 1.28 7.5 1.31
15 Xiamen, China 7.20 1.20 6.47 1.13
16 Laem Chabang, Thailand 5.93 0.99 5.73 1.00
17 Ho Chi Minh, Vietnam 5.19 0.86 4.53 0.79
18 Lianyungung, China 5.02 0.83 4.85 0.85
19 Hanshin* ports, Japan 5.00 0.83 4.80 0.84
20 Yingkou, China 4.85 0.81 4.03 0.70
21 Jawaharlal Nehru, India 4.26 0.71 4.32 0.75
22 Manila, Philippines 3.71 0.62 3.46 0.60
23 Nagoya, Japan 2.87 0.48 2.62 0.46
24 Tanjung Perak, Surabaya, Indonesia 2.85 0.47 2.64 0.46
World 601.77 100.00 572.2 100.00
Source: Containerisation International, UK.
Appendices

74 ASEAN-India Maritime Connectivity Report
Appendix 6: India’s Non-Containerised Trade with ASEAN+4, 2011-12
(a) Import
(‘000 tonnes)
POL-Crude Fertilizer FRM-
LiquidIron and
Steel
Brunei 250 China 2800 Indonesia 19 China 1606
Indonesia 85 Indonesia 101 Malaysia 126 Indonesia 8
Malaysia 1798 Malaysia 62 Singapore 51 Japan 861
Singapore 3246 Singapore 65 South Korea 133 South
Korea 455
South Korea 30 Malaysia 13
Singapore 129
POL Product
Food grain
Coal (Cook-
ing)
Coal (Ther-mal)
Indonesia 5 China 54 China 90 China 22
Japan 41 Indonesia 2699 Indonesia 14686
South Korea 47 Singapore 79
Malaysia 55 Vietnam 72
Singapore 1465 Total 27439
Thailand 16
Iron Ore/ Pellets
Edible Oil
Other Ores
Vietnam 5 Indonesia 2181 China 102
Total 745 Malaysia 864 Indonesia 198
Singapore 131 Japan 10
Thailand 11 Thailand 33

75
(b) Export
(‘000 tonnes)
POL-Product
Food grain
Other ores
China 67 China 6 China 150
Indonesia 214 Indonesia 144 Indonesia 26
Japan 529 Japan 22 Japan 48
South Korea 539 Malaysia 112 Singapore 25
Malaysia 389 Thailand 6 South Korea 110
Singapore 7215 Vietnam 241 Malaysia 234
Iron and Steel Iron ore
Japan 7 China 43817
Myanmar 3 Japan 2103
South Korea 120 Malaysia 34
Singapore 55 South Korea 150
Thailand 33
Source: Ministry of Shipping, Government of India, New Delhi.
Appendices

76 ASEAN-India Maritime Connectivity Report
Appendix 7: Container Liners Serving India
List of Carriers
APL
Bahri
CSAV
Evergreen Marine Corp. (EMC)
Hamburg Sud (HAS)
Hanjin (HAN)
Hapag-Lloyd (HAL)
Islamic Republic of Iran Shipping Lines (ISL)
K Line (KLI)
Libra (LIB)
Maersk Line (MAL)
Mediterranean Shipping Company (MSC)
MISC Berhad (MIB)
MOL
Norasia (NOR)
NYK
OOCL
PIL
Regional Container Lines (RCL)
Senator Lines (SEL)
United Arab Shipping Company (USC)
Wan Hai Lines, Ltd. (WHL)
Yang Ming (YAM)
Zim
Source: http://www.worldportsource.com/

77
Appendix 8: Key Agencies in Singapore Maritime Sector
Key Agencies Role
Maritime and Port Authority of Singapore
The Maritime and Port Authority of Singapore (MPA) regulates and licenses port and marine services and facilities. It also manages vessel traffic in the Singapore port while ensuring safety and security. The port section contains information, guidelines and procedures on matters relating to the port and its operations. The shipping section covers information on how to register a ship under the Singapore flag as well as manning guidelines, procedures and requirements for owners and masters of Singapore-registered ships.
MPA also posts circulars and notices to update the port and shipping community. Also important to the communities are information on port, shipping and other MPA tariffs. As an active member of the international maritime community, MPA posts updates on IMO matters.
PSA Singapore Terminals
The Port of Singapore Authority was formed on April 1, 1964 to take over the functions, assets and liabilities of the Singapore Harbour Board. On august 25, 1997, a Parliamentary Bill was passed to corporatise the Port of Singapore Authority, and PSA Corporation Ltd was created. PSA’S staff are represented by the Singapore Port Workers union and the Port Officers’ Union. Both unions enjoy a close relationship with PSA’S management.
Singapore Maritime Academy (SMA)
As the country’s main Maritime Training Institution, SMA offers a full range of maritime diplomas and specialist diplomas, certificate of competency (COC) courses as well as standards of training, certification and watchkeeping (STCW) courses.
Source: Agencies’ official websites.
Appendices


Part- II


AgendA
09.30-10.00 Registration & Tea
10.00 – 10.30 Inaugural Session
Introductory Remarks by Ambassador Shyam Saran, Chairman, RIS and National Security Advisory Board (NSAB), New DelhiKeynote Address by Amb. Anil Wadhwa, Secretary (East), Ministry of External Affairs (MEA), Government of India, New Delhi
10.30 – 12.30 Session I: Mega Regional Agreements: Implications for ASEAN-India Trade and Maritime Connectivity
In chair: Amb. V S Seshadri, Adviser, RIS, and Former Indian Ambassador to Myanmar
Panelists Prof. Amita Batra, School of International Studies (SIS), Jawaharlal Nehru University (JNU), New Delhi
Mr. T S Vishwanath, Principal Adviser, APJ-SLG Law Offices, New Delhi
Dr. Prabir De, Senior Fellow, RIS, and Coordinator, ASEAN-India Centre (AIC)
12.30 – 13.30 Lunch Break

82 ASEAN-India Maritime Connectivity Report
13.30 – 15.30Session II: ASEAN-India Ports and Shipping Networks: Emerging Structure, Challenges and Identification of Ocean Routes
In chair: Mr. Arvind Kumar, Adviser, The Energy and Resources Institute (TERI), and Former Adviser, Ministry of Shipping, Government of IndiaPanelists Capt. Kapil Kekre, Advisor (Commercial), Indian National Shipowners’ Association (INSA), MumbaiDr. Subrata Behera, Sr. Research Analyst, Drewry Maritime Research, New DelhiMr. C.B. Singh, Adviser, Ministry of Shipping, Government of India, New DelhiCapt. S Narula, Senior Vice President, Shipping Corporation of India (SCI), MumbaiMr. Aji Vasudevan, Dy. Chief, Director-General of Shipping, Ministry of Shipping, Government of India, MumbaiMr. G. S. Sahani, Adviser, J M Baxi & Co. and former Director-General of Shipping, Government of India, MumbaiQ & A
15.30 – 16.00 Tea / Coffee Break
16.00 – 17.30 Session III: ASEAN-India Maritime Transport Cooperation: The Way Forward
In chair: Ms. Renu Pall, Jt. Secretary (ASEAN ML), Ministry of External Affairs (MEA), Government of India, New DelhiPanelists Mr. Manoj Singh, Adviser (Transport), Planning Commission, New DelhiMr. GVL Satya Kumar, Dy. Chairman, Visakhapatnam Port Trust (VoPT), Vizag Mr. Umesh Grover, Chief Executive Officer, Indian National Shipowners’ Association (INSA), MumbaiQ & A
17.30 – 17.45 Summary and Vote of Thanks by Dr. Prabir De

Ambassador Anil Wadhwa, Secretary (East) in the Ministry of External Affairs, Dr Prabir De, Coordinator, ASEAN-India Centre at the RIS, Ms. Renu Pall, Joint Secretary (ASEAN) in the MEA, Ambassador V.S. Seshadri, Adviser, RIS and former Ambassador to Myanmar, distinguished guests, ladies and gentlemen.
On behalf of the ASEAN-India Centre and our co-sponsor the Indian National Shipowner’s Association, let me extend a warm welcome to all the distinguished speakers and participants at this National Seminar on India-ASEAN Maritime Transport Cooperation.
I would like to extend a warm welcome to Ambassador Anil Wadhwa, who has recently taken up his assignment as Secretary (East) in MEA. On behalf of the ASEAN-India Centre, I would like to express my sincere thanks to him for gracing this Seminar with his presence and for consenting to inaugurate this Seminar and to share with us his perspective on India-ASEAN relations and the challenge of establishing connectivity, in the widest sense between the two friendly and strategic partners.
Ambassador Shyam SaranChairman, AIC, RIS and NSAB
Opening Address

84 ASEAN-India Maritime Connectivity Report
The ASEAN-India Centre has been established at RIS pursuant to a decision taken by the Heads of State/Government at the India-ASEAN Commemorative Summit held in December 2012. Its mandate is to contribute to the strengthening of relations in various aspects between the two sides. The promotion of all-round connectivity is one of the priority areas where enhanced cooperation is envisaged. Connectivity, in this sense, covers cross-border road, rail, air and digital connectivity, as well as maritime links. India has welcomed the Master Plan on ASEAN connectivity as well as the ASEAN ICT Master Plan 2015. Our effort is to align our plans for cross-border linkages with these important and ambitious platforms for regional integration. The ASEAN Connectivity Coordinating Committee (ACCC) has opened a comprehensive dialogue with India in 2013 to enhance all-round connectivity between India and ASEAN countries. It is against this background that the ASEAN-India Centre at RIS decided to focus attention on maritime links between our India and its ASEAN partners. In order to meet the ambitions targets for trade, the availability of regular, efficient and affordable shipping is of critical importance.
The Centre has prepared a comprehensive and a very informative background paper on India-ASEAN Maritime Connectivity, which has been circulated to those taking part in the panel discussions. Participants at this Seminar who wish to receive copies of the paper may register their e-mails with the Reception Desk. The paper will also be put on the RIS Website, so you can access it easily.
From the paper, it is apparent that the maritime links between Indian ports and ports in ASEAN countries remain a weak link in our effort to promote closer economic and commercial relations between our countries. Shipping services are irregular and service only a few major ports, thereby necessitating a great deal of transshipment activity. On the Indian side, cargo-handling capacity at our ports is limited and unable to cope with the rising volume of both incoming and outgoing cargo. Indian shipping carries only a limited share of India’s maritime tide and this is a cause of concern. There is an urgent need to modernise our ports, reduce the turn around time for ships and expand the capacity to handle containerised cargo. We need more modern, efficient and containerised shipping and reuse the declining share of Indian shipping in our maritime trade.
85
We must acknowledge that in shipping sector several ASEAN countries are ahead of India and Singapore is one of the world’s leading ports and container terminals. Other ASEAN countries are making rapid progress in modernising and expanding their ports and shipping services. India must keep pace with these developments even as it seeks to establish closer maritime links with its South East Asian neighbors.
Both India and ASEAN are maritime nations, with a rich and glorious history of maritime trade. The seas that wash our shores, constituted an ancient maritime highway that nurtured a long and sustained exchange of goods, peoples, ideas and cultures among our peoples. It must be our endeavor to revive and energise those ancient links in a contemporary setting, so that they become a driving force in the Asian resurgence that we are witnessing today.
I have no doubt that this Seminar will explore the many dimensions of the challenge we face in establishing a dense network of maritime links among our countries and generate recommendations which could become valuable inputs into the inter-governmental processes that are already engaged in promoting India-ASEAN maritime cooperation.
I wish the Seminar every success.
Opening Address


Ambassador Anil Wadhwa Secretary (East), Ministry of External Affairs
KeynOte Address
Chairman RIS, ASEAN-India Centre and National Security Advisory Board (NSAB) Amb. Shyam Saran.
ASEAN Heads of Missions.
Coordinator of the ASEAN-India Centre Dr. Prabir De,
Ladies and Gentlemen
It gives me great pleasure to be with you today to discuss elements key to strengthening India’s maritime connectivity with the ASEAN region. This is a vital element in the ASEAN-India connectivity agenda and would impact not just the volume of trade across our maritime routes but also support and strengthen land connectivity in the region. I commend the ASEAN India Centre for organising this discussion and for putting together in this room some of the key stakeholders in India’s maritime transport infrastructure.
2. Connectivity is going to remain one of the foremost priorities in the ASEAN-India strategic partnership in the months ahead and it is important that we discuss, analyse and put together the

88 ASEAN-India Maritime Connectivity Report
various components that would help us to strengthen India’s maritime transport capacities.
3. This is not a new item on our agenda. It has been part of our civilisational consciousness in the region. Maritime connectivity, in particular, has played a significant role in creating regional corridors for intellectual, cultural, trade and economic linkages over the centuries. It is today central to the ASEAN-India partnership for progress and prosperity. Equally importantly, it is also of relevance to the maintenance of peace and security in the region.
4. The fact that connectivity related issues continue to be pivotal to the agenda of the ASEAN-India partnership was illustrated in the over 60 events in 2012-13 to mark the ASEAN-India Commemorative Year, including the ASEAN-India Car Rally which was participated in by all 10 ASEAN countries, the INS Sudarshini Expedition to nine ASEAN countries and the marker events that highlighted the cultural similarities and the business complementarities in our region.
5. Two major developments are lending even greater urgency to our connectivity agenda. One is the ASEAN march towards an ASEAN Community by 2015, which will consolidate a market of more than 600 million people and a combined GDP of US$ 2.3 trillion. The second development is the consolidation of economic and commercial engagement between India and ASEAN through the FTA on Trade in Goods, which has been in place since 2009, and the FTA on Services and Investment which is expected to be signed in the coming months after ASEAN countries complete their internal processes for signature. This will integrate an economic space of 1.8 billion people and a GDP of over US$ 3.7 trillion.
6. In the course of last year, India became the third partner country of the ASEAN, after China and Japan, to begin formal discussion on connectivity with the ASEAN Connectivity Coordinating Committee (ACCC). It is a reflection of the importance of this agenda both to ASEAN countries as also India that the ACCC, in an unprecedented manner, would be holding an informal inter-sessional meeting with India when it visits New Delhi in March 2014 for Delhi Dialogue VI.

89
7. We have also been participating in the ASEAN Maritime Transport Working Group Plus Meetings since 2012 and, following the 1st ACCC-India meeting in June 2013, we have requested Ministry of Shipping to establish a Joint Working Group on Maritime Connectivity to look into various aspects of promoting maritime connectivity. In particular, we need to find ways to assure trade volumes to sustain a shipping line connecting India, Myanmar, Thailand, Cambodia, Vietnam.
8. The steady implementation of the India-Myanmar-Thailand Trilateral Highway has been very visible. But India is also meeting its commitment on developing the Sittwe Port in Myanmar, as part of the Kaladan Multimodal Transit Transport Project. In fact, I would urge that as we examine ways to strengthen maritime connectivity between ASEAN and India, we adopt an integrated multi-modal approach which explores the advantages, the linkages and the synergies between port infrastructure and the existing and upcoming road infrastructure in the region. This would also be relevant as the Government of India makes progress on creating a new entity to accelerate the building and up-gradation of strategic roads on our borders.
9. At the 11th ASEAN-India Summit in Brunei Darussalam in October 2013, our Prime Minister suggested that discussions begin on an ASEAN-India Transit Transport Agreement to be concluded by 2015 so as to create an enabling policy framework for effective use of connectivity linkages. The 11th ASEAN Economic Ministers Plus India Consultations in August last year agreed on the establishment of a Working Group on Soft Infrastructure. Both these would have a maritime dimension to address as part of their mandate.
10. Any assessment on strengthening maritime linkages between ASEAN and India must also take cognizance of the mega regional agreements and arrangements that are taking shape within the ASEAN countries. From the maritime connectivity point of view, the Comprehensive Asia Development Plan (CADP) Phase II Study by Economic Research Institute for ASEAN and East Asia (ERIA) in 2011, which was conducted with help from RIS, has established that the share of merchandise trade in the overall
Keynote Address

90 ASEAN-India Maritime Connectivity Report
trade basket with ASEAN is growing steadily. Looking ahead, such transshipment will need to happen through cargo ships and requires improvement in port and logistics infrastructure and direct shipping lines. These routes need to be identified, given economic feasibility and their policy related lacunae will need to be addressed. ASEAN have designated 47 ports in the trans-ASEAN transport network and many of these confront challenges of capacity and infrastructure. ASEAN countries, with financing through the mechanism of the ASEAN Infrastructure Fund and ADB, can be expected to focus on concentrating the comparative advantage of an intra-ASEAN network. It is for us to show that the advantage would grow exponentially if integrated with the Indian economic space.
11. ASEAN countries are seeking innovative solutions, for instance, to make the Dawei Sea Port development a feasible project. The Dawei SEZ Development Co. (DSEZ) has been created as a special purpose vehicle supported by Thailand and Myanmar for this purpose. We should look at ways of becoming part of this development at Dawei and this can be done by roping in the private sector and making them aware of this investment opportunity.
12. Japan is giving a clearly visible and concerted push to strengthening its maritime linkages not just in the ASEAN region, particularly Myanmar, but also with India. There are possibilities in all of this which merit examination for reinforcing the structure of Indian ports and shipping networks.
13. Another important dimension is to look at increasing the sustainability of maritime transportation through creating an economically vibrant catchment area, i.e. looking to integrate SEZs, availability of energy, ICT, etc., on the one hand and, on the other, creating clusters of economic activity to strengthen, for instance, the regional food basket, local industry, capacity development and employment, and promote tourism and environmental management. In my view, the construct for maritime connectivity will sustain easier if it adopts an inclusive, symbiotic approach with these priority issues.

91
14. I, therefore, look forward to the discussions today to identify the way forward on ASEAN-India Maritime Transport Cooperation. This subject, as I mentioned before, is part of our discussions with the ASEAN Connectivity Coordinating Committee and the ASEAN Maritime Transport Working Group Plus agenda. There will be immediate term relevance to your recommendations and suggestions in our discussions with the ACCC on March 8, 2014 in New Delhi.
15. I wish you all success and hope that your discussions in each of the sessions would emphasise the specifics to help us build our approach.
16. Once again, I would like to commend the ASEAN-India Centre for putting together excellent sessions and panels for such discussion.
Thank you.
Keynote Address


List of PArticiPAnts
MINISTRY OF EXTERNAL AFFAIRS
Ambassador Anil WadhwaSecretary (East)Ministry of External AffairsNew Delhi
Ms. Renu PallJoint Secretary (ASEAN ML)Ministry of External AffairsNew Delhi
Ms. Paulomi TripathiUnder Secretary 1 (ASEAN ML)Ministry of External AffairsNew Delhi
Mr. Naveen Kumar R.Under Secretary-OT (ASEAN Multilateral)ASEAN ML DivisionMinistry of External AffairsNew Delhi

94 India-ASEAN Maritime Connectivity
MINISTRY OF SHIPPINGMr. C.B. SinghAdviserMinistry of ShippingGovernment of IndiaNew Delhi
Mr. Aji VasudevanDeputy Chief Ship Surveyor &Senior Deputy Director General (Tech)Directorate General of ShippingMinistry of Shipping, Government of IndiaMumbai
MINISTRY OF COMMERCE & INDUSTRYMr. Rajesh KumarUnder SecretaryDepartment of CommerceMinistry of Commerce & IndustryNew Delhi
NATIONAL SECURITY COUNCIL SECRETARIAT (NSCS)Ms. Perin DeviDirectorNational Security Council Secretariat (NSCS)New Delhi
Mr. Akshay JoshiDirectorNSCSNew Delhi
PLANNING COMMISSIONMr. Manoj SinghAdviser (Transport)Planning CommissionNew Delhi

95
HIGH COMMISSION OF BRUNEI DARUSSALAMH.E. Dato Paduka Sidek AliHigh CommissionerHigh Commission of Brunei DarussalamNew Delhi
Mr. Ali-Azri AlipahSecond SecretaryHigh Commission of Brunei DarussalamNew Delhi
HIGH COMMISSION OF THE REPUBLIC OF SINGAPOREH.E. Mr. Lim Thuan KuanHigh CommissionerHigh Commission of the Republic of SingaporeNew Delhi
PHILIPPINE EMBASSYH.E. Mr. Benito B. ValerianoAmbassadorPhilippine EmbassyNew Delhi
Mr. Edwin Gil Q. MendozaSecond Secretary and ConsulPhilippine EmbassyNew Delhi
Ms. Maria Agnes M. CervantesMinisterPhilippine EmbassyNew Delhi
ROYAL THAI EMBASSYMs. Potchamas SaengthienFirst SecretaryRoyal Thai EmbassyNew Delhi
List of Participants

96 ASEAN-India Maritime Connectivity Report
RAIL INDIA TECHNICAL AND ECONOMIC SERVICE (RITES- INDIA)Mr. B.V.L. NarayanaGeneral Manager (Transportation and Economics)Rail India Technical and Economic Service (RITES-INDIA)Gurgaon
SHIPPING CORPORATION OF INDIA LTD. (SCI)Capt. S. NarulaSenior Vice President(Container Services and Marketing Liner Division)The Shipping Corporation of India Ltd.Mumbai
VISAKHAPATNAM PORT TRUSTMr. G.V.L. Satya KumarDeputy ChairmanVisakhapatnam Port TrustVizag
EXPORT-IMPORT BANK OF INDIAMr. Vanlalruata FanaiAssistant General ManagerExport-Import Bank of IndiaMumbai
CONFEDERATION OF INDIAN INDUSTRY (CII)Ms. Harshit SehgalRegional Director – East Asia, ASEAN & ANZInternational DepartmentConfederation of Indian Industry (CII)New Delhi
Mr. U.D. BhatkotiAdviserCIINew Delhi

97
JAWAHARLAL NEHRU UNIVERSITY (JNU)Dr. Amita BatraProfessor of EconomicsCentre for South Asian StudiesSchool of International StudiesJawaharlal Nehru UniversityNew Delhi
CENTRE FOR AIR POWER STUDIESMs. Sana HashmiAssociate FellowCentre for Air Power StudiesNew Delhi
THE ENERGY AND RESOURCES INSTITUTE (TERI)Mr. Arvind KumarAdviser The Energy and Resources Institute (TERI)New Delhi
INSTITUTE FOR DEFENCE STUDIES & ANALYSIS (IDSA)Mr. S.D. MuniAdviserInstitute for Defence Studies & Analysis (IDSA)New Delhi
Dr. Udai Bhanu SinghSenior FellowIDSANew Delhi
INDIAN COUNCIL OF WORLD AFFAIRS (ICWA)Mr. Vijay SakhujaDirector (Research)Indian Council of World AffairsNew Delhi
List of Participants

98 ASEAN-India Maritime Connectivity Report
INDIAN COUNCIL FOR RESEARCH ON INTERNATIONAL ECONOMIC RELATIONS (ICRIER)Dr. Nisha TanejaProfessorIndian Council for Research on International Economic Relations (ICRIER)New Delhi
Dr. Saon RaySenior FellowICRIERNew Delhi
Ms. Sreerupa SenguptaResearch AssistantIndian Council for Research on International Economic Relations (ICRIER)New Delhi
TATA CONSULTANCY SERVICESMr. Manish GargSenior ConsultantTATA Consultancy ServicesNoida (UP)
SAEA GROUP RESEARCHMr. M. AruCountry DirectorSAEA Group ResearchSingapore
J.M. BAXI & COMr. Gajinder Singh SahniAdviserJ.M. Baxi & Co.Mumbai
APJ-SLG LAW OFFICESMr. T.S. VishwanathPrincipal AdviserAPJ-SLG Law OfficesNew Delhi

99
DREWRY MARITIME SERVICES (P) LTD.Dr. Subrata Kumar BeheraSenior Research AnalystDrewry Maritime ServicesGurgaon
Dr. Vikash RanjanSenior Research AnalystDrewry Maritime ServicesGurgaon
OTHERSMr. Siddharth SinglaAdvocateNew Delhi
INDIAN NATIONAL SHIPOWNERS’ ASSOCIATION (INSA)Capt. Kapil KekreAdvisorIndian National Shipowners’ AssociationMumbai
Mr. Umesh C. GroverChief Executive OfficerIndian National Shipowners’ AssociationMumbai
Ms. Rupali NambiarEconomic AdvisorIndian National Shipowners’ AssociationMumbai
RESEARCH AND INFORMATION SYSTEM FOR DEVELOPING COUNTRIES (RIS)Ambassador Shyam SaranChairman, RIS
Ambassador V.S. SeshadriVice Chairman, RIS
List of Participants

100 ASEAN-India Maritime Connectivity Report
Dr Prabir DeProfessor, RIS
Mr. Sunando BasuResearch Associate, RIS
Mr. Manmeet Singh AjmaniResearch Assistant, RIS

summAry
ASEAN-India Centre in collaboration with the Indian National Shipowners’ Association (INSA), Mumbai, organised a National Seminar on ASEAN-India Maritime Transport Cooperation on 31 January 2014 in New Delhi. The focus of the ASEAN-India connectivity programme was on ASEAN-India maritime connectivity. ASEAN-India Centre (AIC) circulated a draft of a report entitled “ASEAN-India Maritime Connectivity Report”. One of the objectives of this seminar was to seek comments and suggestions from the stakeholders on the Report.
Ambassador Shyam Saran, Chairman, AIC, RIS and National Security Advisory Board (NSAB) gave introductory remarks. Keynote Address was delivered by Ambassador Anil Wadhwa, Secretary (East), Ministry of External Affairs (MEA). There were three technical sessions dealing with ASEAN-India FTA, RCEP, ASEAN-India Ports and Shipping Networks and the emerging challenges of ASEAN-India Maritime Transport Cooperation. The brief summary of the proceeding of the seminar is as follows:
y In his opening address, Chairman, AIC, emphasised on the promotion of all-round connectivity as one of the priority areas for cooperation between ASEAN and India. He underlined that in order to meet the ambitious target of trade, maritime connectivity between India and ASEAN is

102 ASEAN-India Maritime Connectivity Report
very important. He also raised the issue of weak maritime links between Indian ports and ports in ASEAN countries. Ambassador Saran stated that cargo handling capacity is limited at Indian ports, and therefore, increasing the cargo handling capacity has to be a top priority. He recommended to revive the maritime links between India and ASEAN countries in order to enhance the volume of trade and investment. Indian shipping carries only a limited share of India’s maritime trade, which is a cause of concern. Therefore, there is an urgent need to modernise our ports, reduce the turnaround time for ships and expand the capacity to handle containerised cargo. Ambassador Saran also added that we need more modern, efficient and containerised shipping and raise the share of Indian shipping in our maritime trade.
y Ambassador Anil Wadhwa in his Keynote Address emphasised that connectivity is going to remain as one of the foremost priorities in the ASEAN-India Strategic Partnership in the months ahead, and it is, therefore, important to discuss, analyse and put together the various components that would help strengthen India’s maritime transport capacity. The maritime connectivity will play a significant role in creating regional corridors for intellectual, cultural, trade and economic linkages between India and ASEAN countries. The focus of maritime connectivity with ASEAN countries is to consolidate the economic activities between ASEAN and India. Ambassador Wadhwa informed that improvement of Indian port sector and identifying sea routes for enhancing economic activities are the major challenges. He gave the example of Sittwe Port in Myanmar, which will help India to strengthen economic ties with ASEAN countries. India has also been participating in the ASEAN Maritime Transport Working Group Plus Meetings since 2012, and following the First ACCC-India meeting in June 2013, the Ministry of External Affairs has requested the Ministry of Shipping to establish a Joint Working Group on Maritime Connectivity to look

103
into various aspects of promoting maritime connectivity. Ambassador Wadhwa underlined that we need to find ways to assure trade volumes to sustain a shipping line connecting India, Myanmar, Thailand, Cambodia, and Vietnam.
y In the first working session, Professor Amita Batra in her presentation stated that the Regional Comprehensive Economic Partnership (RCEP) aims at deeper integration of the ASEAN+6 countries and takes into account the level of individual economies. India will be gaining more from RCEP. Integration of ASEAN+6 has lead to increase in FDI, evolution in technology, reduction in transport cost in supply chain, etc. However, she raised concerns over Non-tariff Barriers (NTBs), income diversions, etc. Professor Batra also mentioned that the success of TPP agreement relies on involvement of like-minded and open economies. Areas covered in TPP are goods, services, IPR, investment, government procurement, dispute settlements, etc. She also stated that supply chain will be playing an important role in enhancing trade in both the agreements.
y Mr. T.S. Vishwanath in his presentation said that there are confusions among the companies related to the interpretation of MFNs and preferential tariffs. There are some differences in HS codes across the countries. Mr. Vishwanath suggested to increase the capacity of ports, better connectivity by roads and rails, to create a process of free movement of goods across the countries, and to have the uniformity between the HS codes so that the companies can benefit from ASEAN-India FTA.
y Dr. Prabir De in his presentation stated that trade in parts and components between ASEAN and India has been growing fast. To encourage the production networks between ASEAN and India, strong maritime and air connectivity links are pivotal. However, there are many bottlenecks in maritime sectors, such as lack of port capacity, shortfall of skilled human resources, lack of institutions, etc. According
Summary

104 ASEAN-India Maritime Connectivity Report
to Dr. De, ASEAN and India have to build a strong ocean shipping network with a strong fleet capacity, etc.
y In the Session II, Mr. G.S. Sahani in his presentation suggested to follow PPP model for the development of Indian ports sector. His company (Vishaka Container Terminal) has been running a container terminal at the Vishakhapatnam port in Andhra Pradesh. Vishaka Container Terminal has the capacity to accommodate larger container vessel. It can link Indian east coast with ASEAN ports.
y Captain Kapil Kekre emphasised the importance of controlling transport cost since capital requirement is huge and also acts as high entry barrier for new players. ASEAN and India both have long coast line, which is dotted with many ports. Capt. Kekre suggested that there are ample scopes for joint ventures between the ports of ASEAN and India.
y Captain S. Narula stated that transport charges at present are very high. With low cargo volume, Indian shipping companies have been facing difficulties to manage the cost of operation. He highlighted that his Company (Shipping Corporation of India) is likely to resume services between Chennai and Yangon, if subsidy is available from the government. Capt. Narula raised concern over low freight rate, which makes carriers less enthusiastic to serve India’s east coast. He suggested serving Myanmar directly from India and not via Singapore. He pointed out that statistics regarding Indian ports and terminals may be misleading because Indian terminals are technically not as same as Singapore’s terminals.
y Mr. Aji Vasudevan in his presentation stated that India should have adequate number of ships. He emphasised to give attention to unit cost of transport per container. He also added that training should be low if BIMS services are restricted. Improvements in maritime and ports services are very much required.
y Mr. C.B. Singh in his presentation stated that India is not using its rivers and inland waterways adequately for

105
transportation. He argued that the rivers can be used to import goods from Myanmar and Bangladesh. Haldia port can be used as a hub for inland waterways transportation with neighbouring countries.
y Dr. Subrata Behera in his presentation stated that Kaladan Multi-modal Transit Transport Project (KMTTP) is undertaken because of strategic reasons. He pointed out that there is not much of cargo in east coast of India, hence shipping industry faces a lot of difficulties. Dr. Behera stressed upon building port infrastructure and joining inland waterways with ports so as to reduce the transportation costs.
y In the Session III, Mr. Manoj Singh in his presentation said heavy investment will be needed to develop good transportation in North East India. He also mentioned about the programme, which has been undertaken by the Planning Commission to build a road in North East India. Mr. Singh confirmed that massive railway development programmes are going on at present in North East India. Linking road to Kaladan project from Mizoram state capital is also getting ready.
y Mr. GVL Satya Kumar in his presentation focused on the role of ports as a starting point between India and ASEAN countries. He gave an example of Myanmar exporting wood to India through Visakhapatnam port. He insisted on capital infusion in the port sector. However, he raised the concerns over intra-port connectivity, poor communication link between mills and roads and railways with the ports. He emphasised on the improvement in maritime connectivity, and further stated that vessel-related discount should be offered to encourage maritime transportation.
y Mr. Umesh Grover in his presentation requested the Government of India to incentivise coastal shipping since the introduction of taxes has hurt the shipping business in India. He also emphasised on a stronger connectivity between Indian east coast and Myanmar coast and creation of hub ports in eastern and western coasts of India.
Summary


RIS
ASEAN-India Centre at RIS
RIS A Think-Tankof Developing Countries
— Policy research to shape the international development agenda
Research and Information System for Developing Countries (RIS) is a
New Delhi-based autonomous policy research institute that
specialises in issues related to international economic development,
trade, investment and technology. RIS is envisioned as a forum for
fostering effective policy dialogue and capacity-building among
developing countries on global and regional economic issues.
The focus of the work programme of RIS is to promote South-South
Cooperation and collaborate with developing countries in
multilateral negotiations in various forums. RIS is engaged across
inter-governmental processes of several regional economic
cooperation initiatives. Through its intensive network of think tanks,
RIS seeks to strengthen policy coherence on international economic
issues and the development partnership canvas.
For more information about RIS and its work programme, please visit
its website: www.ris.org.in
RISResearch and Information Systemfor Developing Countries
Core IV-B, Fourth Floor, India Habitat Centre
Lodhi Road, New Delhi-110 003, India
Tel.: +91-11-2468 2177-80, Fax: +91-11-2468 2173-74
E-mail: [email protected]; [email protected]
Website: http://www.ris.org.in; http://aic.ris.org.in
ASEAN-India Centre at RIS
AS
EA
N-In
dia
Maritim
e C
on
nectiv
ity R
ep
ort