Embed Size (px)
Citation preview
RIPE FOR THE PICKING: HAVE WE EXHAUSTED THE LOW-HANGING FRUIT IN
THE INDUSTRIAL SECTOR?
Anna Monis Shipley R. Neal Elliott, Ph.D., P.E.
April 2006
Report Number IE061
©American Council for an Energy-Efficient Economy 1001 Connecticut Avenue, NW, Suite 801, Washington, D.C. 20036 202-429-8873 phone, 202-429-2248 fax, http://aceee.org Web site


Ripe for the Picking, ACEEE
Contents
Acknowledgments............................................................................................................... ii
Executive Summary ........................................................................................................... iii
Introduction......................................................................................................................... 1
Background......................................................................................................................... 2
Does the Potential Still Exist for Energy Efficiency in Industry? .................................. 3
Industry Energy Use in 1970s–1980s ............................................................................. 5
Industry Energy Use in 2000s......................................................................................... 8
Clues to Low-Hanging Fruit ............................................................................................. 11
Industrial Capital-Investment Trends ........................................................................... 11
Industrial Assessment Centers—Efficiency Trends in Small & Medium-Sized Industries....................................................................................................................... 14
Motors Example—How Energy Prices, Technology Development, and Standards Affect Efficiency........................................................................................................... 19
Results from DOE’s Industrial Best Practices Program ............................................... 20
Have We Exhausted the Low-Hanging Fruit in the Industrial Sector? ........................ 21
What Future Work Is Needed? ......................................................................................... 23
Conclusions....................................................................................................................... 24
References......................................................................................................................... 25
i

Ripe for the Picking, ACEEE
ACKNOWLEDGMENTS The authors express their appreciation to the U.S. Environmental Protection Agency (EPA) Office of Air and Radiation and the Energy Foundation for their support that made this research possible. We thank John A. “Skip” Laitner at EPA, Alan Sanstad at Lawrence Berkeley National Laboratory, and Steven Nadel at ACEEE for their guidance during this research project. We also express our appreciation to Christopher Russell at the Alliance to Save Energy, Michaela Martin at Oak Ridge National Laboratory, and Eric Masanet at Lawrence Berkeley National Laboratory for reviewing and providing invaluable comments on this report. Finally, the authors acknowledge the editorial contributions of their ACEEE colleagues Renee Nida and Susanne Brooks who helped make the report readable.
ii

Ripe for the Picking, ACEEE
EXECUTIVE SUMMARY A recurring theme offered by those opposed to the funding of industrial energy efficiency efforts has been that companies have already realized all the cost-effective industrial energy efficiency opportunities that exist. If one is to accept the premise that we have used up all our energy efficiency, we must assume that: all the efficiencies implemented during the last energy crises are still fully implemented today; technology is static so no new efficiency opportunities have emerged; we have learned nothing new about how to improve productivity or energy efficiency; and energy efficiency opportunities are not affected by price (especially in view of the recent dramatic increases).
We have evidence that these premises are untrue, and economy-wide data shows that energy intensity has been improving, even during a period of fairly stable energy prices during the 1990s. While the reasons underlying this phenomenon are complex, the trend clearly exists. In this study, we will look for clues to how the potential and costs of energy efficiency investments have changed over time, to determine:
• If the “low-hanging” fruits within the industrial sector available in the 1970s and 1980s were “used up” or left on the vine to rot away, or if they have grown back; and
• If the pattern of efficiency investments has changed over time such that new and different investment opportunities are now available compared to those available in the 1980s.
From these clues we will show that energy-saving opportunities still exist in industry today, though perhaps their character and relative costs have changed. While we may not have the robust data to be able to determine how much of the efficiency opportunity is attributable to technology, structural change, or learning, we hope to provide clues that lead the reader to share our conclusion that industrial energy efficiency opportunities are fruits born by a healthy, growing tree—ripe for the picking.
Does the Potential Still Exist for Energy Efficiency in Industry? Numerous analytical studies have found that abundant, low-cost efficiency opportunities exist in all parts for the industrial sector. These savings projections have been corroborated by actual evaluated program results in regions that have implemented robust programs and also at individual companies. Many of these opportunities lie within the manufacturing process (e.g., glass melting or chemical distillation) and so are site specific. As a result, it is frequently difficult to generalize about the characterization of these opportunities. What can be generalized is that the energy efficiency opportunities can be grouped into two broad categories: low-cost/no-cost measures that involve changes in operating or maintenance practices; and measures that involve capital investments in new equipment. The industrial sector, however, has changed fairly dramatically over the past thirty years. In order to examine the context, we can look at the energy use trends that have taken place during this period.
iii

Ripe for the Picking, ACEEE
The 1970s were characterized by the first of several energy price spikes that have hit energy consumers. These spikes resulted in a dramatic decrease in energy intensity by the early 1980s as a result of capital improvements made in response to the high prices as well as an elimination of energy waste. The 1980s were a period of rapid technological innovation in the industrial sector. Among the key developments were computer control systems that could control processes and combustion systems, allowing for optimization of the processes with the primary goal of increasing production output, but also reducing energy consumption. Low energy prices during much of the 1990s made non-energy benefits equally important, if not more important, than energy savings in determining the adoption of energy-efficient technologies. Energy savings were found to be most often not the determining factor in the decision to develop or invest in an emerging technology, with several studies on emerging energy-efficient industrial technologies showing that over two-thirds of profiled emerging technologies not only save energy but yield non-energy benefits, such as productivity. With the dawn of the 21st Century, we face a new set of market drivers with increasing energy prices and emergence of greater global competition. Forecasts suggest that industrial output will grow more slowly than overall economic activity—industry at a 2.1% annual rate while overall economic activity will increase at a 3% annual rate. Energy consumption in the industrial sector is expected to increase even more slowly—by only 0.8%—so that overall the energy intensity is expected to decrease by 1.1% per year. The growth in non-energy-intensive industries such as electronic equipment is projected to be much faster than energy-intensive industries such as primary metals. Some of these efficiency improvements have resulted from the elimination of inefficient excess production capacity. The U.S. manufacturing base had developed significant excess capacity by the 1980s as a result of the capital investments driven by the economic expansion of the 1960s and early ‘70s. Beginning in the mid-1980s, we saw a trend toward reduced capital investment as the investment community began to focus on increased return on assets. This resulted in a period of consolidations within industries that has continued until recently. Clues to the Existence of Low-Hanging Fruit Since our data on energy use in the industrial sector is limited because of the diversity within the industrial sector, we must look for clues in trends to see if energy efficiency fruit continues to exist. One of the few continuous data sets available to researchers is the results from the U.S. Department of Energy’s Industrial Assessment Centers (IAC) program. The IAC program, located at 26 universities across the country, provides energy and waste audits for small to medium-sized manufacturing facilities. The results of these 650 to 900 audits each year are collected in a database that reflects both the recommendations and the measures actually implemented. It now contains about 13,000 assessments, with over 96,000 specific recommendations, conducted by the program since 1980. A review of the data indicates that IAC participating manufacturers achieve on average $30,000 annually in energy savings and $30,000 in waste and productivity savings, totaling $60,000 per assessment, with replication
iv

Ripe for the Picking, ACEEE
and long-term implementation support adding an additional $15,000 to the average audit savings. Overall, a little more than half of the improvements suggested through the IAC program have been adopted by industrial users. The IAC program averages $5–9 of energy savings directly from assessment alone, per program dollar. Table ES-1 shows what the costs and measure savings by fuel type were for measures recommended during IAC audits in both 1983 and 2003 dollars. While there appear to be abundant low cost (and short-payback) opportunities during both eras, the median simple payback and median ratio of installed cost to annual savings during the early 2000s are about 1.5 that of the early 1980s in constant dollar terms.
Table EA-1. Annual Energy and Cost Savings for IAC Program 1980-1985 2000-2005
Prim
ary
Res
ourc
e
Med
ian
Impl
emen
tatio
n C
ost
per
Rec
omm
enda
tion
in 1
983$
(200
3$)
Med
ian
Ann
ual
Ene
rgy
Con
serv
ed
per
Rec
omm
enda
tion
(MM
Btu
)
Med
ian
Ann
ual C
ost
Savi
ngs
per
Rec
omm
enda
tion
in 1
983$
(200
3$)
Cos
t Ben
efit
Rat
io
Med
ian
Impl
emen
tatio
n C
ost
per
Rec
omm
enda
tion
in 2
003$
Med
ian
Ann
ual
Ene
rgy
Con
serv
ed
per
Rec
omm
enda
tion
(MM
Btu
)
Med
ian
Ann
ual C
ost
Savi
ngs
per
Rec
omm
enda
tion
in 2
003$
Cos
t Ben
efit
Rat
io
Electric $400 ($216) 59 $1,319
($714) 6.78 $600 95 $1,369 6.32
Natural Gas
$400 ($216) 323 $1,514
($819) 1.24 $1,400 468 $3,737 2.99
LPG $3,000 ($1,623) 428 $3,368
($1,822) 7.01 $975 238 $2,182 4.10
Fuel Oil (#2)
$528 ($286) 161 $1,360
($736) 3.28 $698 316 $2,709 2.21
Coal $40,000 ($21,640) 33,213 $65,300
($35,327) 1.20 $3,500 2,480 $7,570 1.41
Median All Fuels
$400 ($216) 125 $1,418
($765) 3.20 $768 136 $1,800 5.65
Median Simple Payback
0.28 years (3.4 months) 0.43 years (5.2 months)
Another example is electric motors that account for over two-thirds of all industrial electricity use. Motors that have a range of efficiencies have always been available in the marketplace. From the mid-1950s until the mid-1970s (a period of inexpensive energy), installed motor efficiency declined as manufacturers built relatively inefficient motors. Unlike their predecessors, these motors were designed with a focus on lower initial costs and used more energy because of their poor design. Less efficient and more compact motors were made possible by the development of insulation material that could withstand higher temperatures (less efficient motors tend to release more heat than efficient motors). Insulation materials in motors developed in the 1970s could tolerate much higher operating temperatures than motors built in the 1940s and 1950s. It was thus possible to design motors that could accommodate higher losses without damaging the insulation and motor lifetime.
v
Ripe for the Picking, ACEEE
By the mid-1970s when energy prices began escalating rapidly, manufacturers began to introduce lines of energy-efficient motors in addition to their standard-efficiency models. In the late 1970s and early 1980s, the National Electrical Manufacturers Association (NEMA) established a labeling program for the most common types and sizes of motors. Under this program, minimum-efficiency ratings for a motor are listed on its nameplate. NEMA developed testing procedures to establish a motor’s rated efficiency. In 1989, NEMA first developed and adopted energy-efficient performance values in its standards. The performance standards were strengthened in 1991 to help guide the development of new high-efficiency products. In 1992, Congress passed the Energy Policy Act (EPAct), which set minimum-efficiency levels for industrial motors. This legislation opened the door for a large volume of newly qualifying products to enter the marketplace. Additionally, most manufacturers now offer motors that significantly exceed the EPAct minimum-efficiency levels. When we look more closely at the IAC data with respect to motor systems, we see that the median implemented cost of motors system improvements in the 2000s is 4.7 times the cost in the 1980s, while the annual energy conserved is only 1.39 times that of the 1980s. This does not mean that the low-hanging fruit in motors systems is gone. This simply means that the opportunities are different today than they were 20 years ago. Whereas 20 years ago, simply replacing an inefficient standard model with more efficient product may have provided improvement, today the least expensive opportunity may be about how motor systems are managed. It is worth noting that even though efficiency opportunities may cost slightly more in real terms than they did 20 years ago, in absolute terms, these investments are still very inexpensive and offer fantastic paybacks. The median payback of 5.2 months in the most recent IAC data may be greater than the 1980s value of 3.4 months, but any payback period of less than 12 months is typically considered very attractive for industrial energy efficiency investments. Many would consider simple paybacks below 6 months to constitute low-hanging fruit. Another measure of the savings potential of industrial facilities is available in the data from the U.S. Department of Energy’s (DOE) Industrial Best Practices program. The program collects information on the results brought forth by plant-wide industrial assessments of manufacturing facilities. Data collected from five large facilities reveal that the ratio of annual savings recommendations to DOE funds equals 47. In other words, for every dollar invested by DOE, the plants reaped $47 in recommended annual savings including replication at other facilities and long-term follow-up. This ratio contrasts with the $5–$9 saved for each DOE dollar in assessments of small and medium-sized facilities conducted by IAC. While this figure may lead one to believe that there are not as much savings available in the smaller industrial segment, this is not the case. DOE categorizes 6,800 facilities as large, while 220,000 are categorized as small or medium. It is important to understand that large facilities spend six to seven times the DOE dollars per assessment than smaller facilities do ($100,000 vs. $8,000 on average per assessment). In addition, DOE requires that the large facilities at least match the DOE funding with their own funds. The larger facilities therefore
vi

Ripe for the Picking, ACEEE
begin with a significantly larger budget than the smaller plants. The total energy savings at a facility are limited by the facility throughput. Similar improvements implemented in small plants will understandably result in lower dollar savings than in large plants though the percentage improvement will be the same. However, the cost necessary to realize the saving will not be correspondingly smaller. Have We Exhausted the Low-Hanging Fruit in the Industrial Sector? While the U.S. industrial base has changed over the past 30 years, the clue we can take from the data presented is that significant energy efficiency opportunities continue to exist. These opportunities do, however, look different today than did the opportunities at the end of the 1970s. It appears that the opportunities for gross waste elimination may be less than they were 30 years ago. As a result, we see the opportunities shifting to optimization and application of more efficient technologies. Clearly, advanced sensors and computer controls are creating significant opportunities to more precisely meet process needs and to control the process to improve product quality and reduce scrap rates—opportunities that could have barely been imagined in 1980. So perhaps we could say that much of the rotting fruit lying on the ground has been picked up, but opportunities can still be found lying there or falling from the tree. Energy efficiency opportunities are still plentiful at facilities, whether at large or small facilities. Examining the distribution of the recommendation types reveals a shift in where investments are being made. In the IAC database, measures are grouped into three broad categories: combustion systems that include furnaces, ovens, and boilers; thermal systems that include steam, heat recovery, cooling, and drying systems; and motor systems that include motors and compressed air systems. In the 1980-1985 period (see Figure ES-1), combustion systems represented 18% of recommendations, while thermal systems represented 57%, and motor systems represented 25%. In the 2000–2005 period, the recommended efficiency improvements shifted to be 26% combustion systems, 33% thermal systems, and 41% motor systems. The shift in recommendations may embody a number of different phenomena, including changes in opportunities due to changes in technologies, industrial practices, and awareness of opportunities by survey teams and facilities’ staff.
Figure ES-1. Fraction of the Implementation Cost for IAC
Recommendations by Measure Category for 1980-1985 and 2000-2005
0%
10%
20%
30%
40%
50%
60%
combustionsystems
thermalsystems
motor systems
Frac
tion
of Im
plem
enta
tion
C
1980-1985
2000-2005
osts
vii

Ripe for the Picking, ACEEE
With the shift to more sophisticated efficiency measures, the cost of the measures has gone up as is seen by the IAC database with cost per recommendation increasing 2.37 times over 20 years. This increased cost would suggest greater capital investments, which is born out by the examples and the data. The overall level of savings identified in all these examples, however, has remained amazingly constant in spite of the changes in both energy prices and within industry. In spite of average measure cost increases, the opportunities remain highly cost-effective and will become increasingly so if energy prices continue at their recent levels. However, we do appear to have gotten smarter. Looking at the IAC data, we see the savings potential per recommendation is increasing. This trend resulted from several shifts in program direction intended to focus more on the bigger opportunities. First, centers were encouraged to return to their roots and increase assessment focus on energy, away from a combined focus on waste and productivity that was introduced in the mid-1990s. Following this change, the quality of energy recommendations improved. The second shift occurred in late 2004, when the eligibility criteria were revised to include more medium-large plants and plants with higher energy costs (in part due to the rapid increases in energy prices during the early 2000s). This adaptation trend reflects the learning that had occurred over the years of the program, as is also suggested by company examples where the emphasis is shifting to not just eliminating waste but being smarter about energy use by changing processes and products. Conclusions It is frequently argued that the opportunities to improve efficiency in industry have been exhausted, and that the free market dictates that efficiency improvements will be made when they are cost-effective. The data obtained from the IAC database, as well as the broader industrial market data provided by the current and historical MECS, indicate that there still is significant potential for improving energy efficiency in this sector. The IAC program audits consistently are able to find low first cost and cost-effective recommendations for industrial facilities of about the same magnitude. This savings level has not changed significantly during the program’s over 25-year tenure. While the first costs of many efficiency technologies and procedures may have increased since the early 1980s, simple payback periods for these improvements fall well within a very attractive 6–12 month period. This indicates that rapid-payback opportunities still exist in abundance, as do low-hanging fruit, though perhaps in a different form than they had 20 years ago. Does low-hanging fruit still exist in the industrial sector? We believe that the answer is yes.
viii

Ripe for the Picking, ACEEE
INTRODUCTION A recurring theme offered by those opposed to the funding of industrial energy efficiency efforts has been that companies have already realized all the cost-effective industrial energy efficiency opportunities that exist. As can be seen from Figure 1, the energy intensity of U.S. manufacturing did improve dramatically during the late 1970s through the mid-1980s corresponding to a period of significant price increases. Following that period of rapid change, energy intensity stabilized for about a decade corresponding to a period of rapidly falling energy prices before again resuming its decline in the mid-1990s, all be it at a more modest rate.
Figure 1. Industrial Energy Use and Energy Intensity
25
30
35
40
1970
1972
1974
1976
1978
1980
1982
1984
1986
1988
1990
1992
1994
1996
1998
2000
2002
Prim
ary
Ener
gy C
onsu
mpt
ion
(Qua
ds)
3.0
3.5
4.0
4.5
5.0
Ener
gy In
tens
ity (M
MB
tu/1
987$
)
Intensity Consumption
Source: ACEEE from EIA data
If one is to accept the premise that we have used up all our energy efficiency, we must assume several things:
1. All the efficiency practices that were implemented during the previous energy crises continue to be fully implemented today.
2. Technology is static so no new efficiency opportunities have emerged.
3. We have learned nothing new about how to improve productivity or energy efficiency.
4. Energy efficiency opportunities are not affected by price, especially in view of the recent dramatic increases (see EIA 2005a).
1

Ripe for the Picking, ACEEE
We have evidence that these premises are untrue, and from Figure 1 we see energy intensity improving, even during a period of fairly stable energy prices during the 1990s. While the reasons underlying this are complex (ASE 2005), the trend clearly exists. In this study we propose to evaluate how the potential and costs of energy efficiency investments have changed over time, to determine:
1. If the “low-hanging” fruits within the industrial sector available in the 1970s and 1980s were “used up” or left on the vine to rot away, or if they have grown back; and
2. If the pattern of efficiency investments has changed over time such that new and different investment opportunities are now available compared to those available in the 1980s.
This report will explore where the remaining opportunities are in industrial energy efficiency by:
1. Viewing trends in energy consumption and end-use in the industrial sector in the decades of the 1970s and 1980s compared to the 2000s;
2. Looking at how capital investments are being made today versus how they were made in earlier decades;
3. Exploring what opportunities were found in industrial energy assessments in the 1980s and what’s being found today; and
4. Analyzing how the average costs and savings from energy efficiency improvements have changed over the past thirty years.
From these clues, we will show that energy-saving opportunities still exist in industry today, though perhaps their character and relative costs have changed. While we may not have the robust data to be able to determine how much of the efficiency opportunity is attributable to technology, structural change, or learning, we hope to provide clues that lead the reader to share our conclusion that industrial energy efficiency opportunities are fruits born by a healthy, growing tree—ripe for the picking.
BACKGROUND Analyzing energy use and the impacts of energy efficiency in the industrial sector is a significant challenge for the energy modeling community. The industrial sector is more complex and diverse than other sectors of the economy (e.g., residential and commercial buildings) (Elliott et al. 2003), and these analyses have faced more intractable data challenges. The motivations for industrial investment decisions can also be more complex since most energy investment decisions are based on total benefits including non-energy benefits, not just on energy savings alone (Elliott, Laitner, and Pye 1997; Worrell et al. 2003). Most industrial energy projects that are implemented deliver product quality, productivity, safety, or environmental compliance benefits, such as controls that allow for more precise operation of a process resulting in lower defects, or advanced lighting that
2

Ripe for the Picking, ACEEE
improves illumination allowing for easier detection of defects and improved worker safety. As a result, historically, most models have used simplifying assumptions about industrial energy use decision-making, and the impact of those decisions on the overall operation of plants. Most modelers have also approached industrial decision-making at the aggregate level ignoring the plant- and company-level decisions that actually determine investment behavior (Steinmeyer 1998). Standard economic theory aims to define economic and consumer behavior through certain defining laws and principles that require these simplifying assumptions. Unfortunately, at least for the industrial sector, these simplified models often fail to reflect actual energy efficiency opportunities and to predict resulting market investment behavior. Does the Potential Still Exist for Energy Efficiency in Industry? Numerous studies of the U.S. economy have found that significant potential for efficiency improvement exists in all industrial sectors (see Table 1 derived from Nadel, Shipley, and Elliott 2004). These studies have found that abundant, low-cost efficiency opportunities exist in all parts for the industrial sector. Increasingly these studies are applying measure-specific, bottom-up analysis approaches for a regionally-specific set of industries. These savings projections have been corroborated by actual evaluated program results in regions that have implemented robust programs and also at individual companies (see Alcoa sidebar on page 4). Many of these opportunities lie within the manufacturing process (e.g., glass melting or chemical distillation) and so are site specific. As a result, it is frequently difficult to generalize about the characterization of these opportunities.
Table 1. Industrial Energy Efficiency Potential from Recent Studies
Region Reference Year Fuel Study Period Industrial Efficiency Potential Scenario
# Yrs Technical Economic Achievable Electric Efficiency
California XENERGY 2003 2003 Elec. 10 18% 12% 11% Max. efficiency
New York NYSERDA 2003 2003 Elec. 20 21% 18% High
avoidance cost Oregon Ecotope 2003 2003 Elec. 10 35% Puget Sound
Puget Power 2003 2003 Elec. 20 10% Medium costs
Southwest SWEEP 2002 2002 Elec. 17 33%
U.S. Interlab. Working Group 2000 2000 Elec. 20 17% Adv. scenario
Median—Electric 21% 15% 14%
Natural Gas Efficiency Puget Sound
Puget Power 2003 2003 Gas 20 9% Med./high
costs
U.S. Interlab. Working Group 2000 2000 Gas 20 8% Adv. scenario
Median—Gas 9% Note: This table only includes the longest time periods and most aggressive scenarios covered in each study.
3

Ripe for the Picking, ACEEE
Energy Efficiency Opportunities at Alcoa Aluminum is one of the most energy-intensive industries, using energy both to melt and form the metal as well as in the electro-chemical process required to produce the metal. As with many large, energy-intensive manufacturing energy companies, Alcoa has a long history of focusing on reducing energy use in the process to maintain its global competitiveness. Energy efficiency emerged as a key imperative during the late 1980s as the industry entered a period of consolidation. Engineers focused on eliminating waste and gaining better control over their processes through investments in control technologies. As energy prices began to increase in the late 1990s and market competition intensified, corporate energy management began a more systematic process of conducting assessments of energy efficiency opportunities at its facilities. This effort was particularly important at the new facilities that Alcoa took over as a result of acquisitions. Alcoa has found no shortage of efficiency opportunities. It is particularly interesting to look at these opportunities as Alcoa has by grouping them by payback (the time required to recover the costs through energy savings). The opportunities identified in 2003 are presented in Figure 2.
Figure 2. Payback in Years for Identified Energy-Saving Opportunities
$0
$500,000
$1,000,000
$1,500,000
$2,000,000
$2,500,000
$3,000,000
$3,500,000
0 .01 to .49
0.50 to 0 .99
1.00 to 1.49
1.50 to 1.99
2.00 to 2.50
2.50 to2.99
3.00 to 3.49
Ener
gy S
avin
gs
Payback (years) From this presentation of the opportunities, one can see that they fall into two general project groupings: low-cost/no-cost at less than a year and capital projects requiring equipment purchases with a payback of 1.5 to 3.5 years. The order-of-magnitude of these two opportunity groups is about the same—the first done with plant resources while the second requires corporate involvement. Source: Notte (2004)
What can be generalized is that the energy efficiency opportunities can be grouped into two broad categories: low-cost/no-cost measures that involve changes in operating or maintenance practices; and measures that involve capital investments in new equipment. This
4

Ripe for the Picking, ACEEE
concept was presented in the Alcoa sidebar on page 4, which is typical of the experiences of many large companies such as Owens Corning, Inc. (Garforth 2005); 3M (Schultz 2005); DuPont (Bailey 2004). These studies suggest that energy efficiency opportunities continue to exist in the industrial sector. The industrial sector, however, has changed fairly dramatically over the past thirty years. In order to examine the context, we can look at the energy use trends that have taken place during this period. Industry Energy Use in 1970s–1980s The 1970s were characterized by the first of several energy price spikes that have hit energy consumers. These spikes resulted in a dramatic decrease in energy intensity (an increase in efficiency) by the early 1980s as a result of capital improvements made during that time as well as an elimination of energy waste. Between 1972 and 1981, industrial energy use declined by more than 2 quadrillion Btu (Quads) from 25 Quads down to 23 (see Figure 3). What is most interesting about this drop in energy consumption is that if the rate of industrial energy consumption had increased between 1972 and 1981 at the same rate as in the decade between 1960 and 1970, industrial energy use would have approached 40 Quads by 1981 (OTA 1983). This consumption would have been nearly twice what the total industrial energy consumption was more than two decades later in 2002 (about 21.5 Quads) (EIA 2003).
Figure 3. Industrial Energy Use by Fuel Type
0
2,000
4,000
6,000
8,000
10,000
12,000
14,000
1974
1975
1976
1977
1978
1979
1980
1981
1982
1983
1984
1985
1986
1987
1988
1989
1990
1991
1992
1993
1994
1995
1996
1997
1998
Fuel
Con
sum
ptio
n (T
Btu
)
Other
Coke andBreeze
Coal
NaturalGas
ResidualFuel Oil
DistillateFuel Oil
Electricity
Source: EIA 2006a
5

Ripe for the Picking, ACEEE
Efficiency Technologies in the 1980s The 1980s were a period of rapid technological innovation in the industrial sector. Computer control systems were beginning to be adopted widely for the purposes of process control and combustion control. Computerized process control allows a number of variables to be tracked continuously to allow for optimization of a process. While process control is used primarily to optimize production output, it can also be utilized to minimize energy consumption. For example, if a substance in a reactor vessel is known to have an optimal speed of reaction at a particular temperature, a feedback control loop can be used to maintain that temperature automatically. This results in both the reactor times and the heating or cooling energy being optimized. Combustion controls are used to optimize the fuel-to-air ratios in boilers and engines. The benefits of these types of controls include reduction in fuel consumed as well as reduction in air emissions. The 1980s also saw improvements in the designs of waste heat recovery systems such as heat exchangers, vapor recompression, and heat pumps that further optimized energy use. Furthermore, the 1980s saw the impact of the first major energy efficiency legislation. The Public Utilities Regulatory Policy Act of 1978 (PURPA) created a more attractive environment for the installation of large-scale industrial combined heat and power (CHP) (Elliott and Spurr 1999). This act, which was promoted by energy-intensive industrial companies as a strategy to improve efficiency and reduce costs, played a critical role in expanding cogeneration into the marketplace by providing a way for non-utility generators (largely in the industrial sector) to sell excess electricity, while making use of the waste heat in industrial processes. In the 1980s, CHP capacity in the United States grew rapidly. Installed capacity increased from less than 10 Gigawatts electric (GWe) in 1980 to almost 44 GWe by 1993. Most of this capacity was installed at large industrial facilities such as pulp and paper, petroleum, and petrochemical plants—the firms who initially promoted the legislation. Another technological shift that occurred in the late 1970s and early 1980s involved fuel switching. As petroleum prices skyrocketed, there was incentive to switch oil-fired combustion technologies such as boilers and engines to electric technologies (see Figure 3). Since electricity in the U.S. at that time, and even today, is produced largely from the combustion of domestic coal, the price of electricity has remained relatively low in many markets compared to the price of petroleum and natural gas. As a result, we see this cost difference (combined with favorable electric utility tariffs in some markets and non-energy related savings1) encouraging some industrial customers to switch from combustion fuels to electricity (see CHP Working Group 2006). For example, electric resistance unit heaters and heat pumps used for space conditioning became more common, allowing heating to be applied more strategically at the point of requirement and only when required, which reduces the overall energy use. While these electric technologies have very high end-use efficiencies, the primary energy efficiency is very low. Conventional central electric generation is
1 Switching to electricity from a combustion fuel may offer industrial customers a number of benefits including: reduced air emissions permitting challenges as onsite emissions are reduced; insurance benefits when combustion equipment (e.g., boilers) can be retired and associated insurance cost reduced; and labor savings from reduced operator requirements for the electric technologies.
6

Ripe for the Picking, ACEEE
thermally inefficient delivering energy, at an average efficiency of less than 30% when generation and transmission losses are considered (EIA 2005a). Changes in Energy Intensity It is interesting to look at how these changes in energy use affected industry. To track how energy is used in the manufacturing sector, the Energy Information Administration’s (EIA) Manufacturing Energy Consumption Survey (MECS) gathers information from a sample of companies that represent over 250,000 manufacturing establishments. These establishments account for approximately 98% of the U.S. economic output from manufacturing. The first manufacturing survey was conducted for reporting year 1985. Since then, data has been collected for reporting years 1988, 1991, 1993, 1998, and 2002. For the purposes of this study, we used the data obtained from the 2002 Manufacturing Energy Consumption Survey (EIA 2005b). Table 2 presents energy intensities and changes in efficiencies.2 It is important to understand that there are several ways to measure energy efficiency (or energy intensity, the metric most commonly used to represent this). In 1995, EIA explored this with a series of workshops and a report (EIA 1995a). These efforts concluded that energy per physical unit (e.g., pound of steel) was the most representative metric. However, this measure is impractical for most products, which are not sold by weight but rather by unit that changes with time, so energy intensity per unit of value of shipments is frequently used as a proxy (for an extended discussion, see the EIA report). These approaches also do not capture structural changes in the industrial sector (Unruh 2002; ASE 2005), but these can be exceedingly difficult to capture at the industry level. After falling dramatically in the 1970s and early 1980s (see Figure 1), overall efficiency was mixed, on average remaining largely constant during the mid-1980s to mid-1990s, before resuming its decline. According to the MECS data, the largest decreases in energy intensity were in the Furniture and Fixtures group (NAICS 337) and the Industrial Machinery and Equipment group (NAICS 333), which cut their energy use per unit of economic output by 33% and 18%, respectively. Conversely, the Petroleum and Coal Products group (NAICS 324) and the Food and Kindred Products group (NAICS 311) increased in energy intensity by 32% and 17%, respectively.3 In 1994, paper manufacturers required more offsite-produced energy per unit of production output than in any of the three earlier survey years, consuming 4.01 thousand Btus for each constant dollar (1992) value of shipments. This ratio gradually rose from 3.84 in 1985 to 3.88 in 1988, and then to 3.97 in 1991 (EIA 1995b). Between 1985 and 1994, the manufacturing production mix moved toward less energy-intensive industries.
2 The NAICS classification system was adopted in 1997. Prior to this, the SIC classification system was used. The systems cross-reference fairly well at the 3-digit NAICS and 2-digit SIC level. We will be mentioning both the NAICS and SIC systems in report to reflect that much historical data only exists in SIC and a direct “map” is not possible between the two systems. 3 A significant fraction of the energy use in Food and Kindred Products (SIC 20) is attributable to water treatment. Many facilities (especially large ones) have onsite wastewater treatment capabilities that account for a large portion of the onsite energy use. It isn’t known if the increase in energy intensity in the food industry can be accounted for by an increase in onsite wastewater treatment, but that possibility is worth noting. Approximately half of the energy use in the chemicals and Petroleum and Coal Products (in 2002) is attributable to feedstock energy—the energy embodied in the products themselves.
7

Ripe for the Picking, ACEEE
Also, the amount of purchased energy increased, indicating increased vulnerability to fluctuations in electricity and fuel pricing.
Table 2. Energy Intensity in the Manufacturing Sector
Energy Intensity (thousand Btu per 1992 constant $)
Change in Energy Intensity (%)
Major Group 1985 1988 1991 1994 1985–1994 Food: NAICS 311 2.23 2.44 2.33 2.54 -14.1 Textiles: NAICS 313/314 0.53 0.69 0.74 1.27 -141.24 Apparel: NAICS 315 4.07 4.12 4.25 3.92 3.80 Wood Products: NAICS 321 0.47 0.60 0.73 0.39 16.59 Furniture: NAICS 337 2.66 2.29 2.9 2.46 7.55 Paper: NAICS 322 1.18 1.28 1.20 0.96 18.33 Chemicals: NAICS 325 10.84 9.94 12.56 11.91 -9.88 Petroleum Refining: NAICS 324 0.62 0.73 0.77 0.76 -21.44 Stone, Clay, and Glass (non-metallic mineral products): NAICS 327 9.99 9.51 9.69 10.44 -4.52
Primary Metals: NAICS 331 6.79 6.90 7.33 8.74 -28.78 Fabricated Metals: NAICS 332 1.29 1.39 1.34 1.04 19.34 Machinery: NAICS 333 14.46 15.42 16.26 13.89 3.92 Electronic Equipment: NAICS 334 12.58 12.48 12.16 12.44 1.12 All Manufacturing 1.90 2.05 1.98 2.03 -6.69
Source: EIA 2005b Industry Energy Use in 2000s Historical data such as this is quite valuable when trying to predict future energy use. However, since 1994, there has been an important change in the fabric of industry and society as a whole. The increased use of information and control technologies has resulted in an important shift in the way business is done (see Friedman 2005). The past five years have also seen renewed interest in energy as a result of recent increases in prices and price volatility for all energy resources (see Figure 4). In addition to energy used as fuel, we also see increased concerns about energy for non-fuel uses such as manufacturing feedstocks, fertilizer, and agricultural chemicals. These price increases make efficiency measures more attractive. Energy price increases have been compounded by problems with energy commodity markets that have reduced consumers’ opportunities to use futures markets to manage price volatility and uncertainty. Many firms are now willing to focus more attention on maximizing energy efficiency.
8

Ripe for the Picking, ACEEE
Figure 4. Nominal Average Monthly Industrial Energy Prices, 2000–2006
1
3
5
7
9
11
13
15
17
Jan-00
Jul-0
0
Jan-01
Jul-0
1
Jan-02
Jul-0
2
Jan-03
Jul-0
3
Jan-04
Jul-0
4
Jan-05
Jul-0
5
Jan-06
Ener
gy P
rice
($/M
Btu
)
Electricity Fuel Oil Natural Gas Coal
Source: ACEEE from EIA data (2006b) Efficiency Technologies in the 2000s Because of historically low energy prices during much of the 1990s, non-energy benefits were as important, if not more important, than energy savings in determining the market potential of energy-efficient technologies (Elliott, Laitner, and Pye 1997). Energy savings were most often not the determining factor in the decision to develop or invest in an emerging technology. Several studies on emerging energy-efficient industrial technologies have shown that over two-thirds of profiled emerging technologies not only save energy but yield non-energy benefits (Martin et al. 2000; Laitner et al. 2003). These non-energy benefits primarily fall into the environmental and productivity categories. Several cross-cutting technologies have made and continue to make strong progress in the market. Among these, pump and motor system optimization and compressed air systems management have seen large gains and continue to be attractive venues for additional efficiency improvement. Large advances in onsite generation technologies continue as well. Advanced CHP turbines and fuel cells have undergone significant development and while still relatively expensive compared to other generating technologies such as reciprocating engines, are attracting interest in the marketplace because of their attractive environmental profile. Looking to the Future Annual Energy Outlook 2006 (EIA 2005a) indicates that the gross domestic product of the United States is projected to grown at an annual rate of 3% while manufacturing increases at a rate of only 2.1% between 2004 and 2030. Energy consumption in the industrial sector is
9

Ripe for the Picking, ACEEE
expected to increase by only 0.8%. As a result, the overall consumption per unit of economic output—the energy intensity—is expected to decrease by 1.1% per year (see Figure 5).
Figure 5. Projected Industrial Value of Shipments and Intensity, 2003–2030
4
4.5
5
5.5
6
6.5
2003
2004
2005
2006
2007
2008
2009
2010
2011
2012
2013
2014
2015
2016
2017
2018
2019
2020
2021
2022
2023
2024
2025
2026
2027
2028
2029
2030
Inte
nsity
(KB
tu /
2000
$ va
lue
of s
hipm
ents
)
5000
5500
6000
6500
7000
7500
8000
8500
9000
9500
10000
Valu
e of
Shi
pmen
ts (B
illio
n 20
00$)
Energy Intensity
Value of Shipments
Source: ACEEE from EIA (2005a)
As will be shown in Figure 6, the growth in non-energy intensive industries such as electronic equipment is the fastest of all the manufacturing industries. In the past, many government energy efficiency and conservation programs have focused their efforts on the most energy-intensive industries. The rationale behind this focus was that even small increases in efficiency in one of these energy-intensive industries would result in large overall energy savings. While this approach has resulted in marked improvements in efficiency throughout much of industry, some of the less energy-intensive industries have had more limited attention. As our economy switches from manufactured product-based to service-based products, the products that are produced by manufacturers are changing. The energy-intensive manufacturing sectors are projected to grow more slowly than the non-energy-intensive manufacturing sectors. The Annual Energy Outlook 2005 (EIA 2005a) indicated that the five fastest growing industries are electronic equipment, miscellaneous manufactured products, instruments, transportation equipment, and industrial machinery (see Figure 6). Energy-intensive industries such as: paper; stone, clay, and glass; petroleum refining; and primary metals are growing at a much slower pace. The one notable exception is chemicals, which is growing at about the average for all industry mostly because of the rapid growth in pharmaceuticals and specialty chemicals, which all have low energy
10

Ripe for the Picking, ACEEE
intensities. This forecast shows that smaller, less energy-intensive manufacturing will be playing an increasingly important role in the nation’s economy in the future.
Figure 6. Projected Average Annual Change in Value of Shipments, 2003–2025
-3% -2% -1% 0% 1% 2% 3% 4% 5% 6%
Electronic & Electric Equip.
Misc. Manufacturing
Instruments
Transportation Equipment
Industrial Machinery
Rubber & Plastics
Chemicals
Avg all Industry
Fabricated Metal
Stone, Clay, & Glass
Food
Furniture
Petroleum
Paper
Printing
Primary Metals Industry
Beverages & Tobacco
Wood Products
Textiles
Leather
Apparel
Change in Value of Shipments
■ Energy intensive industries
Source: EIA (2005a)
In addition, as will be discussed in the next section, the industrial sector may be poised to enter a period of renewed capital investment that represents an opportunity for increased energy efficiency as new, modern faculties deploy the technologies developed over the past twenty years. CLUES TO LOW-HANGING FRUIT Clearly, industrial energy use has changed significantly over the past three decades and will continue to evolve over the coming decades. Since industry is different today, we would anticipate that the nature of the energy efficiency potential would have changed as well. We will now look at four indicators that provide us with clues about the continuing presence of energy efficiency opportunities and how they have changed over the past thirty years. Industrial Capital-Investment Trends Many industries are capital intensive by nature. These industries, which accomplish the hefty task of converting a raw material into finished product through a variety of chemical and mechanical reactions and processes, include the chemicals, food, petroleum, and pulp and paper industries. Facilities that perform chemical reactions require a larger amount of temperature and pressure control equipment than mechanical facilities due to the specific conditions that are required for many reactions. Other industries, such as electronics,
11

Ripe for the Picking, ACEEE
transportation equipment, and industrial equipment, assemble their products through solely mechanical means. Another measure of an industry’s potential for energy savings is through the examination of the value of new capital expenditures. Industrial energy efficiency improvements can generally be classified into the following categories:
• Equipment replacement (retrofit on failure/or end of economic life) • Improved operation and maintenance practices and procedures • New process or production technology—innovation (for same product) • Changing product line to less energy-intensive products
In the late 1970s, there was a significant increase in capital expenditures resulting in increased energy efficiency (see Table 3). As the economy slowed in the 1980s, capital expenditures slowed, only to surge again in the late 1980s and early 1990s even as real energy prices were falling. High energy prices made many improvements economically viable. The 1990s and early 2000s, on the other hand, saw historically low energy prices. This kind of capital improvement became rarer. The focus instead shifted to increasing productivity. The capital improvements that were made were almost never attributed to increased energy efficiency benefits. Fortunately, many of the opportunities for increasing energy efficiency and decreasing utility bills in the smaller manufacturing facilities are in areas such as motors, lighting, and compressed air systems (Muller 2000). Improving the efficiency of these systems is more straightforward and replicable than it is at large process-intensive industrial plants. For example, the efficiency of a smaller plant’s lighting system can be readily improved by replacing incandescent fixtures with high-efficiency fluorescent fixtures (Martin et al. 2000). This type of improvement does not require special equipment or a shutdown of process lines. However, other types of improvements may be not cost-effective at smaller facilities. For example, improving the energy efficiency of a heat exchanging process may involve removal and replacement of an old and inefficient heat exchanger. An improvement such as this may require installing a custom-sized piece of equipment as well as a shutdown of the process, both of which may be too much of a burden on time and finances for small facilities. The U.S. manufacturing base had developed significant excess capacity by the 1980s as a result of the capital investments driven by the economic expansion of the 1960s and early ‘70s. Beginning in the mid-1980s, we saw a trend toward reduced capital investment as the investment community began to focus on increased return on assets. This resulted in a period of consolidations within industries that has continued until recently. As an example, Figure 7 presents steel casting production versus available capacity. As you will note, utilization of capacity approaches 100% as we reach the end of the 1990s. Similar consolidation trends are show for U.S. steel, aluminum, paper, automotive, and petroleum refining industries, as excess capacity is retired and productive capacity is brought into line with demand.
12

Ripe for the Picking, ACEEE
Table 3. Capital Expenditures by Year and Industry Type (1972–1985)
Total Capital Expenditures (million 1996$) Year
SIC Industry 72 77 81 85 89 93 96 Ann
ual
Gro
wth
(1
972-
1985
)
Ann
ual
Gro
wth
(1
985-
1996
)
Ann
ual
Gro
wth
(1
972-
1996
)
20 Food 7,295 9,190 8,881 7,731 10,538 10,194 11,717 7.7% 4.7% 2.5% 21 Tobacco Products 499 469 1,153 976 505 421 649 12.4% -3.0% 1.2% 22 Textile Mill 4,231 3,182 2,958 2,706 2,881 2,660 2,666 3.8% -0.1% -1.5% 23 Apparel 1,029 814 742 665 1,049 1,044 964 3.9% 4.1% -0.3% 24 Lumber & Wood 3,041 3,661 2,737 2,108 2,472 2,118 3,305 4.5% 5.2% 0.4% 25 Furniture 1,149 1,005 989 1,113 1,247 1,056 1,252 7.0% 1.1% 0.4% 26 Paper 4,243 7,628 8,003 8,001 12,737 7,995 9,302 12.2% 1.5% 5.0% 27 Printing 3,282 3,324 4,554 6,090 7,289 5,291 5,912 12.0% -0.3% 3.3% 28 Chemicals 7,062 12,528 10,588 8,838 17,055 17,022 20,041 9.0% 11.5% 7.7% 29 Petroleum & Coal 338 358 335 474 4,214 6,844 5,572 9.9% 97.8% 64.5%30 Rubber & Plastics 1,280 1,042 816 1,023 5,786 5,423 7,022 5.5% 53.3% 18.7%31 Leather 278 249 345 150 154 142 128 2.5% -1.4% -2.3% 32 Stone, Clay, & Glass 4,393 4,755 4,348 3,752 3,637 2,624 4,157 6.1% 1.0% -0.2% 33 Primary Metals 7,836 10,701 10,155 6,446 7,157 5,131 7,299 5.8% 1.2% -0.3% 34 Fabricated Metals 4,641 6,231 7,280 5,889 5,836 5,333 6,874 9.1% 1.5% 2.0% 35 Industrial Machinery 4,934 7,558 8,705 5,339 10,187 8,610 11,451 7.9% 10.4% 5.5% 36 Electronics 2,812 4,190 5,869 7,595 10,962 10,841 20,867 14.9% 15.9% 26.8%37 Transport. Equipment 9,807 12,103 18,627 15,138 12,610 12,386 13,498 10.6% -1.0% 1.6% 38 Instruments 21,244 2,016 2,952 3,066 5,601 4,811 5,274 -7.6% 6.5% -3.1% 39 Misc. Manufacturing 1,190 1,226 1,058 973 1,044 1,013 1,373 5.7% 3.7% 0.6%
Total 90,584 92,229 101,094 88,069 122,962 110,958 139,323 -0.2% 5.3% 2.2%
Source: Census (Various)
Figure 7. Steel Casting Capacity versus Actual Annual Production
0
500
1000
1500
2000
2500
3000
1970 1975 1980 1985 1990 1995 2000 2005 2010
Year
Thou
sand
Ton
s
Actual Production Capacity
Source: Monroe (2005) As would be expected, the least efficient capacity is retired and the most efficient retained, resulting in significant increases in efficiencies. This phenomenon could in part explain the return to declining intensity seen in Figure 1 beginning in the mid-1990s. In addition, during
13

Ripe for the Picking, ACEEE
a period of consolidation, firms will direct their limited capital to the most productive facilities that will continue to operate in the long run (Steinmeyer 1998). Industrial Assessment Centers—Efficiency Trends in Small & Medium-Sized Industries Many of these studies have shown that in percentage terms, some of the least energy-intensive industries have the greatest potential. In part this is because energy represents a small fraction of total operating costs so energy is not generally a focus of management. As a result, these facilities usually do not have the dedicated technical staff to identify and implement energy efficiency projects. While it is worth noting that small and medium-sized plants exist in all industries (both energy-intensive and non-energy-intensive), the least energy-intensive industries tend to be disproportionately represented in small and medium-sized manufacturing than do the more energy-intensive industries (Shipley, Elliott, and Hinge 2002). Because these smaller facilities are more numerous, it can be somewhat easier to discern trends about energy efficiency opportunities across similar facilities. In particular, an important data source exists for smaller facilities. The DOE’s Industrial Assessment Centers program supplies a robust industrial data set available spanning from the late 1970s to the present. In this section, we will focus on small and medium-sized industrial facilities that are not part of a large corporation that provides dedicated corporate energy management staff. However, experiences with major corporations indicate that similar potentials exist, though perhaps the opportunities may be of a somewhat different character (see previous Alcoa sidebar). DOE’s Industrial Technologies Program has supported the Industrial Assessment Centers (IAC) program since 1978 (this program began as the Energy Analysis and Diagnostic Centers Program, which was originally initiated at the Department of Commerce but changed names in 1994). In the IAC program, direct, one-to-one contact with industrial end-users and plant site managers significantly increases the adoption of commercially available and emerging energy-efficient technologies. In addition to traditional energy streams, IAC targets waste streams and productivity improvements. The program is focused on preparing energy and waste audits of small to medium-sized manufacturing facilities (DOE 2006). IAC is implemented through 26 schools. Currently, to be eligible for an IAC assessment, a manufacturing plant must meet the following criteria:
1. Be within Standard Industrial Codes (SIC) 20–39. 2. Be within 150 miles of a host campus. 3. Have gross annual sales below $100 million. 4. Have fewer than 500 employees at the plant site. 5. Have annual energy bills more than $100,000 and less than $2.5 million. 6. Have no professional in-house staff to perform the assessment.
A university professor leads a team on a one-day site visit at an industrial plant. Prior to the site visit, pertinent information regarding the facility is gathered through telephone interviews, e-mail, and fax. The products of the facility, wastes, and material flow diagrams
14
Ripe for the Picking, ACEEE
are obtained prior to the site visit. The site visit includes discussions with plant managers, plant tours, and measurements of operational parameters. Following the site visit, the assessment team prepares a written report for the manufacturer, which includes information about the plant’s energy use, processes, and waste handling. The report contains specific recommendations that include sufficient engineering design to provide anticipated savings, implementation costs, and simple payback. After approximately 6 to 9 months, IAC contacts the manufacturer to gather information on the level of implementation of the recommendations. DOE’s recent solicitation for centers (DOE-Golden 2005) indicated that IAC participating manufacturers achieve on average $30,000 annually in energy savings and $30,000 in waste and productivity savings, totaling $60,000 per assessment. This savings does not include replication and long-term implementation benefits, which would add an additional $15,000 to the average savings. During the period of 1998 through 2005, the program has provided anywhere from 650 to 900 assessments per year, depending on its budget. All of the findings of the IAC assessments are compiled into a centralized database maintained at Rutgers University. This database of plant and related assessment information (individual plants are not identified in keeping with program policies) records the actual results of approximately 13,000 assessments, with over 96,000 specific recommendations, conducted by the program since 1980.4 Overall, a little more than half of the improvements suggested through the IAC program have been adopted by industrial users. According to the database, about half of the measures that cost less than $1,000 have been adopted, while only a third of the measures over $10,000 have been installed (Hopkins and Jones 1995). The average cost per recommendation (for all recommendations) is $12,316, and the average cost per actual implemented recommendation is $7,349 (Muller 2000). The typical payback period is 6–12 months, and the median return is about $6,000 (Muller 2000). The IAC program averages $5–9 of energy savings directly from assessment alone, per program dollar. Table 4 shows what the costs and measure savings by fuel type were for measures recommended during IAC audits in both 1983 and 2003 dollars. While there appear to be abundant low cost (and short payback) opportunities during both eras, the median simple payback and median ratio of installed cost to annual savings during the early 2000s are about 1.5 that of the early 1980s. There are several possible reasons for why this could be, including a significant evolution of technology and improved equipment standards. These are discussed in more detail in the following section.
4 The IAC database can be accessed at the Rutgers University Web site: http://iac.rutgers.edu.
15

Ripe for the Picking, ACEEE
Table 4. Annual Energy and Cost Savings for IAC Program 1980-1985 2000-2005
Prim
ary
Res
ourc
e
Med
ian
Impl
emen
tatio
n C
ost
per
Rec
omm
enda
tion
in 1
983$
(200
3$)
Med
ian
Ann
ual
Ene
rgy
Con
serv
ed
per
Rec
omm
enda
tion
(MM
Btu
)
Med
ian
Ann
ual C
ost
Savi
ngs
per
Rec
omm
enda
tion
in 1
983$
(200
3$)
Cos
t Ben
efit
Rat
io
Med
ian
Impl
emen
tatio
n C
ost
per
Rec
omm
enda
tion
in 2
003$
Med
ian
Ann
ual
Ene
rgy
Con
serv
ed
per
Rec
omm
enda
tion
(MM
Btu
)
Med
ian
Ann
ual C
ost
Savi
ngs
per
Rec
omm
enda
tion
in 2
003$
Cos
t Ben
efit
Rat
io
Electric $400 ($216) 59 $1,319
($714) 6.78 $600 95 $1,369 6.32
Natural Gas
$400 ($216) 323 $1,514
($819) 1.24 $1,400 468 $3,737 2.99
LPG $3,000 ($1,623) 428 $3,368
($1,822) 7.01 $975 238 $2,182 4.10
Fuel Oil (#2)
$528 ($286) 161 $1,360
($736) 3.28 $698 316 $2,709 2.21
Coal $40,000 ($21,640) 33,213 $65,300
($35,327) 1.20 $3,500 2,480 $7,570 1.41
Median All Fuels
$400 ($216) 125 $1,418
($765) 3.20 $768 136 $1,800 5.65
Median Simple Payback
0.28 years (3.4 months) 0.43 years (5.2 months)
Sources: Muller 2000; Rutgers 2005 Examining the distribution of the recommendation types reveals a shift in where investments are being made. In 1980–1985 (see Table 5), combustion systems represented 18% of the three major recommendation types, thermal systems represented 57%, and motor systems represented 25%. In the IAC database, combustion systems include furnaces, ovens, and boilers. Thermal systems include steam, heat recovery, cooling, and drying systems. Motor systems include motors and compressed air systems. In 2000–2005 (see Table 6), the recommended efficiency improvements shifted to be 26% combustion systems, 33% thermal systems, and 41% motor systems.
16

Ripe for the Picking, ACEEE
Table 5. Median Costs and Savings of IAC Recommendations by Type, 1980–1985
Combustion Systems Thermal Systems Motor Systems
Prim
ary
Res
ourc
e
Med
ian
Impl
emen
tatio
n C
ost p
er
Rec
omm
enda
tion
in
1983
$ (2
003$
)
Med
ian
Ann
ual E
nerg
y C
onse
rved
per
R
ecom
men
datio
n (M
MB
tu)
Med
ian
Impl
emen
tatio
n C
ost p
er
Rec
omm
enda
tion
in
1983
$ (2
003$
)
Med
ian
Ann
ual E
nerg
y C
onse
rved
per
R
ecom
men
datio
n (M
MB
tu)
Med
ian
Impl
emen
tatio
n C
ost p
er
Rec
omm
enda
tion
in
1983
$ (2
003$
)
Med
ian
Ann
ual E
nerg
y C
onse
rved
per
R
ecom
men
datio
n (M
MB
tu)
Electric (kWh) 192 N/A 161 Natural Gas 0.63 383 764 LPG N/A N/A 527 Fuel Oil (#2) N/A 94 79 Coal N/A 69,045 33,213 Median All Fuels
$800 ($433)
186
$300 ($162)
375
$2,600 ($1,407)
751 Percent Total Recommendations 18% 57% 25%
Simple Payback by Recommendation Type (years)
0.86 (10.3 months) 0.16 (1.9 months) 0.81 (9.7months)
Sources: Muller 2000; Rutgers 2005
Table 6. Median Costs and Savings of IAC Recommendations by Type, 2000–2005
Electric (kWh) 511 74 287 Natural Gas 844 1,009 1,069
LPG 8,202 N/A 1,654 Fuel Oil (#2) 3,451 724 1,024
Coal 7,495 2,130 13,710 Median All Fuels
$1,025
923
$1,000
1,009
$6,000
1,046 Percent Total
Recommendations 26% 33% 41%
Simple Payback Recommendation
Type (years) 0.14 (1.7 months) 0.25 (3 months) 1.06 (12.7 months)
Combustion Systems Thermal Systems Motor Systems
Prim
ary
Res
ourc
e
Med
ian
Impl
emen
tatio
n C
ost
per
Rec
omm
enda
tion
in 2
003$
Med
ian
Ann
ual
Ene
rgy
Con
serv
ed
per
Rec
omm
enda
tion
(MM
Btu
)
Med
ian
Impl
emen
tatio
n C
ost
per
Rec
omm
enda
tion
in 2
003$
Med
ian
Ann
ual
Ene
rgy
Con
serv
ed
per
Rec
omm
enda
tion
(MM
Btu
)
Med
ian
Impl
emen
tatio
n C
ost
per
Rec
omm
enda
tion
in 2
003$
Med
ian
Ann
ual
Ene
rgy
Con
serv
ed
per
Rec
omm
enda
tion
(MM
Btu
)
Sources: Muller 2000; Rutgers 2005
17
Ripe for the Picking, ACEEE
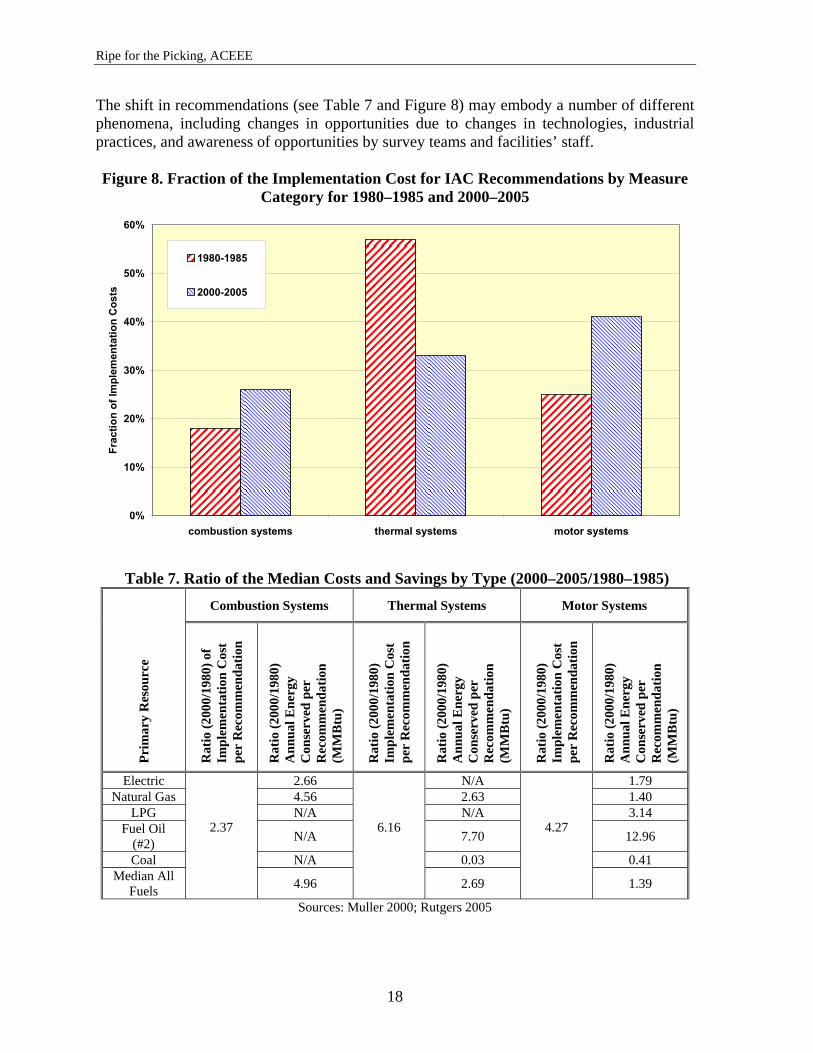
The shift in recommendations (see Table 7 and Figure 8) may embody a number of different phenomena, including changes in opportunities due to changes in technologies, industrial practices, and awareness of opportunities by survey teams and facilities’ staff. Figure 8. Fraction of the Implementation Cost for IAC Recommendations by Measure
Category for 1980–1985 and 2000–2005
0%
10%
20%
30%
40%
50%
60%
combustion systems thermal systems motor systems
Frac
tion
of Im
plem
enta
tion
Cos
ts
1980-1985
2000-2005
Table 7. Ratio of the Median Costs and Savings by Type (2000–2005/1980–1985)
Combustion Systems Thermal Systems Motor Systems
Prim
ary
Res
ourc
e
Rat
io (2
000/
1980
) of
Impl
emen
tatio
n C
ost
per
Rec
omm
enda
tion
Rat
io (2
000/
1980
) A
nnua
l Ene
rgy
Con
serv
ed p
er
Rec
omm
enda
tion
(MM
Btu
)
Rat
io (2
000/
1980
) Im
plem
enta
tion
Cos
t pe
r R
ecom
men
datio
n
Rat
io (2
000/
1980
) A
nnua
l Ene
rgy
Con
serv
ed p
er
Rec
omm
enda
tion
(MM
Btu
)
Rat
io (2
000/
1980
) Im
plem
enta
tion
Cos
t pe
r R
ecom
men
datio
n
Rat
io (2
000/
1980
) A
nnua
l Ene
rgy
Con
serv
ed p
er
Rec
omm
enda
tion
(MM
Btu
)
Electric 2.66 N/A 1.79 Natural Gas 4.56 2.63 1.40
LPG N/A N/A 3.14 Fuel Oil
(#2) N/A 7.70 12.96
Coal N/A 0.03 0.41 Median All
Fuels
2.37
4.96
6.16
2.69
4.27
1.39
Sources: Muller 2000; Rutgers 2005
18

Ripe for the Picking, ACEEE
Thermal systems are currently and have historically been the place where the lowest first cost measures are identified. Measures such as steam trap maintenance and insulation are very inexpensive and typically deliver a very attractive payback. Thermal systems have also increased the most on a first-cost basis of the three measure types studied. This trend may indicate that the grossest inefficiencies in thermal systems have been rectified in the 20-year period of study. The simple payback period for these types of systems remains extremely attractive, having increased from 1.9 months to only 3 months. This indicates that although the first cost of the systems has increased faster than the rate of inflation, the performance of the systems has exceeded that as well. The fruit still hangs low. Combustion systems costs have also increased on a first cost basis, but simple paybacks of these systems has improved dramatically, from 10.3 months to 1.7 months. This may be attributable to improvements in boiler technologies and standards—increasing the first cost but also dramatically improving performance. Motor systems experienced a fairly large increase in first cost but only a moderate increase in simple payback, to just over 1 year from 9.7 months. Changes in motor systems are described in more detail in the following section. Motors Example—How Energy Prices, Technology Development, and Standards Affect Efficiency Motors that have a range of efficiencies have always been available in the marketplace. From the mid-1950s until the mid-1970s (a period of inexpensive energy), installed motor efficiency declined as manufacturers built relatively inefficient motors. Unlike their predecessors, these motors were designed with a focus on lower initial costs and used more energy because of their poor design. Less efficient and more compact motors were made possible by the development of insulation material that could withstand higher temperatures (less efficient motors tend to release more heat than efficient motors). Insulation materials in motors developed in the 1970s could tolerate much higher operating temperatures than motors built in the 1940s and 1950s. It was thus possible to design motors that could accommodate higher losses without damaging the insulation and motor lifetime. By the mid-1970s when energy prices began escalating rapidly, manufacturers began to introduce lines of energy-efficient motors in addition to their standard-efficiency models. In the late 1970s and early 1980s, the National Electrical Manufacturers Association (NEMA) established a labeling program for the most common types and sizes of motors. Under this program, minimum-efficiency ratings for a motor are listed on its nameplate. NEMA developed testing procedures to establish a motor’s rated efficiency. In 1989, NEMA first developed and adopted energy-efficient performance values in its standards. The performance standards were strengthened in 1991 to help guide the development of new high-efficiency products. In 1992, Congress passed the Energy Policy Act (EPAct), which set minimum-efficiency levels for industrial motors. This legislation opened the door for a large volume of newly qualifying products to enter the marketplace. Additionally, most manufacturers now offer motors that significantly exceed the EPAct minimum-efficiency levels (Nadel et al. 2002).
19
Ripe for the Picking, ACEEE
When we look more closely at the IAC data with respect to motor systems in Table 5 and Table 6, we see that the median implemented cost of motors system improvements in the 2000s is 4.7 times the cost in the 1980s, while the annual energy conserved is only 1.39 times that of the 1980s. This does not mean that the low-hanging fruit in motors systems is gone. This simply means that the opportunities are different today than they were 20 years ago. Whereas 20 years ago, an inexpensive motor may have been available to provide improvement over an inefficient model, today the least expensive opportunity may be to look into how in-house motor systems are maintained. While the capital equipment today may cost more because of technical improvements in performance, materials, and standards, there still exist opportunities to inexpensively improve energy performance. It is worth noting that even though efficiency opportunities may cost slightly more in real terms than they did 20 years ago, in absolute terms, these investments are still very inexpensive and offer fantastic paybacks. The median payback of 5.2 months in the most recent IAC data may be greater than the 1980s value of 3.4 months, but any payback period of less than 12 months is typically considered very attractive for industrial energy efficiency investments. Many would consider simple paybacks below 6 months to constitute low-hanging fruit. Results from DOE’s Industrial Best Practices Program Another measure of the savings potential of small-, medium- and large-sized industrial facilities is available in the data from DOE’s various industrial assessment programs. DOE’s Industrial Best Practices program collects information on the results brought forth by plant-wide industrial assessments of large manufacturing facilities. Data collected from five large facilities reveal that the ratio of annual savings recommendations to DOE funds equals 47. In other words, for every dollar invested by DOE, the plants reaped $47 in recommended annual savings including replication at other facilities and long-term follow-up (ACEEE 2001). This ratio contrasts with the $5–9 saved for each DOE dollar in assessments of small and medium-sized facilities conducted by IAC. While this figure may lead one to believe that there are not as much savings available in the smaller industrial segment, this is not the case. DOE categorizes 6,800 facilities as large, while 220,000 are categorized as small or medium. It is important to understand that large facilities spend six to seven times the DOE dollars per assessment than smaller facilities do ($100,000 vs. $8,000 on average per assessment) (ACEEE 2001). DOE requires that the large facilities also at least match the DOE funding with their own funds. The larger facilities therefore begin with a significantly larger budget than the small plants. The total energy savings at a facility are limited by the facility throughput. Similar improvements implemented in small plants will understandably result in lower dollar savings than in large plants though the percentage improvement will be the same. However, the cost necessary to realize the savings will not be correspondingly smaller. The important point to take away from this discussion is that there is still a very good ratio of annual savings to investment dollars that can be achieved in all industrial facilities. The opportunity in small and medium-sized facilities should not be overlooked simply because side-by-side comparisons to the large facilities may not look as impressive in absolute terms.
20
Ripe for the Picking, ACEEE
Keep in mind that 80% of all industrial facilities have an average of 250 employees or fewer and that even these more moderate savings figures can result in remarkably large savings potential. Have We Exhausted the Low-Hanging Fruit in the Industrial Sector? While the U.S. industrial base has changed over the past 30 years, the clue we can take from the data presented is that significant energy efficiency opportunities continue to exist. These opportunities do, however, look different today than did the opportunities at the end of the 1970s. It appears that the opportunities for gross waste elimination may be less than they were 30 years ago. As a result, we see the opportunities shifting to optimization and application of more efficient technologies, as is seen from the increased shift in the DuPont case study presented in the sidebar on page 22. Clearly, advanced sensors and computer controls are creating significant opportunities to more precisely meet process needs and to control the process to improve product quality and reduce scrap rates—opportunities that could have barely been imagined in 1980. So perhaps we could say that much of the rotting fruit lying on the ground has been picked up, but as the Alcoa example demonstrates, opportunities can still be found lying there or falling from the tree. Energy efficiency opportunities are still plentiful at facilities, whether large as the Alcoa and DuPont examples show or at smaller facilities served by the IAC program. With the shift to more sophisticated efficiency measures, the cost of the measures has gone up, as is seen in the IAC database with cost per recommendation increasing 2.37 times over 20 years. This increased cost would suggest greater capital investments, which is born out by the examples and the data. The overall level of savings identified in all these examples, however, has remained amazingly constant in spite of the changes both in energy prices and within industry. In spite of average measure cost increases, the opportunities remain highly cost-effective and will become increasingly so if energy prices continue at their recent levels. However, we do appear to have gotten smarter. Looking at the IAC data, we see the savings potential per recommendation is increasing. This trend resulted from several shifts in program direction intended to focus more on the bigger opportunities. First, centers were encouraged to return to their roots and increase assessment focus on energy, away from a combined focus on waste and productivity that was introduced in the mid-1990s. Following this change, the quality of energy recommendations improved. The second shift occurred in late 2004, when the eligibility criteria were revised to include more medium-large plants and plants with higher energy costs (in part due to the rapid increases in energy prices during the early 2000s). This adaptation trend reflects the learning that had occurred over the years of the program (Martin 2006), as is also suggested by the DuPont example where the emphasis is shifting to not just eliminating waste but being smarter about energy use by changing processes and products.
21

Ripe for the Picking, ACEEE
Energy Efficiency at DuPont Like Alcoa, DuPont has paid close attention to its energy use over the past fifteen years.The company has committed to holding energy constant at 1990 levels through 2010, while growing production. By 2000, they had achieved over 83 trillion Btus of savings for a net savings of $1.5 billion in operating costs, in spite of declining energy prices. This savings translates to $0.30 in increased earnings per share relative to 1990 intensity levels.With the increases in energy prices over the past few years, the benefits of these past savings have multiplied. DuPont’s motivation comes not only from cost savings, but also a corporate goal to reduce its “environmental footprint”—the aggregate impact of the company’s activities on the environment. It feels that environmental sustainability is a prerequisite for future economic prosperity. Over the past few years, it has continued to pursue efficiency. By 2004, DuPont had actually reduced energy consumption by 9% relative to 1990, with a net savings to the company of over $2 billion. They achieved these savings through:
• Gains in process yields, plant capacity, and plant utilization resulting from a focus on capital productivity;
• Installing CHP and powerhouse modernization; • Shifting from low-value, energy-intensive products; and • Investments in process and equipment changes.
For the future, they will continue to focus on these areas, with additional attention to:
• Process instrumentation, control, and experts systems; • Modern insulation, steam traps, and motors; and • Topping cycles, waste heat recovery, and pressure-reducing generators.
In spite of its achievements over the past fifteen years, DuPont remains confident that itcan continue to grow production while holding energy use constant. Efficiency opportunities are not diminishing—it just may take a little more effort and creativity to keep implementing them. Source: Carberry 2005.
As noted above, much of the U.S. manufacturing base is now operating at near full capacity as a result of a period of consolidation, particularly for energy-intensive material manufacturing industries. With demand now beginning to exceed capacity, U.S. industry may be poised on the verge of a new period of major capital investment sparked by the need to expand to meet growing market demand for its products. This shift, if it occurs broadly, would usher in a period in which new technologies are rapidly introduced into manufacturing, representing a once-in-a-generation opportunity to build greater energy
22

Ripe for the Picking, ACEEE
efficiency into the manufacturing base. The ability to implement these opportunities, however, is contingent upon a trained work force being available to realize the full range of opportunities (see Friedman 2005). The educated alumni of programs such as IAC offer the added benefit of creating an aware workforce that is prepared to implement these energy efficiency opportunities in the new manufacturing factories of the future while realizing benefits in today’s facilities (Martin, Tonn, and Schmoyer 1999). Based on these trends, we argue that there are still lots of efficiency fruit, and because its character is shifting with time, we are continuing to see new fruit grow. Perhaps we can’t rely only on scooping it up off the ground any more, but the reach is not too high. Technology advances, learning-by-doing, and the motivations of higher energy prices provide us with “taller ladders” to reach the fruit. WHAT FUTURE WORK IS NEEDED? The industrial sector is perhaps the most complicated energy-using sector of the U.S. economy and continues to be the largest. However, far less attention and resources are directed to its data collection and analysis than to any other sector (perhaps save agriculture—see Brown and Elliott 2005). In recent years, the MECS sample size has continually declined, and the range of data collected has shrunk. In addition, budget pressures have forced significant cuts in the survey’s budget. During the late 1990s, North America shifted from the SIC system over to NAICS. This shift attempted to harmonize data across the U.S., Canada, and Mexico. However, it created a discontinuity in the time-series data that makes analyses such as this one more difficult. The data could be reclassified to allow better trends analysis; however, funding is unavailable at EIA and the Bureau of the Census to undertake this task, especially when sufficient funds are not available to keep up with current data collection. It would be ideal to expand the sample size so that more data could be reported at the regional and state level. Significant regional variations exist in the industrial sector, as is discussed in Elliott et al. (2003). These reductions in funding are likely to make things worse and not better in the future, though analysts at the federal agencies should be commended for putting out as much work product as they do with what meager resources they are provided. In addition, the industrial energy analysis and modeling community needs to be expanded. Only a few academic institutions currently focus on industrial energy analysis, and declines in federal funding are eroding support for manufacturing programs at universities, while also resulting in the loss of industry funding for the academic research programs as federal matching funds decline. At the same time, the federal funding cuts are also shrinking the industrial analyst community at the national labs. It is critical to find a way to expand this small community so more diverse and creative research can increase our understanding. While the urgency of global competition and soaring energy prices is creating interest in academic circles, without a funding base it will become increasingly difficult to maintain the existing base of analysts, much less to expand it.
23

Ripe for the Picking, ACEEE
CONCLUSIONS It is frequently argued that the opportunities to improve efficiency in industry have been exhausted, and that the free market dictates that efficiency improvements will be made when they are cost-effective. The data obtained from the IAC database, as well as the broader industrial market data provided by the current and historical MECS, indicate that there still is significant potential for improving energy efficiency in this sector. The IAC program audits consistently are able to find low first cost and cost-effective recommendations for industrial facilities of about the same magnitude. This savings level has not changed significantly during the program’s over 25-year tenure. While the first costs of many efficiency technologies and procedures may have increased since the early 1980s, simple payback periods for these improvements fall well within a very attractive 6–12 month period. This indicates that rapid-payback opportunities still exist in abundance, as do low-hanging fruit, though perhaps in a different form than they had 20 years ago. We are beginning to see some structural shifts in the industrial sector due to a now almost 5-year trend of increasing energy prices. The typical response to such changes in the past has been to fuel switch or rely on long-term fuel price contracts. Those options are now dying off as fuel prices across all markets (coal, electricity, petroleum, and natural gas) are all nearing or at historical inflation-adjusted highs. One of the primary ways industry can respond effectively to these market changes is by increasing the efficiency of their technologies and systems. New production faculties and new product lines will continue to be developed in the industrial sector and with them renewed opportunities for more efficient energy use. We expect that the energy intensity within the sector will continue to improve with time, and that recent price pressures on oil and natural gas markets will provide additional motivation to undertake these improvements. Does low-hanging fruit still exist in the industrial sector? We believe that the answer is yes.
24

Ripe for the Picking, ACEEE
REFERENCES [ACEEE] American Council for an Energy-Efficient Economy. 2001. Policy Brief: Analysis
of Impacts of OIT’s Industrial Best Practices Program. Washington, D.C.: American Council for an Energy-Efficient Economy.
[ASE] Alliance to Save Energy. 2005. Efficiency and Innovation in U.S. Manufacturing
Energy Use. http://www.ase.org/uploaded_files/industrial/NAM.pdf. Washington, D.C.: National Association of Manufacturers.
Bailey, W.F. 2004. Transforming Energy Use in the “New” DuPont. Presented at the
Hydraulic Institute Winter Meeting, February. Brown, E. and R.N. Elliott. 2005. On-Farm Energy Use Characterizations.
http://aceee.org/pubs/ie052full.pdf. Washington, D.C.: American Council for an Energy-Efficient Economy.
Carberry, J. 2005. “Driving Energy Efficiency.” http://aceee.org/conf/mt05/i3_carb.pdf.
Presented at the 2005 National Symposium on Market Transformation, Washington, D.C.
[Census] Bureau of the Census. Various. Annual Survey of Manufacturing. Washington,
D.C.: Department of Commerce. CHP Working Group. 2006. Meeting summary for the CHP Analysis Working Group
meeting of April 6. http://aceee.org/chp/analysis.htm. Washington, D.C.: American Council for an Energy-Efficient Economy.
[DOE] U.S. Department of Energy. 2006. Industrial Assessment Center web site.
http://www1.eere.energy.gov/industry/bestpractices/iacs.html. Washington, D.C.: U.S. Department of Energy.
[DOE-Golden] U.S. Department of Energy, Golden Field Office. 2005. “Funding
Opportunity Title: Industrial Assessment Center Program.” http://e-center.doe.gov/iips/faopor.nsf/8373d2fc6d83b66685256452007963f5/ef9f07fccc4b6f4d8525703e006d1794?OpenDocument. Golden, Colo.: U.S. Department of Energy.
Ecotope, Inc. 2003. Energy Efficiency and Conservation Measure Resource Assessment for
the Residential, Commercial, Industrial and Agricultural Sectors. Prepared for the Energy Trust of Oregon, Inc. Seattle, Wash.: Ecotope, Inc.
[EIA] Energy Information Administration. 1995a. Measuring Energy Efficiency in the United
States' Economy: A Beginning. Part of the EIA Energy Consumption Series. DOE/EIA-0555(95)/2. http://tonto.eia.doe.gov/ftproot/consumption/0555952.pdf. Washington, D.C.: U.S. Department of Energy.
25

Ripe for the Picking, ACEEE
___________. 1995b. Changes in Energy Intensity in the Manufacturing Sector 1985–1991. DOE/EIA-0552(85-91). http://www.eia.doe.gov/emeu/mecs/mecs91/intensity/mecs2g.html. Washington, D.C.: U.S. Department of Energy.
___________. 2003. Annual Energy Review 2002.
http://tonto.eia.doe.gov/FTPROOT/multifuel/038402.pdf. Washington, D.C.: U.S. Department of Energy.
___________. 2005a. 2006 Annual Energy Outlook. Washington, D.C.: U.S. Department of
Energy. ___________. 2005b. 2002 Manufacturing Energy Consumption Survey. Washington, D.C.:
U.S. Department of Energy. ___________. 2006a. Personal communication to Susanne Brooks by Brian Unruh.
Washington, D.C.: U.S. Department of Energy. ___________. 2006b. Energy price data from EIA web site. http://www.eia.doe.gov.
Washington, D.C.: U.S. Department of Energy. Elliott, R.N., S. Laitner and M. Pye. 1997. “Considerations in the Estimation of Costs and
Benefits of Industrial Energy Efficiency Projects.” In the Proceedings of the 32nd Intersociety Energy Conversion Engineering Conference, paper 97–551. New York, N.Y.: American Institute of Chemical Engineers.
Elliott, R.N., A.M. Shipley, E. Brown, R. Cleetus, and S. Bernow. 2003. “State-Level
Analysis of Industrial Energy Use.” In the Proceedings of the 2003 ACEEE Summer Study on Energy Efficiency in Industry. Washington, D.C.: American Council for an Energy-Efficient Economy.
Elliott, R.N. and M. Spurr. 1999. Combined Heat and Power: Capturing Wasted Energy.
Washington, D.C.: American Council for an Energy-Efficient Economy. Friedman, T.L. 2005. The Earth Is Flat: A Brief History of the Twenty-First Century. New
York, N.Y.: Farrar, Straus and Giroux.
Garforth, P. 2005. Presentation at the 2005 IETC Energy Managers’ Workshop. College Station, Tex.: Texas A&M University Energy Systems Laboratory.
Hopkins, M. and T. Jones. 1995. Getting in Gear: How Energy Efficiency Can Help Smaller
Manufacturers Compete in the Global Marketplace. Washington, D.C.: Alliance to Save Energy.
Interlaboratory Working Group. 2000. Scenarios for a Clean Energy Future. ORNL/CON-
476, LBNL-44029, and NREL-TP-620-29379. Oak Ridge, Tenn.: Oak Ridge National Laboratory, Berkeley, Calif.: Lawrence Berkeley National Laboratory, and Golden, Colo.: National Renewable Energy Laboratory.
26

Ripe for the Picking, ACEEE
Laitner, J.A., E. Worrell, C. Galitsky, and D.A. Hanson. 2003. "Characterizing Emerging Industrial Technologies in Energy Models." In the Proceedings of the 2003 ACEEE Summer Study on Energy Efficiency in Industry. Washington, D.C.: American Council for an Energy-Efficient Economy.
Martin, M. (Oak Ridge National Laboratory). 2006. Personal communication to N. Elliott,
March. Martin, M., B. Tonn, and R. Schmoyer. 1999. Industrial Assessment Center Program Impact
Evaluation. ORNL/CON-473. Oak Ridge, Tenn.: Oak Ridge National Laboratory. Martin, N., E. Worrell, M. Ruth, L. Price, R.N. Elliott, A.M. Shipley, and J. Thorne. 2000.
Emerging Energy-Efficient Industrial Technologies. Washington, DC: American Council for an Energy-Efficient Economy.
Monroe, R. 2005. Steel Foundry Outlook, May 2005. Presentation to the Board of the Steel
Founders’ Society of America, Crystal Lake, Ill. Muller, Michael R. (Rutgers University). 2000. Email correspondence to Anna Shipley. June
12. Nadel, S., R.N. Elliott, M. Shepard, S. Greenberg, G. Katz, and A.T. de Almeida. 2002.
Energy-Efficient Motor Systems: A Handbook on Technology, Program, and Policies, Second Edition. Washington, D.C.: American Council for an Energy-Efficient Economy.
Nadel, S., A.M. Shipley, and R.N. Elliott. 2004. “The Technical, Economic, and Achievable
Potential for Energy Efficiency in the U.S: A Meta-Analysis of Recent Studies.” In the Proceedings of the 2004 ACEEE Summer Study on Energy Efficiency in Buildings. Washington, D.C.: American Council for an Energy-Efficient Economy.
Notte, R. 2004. Presentation at the Hydraulic Institute 2004 Winter Annual Conference,
Parsippany, N.J. [NYSERDA] Optimal Energy, Inc. 2003. Energy-Efficiency and Renewable Supply Potential
in New York State and Five Load Zones. Draft. Bristol, Vt.: Optimal Energy, Inc. [OTA] Office of Technology Assessment, U.S. Congress. 1983. Industrial Energy Use.
OTA-E-198. Washington, D.C.: Government Printing Office. Puget Power. 2003. Internal staff analysis of energy efficiency potential. Bellevue, Wash.:
Puget Power. [Rutgers] Rutgers University, Center for Advanced Energy Systems. 2005. Industrial
Assessment Centers Database. http://iac.rutgers.edu/. Piscataway, N.J.: Rutgers University.
27

Ripe for the Picking, ACEEE
Schultz, S. 2005. Presentation at the 2005 IETC Energy Managers’ Workshop. College Station, Tex.: Texas A&M University Energy Systems Laboratory.
Shipley, A.M., R.N. Elliott, and A. Hinge. 2002. Energy Efficiency Programs for Small and
Medium-Sized Industry. ACEEE Report IE002. Washington, D.C.: American Council for an Energy-Efficient Economy.
Steinmeyer, D. 1998. Trading Capital for Energy. Washington, D.C.: American Council for
an Energy-Efficient Economy. [SWEEP] Southwest Energy Efficiency Project. 2002. The New Mother Lode: The Potential
for More Efficient Electricity Use in the Southwest. http://www.swenergy.org/nml/index.html. Bolder, Colo: Southwest Energy Efficiency Project.
Unruh, B. 2002. “Industrial Sector Energy Demand Projections Annual Energy Outlook
2002.” Presented at the National Energy Modeling System Conference, Washington, D.C., March 12.
Worrell, Ernst, John A. Laitner, Michael Ruth, and Hodayah Finman. 2003. "Productivity
Benefits of Industrial Energy Efficiency Measures." Energy, (28): 1081–1098. [XENERGY] Coito, Fred and Mike Rufo. 2003. California Statewide Commercial Sector
Natural Gas Energy Efficiency Potential Study. Vol. 1 of 2. Study ID #SW061. Prepared for the Pacific Gas & Electric Company. Oakland, Calif.: KEMA-XENERGY, Inc.
28


![The Exhausted - ]a[ - Akademie der bildenden Künste Wienpages.akbild.ac.at/kdm/_media/_pdf/Gilles Deleuze - The Exhausted.… · The Exhausted Gilles Deleuze translated by Anthony](https://img.pdfslide.us/doc/110x75/5a713aa17f8b9aa7538cae37/the-exhausted-a-akademie-der-bildenden-knste-wienpagesakbildacatkdmmediapdfgilles.jpg)