Embed Size (px)
Citation preview
1
RioSaladoCollegeEarlyChildhoodEducationProgramReview
ReviewPeriod:AcademicYears2013‐2017
ReviewConducted:AY2017‐18
I.DegreesandCertificatesintheEarlyChildhoodEducationProgramAAS in Early Childhood Administration and Management
AAS in Early Learning and Development
CCL in Family Child Care Management
CCL in Infant and Toddler Development
AAS in Early Childhood Administration and Management (3109)
Total Credits: 60‐65
Description:
The Associate in Applied Sciences (AAS) in Early Childhood Administration and Management is
an integrated program of study that provides an educational foundation in early childhood
education plus administrative and management courses specifically related to the business
needs and practices of early childhood directors, owners and other management‐level staff.
Program Notes:
Students must earn a grade of C or better for all courses required within the program.
+ indicates course has prerequisites and/or requisites.
++ indicates any suffixed courses.
Program Prerequisites: None
Required Courses: 35
CFS206 Child and Family Organizations: Management and Administration 3
CFS207 Organization and Community Leadership in Child and
Family Organizations 3
CFS208 Child and Family Organizations: Fiscal Management and
Grant Writing 3
EED200 Foundations of Early Childhood Education 3
EED212 Guidance, Management and the Environment 3
2
EED215 Early Learning: Health, Safety, Nutrition and Fitness 3
EED220 Child, Family, Community and Culture 3
EED222 Introduction to the Exceptional Young Child: Birth to Age Eight 3
+ EED260 Early Childhood Infant/Toddler Internship (1) OR
+ EED261 Early Childhood Preschool Internship (1) 1
+ EED278 Early Learning: Curriculum and Instruction ‐ Birth/Preschool 3
+ EED280 Standards, Observation and Assessment of Typical/Atypical
Behaviors of Young Children Birth to Age Eight 3
+ FCS250 Portfolio Development and Professional Writing 3
+ FCS260 Family and Consumer Science Internship 1
Restricted Electives: 3
Students must select courses from any combination of the following prefixes for
a total of 3 credits.
Selected courses must be in addition to those in the Required Courses area.
CIS105 Survey of Computer Information Systems 3
+ CFS+++ Any CFS Child/Family Studies course 1‐3
+ ECH+++ Any ECH Early Childhood Education course 1‐3
+ EED+++ Any EED Early Education course 1‐3
+ ITD+++ Any ITD Infant/Toddler Development course 1‐3
General Education Requirements: 22‐27
General Education Core: 12‐17
First‐Year Composition Credits: 6
+ ENG101 First‐Year Composition (3) OR
+ ENG107 First‐Year Composition for ESL (3) AND
+ ENG102 First‐Year Composition (3) OR
+ ENG108 First‐Year Composition for ESL (3) 6
Oral Communication: 3
COM100 Introduction to Human Communication (3) OR
COM110 Interpersonal Communication (3) OR
+ COM225 Public Speaking (3) OR
COM230 Small Group Communication (3)
Critical Reading Credits: 0‐3
3
+ CRE101 College Critical Reading and Critical Thinking (3) OR
Equivalent as indicated by assessment. 0‐3
Mathematics Credits: 3‐5
Any approved general education course from the Mathematics area.
General Education Distribution: 10
Humanities, Arts and Design: 3
EDU/ENH291 Children`s Literature 3
Social‐Behavioral Sciences: 3
CFS205 Human Development 3
Natural Sciences: 4
Any approved general education course from the Natural Sciences area. 4
AAS in Early Learning and Development (3124)
Total Credits: 63‐68
Description:
The Associate in Applied Science (AAS) in Early Learning and Development program is
designed to prepare individuals to enter the workforce as Early Childhood Professionals
and to assist individuals employed in the field to upgrade and expand their skills. The
program emphasizes the roles of early care and education professionals, families and
the wider society as they together meet the contemporary needs of young children.
Course work includes the principles of developmental science, professionalism in early
childhood work, philosophies and methods of early learning, and the impact of
standards on practice. To apply planning, management and evaluation skills, students
will observe, participate, and intern in state licensed early childhood programs.
Program Notes:
Students must earn a grade of "C" or better in all courses within the program.
+ indicates course has prerequisites and/or corequisites.
++ indicates any suffixed courses.
Required Courses: 32
ECH128 Early Learning: Play and the Arts 3
EED200 Foundations of Early Childhood Education 3
4
EED212 Guidance, Management and the Environment 3
EED215 Early Learning: Health, Safety, Nutrition and Fitness 3
EED220 Child, Family, Community and Culture 3
EED222 Introduction to the Exceptional Young Child: Birth to Age Eight 3
EED245 Early Learning: Language Acquisition and Literacy Development 3
+ EED255 Portfolio Development and Writing for the Profession 3
+ EED260 Early Childhood Infant/Toddler Internship 1
+ EED261 Early Childhood Preschool Internship 1
+ EED278 Early Learning: Curriculum and Instruction ‐ Birth/Preschool 3
+ EED280 Standards, Observation and Assessment of Typical/Atypical
Behaviors of Young Children Birth to Age Eight 3
Restricted Electives: 9
Students must complete one of the following Blocks: Block One: Infant and Toddler Development:
ITD200 The Physical Child: Birth to Age Three 3
ITD210 Early Attachments, Relationships and Families: Birth to
Age Three 3
ITD220 Cognition and Communication: Birth to Age Three 3 Block Two: Family Child Care Management:
CFS163 Family Child Care: Introduction to Business Management 3
CFS164 Family Child Care: Curriculum and Environment 3
CFS207 Organization and Community Leadership in Child and Family
Organizations 3 Block Three: Early Childhood Business Management:
CFS206 Child and Family Organizations: Management and
Administration 3
CFS207 Organization and Community Leadership in Child and Family
Organizations 3
CFS208 Child and Family Organizations: Fiscal Management and
Grant Writing 3
Block Four: Any CFS, ECH, EED, ITD or FCS prefixed courses not listed in the Required
Courses Area
CFS+++++ Any CFS Child/Family Studies course(s) 1‐9
ECH+++++ Any ECH Early Childhood Education course(s) except
courses used to satisfy Required Courses area. 1‐9
EED+++++ Any EED Early Education course(s) except courses used to satisfy
ITD+++++ Any ITD Infant/Toddler Development course(s) 1‐9
5
FCS+++++ Any FCS Family and Consumer Science course(s) 1‐9
General Education Requirements: 22‐27
General Education Core: 12‐17
First‐Year Composition 6
+ ENG101 First‐Year Composition (3) OR
+ ENG107 First‐Year Composition for ESL (3) AND
+ ENG102 First‐Year Composition (3) OR
+ ENG108 First‐Year Composition for ESL (3)
Oral Communication 3
Any approved general education course in the Oral Communication area.
Critical Reading 0‐3
+ CRE101 College Critical Reading and Critical Thinking (3) OR
Equivalent as indicated by assessment.
Mathematics 3‐5
Any approved General Education course in the Mathematics area.
General Education Distribution 10
Humanities, Arts and Design 3
Any approved General Education course in the Humanities, Arts and Design area.
Social‐Behavioral Sciences 3
CFS/ECH176 Child Development (3) OR
EED205 The Developing Child: Prenatal to Age Eight (3) OR
CFS235 Developing Child: Theory into Practice, Prenatal ‐ Age 8 (3)
Natural Sciences 4
Any approved General Education course in the Natural Sciences area.
CCL in Family Child Care Management (5714)
Total Credits: 16
Description:
The Certificate of Completion (CCL) in Family Child Care Management program provides
individuals with a foundation in early childhood care theories, practices and
6
administration. Topics include curriculum development, health and safety guidelines,
business procedures, and cognitive and physical development of the young child.
Program Notes:
Students must earn a grade of "C" or better in all courses within the program.
+ indicates course has prerequisites and/or corequisites.
Required Courses: 16
CFS163 Family Child Care: Introduction to Business Management 3
CFS164 Family Child Care: Curriculum and Environment 3
CFS207 Organization and Community Leadership in Child and
Family Organizations 3
EED205 The Developing Child: Prenatal to Age Eight 3
EED215 Early Learning: Health, Safety, Nutrition and Fitness 3
+ EED260 Early Childhood Infant/Toddler Internship 1
CCL in Infant and Toddler Development (5715)
Total Credits: 16
Description:
The Certificate of Completion (CCL) in Infant and Toddler Development program
prepares individuals with foundational knowledge on the development of the young
child. Included topics are child health, physical milestones, and cognitive development.
Also covered are adult/child relationship building, and communication and language
acquisition.
Program Notes:
Students must earn a grade of "C" or better in all courses within the program.
+ indicates course has prerequisites and/or corequisites.
++ indicates any suffixed courses.
Required Courses: 16
EED205 The Developing Child: Prenatal to Age Eight 3
EED215 Early Learning: Health, Safety, Nutrition and Fitness 3
+ EED260 Early Childhood Infant/Toddler Internship 1
+ ITD200 The Physical Child: Birth to Age Three 3
+ ITD210 Early Attachments, Relationships and Families: Birth to
Age Three 3
+ ITD220 Cognition and Communication: Birth to Age Three 3
7
Restricted Electives: None.
II.ProgramPurpose,MissionandAlignmentwithCollegeMissionDocuments
Rio Salado College has an established Early Childhood Education Program (ECE) that serves
undergraduate students and provides professional development for early childhood
practitioners employed in early childhood non‐certified settings. The Early Childhood program
provides multiple opportunities for career entry or professional development. The programs
are designed to be incremental and sequential – one level is incorporated into the next level. At
Rio Salado it is important that the program and all staff assist the early childhood professional
to move from one educational level to the next without loss of credit.
The vision of Rio Salado College is to reinvent the learning experience to change lives. The
mission is dedicated to “providing innovative educational opportunities to meet the needs of
today’s students through offering affordable access to higher education through college bridge
pathways, community‐based learning, corporate and government partnerships, early college
initiatives, online learning and university transfer. The Rio Salado College vision is to reinvent
the learning experience to change lives and its mission is to transform lives through:
Active community engagement and organizational responsiveness
Customized, high‐quality courses and programs
Data analytics and institutional accountability
Flexibility, affordability and innovation
Personalized service and a commitment to student success.”
As an institution of higher learning, Rio Salado values: Customer Focus, Diversity, Inclusiveness,
Innovation, Professionalism, Relentless Improvement, Sustainability and Teamwork.
The mission of the ECE program is to prepare individuals to enter the early childhood education
field or seek professional development in the field. The program is designed to reflect Rio
Salado College’s mission of transforming the lives of its students. Evidence of College‐wide
values and culture are woven throughout the CCL and AAS degree programs. ECE programs
engage the adult learner, reflect best practice in the field, are aligned with industry standards
and prepare students for successful careers in the early childhood education field. Course are
offered in an asynchronous online learning format with weekly start dates. This flexible format
is responsive to the diverse needs of working adults and workplace organizations. Additionally,
courses are offered face‐to‐face, or in hybrid modalities meeting the needs of those students
who prefer meeting with their instructor in a traditional format.
8
The Early Childhood Education Program offers customized, high‐quality courses, programs and
supports. First, each student who enters the program is assigned an Engagement Specialist
(Student Service Specialist) who is knowledgeable about Rio Salado College, the Early Childhood
Education programs, and has expertise in the field of study. Engagement Specialists are
committed to personalized service throughout each student’s academic journey to ensure
student persistence and completion from the point of access through the final course,
internship experience (where applicable), and graduation. This model focuses on personalizing
student learning through a common understanding of the support services needed for each
student to have a successful learning experience. Engagement Specialists are committed to
each student’s success, listen to the voice of the student and have a collective accountability for
each student’s success.
III.StudentPopulationoftheEarlyChildhoodEducationProgram
a.StudentDataAnalysis
0.0
20.0
40.0
60.0
80.0
100.0
2013 (580) 2014 (494) 2015 (421) 2016 (293) 2017 (348)
Percent
Gender Trends ‐ Early Childhood Education
Female Male Other/Not Specified
9
0.0
10.0
20.0
30.0
2013 (593) 2014 (516) 2015 (437) 2016 (301) 2017 (357)
Percent
Age Trends ‐ Early Childhood Education
15 ‐ 17 18 ‐ 19 20 ‐ 24 25 ‐ 29 30 ‐ 39 40 ‐ 49 50+
0.0
20.0
40.0
60.0
2013 (581) 2014 (494) 2015 (422) 2016 (296) 2017 (348)
Percent
Ethnicity Trends ‐ Early Childhood Education
American Indian Asian Black or African American
Hawaiin/Pacific Islander Hispanic or Latino White or Caucasian
10
0.0
10.0
20.0
30.0
40.0
50.0
60.0
2013 (582) 2014 (495) 2015 (424) 2016 (298) 2017 (346)
Percent
Previous College Experience Trends ‐ Early Childhood Education
Associate Degree Bachelor's Degree Master's Degree
Some college, no degree No college Not Indicated
0.0
20.0
40.0
60.0
80.0
2013 (580) 2014 (495) 2015 (421) 2016 (294) 2017 (348)
Percent
First Generation Trends ‐ Early Childhood Education
No Yes
11
0.00
20.00
40.00
60.00
80.00
100.00
2012 (279) 2013 (226) 2014 (186) 2015 (146) 2016 (145)
Percent
Citizenship Trends ‐ Early Childhood Education
Lgl Non‐Im Perm Resid US Citizen
0.0
20.0
40.0
60.0
2013 (580) 2014 (494) 2015 (421) 2016 (293) 2017 (348)
Percent
Current Intent Trends ‐ Early Childhood Education
Career Skills ‐ Learn or Improve Enter, Change, or Advance in Job Market
Personal Interest/Self‐Improvement Transfer to University/College/MCCCD
12
0.0
20.0
40.0
60.0
2013 (580) 2014 (494) 2015 (421) 2016 (293) 2017 (348)
Percent
Students Receiving Financial Aid Trends ‐Early Childhood Education
Received FA Did Not Receive FA
0.0
20.0
40.0
60.0
80.0
2013 (580) 2014 (494) 2015 (421) 2016 (293) 2017 (348)
Percent
Students Receiving PELL ‐Early Childhood Education
Received PELL Did Not Receive PELL
13
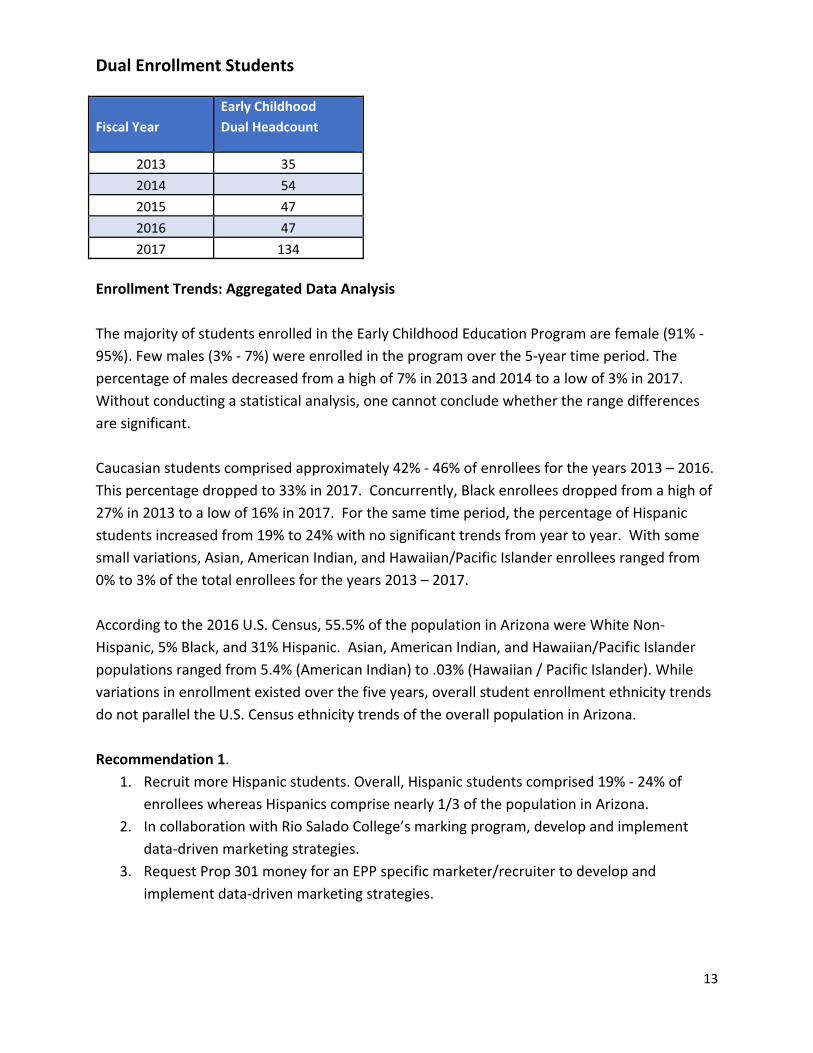
Dual Enrollment Students
Fiscal Year
Early Childhood
Dual Headcount
2013 35
2014 54
2015 47
2016 47
2017 134
Enrollment Trends: Aggregated Data Analysis
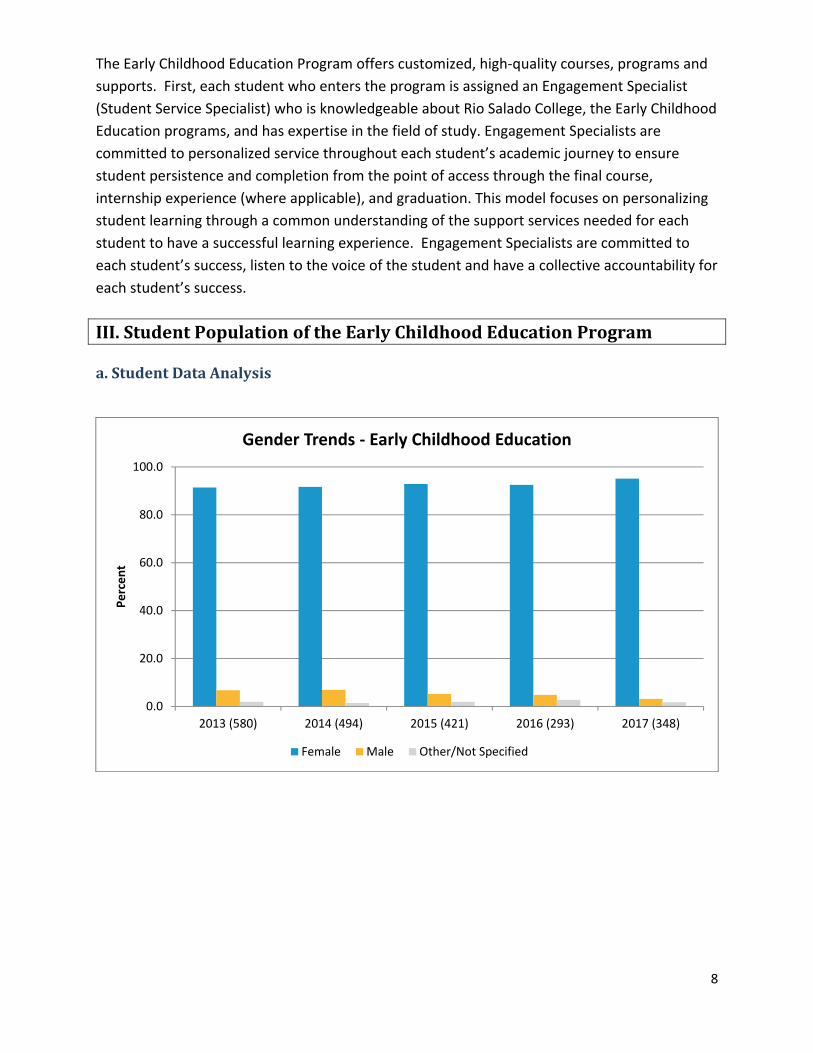
The majority of students enrolled in the Early Childhood Education Program are female (91% ‐
95%). Few males (3% ‐ 7%) were enrolled in the program over the 5‐year time period. The
percentage of males decreased from a high of 7% in 2013 and 2014 to a low of 3% in 2017.
Without conducting a statistical analysis, one cannot conclude whether the range differences
are significant.
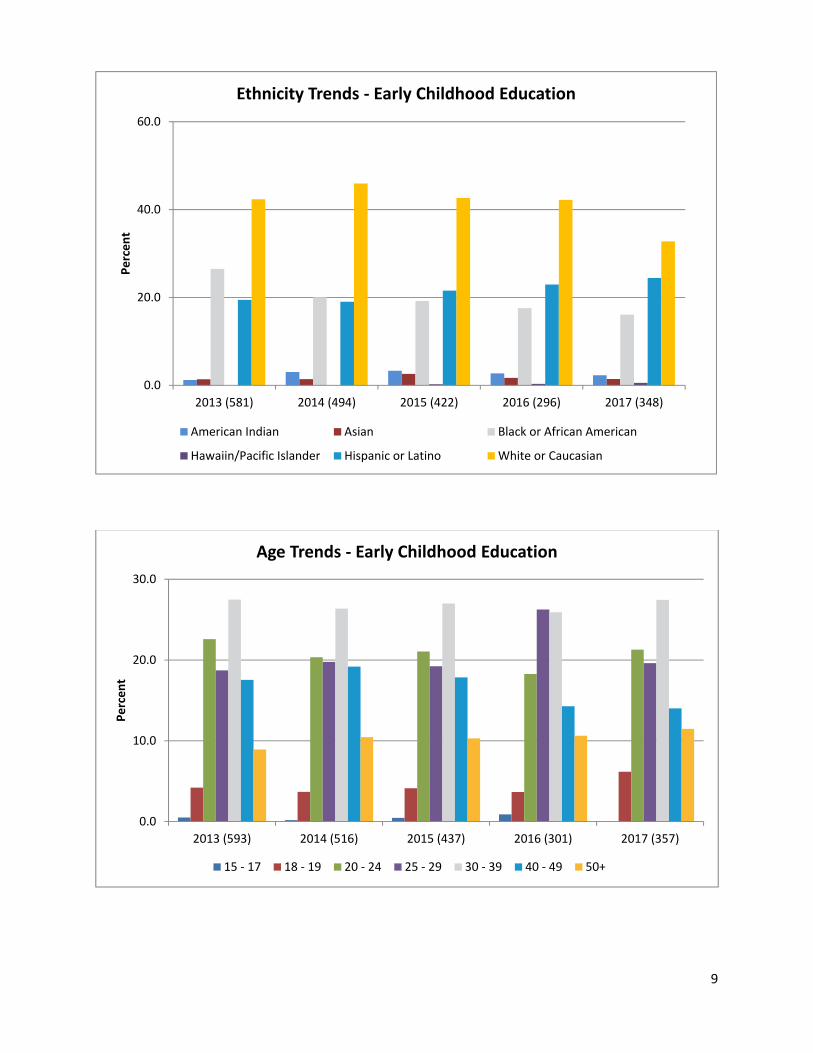
Caucasian students comprised approximately 42% ‐ 46% of enrollees for the years 2013 – 2016.
This percentage dropped to 33% in 2017. Concurrently, Black enrollees dropped from a high of
27% in 2013 to a low of 16% in 2017. For the same time period, the percentage of Hispanic
students increased from 19% to 24% with no significant trends from year to year. With some
small variations, Asian, American Indian, and Hawaiian/Pacific Islander enrollees ranged from
0% to 3% of the total enrollees for the years 2013 – 2017.
According to the 2016 U.S. Census, 55.5% of the population in Arizona were White Non‐
Hispanic, 5% Black, and 31% Hispanic. Asian, American Indian, and Hawaiian/Pacific Islander
populations ranged from 5.4% (American Indian) to .03% (Hawaiian / Pacific Islander). While
variations in enrollment existed over the five years, overall student enrollment ethnicity trends
do not parallel the U.S. Census ethnicity trends of the overall population in Arizona.
Recommendation 1.
1. Recruit more Hispanic students. Overall, Hispanic students comprised 19% ‐ 24% of
enrollees whereas Hispanics comprise nearly 1/3 of the population in Arizona.
2. In collaboration with Rio Salado College’s marking program, develop and implement
data‐driven marketing strategies.
3. Request Prop 301 money for an EPP specific marketer/recruiter to develop and
implement data‐driven marketing strategies.
14
According to the 2016 Early Childhood Workforce Index, Center‐based, listed home‐based and
non‐listed home‐based providers were predominately White (mean of 59%); in 2013 – 2017 a
smaller percentage (mean of 41%) of ECE enrollees were predominately White. African‐
Americans and Hispanics comprised the next largest demographic for all providers (18% each).
African‐American provider percentages mirror those of ECE enrollment data. Hispanic ECE
enrollment percentages are higher than the percentages for providers nationwide. However,
the Hispanic population in Arizona is higher (31%) than the 2016 U.S. Census Hispanic
population overall (18%). Without conducting a statistical analysis, it cannot be determined if
the differences and similarities between the 2016 Early Childhood Workforce Index and the ECE
enrollment data are significant.
The ECE highest enrollment was for students 30‐39 years old with a range of 26% to 28%,
followed by ages 20‐24 with a range of 18% ‐23% of the total enrollees. This was closely
followed by students 25‐29 years of age (19% ‐ 26%). Overall most enrollees (range of 63% ‐
77%) were between the ages of 20‐39. The highest percentage of enrollees were students aged
30‐39, followed by students aged 20‐29.
Students 40‐49 years of age constituted 14%‐19% of the enrollees. Students 18‐19 years of age
comprised 4%‐6% of enrollees over the same time period. The lowest enrollment was students
15‐19 years of age. Finally, the data revealed over the five year span, students 50 years and
older comprised 9%‐11% of enrollees.
According to the 2016 Early Childhood Workforce Index, more than 2 million adults cared for
approximately 12 million children from birth to five years of age in homes and centers, and this
workforce was overwhelming female. The Early Childhood Workforce Index data aligns with
the Early Childhood Education enrollment data in which most enrollees were female.
The Early Childhood Workforce Index (2016) also noted that most center‐based staff (46%)
were between the ages of 30‐49 years of age; the ECE highest enrollment was for students
between the ages of 30‐39. Approximately one‐quarter (28%) were age 29 and below and one
quarter (26%) were 50 years of age and older. Likewise, most listed home‐based staff (55%)
were between the ages of 30‐49, whereas those aged 50 and older comprised the 41% of listed
homebased staff and 40% of the non‐homebased staff.
On average (mean) 70 students were enrolled in the Early Childhood dual enrollment program
for the five year period with a range of 35 ‐ 134 students. Of note is that the number of
students dually‐enrolled increased from a low of 35 in 2013 to a high of 134 in 2017. Karp and
colleagues (2007) studied the dual enrollment participation in Florida and New York City. Their
results revealed a positive relationship between dual enrollment participation and high school
graduation and college enrollment. Students participating in dual enrollment programs were
15
more likely to graduate from high school, and were more likely to enroll in college than their
peers who did not participate in dual enrolment programs. Second, the researchers found that
those students who participated in dual enrollment programs had higher persistence and
retention rates, higher grade point averages, and accumulated more college credits than their
peers who did not participate in dual enrollment programs.
Recommendation 2.
1. Continue to market for students aged 20‐39.
2. Explore the possibility of marketing for students aged 40‐49 as the Early Childhood
Workforce Index (2016) indicated most center‐based staff were between 30‐49 and
nearly ¼ of center‐based staff were 50 years of age and older.
3. Based on ECE enrollment data and the Early Childhood Workforce Index, there does not
appear to be support for marketing for students younger than 20 years of age with the
exception of dually enrolled students.
4. Continue to market and support dual enrollment early childhood education programs
with high school partners.
5. Explore increasing marketing, to include data driven marketing strategies, to increase
high school partners.
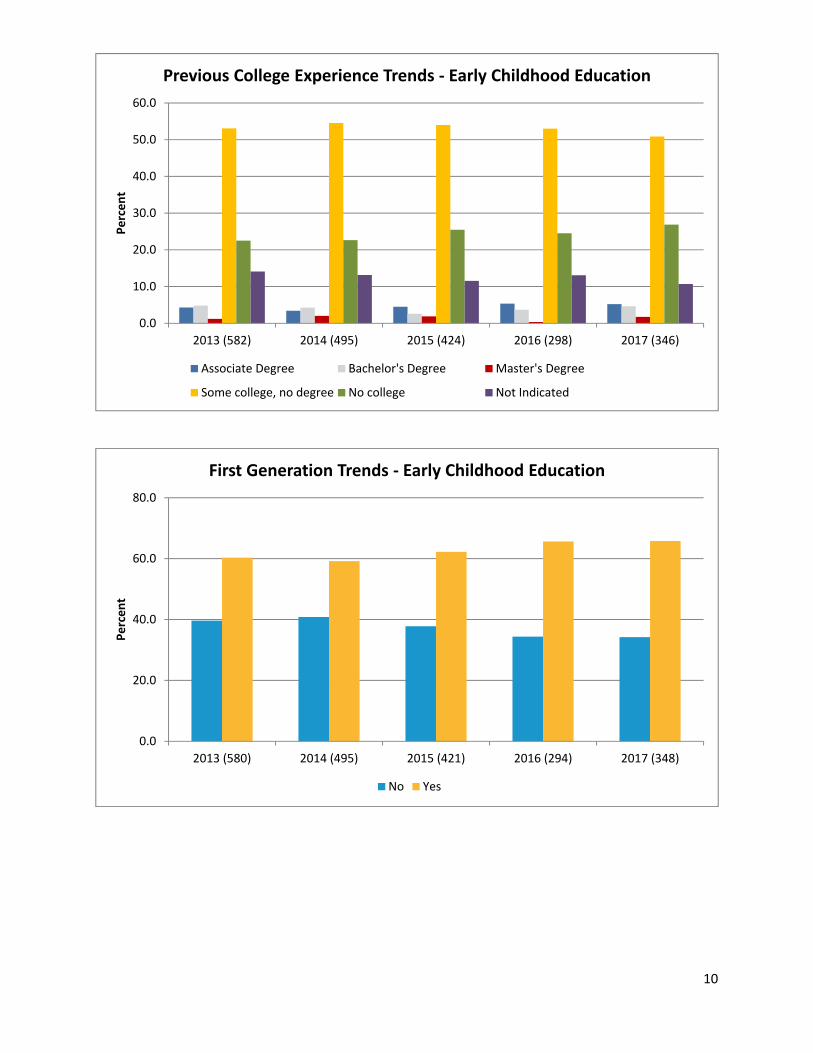
Overall, the Previous College Experience trend data revealed that most enrollees had some
college (43%‐51%) followed by no college (23%‐27%). Few enrollees had a bachelor’s (3%‐5%)
or an associate’s (4%‐5%) degree. Of note is that 11%‐14% of the enrollees did not indicate
their previous college experience. In summary, most enrollees (66%‐78%) entered the program
with no or some college experience. Few entered having a degree.
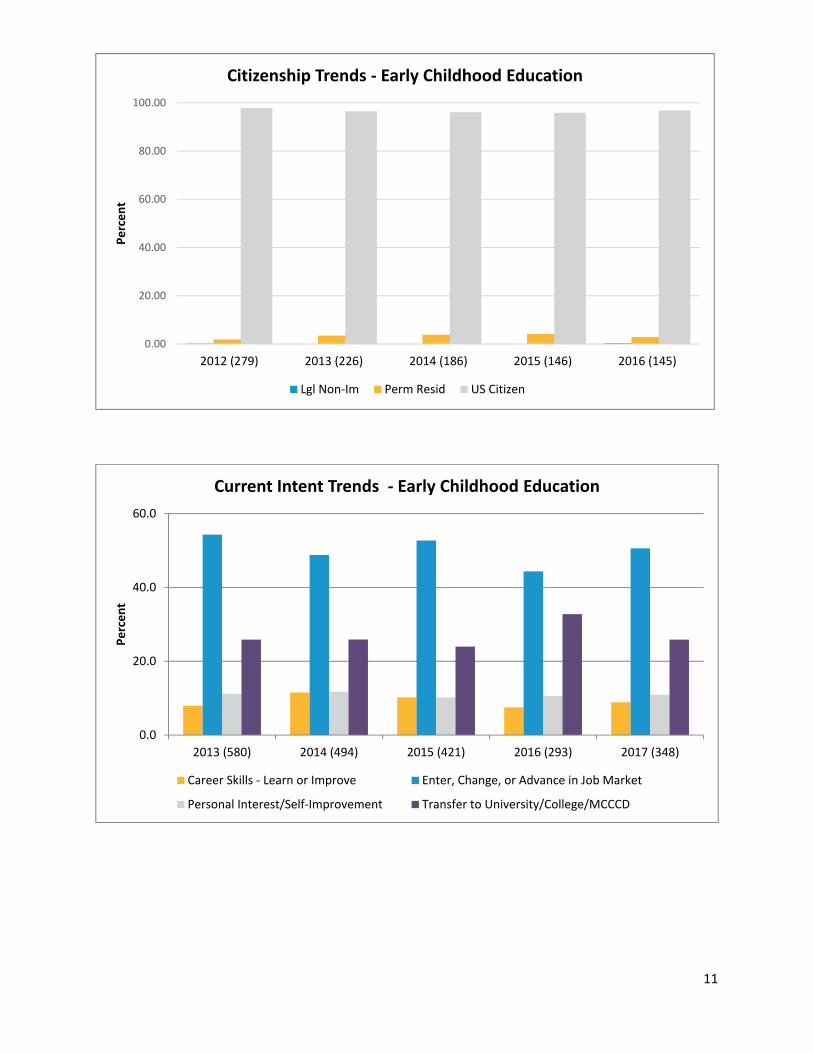
Approximately half (44%‐54%) of enrollees entered the program seeking to enter, change or
advance in the job market. Approximately one‐fourth (26%‐31%) of students enrolled with the
intent to transfer to a university, college or another MCCCD institution. Few students (8%‐12%)
enroll for personal growth or to learn or improve career skills.
Overall, most enrollees had little to no college experience and entered the program to enter,
change, or advance in the job market.
Recommendation 3.
1. Focus marketing strategies on students with some or no college experience.
2. Develop data‐driven marketing strategies. Begin this process by cross‐walking age,
ethnicity and college experience data. This will provide targeted marketing strategies
consistent with program outcomes, aligned with workforce and dual enrollment data.
16
Finally, most enrollees were first generation college students ranging from a low of 59% in 2014
to high of 66% in 2016 and 2017. It cannot be determined if this difference is statistically
significant. Second, most enrollees are US citizens with a five year range of 96% ‐ 98%.
b.EnrollmentTrends
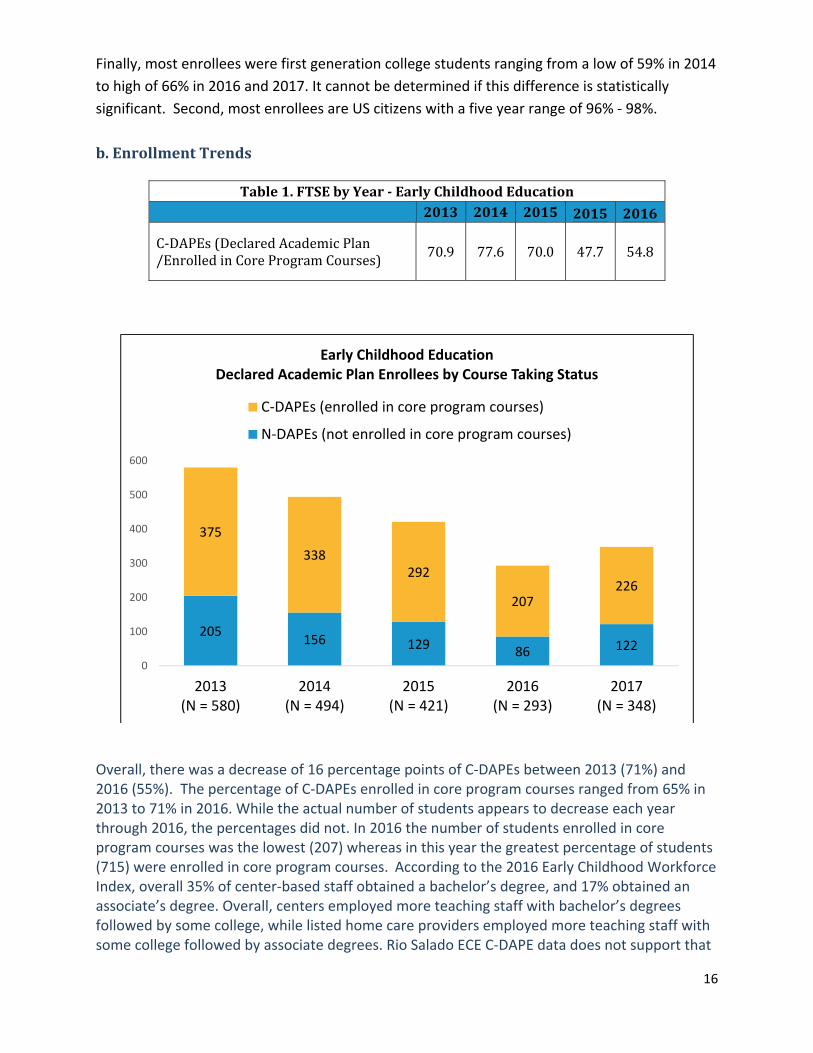
Table1.FTSEbyYear‐EarlyChildhoodEducation 2013 2014 2015 2015 2016
C‐DAPEs(DeclaredAcademicPlan/EnrolledinCoreProgramCourses) 70.9 77.6 70.0 47.7 54.8
Overall, there was a decrease of 16 percentage points of C‐DAPEs between 2013 (71%) and 2016 (55%). The percentage of C‐DAPEs enrolled in core program courses ranged from 65% in 2013 to 71% in 2016. While the actual number of students appears to decrease each year through 2016, the percentages did not. In 2016 the number of students enrolled in core program courses was the lowest (207) whereas in this year the greatest percentage of students (715) were enrolled in core program courses. According to the 2016 Early Childhood Workforce Index, overall 35% of center‐based staff obtained a bachelor’s degree, and 17% obtained an associate’s degree. Overall, centers employed more teaching staff with bachelor’s degrees followed by some college, while listed home care providers employed more teaching staff with some college followed by associate degrees. Rio Salado ECE C‐DAPE data does not support that
205156 129
86 122
375
338292
207226
0
100
200
300
400
500
600
2013(N = 580)
2014(N = 494)
2015(N = 421)
2016(N = 293)
2017(N = 348)
Early Childhood Education Declared Academic Plan Enrollees by Course Taking Status
C‐DAPEs (enrolled in core program courses)
N‐DAPEs (not enrolled in core program courses)
17
students are matriculating to bachelor or associate degree programs. This is of concern as it does not mirror the national workforce data.
Recommendation 4. 1. Increase the percentage of students with a declared academic plan to at least the 2013
– 2014 levels. 2. Conduct a deep dive into IR data or develop a program‐specific assessment tool to
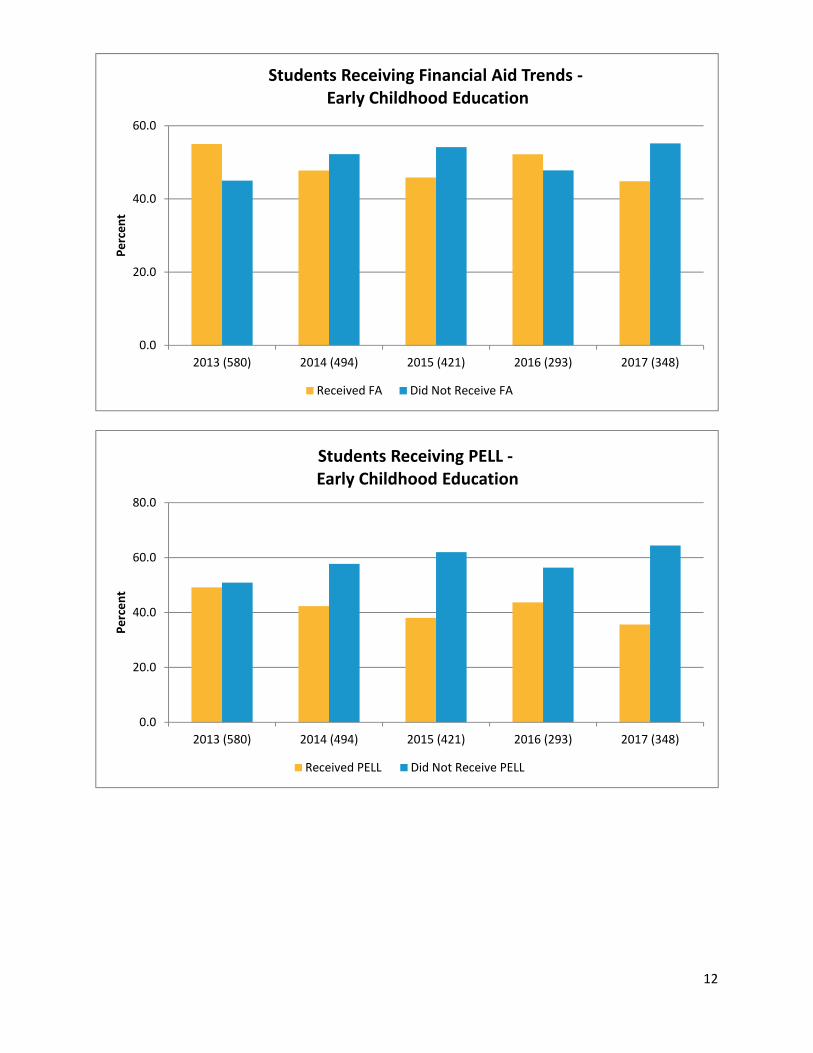
ascertain why nearly one‐third of the students are not seeking a degree. Financial Aid and Pell Grant Data With regard to financial aid and Pell Grant data, for the years 2013 and 2016 more enrollees received financial aid than did not receive financial aid. The percentage each year between those receiving financial aid and not receiving financial aid ranged from 4% to 10%. It cannot be determined if this difference is statistically‐significant. With the exception of 2016, the percentage of students receiving Pell Grants consistently increased each year.
Recommendation 5. 1. Conduct a deep dive into the data to identify students who receive financial aid and do
not participate in or fail courses to determine if there is a relationship between financial aid and course success or failure.
2. Use targeted advising strategies to increase the percentage of students enrolled and who pass courses to increase matriculation and graduation rates.
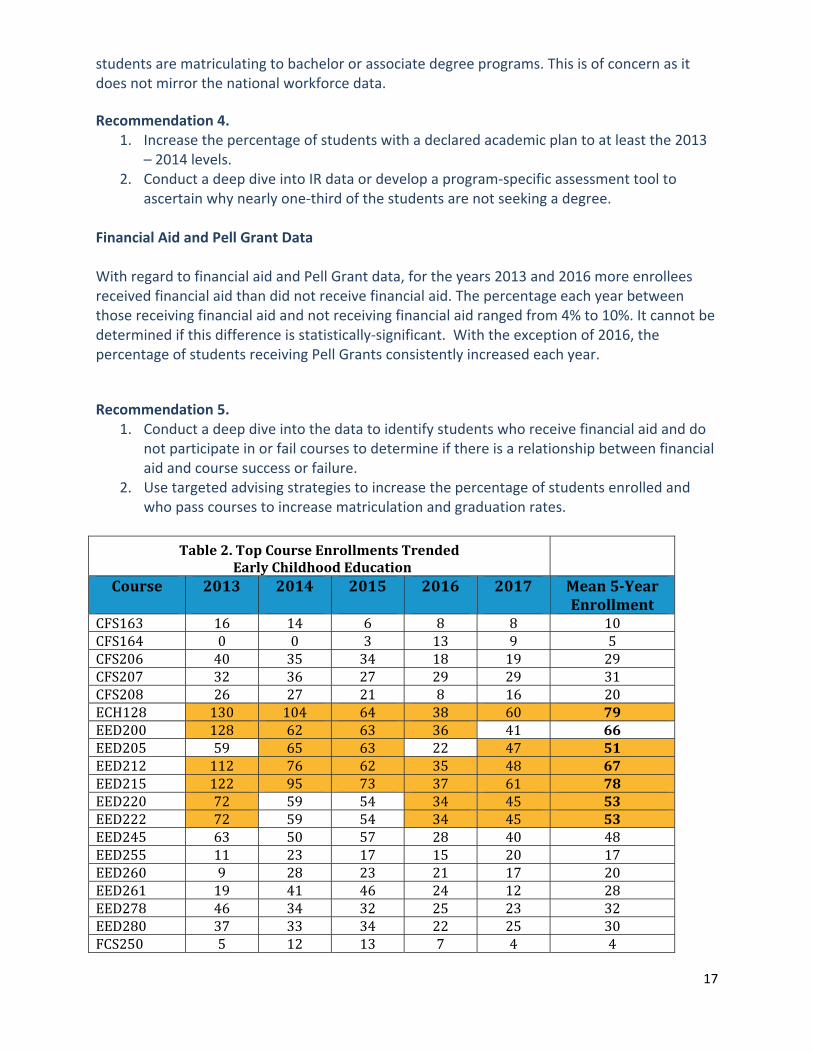
Table2.TopCourseEnrollmentsTrendedEarlyChildhoodEducation
Course
2013
2014
2015
2016
2017
Mean5‐YearEnrollment
CFS163 16 14 6 8 8 10CFS164 0 0 3 13 9 5CFS206 40 35 34 18 19 29CFS207 32 36 27 29 29 31CFS208 26 27 21 8 16 20ECH128 130 104 64 38 60 79EED200 128 62 63 36 41 66EED205 59 65 63 22 47 51EED212 112 76 62 35 48 67EED215 122 95 73 37 61 78EED220 72 59 54 34 45 53EED222 72 59 54 34 45 53EED245 63 50 57 28 40 48EED255 11 23 17 15 20 17EED260 9 28 23 21 17 20EED261 19 41 46 24 12 28EED278 46 34 32 25 23 32EED280 37 33 34 22 25 30FCS250 5 12 13 7 4 4
18
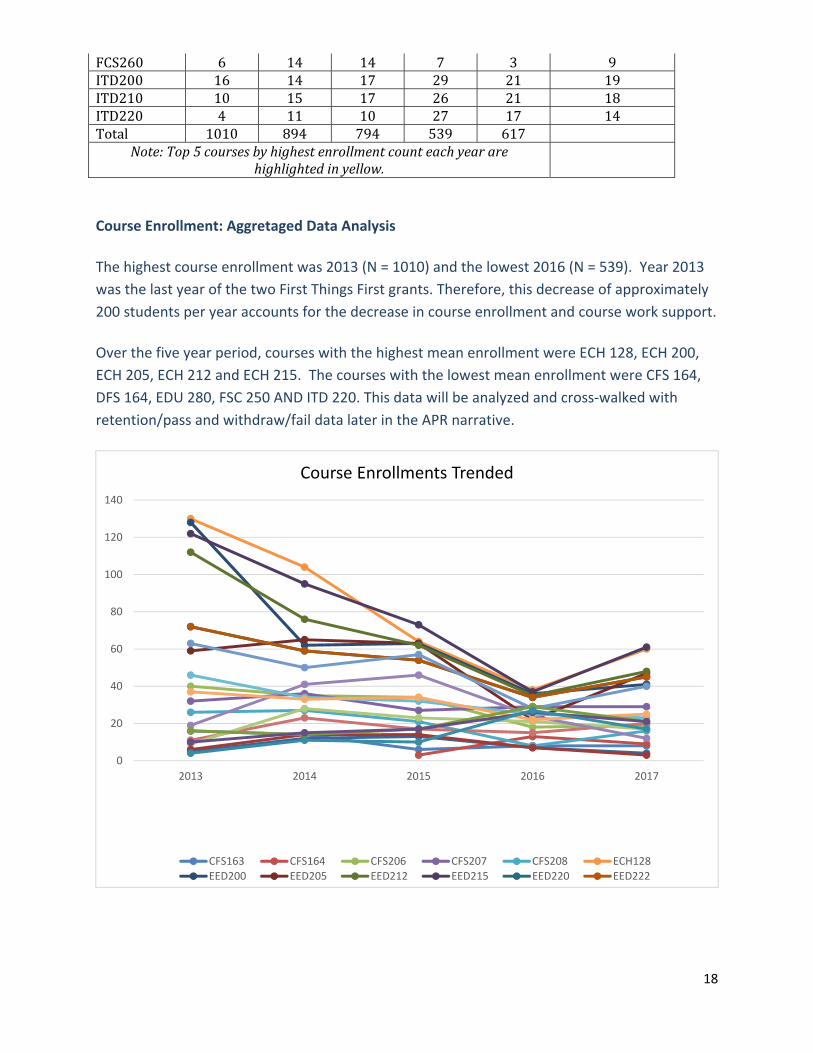
Course Enrollment: Aggretaged Data Analysis
The highest course enrollment was 2013 (N = 1010) and the lowest 2016 (N = 539). Year 2013
was the last year of the two First Things First grants. Therefore, this decrease of approximately
200 students per year accounts for the decrease in course enrollment and course work support.
Over the five year period, courses with the highest mean enrollment were ECH 128, ECH 200,
ECH 205, ECH 212 and ECH 215. The courses with the lowest mean enrollment were CFS 164,
DFS 164, EDU 280, FSC 250 AND ITD 220. This data will be analyzed and cross‐walked with
retention/pass and withdraw/fail data later in the APR narrative.
0
20
40
60
80
100
120
140
2013 2014 2015 2016 2017
Course Enrollments Trended
CFS163 CFS164 CFS206 CFS207 CFS208 ECH128EED200 EED205 EED212 EED215 EED220 EED222
FCS260 6 14 14 7 3 9ITD200 16 14 17 29 21 19ITD210 10 15 17 26 21 18ITD220 4 11 10 27 17 14Total 1010 894 794 539 617
Note:Top5coursesbyhighestenrollmentcounteachyeararehighlightedinyellow.
19
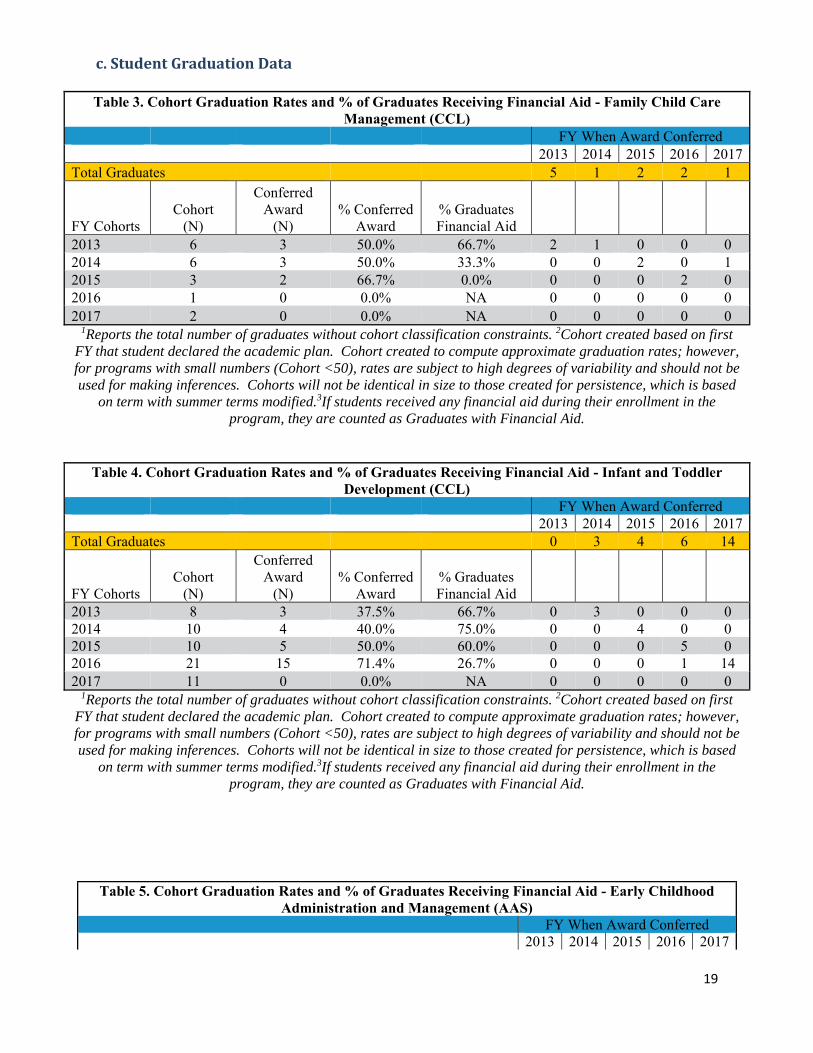
c.StudentGraduationDataTable 3. Cohort Graduation Rates and % of Graduates Receiving Financial Aid - Family Child Care
Management (CCL) FY When Award Conferred 2013 2014 2015 2016 2017Total Graduates 5 1 2 2 1
FY Cohorts Cohort
(N)
Conferred Award
(N) % Conferred
Award % Graduates Financial Aid
2013 6 3 50.0% 66.7% 2 1 0 0 0 2014 6 3 50.0% 33.3% 0 0 2 0 1 2015 3 2 66.7% 0.0% 0 0 0 2 0 2016 1 0 0.0% NA 0 0 0 0 0 2017 2 0 0.0% NA 0 0 0 0 0
1Reports the total number of graduates without cohort classification constraints. 2Cohort created based on first FY that student declared the academic plan. Cohort created to compute approximate graduation rates; however, for programs with small numbers (Cohort <50), rates are subject to high degrees of variability and should not be used for making inferences. Cohorts will not be identical in size to those created for persistence, which is based
on term with summer terms modified.3If students received any financial aid during their enrollment in the program, they are counted as Graduates with Financial Aid.
Table 4. Cohort Graduation Rates and % of Graduates Receiving Financial Aid - Infant and Toddler Development (CCL)
FY When Award Conferred 2013 2014 2015 2016 2017Total Graduates 0 3 4 6 14
FY Cohorts Cohort
(N)
Conferred Award
(N) % Conferred
Award % Graduates Financial Aid
2013 8 3 37.5% 66.7% 0 3 0 0 0 2014 10 4 40.0% 75.0% 0 0 4 0 0 2015 10 5 50.0% 60.0% 0 0 0 5 0 2016 21 15 71.4% 26.7% 0 0 0 1 14 2017 11 0 0.0% NA 0 0 0 0 0
1Reports the total number of graduates without cohort classification constraints. 2Cohort created based on first FY that student declared the academic plan. Cohort created to compute approximate graduation rates; however, for programs with small numbers (Cohort <50), rates are subject to high degrees of variability and should not be used for making inferences. Cohorts will not be identical in size to those created for persistence, which is based
on term with summer terms modified.3If students received any financial aid during their enrollment in the program, they are counted as Graduates with Financial Aid.
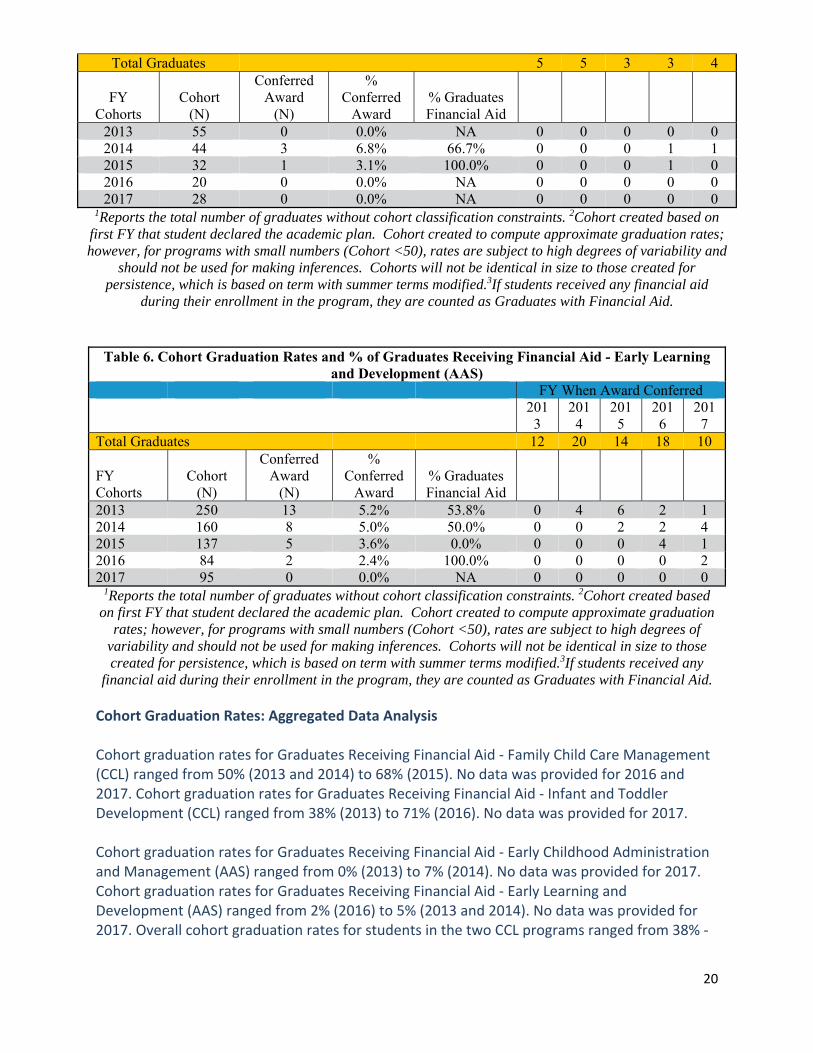
Table 5. Cohort Graduation Rates and % of Graduates Receiving Financial Aid - Early Childhood Administration and Management (AAS)
FY When Award Conferred 2013 2014 2015 2016 2017
20
Total Graduates 5 5 3 3 4
FY Cohorts
Cohort (N)
Conferred Award
(N)
% Conferred
Award % Graduates Financial Aid
2013 55 0 0.0% NA 0 0 0 0 0 2014 44 3 6.8% 66.7% 0 0 0 1 1 2015 32 1 3.1% 100.0% 0 0 0 1 0 2016 20 0 0.0% NA 0 0 0 0 0 2017 28 0 0.0% NA 0 0 0 0 0
1Reports the total number of graduates without cohort classification constraints. 2Cohort created based on first FY that student declared the academic plan. Cohort created to compute approximate graduation rates; however, for programs with small numbers (Cohort <50), rates are subject to high degrees of variability and
should not be used for making inferences. Cohorts will not be identical in size to those created for persistence, which is based on term with summer terms modified.3If students received any financial aid
during their enrollment in the program, they are counted as Graduates with Financial Aid.
Table 6. Cohort Graduation Rates and % of Graduates Receiving Financial Aid - Early Learning and Development (AAS)
FY When Award Conferred
2013
2014
2015
2016
2017
Total Graduates 12 20 14 18 10
FY Cohorts
Cohort (N)
Conferred Award
(N)
% Conferred
Award % Graduates Financial Aid
2013 250 13 5.2% 53.8% 0 4 6 2 1 2014 160 8 5.0% 50.0% 0 0 2 2 4 2015 137 5 3.6% 0.0% 0 0 0 4 1 2016 84 2 2.4% 100.0% 0 0 0 0 2 2017 95 0 0.0% NA 0 0 0 0 0
1Reports the total number of graduates without cohort classification constraints. 2Cohort created based on first FY that student declared the academic plan. Cohort created to compute approximate graduation
rates; however, for programs with small numbers (Cohort <50), rates are subject to high degrees of variability and should not be used for making inferences. Cohorts will not be identical in size to those created for persistence, which is based on term with summer terms modified.3If students received any
financial aid during their enrollment in the program, they are counted as Graduates with Financial Aid.
Cohort Graduation Rates: Aggregated Data Analysis Cohort graduation rates for Graduates Receiving Financial Aid ‐ Family Child Care Management (CCL) ranged from 50% (2013 and 2014) to 68% (2015). No data was provided for 2016 and 2017. Cohort graduation rates for Graduates Receiving Financial Aid ‐ Infant and Toddler Development (CCL) ranged from 38% (2013) to 71% (2016). No data was provided for 2017. Cohort graduation rates for Graduates Receiving Financial Aid ‐ Early Childhood Administration and Management (AAS) ranged from 0% (2013) to 7% (2014). No data was provided for 2017. Cohort graduation rates for Graduates Receiving Financial Aid ‐ Early Learning and Development (AAS) ranged from 2% (2016) to 5% (2013 and 2014). No data was provided for 2017. Overall cohort graduation rates for students in the two CCL programs ranged from 38% ‐
21
71%. Overall cohort graduation rates for students in the two AAS programs ranged from 0% ‐ 7%. However, the numbers of graduates tell the story in a different way. Eleven students were awarded a CCL in Family Child Care Management for the five years; 27 students were awarded a CCL in Infant and Toddler Development. For the same five year period, 20 students were awarded an AAS in Administration and Management degree, and 74 students were awarded an AAS in Early Learning and Development degree. In summary, the CCL Family Child Care Management program awarded the fewest certificates and the AAS Early Learning and Development program awarded the most degrees. The 2016 Early Childhood Workforce Index Data revealed that most providers hold a bachelor’s or associate’s degree. Conversely, the state of Arizona has specific workforce requirements not aligned with the 2016 Early Childhood Workforce Index Data. For example, personnel working in early childhood education programs licensed or certified by the State of Arizona are not required to obtain a degree or certificate. Certificate and degree requirements for programs housed in public schools vary depending on the school and the district. On the other hand, federally funded Head Start programs require teacher assistants (TA) or work toward a CDA, and teachers are required to have an AAS degree in ECE. Recommendation 8 (below) is based on national data, not Arizona‐specific workforce requirements.
IV.StudentGoalsandSatisfaction
a.Goals
Students participating in the Early Childhood Program at Rio Salado College are expected to:
Describe the roles of early care and education professionals
Explain the roles of families and the wider society as they together meet the
contemporary needs of young children
Identify the principles of developmental science
Explain professionalism for the early childhood workforce
Discuss the philosophies and methods of early learning
Explain the impact of early learning standards on professional practice
Apply early childhood education planning, management and evaluation skills
Observe, participate, and intern in early childhood programs
The goals of the program are woven throughout the required and elective course work. The
program does not have one course or one specific assignment that assesses all goals.
Embedded in each course is content and an assessment that assesses one or more goals. To
meet the needs of students and the workplace, in its curricular redesign, the ECE program is
eliminating open‐book forced response assignments (multiple choice and true/false quizzes)
and requiring students to complete authentic assessments that evaluate student goals. Rubrics
22
are more precisely‐aligned with the authentic assessment requirements providing the student
and instructor with data to measure achievement of program student goals.
b.Satisfaction
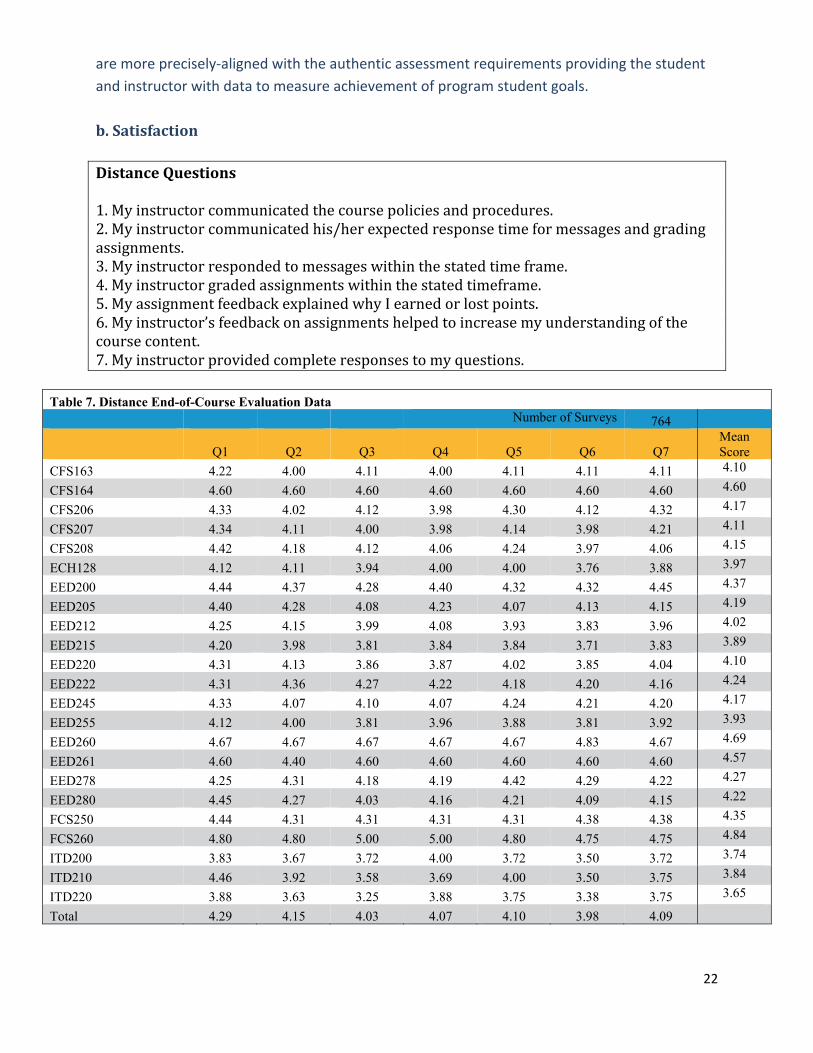
DistanceQuestions
1.Myinstructorcommunicatedthecoursepoliciesandprocedures.2.Myinstructorcommunicatedhis/herexpectedresponsetimeformessagesandgradingassignments.3.Myinstructorrespondedtomessageswithinthestatedtimeframe.4.Myinstructorgradedassignmentswithinthestatedtimeframe.5.MyassignmentfeedbackexplainedwhyIearnedorlostpoints.6.Myinstructor’sfeedbackonassignmentshelpedtoincreasemyunderstandingofthecoursecontent.7.Myinstructorprovidedcompleteresponsestomyquestions.
Table 7. Distance End-of-Course Evaluation Data
Number of Surveys 764
Q1 Q2 Q3 Q4 Q5 Q6 Q7 Mean Score
CFS163 4.22 4.00 4.11 4.00 4.11 4.11 4.11 4.10
CFS164 4.60 4.60 4.60 4.60 4.60 4.60 4.60 4.60
CFS206 4.33 4.02 4.12 3.98 4.30 4.12 4.32 4.17
CFS207 4.34 4.11 4.00 3.98 4.14 3.98 4.21 4.11
CFS208 4.42 4.18 4.12 4.06 4.24 3.97 4.06 4.15
ECH128 4.12 4.11 3.94 4.00 4.00 3.76 3.88 3.97
EED200 4.44 4.37 4.28 4.40 4.32 4.32 4.45 4.37
EED205 4.40 4.28 4.08 4.23 4.07 4.13 4.15 4.19
EED212 4.25 4.15 3.99 4.08 3.93 3.83 3.96 4.02
EED215 4.20 3.98 3.81 3.84 3.84 3.71 3.83 3.89
EED220 4.31 4.13 3.86 3.87 4.02 3.85 4.04 4.10
EED222 4.31 4.36 4.27 4.22 4.18 4.20 4.16 4.24
EED245 4.33 4.07 4.10 4.07 4.24 4.21 4.20 4.17
EED255 4.12 4.00 3.81 3.96 3.88 3.81 3.92 3.93
EED260 4.67 4.67 4.67 4.67 4.67 4.83 4.67 4.69
EED261 4.60 4.40 4.60 4.60 4.60 4.60 4.60 4.57
EED278 4.25 4.31 4.18 4.19 4.42 4.29 4.22 4.27
EED280 4.45 4.27 4.03 4.16 4.21 4.09 4.15 4.22
FCS250 4.44 4.31 4.31 4.31 4.31 4.38 4.38 4.35
FCS260 4.80 4.80 5.00 5.00 4.80 4.75 4.75 4.84
ITD200 3.83 3.67 3.72 4.00 3.72 3.50 3.72 3.74
ITD210 4.46 3.92 3.58 3.69 4.00 3.50 3.75 3.84
ITD220 3.88 3.63 3.25 3.88 3.75 3.38 3.75 3.65
Total 4.29 4.15 4.03 4.07 4.10 3.98 4.09
23
Course Evaluation: Aggregated Data Analysis
For four classes (CFS 164, EED 260, EED 261, and FCS 260) the mean end of course evaluation
scores ranged from 4.50 – 5.0. For four classes (EED 255, ITD 200, IDT 210 and IDT 220) the
mean scores were below 3.0. For no question was the mean score 4.5 or greater. For one
question (My instructor’s feedback on assignments helped to increase my understanding of the
course content) the mean score was less than 4.0. For three courses the mean score was below
4.0; this included three ITD courses. The question with highest mean score (4.29) was “My
instructor communicated the course policies and procedures.” However, one must ask if this
information was conveyed by the instructor ,or by course design and in the student handbook.
Preliminary Conclusions End‐of‐Course Evaluation Data (Mean Score of < of 3.0) cross‐walked
with course Failure data
1. EED 255 – low mean end‐of‐course evaluation score; low failure percentage (3%)
Preliminary Conclusions End‐of‐Course Evaluation Data (Mean Score > than 4.5) cross‐walked
with course Retention data
1. CFS 164 – high end‐of‐course evaluation score and high retention percentage (100%)
2. EED 260 – high end‐of‐course evaluation score and high retention percentage (97%)
Preliminary Conclusions End‐of‐Course Evaluation Data (Mean Score > than 4.5) and cross‐
walked with course Withdraw data
1. EED 261 – high end‐of‐course evaluation score and low withdraw percentage (0%)
2. FCS 260 – high end‐of‐course evaluation score and low withdraw percentage (0%)
Overall, four courses (CFS 164, EED 260, EED 261, and FCS 260) had high end‐of‐course
evaluation responses (> 4.5 mean response for five years) and high retention and low
withdrawal rates. While the end‐of‐course evaluation data and cross‐walk data provide an
additional matrix from which to evaluate the program, the end‐of‐course evaluation data is
aggregated and does provide course‐by‐course survey completion percentages.
Recommendation 6.
1. Cross walk end‐of‐course evaluation data for CFS 164, EED 260, EED 261, and FCS 260
with a sequence in course program and course curricula seeking patterns of success.
2. Request, analyze and cross‐walk course‐by‐course survey completion percentages with
course pass, retention, withdraw and failure data.
3. Continue course revision of rubrics to precisely align with the authentic assessment
requirements.

24
V.EvaluationofCurriculum
The Early Childhood and Human Development Advisory Committee meets annually. At each meeting the committee reviews the curriculum, provides concomitant recommendations, and provides the department with recommended changes based on changes in the field, best practices, and essential relevant information for course and program inclusion.
In 2016, the Early Childhood Human Development (ECEHD) unit implemented a Curriculum Committee. The purpose of the committee was to review course offerings with regard to (a) enrollment data, (b) date of last course revision, (c) text book revisions.
All who teach courses are encouraged to submit emails to the ECEHD Adjunct Helpdesk to report broken links, changes in the field, and other pertinent information that may impact the relevancy of course content, ensuring the content is up‐to‐date in all courses.
Changes to course content occur at a variety of times and for different reasons.
1. Textbook revisions (minor). Changes in lesson to align with text revisions are made to ensure the course is current for the next term it is offered. An example is page changes in a new revision. These changes do not need to be in the “queue”.
2. Textbook revisions (major). In some instances the text revision is major and requires a rewrite of the course. The department works closely with the instructional design specialist to ensure the course is entered into the “queue”.
3. Content revisions. The department works closely with the instructional design specialist to ensure the course is entered into the “queue”.
4. Curriculum update revisions determined the IC.
Atthiswriting, the department may add two or three courses in October 2018 in the “queue” for course revisions, depending on the extent of the revisions. Courses may be revised and placed in the queue in January 2019. Major revisions require three months for processing. At time of writing the department has approximately 12 courses that have been identified as first or second high enrollment courses that have not been revised (outside of removing Taskstream as a course evaluation requirement) for more than five years. Changes in text revisions are difficult at best to predict. It is imperative that all courses are routinely updated to attract and retain students in a competitive online market
Recommendation 7.
1. Create a strategic rollout of a review and revision of all courses, a curricular review cycle to assess all courses in relationship to enrollment trends, text publication dates and revisions, and course content relevancy.
2. Increase the number of courses the department revises to ensure all course are up‐to‐date and relevant.
3. Increase the number of course developers to meet demand for up‐to‐date and relevant courses.
25
4. Ensure the department has the resources to revise all courses based on text revisions and content revisions for relevancy needed to retain current students and market for new students.
5. Remove all quizzes from courses. 6. Throughout the course revision process, identify and select course materials (files, texts,
etc.) with a student cost of $40 or less per course.
VI.StudentLearningOutcomes
a.Program‐LevelStudentLearningOutcomes
AAS in Early Childhood Administration and Management (3109)
Competencies 1. Summarize the management and administration of community‐based child and family
organizations within the context of organizational behaviors, including the functions of administration, structure, and characteristics. (CFS206)
2. Analyze organization and community leadership in community‐based child and family services organizations. (CFS207)
3. Differentiate between various leadership styles. (CFS207) 4. Summarize fiscal accountability and management in community‐based child and family
services organizations. (CFS208) 5. Analyze various types of resource development in community‐based child and family
services organizations such as grants and private funding. (CFS208) 6. Analyze philosophies of early care and education and articulate arguments and reasons
for various types of early childhood programs. (EED200) 7. Describe the history of early childhood education. (EED200) 8. Explain professionalism, ethics, and standards related to the field of early childhood.
(EED200) 9. Summarize developmental characteristics of young children and how the characteristics
influence behavior. (EED200, EED212) 10. Describe how various environments impacts a child’s life. (EED212) 11. Summarize various impacts on discipline perspectives, including family beliefs, cultural
beliefs, and the teacher’s personal beliefs. (EED212) 12. Explain infection control measures and sanitation techniques for a group setting.
(EED215) 13. Summarize various safety procedures related to outdoor activities, playground
equipment, transportation policies, and poison control. (EED215) 14. Summarize documentation requirements for documenting health histories, medications,
emergencies, daily events, growth, and development in an early childhood setting. (EED215)
15. Explain the importance of a young child’s nutritional well‐being, including basic nutritional needs and physical fitness. (EED215)
16. Analyze how family, community, and cultural influences impact a child’s development. (EED220)
26
17. Summarize the attachment process from infancy through preschool age that occurs within families and potential personal and societal threats to those attachments. (EED220)
18. Determine how demographics influence early childhood education programs and services, and whether a program serves the child and his/her family within in their community and culture effectively. (EED220)
19. Describe an exceptional learner (birth to 5 years old) and the processes used to identify, assess, and refer an exceptional learner. (EED222)
20. Describe various areas of exceptionality. (EED222) 21. Explain the Individual Family Services Plan (IFSP) and Individual Education Plan (IEP) and
their importance. (EED222) 22. Apply early childhood education classroom instruction to work experiences during 80
hours per credit per semester. (EED260, EED261) 23. Identify and describe the principles of how young children learn. (EED278) 24. Compare and contrast current approaches to curriculum in early childhood settings and
use Arizona Early Childhood Standards to explain the components of early learning and special needs curriculum. (EED278)
25. Differentiate between various assessment procedures for early learning. (EED278) 26. Explain factors that may influence early learning curriculum such as individual
differences, family values, and community expectations. (EED278) 27. Examine the ethical and legal ramifications of standards, observation, identification,
inclusion, and assessment in early childhood. (EED280) 28. Describe the various purposes of observation and assessment and explain the roles and
responsibilities of an educational team. (EED280) 29. Use various methods of observation and assessment. (EED280) 30. Demonstrate effective communication techniques with young children, parents, and
various educational team members. (EED212, EED280) 31. Demonstrate the ability to use computer software programs and write professional
documents demonstrating a purpose, logical organization and inclusion of pertinent information for appropriate audiences. (FCS250)
32. Apply family and consumer science classroom instruction to work experiences during 80 hours per credit per semester. (FCS260)
AAS in Early Learning and Development (3124)
Competencies:
1. Explain the importance of play, creativity and the arts in contemporary early childhood programs, and how they support early learning. (ECH128)
2. Demonstrate planning, management and evaluation skills related to developmentally appropriate play, arts, and learning activities. (ECH128, EED261)
3. Review the emerging professionalism of the field of early childhood education, including a code of ethical conduct. (EED200)
4. Identify theories, standards, and public policy within the field and describe how these influence early childhood programs. (EED200)
27
5. Describe how developmental characteristics, individual needs, adult expectations and cultural contexts influence the behavior of children from birth through age eight. (EED212)
6. Describe policies, practices and regulations which ensure the health and safety of young children in group settings. (EED215)
7. Describe the nutritional needs of young children from birth on and explain how these needs are met with food selection, food preparation, and daily eating/feeding routines. (EED215)
8. Explain how community diversity and demographics influence early childhood programs, professionals, and the young children and families served. (EED220)
9. Identify appropriate professional responses that ensure the social and emotional well‐being of young children including identification of child maltreatment. (EED220)
10. Describe the process of identification, referral and assessment of young children whose development differs from the average. (EED222)
11. Identify strategies for inclusion, instruction, and support for the exceptional young child within the contexts of family, community and early childhood programs. (EED222)
12. Describe how young children develop language, literacy and writing skills and how adults support literacy development. (EED245)
13. Construct a portfolio which demonstrates professional development over time in a variety of dimensions, including professional writing samples. (EED255)
14. Contrast current approaches to curriculum for young learners and explain how state standards relate to curriculum and instruction. (EED278)
15. Identify multiple assessment procedures, their strengths, weaknesses and relationship to early learning standards. (ECH128, EED278, EED280)
16. Apply professional knowledge, skills and ethics of the early childhood profession to early learning settings in the community. (EED200, EED260, EED261)
17. Explain how Arizona Learning Standards are applied within programs serving children three to five and five to eight years of age. (EED280)
CCL in Family Child Care Management (5714)
Competencies: 1. Review business management, policies, procedures and economics of a family child care
provider. (CFS163, CFS164) 2. Prepare age appropriate curriculum for use in multi‐age child care environments.
(CFS164) 3. Examine appropriate health and safety standards, practices, and documentation in early
childhood settings. (CFS164, EED215) 4. Contrast the major research and theories within the field of child development.
(EED205) 5. Summarize the cognitive and psychosocial development of the young child. (EED205)
28
6. Describe the physical development of young children and corresponding nutritional and fitness needs. (CFS164, EED205, EED215)
7. Analyze organization and community leadership in community‐based child and family services organizations. (CFS207)
8. Apply early childhood education skills in the early care and education setting. (CFS163, CFS164, CFS207, EED205, EED215, EED260)
CCL in Infant and Toddler Development (5715)
Competencies: 1. Describe the physical development of young children and corresponding nutritional and
fitness needs. (EED205, EED215, ITD200) 2. Examine appropriate health and safety standards, practices, and documentation in early
childhood settings. (EED215, ITD200) 3. Contrast the major research and theories within the field of child development.
(EED205, ITD210) 4. Summarize the cognitive and psychosocial development of the young child. (EED205,
ITD210, ITD220) 5. Describe attachment and relationship development between adults and the young child
and its impact on child development. (ITD210, ITD220) 6. Summarize language development and communication skills in the young child. (ITD220) 7. Apply early childhood education skills in the early care and education setting. (EED205,
EED215, EED260, ITD200, ITD210, ITD220) The Associate in Applied Science (AAS) in Early Learning and Development Program is designed
for students who want to work or are currently working with children between 3 – 5 years of
age in center‐, school‐, or home‐based early learning environments. Students who want to work
with school age children ages 6 – 12 years find employment opportunities in public and private
schools. The Associate in Applied Science (AAS) in Early Childhood Administration and
Management prepares early childhood professionals to administer and manage early childhood
programs as a director, administrator, or owner of an early learning program. The Certificate of
Completion (CCL) in Family Child Care Management provides individuals with a foundation in
early childhood care theories, practices, and administration. The Certificate of Completion
(CCL) in Infant and Toddler Development is designed for students who want to work or are
currently working with children between 0 – 36 months. Students are prepared to work with
children in center‐, school‐, and home‐based early learning environments.
In summary, graduates are prepared to work as (a) professionals such as administrators,
managers, or owners of early childhood programs and centers; (b) early childhood
professionals working directly with infants, toddlers, and preschool age children; and (c)
paraprofessionals working directly with students age 6 –12 in private and public school
settings. Second, graduates leave the program with additional credentials and professional
development knowledge and skills to advance in their career field.
29
Program‐level learning outcomes are the aggregate of the student learning outcomes. As noted
previously, the goals of the program are woven throughout the required and elective course
work. The program does not have one course or one specific assignment that assesses all goals.
Embedded in each course is content and an assessment that assesses one or more than one
goals. To meet the needs of students and the workplace, in its curricular redesign, the ECE
program is eliminating open‐book forced response assignments (multiple choice and true/false
quizzes) and requiring students to complete authentic assessments that evaluate student goals.
Rubrics are more precisely aligned with the authentic assessment requirements, providing the
student and instructor with data to measure achievement of program student goals.
As previously noted, the ECE program does not have a capstone class from which IR could
provide data.
b.College‐WideStudentLearningOutcomes
Inadditiontotheprogram‐leveloutcomesaddressedabove,allRioSaladoCollegestudentsmustknowandbeabletodothefollowing:
1. Critical Thinking: The student will demonstrate the ability to analyze information, evaluate material, use inference to draw conclusions, and use deductive reasoning and inductive reasoning at a college level
2. Information Literacy: The student will demonstrate the ability to determine an information need, access successfully and evaluate critically the needed information, and organize and apply the information appropriately to accomplish a given research task.
3. Oral Communication: The student will demonstrate the ability to prepare and present oral communication in a variety of contexts as a college‐level speaker.
4. Reading: The student will demonstrate the ability to comprehend a variety of materials by determining the central idea and providing textual evidence, drawing inferences or valid conclusions, analyzing the author’s purpose and bias, and applying the text to a given task or course content.
5. Writing: On a written assignment, the student will demonstrate the ability to generate relevant and sufficient content; organize his or her thoughts coherently; adhere to the conventions of correct mechanics and sentence structure; and use correct terminology and rich vocabulary in the fulfillment, at the college level, of his or her writing assignments.
For more information: http://www.riosalado.edu/about/teaching‐
learning/assessment/Pages/SLO.aspx
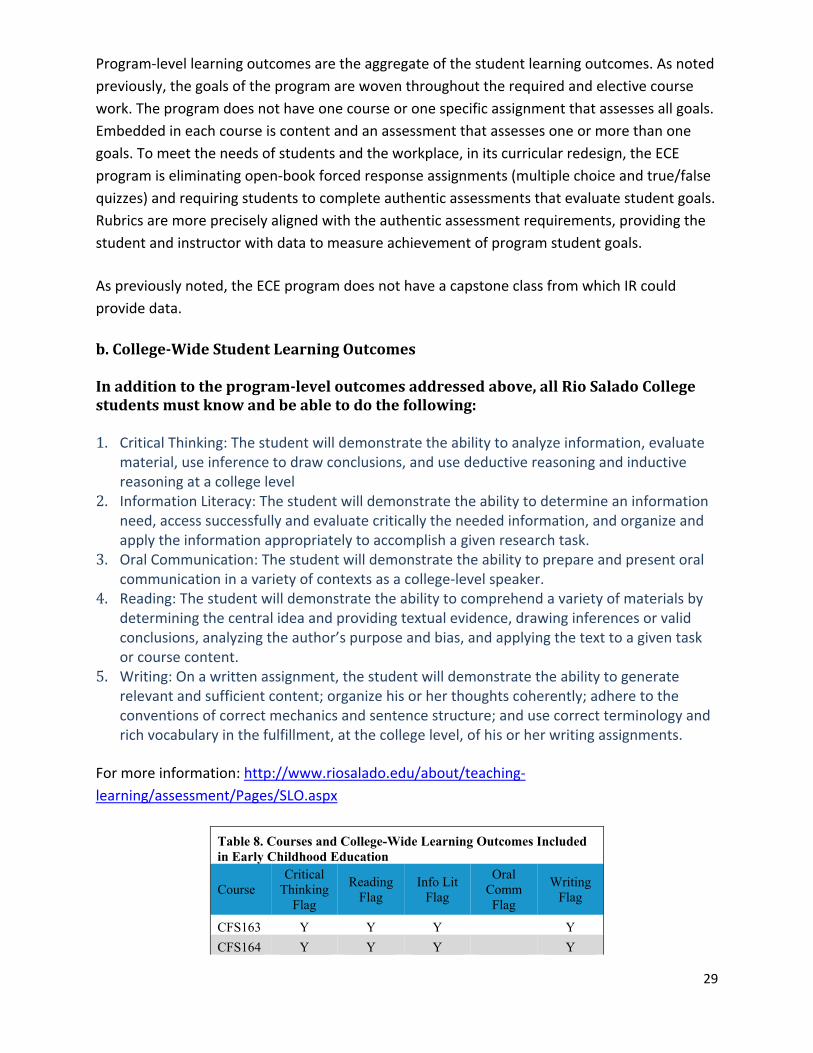
Table 8. Courses and College-Wide Learning Outcomes Included in Early Childhood Education
Course Critical
Thinking Flag
Reading Flag
Info Lit Flag
Oral Comm Flag
Writing Flag
CFS163 Y Y Y Y
CFS164 Y Y Y Y
30
CFS206 Y Y Y Y
CFS207 Y Y Y Y
CFS208 Y Y Y Y
ECH128 Y Y Y Y
EED200 Y Y Y Y
EED205 Y Y Y Y
EED212 Y Y Y Y
EED215 Y Y Y Y
EED220 Y Y Y Y
EED222 Y Y Y Y
EED245 Y Y Y Y
EED255 Y Y Y Y
EED260 Y
EED261 Y
EED278 Y Y Y Y
EED280 Y Y Y Y
FCS250 Y Y
FCS260
ITD200 Y Y Y Y
ITD210 Y Y Y Y
ITD220 Y Y Y Y
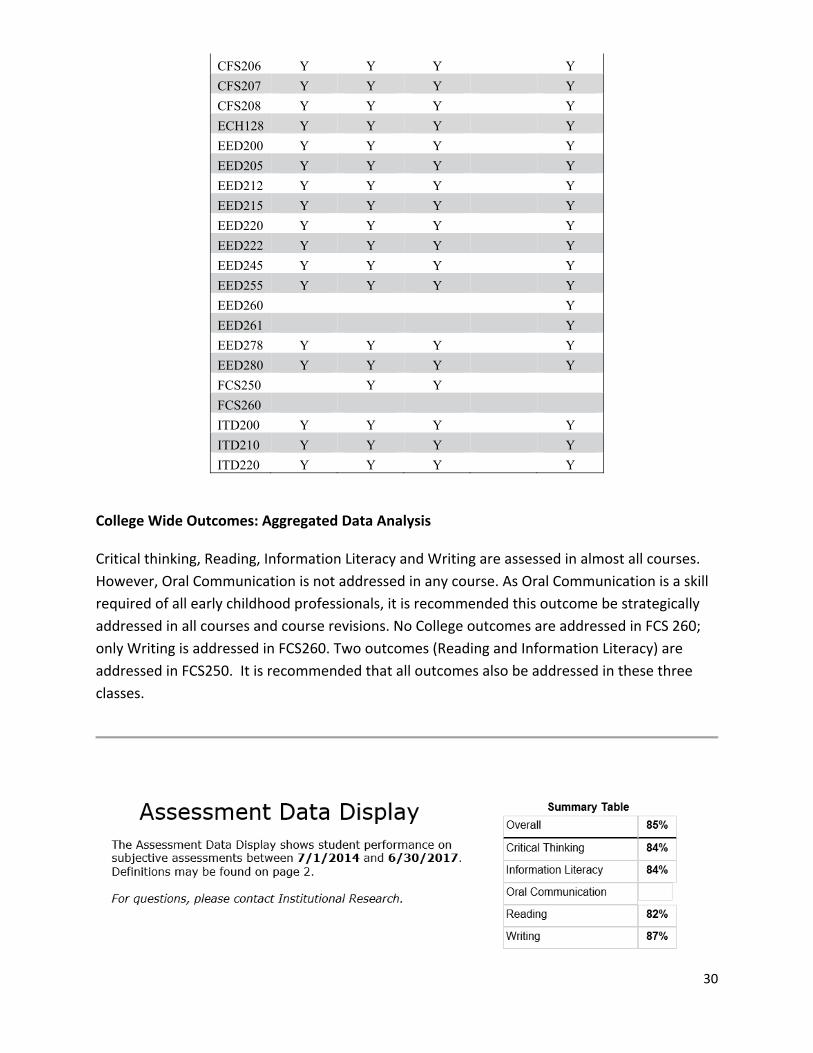
College Wide Outcomes: Aggregated Data Analysis
Critical thinking, Reading, Information Literacy and Writing are assessed in almost all courses.
However, Oral Communication is not addressed in any course. As Oral Communication is a skill
required of all early childhood professionals, it is recommended this outcome be strategically
addressed in all courses and course revisions. No College outcomes are addressed in FCS 260;
only Writing is addressed in FCS260. Two outcomes (Reading and Information Literacy) are
addressed in FCS250. It is recommended that all outcomes also be addressed in these three
classes.
31
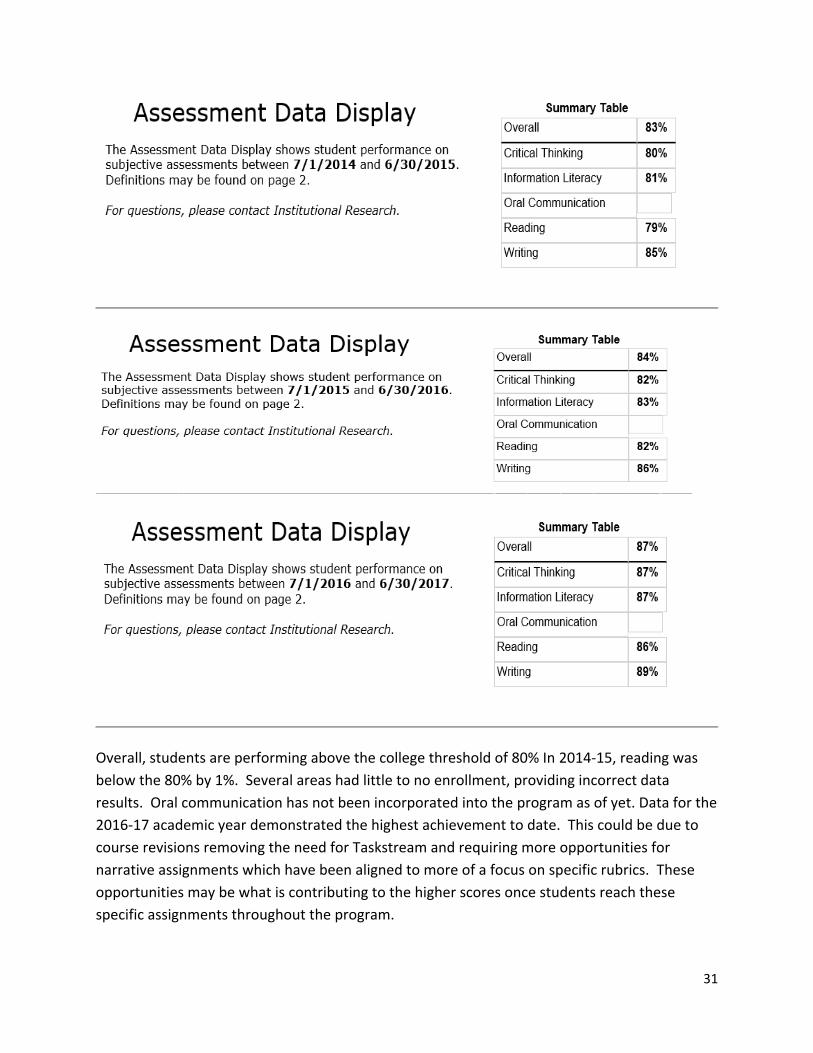
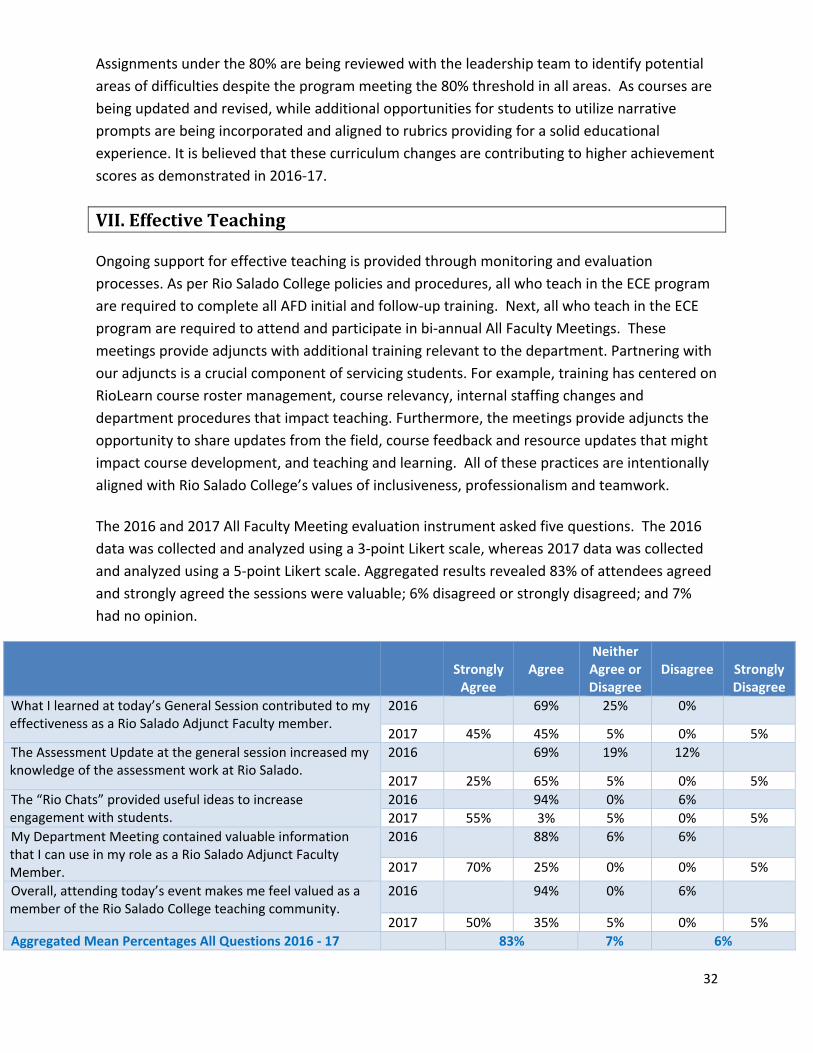
Overall, students are performing above the college threshold of 80% In 2014‐15, reading was
below the 80% by 1%. Several areas had little to no enrollment, providing incorrect data
results. Oral communication has not been incorporated into the program as of yet. Data for the
2016‐17 academic year demonstrated the highest achievement to date. This could be due to
course revisions removing the need for Taskstream and requiring more opportunities for
narrative assignments which have been aligned to more of a focus on specific rubrics. These
opportunities may be what is contributing to the higher scores once students reach these
specific assignments throughout the program.
32
Assignments under the 80% are being reviewed with the leadership team to identify potential
areas of difficulties despite the program meeting the 80% threshold in all areas. As courses are
being updated and revised, while additional opportunities for students to utilize narrative
prompts are being incorporated and aligned to rubrics providing for a solid educational
experience. It is believed that these curriculum changes are contributing to higher achievement
scores as demonstrated in 2016‐17.
VII.EffectiveTeaching
Ongoing support for effective teaching is provided through monitoring and evaluation
processes. As per Rio Salado College policies and procedures, all who teach in the ECE program
are required to complete all AFD initial and follow‐up training. Next, all who teach in the ECE
program are required to attend and participate in bi‐annual All Faculty Meetings. These
meetings provide adjuncts with additional training relevant to the department. Partnering with
our adjuncts is a crucial component of servicing students. For example, training has centered on
RioLearn course roster management, course relevancy, internal staffing changes and
department procedures that impact teaching. Furthermore, the meetings provide adjuncts the
opportunity to share updates from the field, course feedback and resource updates that might
impact course development, and teaching and learning. All of these practices are intentionally
aligned with Rio Salado College’s values of inclusiveness, professionalism and teamwork.
The 2016 and 2017 All Faculty Meeting evaluation instrument asked five questions. The 2016
data was collected and analyzed using a 3‐point Likert scale, whereas 2017 data was collected
and analyzed using a 5‐point Likert scale. Aggregated results revealed 83% of attendees agreed
and strongly agreed the sessions were valuable; 6% disagreed or strongly disagreed; and 7%
had no opinion.
Strongly Agree
Agree
Neither Agree or Disagree
Disagree
Strongly Disagree
What I learned at today’s General Session contributed to my effectiveness as a Rio Salado Adjunct Faculty member.
2016 69% 25% 0%
2017 45% 45% 5% 0% 5%
The Assessment Update at the general session increased my knowledge of the assessment work at Rio Salado.
2016 69% 19% 12%
2017 25% 65% 5% 0% 5%
The “Rio Chats” provided useful ideas to increase engagement with students.
2016 94% 0% 6%
2017 55% 3% 5% 0% 5%
My Department Meeting contained valuable information that I can use in my role as a Rio Salado Adjunct Faculty Member.
2016 88% 6% 6%
2017 70% 25% 0% 0% 5%
Overall, attending today’s event makes me feel valued as a member of the Rio Salado College teaching community.
2016 94% 0% 6%
2017 50% 35% 5% 0% 5%
Aggregated Mean Percentages All Questions 2016 ‐ 17 83% 7% 6%
33
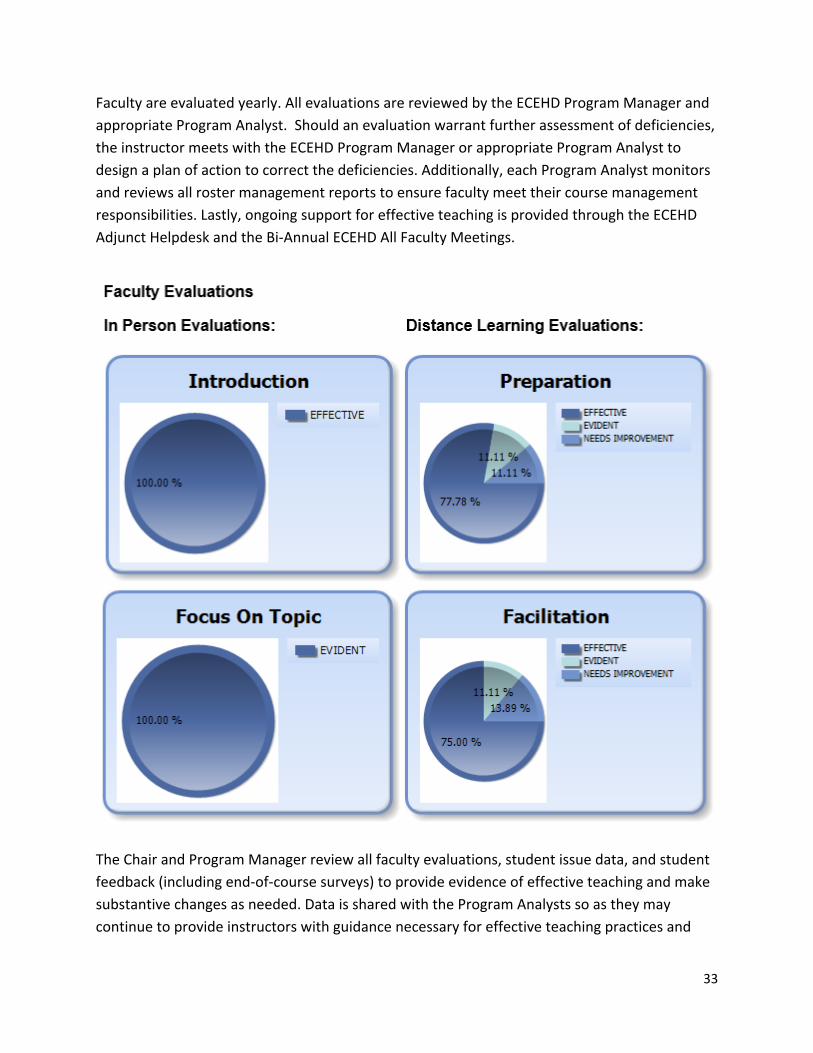
Faculty are evaluated yearly. All evaluations are reviewed by the ECEHD Program Manager and
appropriate Program Analyst. Should an evaluation warrant further assessment of deficiencies,
the instructor meets with the ECEHD Program Manager or appropriate Program Analyst to
design a plan of action to correct the deficiencies. Additionally, each Program Analyst monitors
and reviews all roster management reports to ensure faculty meet their course management
responsibilities. Lastly, ongoing support for effective teaching is provided through the ECEHD
Adjunct Helpdesk and the Bi‐Annual ECEHD All Faculty Meetings.
The Chair and Program Manager review all faculty evaluations, student issue data, and student
feedback (including end‐of‐course surveys) to provide evidence of effective teaching and make
substantive changes as needed. Data is shared with the Program Analysts so as they may
continue to provide instructors with guidance necessary for effective teaching practices and
34
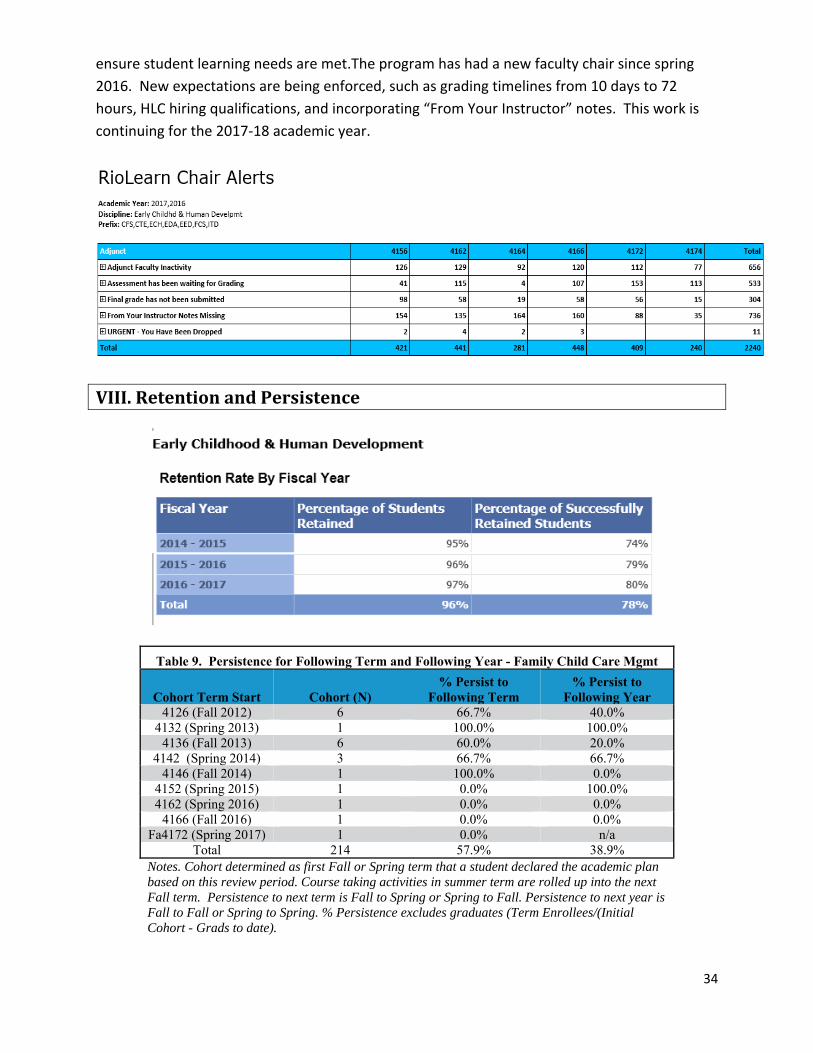
ensure student learning needs are met.The program has had a new faculty chair since spring
2016. New expectations are being enforced, such as grading timelines from 10 days to 72
hours, HLC hiring qualifications, and incorporating “From Your Instructor” notes. This work is
continuing for the 2017‐18 academic year.
VIII.RetentionandPersistence
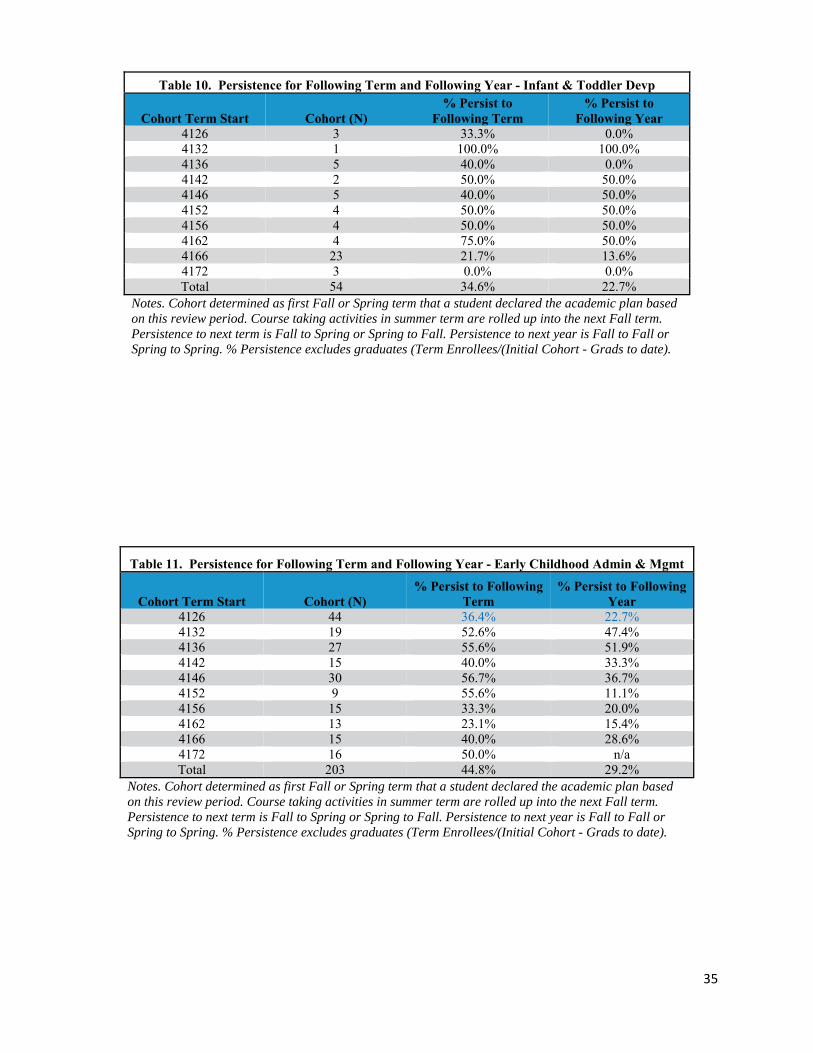
Table 9. Persistence for Following Term and Following Year - Family Child Care Mgmt
Cohort Term Start Cohort (N) % Persist to
Following Term % Persist to
Following Year 4126 (Fall 2012) 6 66.7% 40.0%
4132 (Spring 2013) 1 100.0% 100.0% 4136 (Fall 2013) 6 60.0% 20.0%
4142 (Spring 2014) 3 66.7% 66.7% 4146 (Fall 2014) 1 100.0% 0.0%
4152 (Spring 2015) 1 0.0% 100.0% 4162 (Spring 2016) 1 0.0% 0.0%
4166 (Fall 2016) 1 0.0% 0.0% Fa4172 (Spring 2017) 1 0.0% n/a
Total 214 57.9% 38.9% Notes. Cohort determined as first Fall or Spring term that a student declared the academic plan based on this review period. Course taking activities in summer term are rolled up into the next Fall term. Persistence to next term is Fall to Spring or Spring to Fall. Persistence to next year is Fall to Fall or Spring to Spring. % Persistence excludes graduates (Term Enrollees/(Initial Cohort - Grads to date).
35
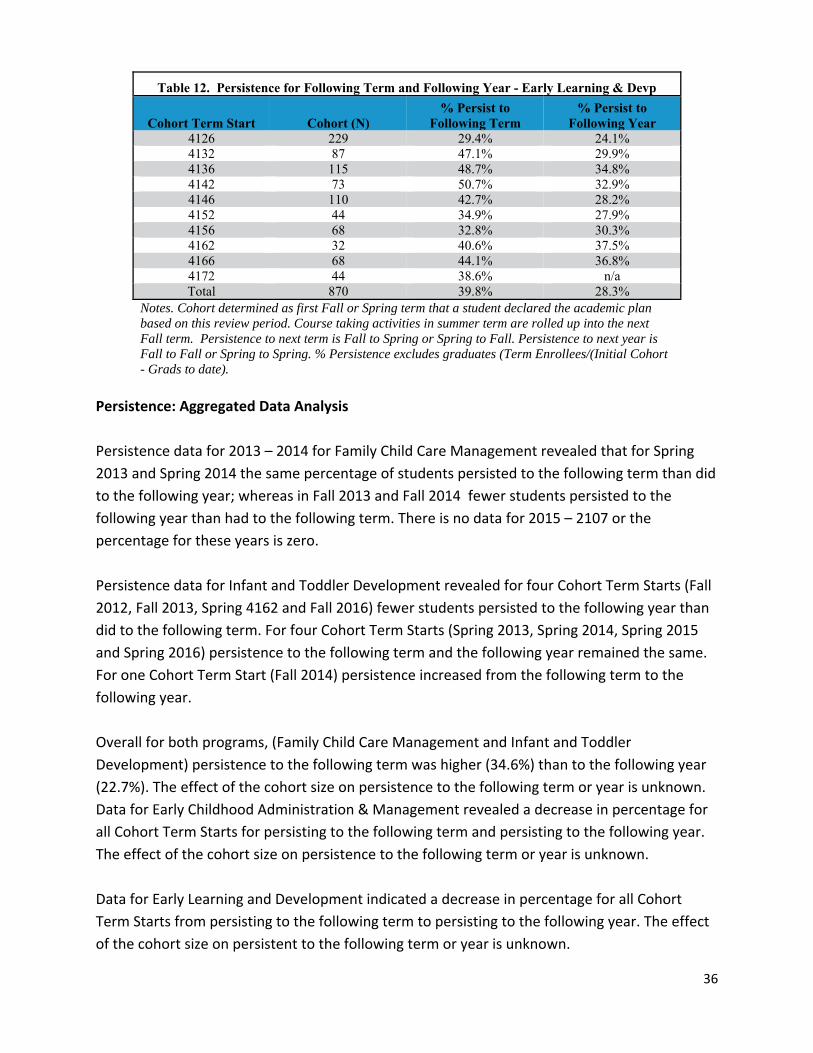
Table 10. Persistence for Following Term and Following Year - Infant & Toddler Devp
Cohort Term Start Cohort (N) % Persist to
Following Term % Persist to
Following Year 4126 3 33.3% 0.0% 4132 1 100.0% 100.0% 4136 5 40.0% 0.0% 4142 2 50.0% 50.0% 4146 5 40.0% 50.0% 4152 4 50.0% 50.0% 4156 4 50.0% 50.0% 4162 4 75.0% 50.0% 4166 23 21.7% 13.6% 4172 3 0.0% 0.0% Total 54 34.6% 22.7%
Notes. Cohort determined as first Fall or Spring term that a student declared the academic plan based on this review period. Course taking activities in summer term are rolled up into the next Fall term. Persistence to next term is Fall to Spring or Spring to Fall. Persistence to next year is Fall to Fall or Spring to Spring. % Persistence excludes graduates (Term Enrollees/(Initial Cohort - Grads to date).
Table 11. Persistence for Following Term and Following Year - Early Childhood Admin & Mgmt
Cohort Term Start Cohort (N) % Persist to Following
Term % Persist to Following
Year 4126 44 36.4% 22.7% 4132 19 52.6% 47.4% 4136 27 55.6% 51.9% 4142 15 40.0% 33.3% 4146 30 56.7% 36.7% 4152 9 55.6% 11.1% 4156 15 33.3% 20.0% 4162 13 23.1% 15.4% 4166 15 40.0% 28.6% 4172 16 50.0% n/a Total 203 44.8% 29.2%
Notes. Cohort determined as first Fall or Spring term that a student declared the academic plan based on this review period. Course taking activities in summer term are rolled up into the next Fall term. Persistence to next term is Fall to Spring or Spring to Fall. Persistence to next year is Fall to Fall or Spring to Spring. % Persistence excludes graduates (Term Enrollees/(Initial Cohort - Grads to date).
36
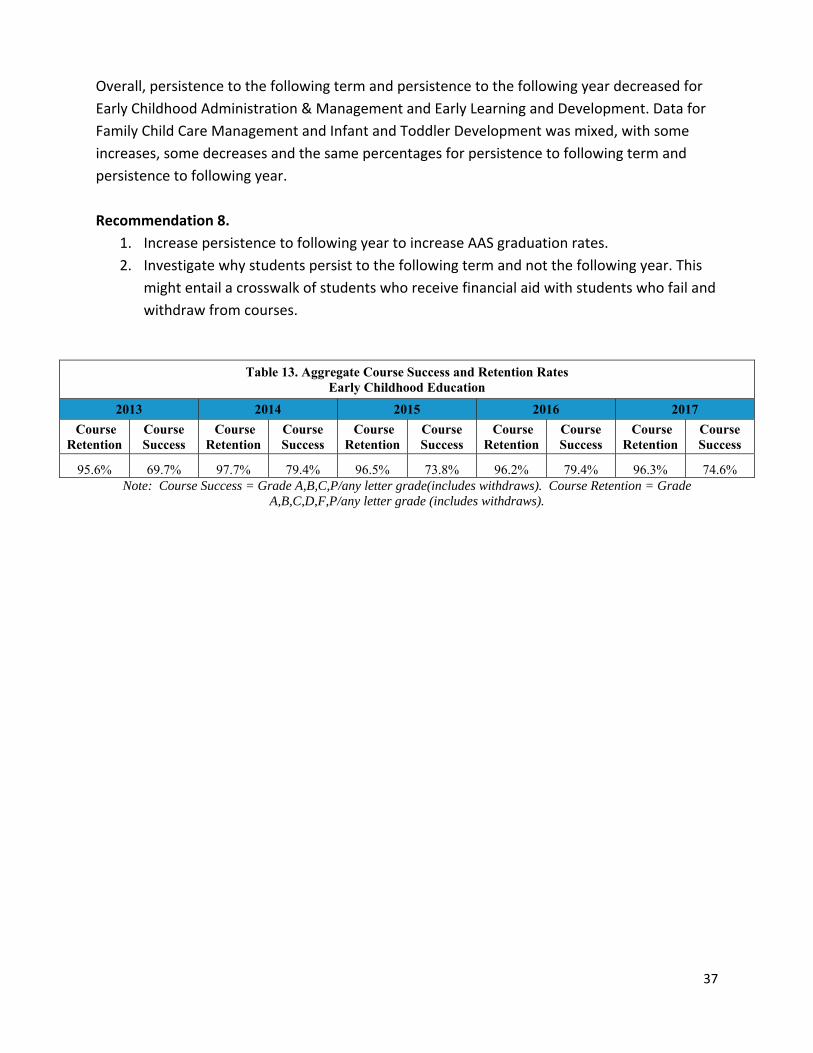
Table 12. Persistence for Following Term and Following Year - Early Learning & Devp
Cohort Term Start Cohort (N) % Persist to
Following Term % Persist to
Following Year 4126 229 29.4% 24.1% 4132 87 47.1% 29.9% 4136 115 48.7% 34.8% 4142 73 50.7% 32.9% 4146 110 42.7% 28.2% 4152 44 34.9% 27.9% 4156 68 32.8% 30.3% 4162 32 40.6% 37.5% 4166 68 44.1% 36.8% 4172 44 38.6% n/a Total 870 39.8% 28.3%
Notes. Cohort determined as first Fall or Spring term that a student declared the academic plan based on this review period. Course taking activities in summer term are rolled up into the next Fall term. Persistence to next term is Fall to Spring or Spring to Fall. Persistence to next year is Fall to Fall or Spring to Spring. % Persistence excludes graduates (Term Enrollees/(Initial Cohort - Grads to date).
Persistence: Aggregated Data Analysis
Persistence data for 2013 – 2014 for Family Child Care Management revealed that for Spring
2013 and Spring 2014 the same percentage of students persisted to the following term than did
to the following year; whereas in Fall 2013 and Fall 2014 fewer students persisted to the
following year than had to the following term. There is no data for 2015 – 2107 or the
percentage for these years is zero.
Persistence data for Infant and Toddler Development revealed for four Cohort Term Starts (Fall
2012, Fall 2013, Spring 4162 and Fall 2016) fewer students persisted to the following year than
did to the following term. For four Cohort Term Starts (Spring 2013, Spring 2014, Spring 2015
and Spring 2016) persistence to the following term and the following year remained the same.
For one Cohort Term Start (Fall 2014) persistence increased from the following term to the
following year.
Overall for both programs, (Family Child Care Management and Infant and Toddler
Development) persistence to the following term was higher (34.6%) than to the following year
(22.7%). The effect of the cohort size on persistence to the following term or year is unknown.
Data for Early Childhood Administration & Management revealed a decrease in percentage for
all Cohort Term Starts for persisting to the following term and persisting to the following year.
The effect of the cohort size on persistence to the following term or year is unknown.
Data for Early Learning and Development indicated a decrease in percentage for all Cohort
Term Starts from persisting to the following term to persisting to the following year. The effect
of the cohort size on persistent to the following term or year is unknown.
37
Overall, persistence to the following term and persistence to the following year decreased for
Early Childhood Administration & Management and Early Learning and Development. Data for
Family Child Care Management and Infant and Toddler Development was mixed, with some
increases, some decreases and the same percentages for persistence to following term and
persistence to following year.
Recommendation 8.
1. Increase persistence to following year to increase AAS graduation rates.
2. Investigate why students persist to the following term and not the following year. This
might entail a crosswalk of students who receive financial aid with students who fail and
withdraw from courses.
Table 13. Aggregate Course Success and Retention Rates Early Childhood Education
2013 2014 2015 2016 2017
Course Retention
Course Success
Course Retention
Course Success
Course Retention
Course Success
Course Retention
Course Success
Course Retention
Course Success
95.6% 69.7% 97.7% 79.4% 96.5% 73.8% 96.2% 79.4% 96.3% 74.6% Note: Course Success = Grade A,B,C,P/any letter grade(includes withdraws). Course Retention = Grade
A,B,C,D,F,P/any letter grade (includes withdraws).
38
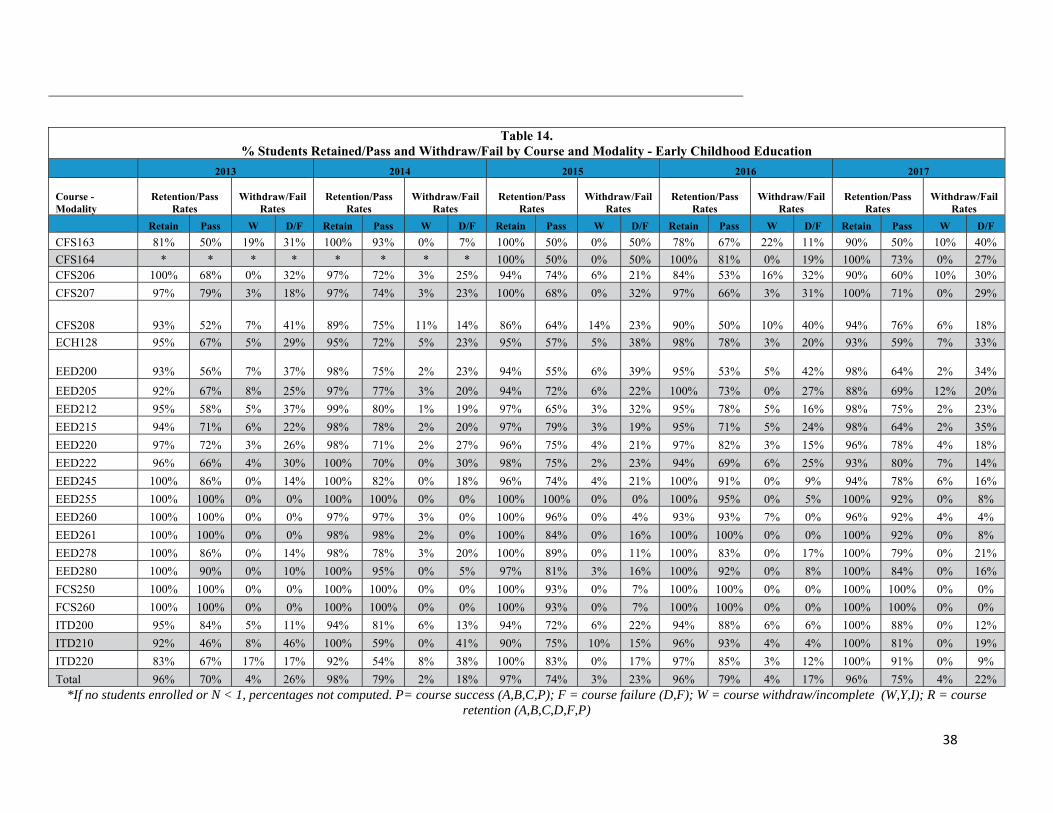
Table 14. % Students Retained/Pass and Withdraw/Fail by Course and Modality - Early Childhood Education
2013 2014 2015 2016 2017
Course - Modality
Retention/Pass Rates
Withdraw/Fail
Rates Retention/Pass
Rates
Withdraw/Fail
Rates Retention/Pass
Rates
Withdraw/Fail
Rates Retention/Pass
Rates
Withdraw/Fail
Rates Retention/Pass
Rates
Withdraw/Fail
Rates
Retain Pass W D/F Retain Pass W D/F Retain Pass W D/F Retain Pass W D/F Retain Pass W D/F
CFS163 81% 50% 19% 31% 100% 93% 0% 7% 100% 50% 0% 50% 78% 67% 22% 11% 90% 50% 10% 40%
CFS164 * * * * * * * * 100% 50% 0% 50% 100% 81% 0% 19% 100% 73% 0% 27% CFS206 100% 68% 0% 32% 97% 72% 3% 25% 94% 74% 6% 21% 84% 53% 16% 32% 90% 60% 10% 30%
CFS207 97% 79% 3% 18% 97% 74% 3% 23% 100% 68% 0% 32% 97% 66% 3% 31% 100% 71% 0% 29%
CFS208 93% 52% 7% 41% 89% 75% 11% 14% 86% 64% 14% 23% 90% 50% 10% 40% 94% 76% 6% 18%
ECH128 95% 67% 5% 29% 95% 72% 5% 23% 95% 57% 5% 38% 98% 78% 3% 20% 93% 59% 7% 33%
EED200 93% 56% 7% 37% 98% 75% 2% 23% 94% 55% 6% 39% 95% 53% 5% 42% 98% 64% 2% 34%
EED205 92% 67% 8% 25% 97% 77% 3% 20% 94% 72% 6% 22% 100% 73% 0% 27% 88% 69% 12% 20%
EED212 95% 58% 5% 37% 99% 80% 1% 19% 97% 65% 3% 32% 95% 78% 5% 16% 98% 75% 2% 23%
EED215 94% 71% 6% 22% 98% 78% 2% 20% 97% 79% 3% 19% 95% 71% 5% 24% 98% 64% 2% 35%
EED220 97% 72% 3% 26% 98% 71% 2% 27% 96% 75% 4% 21% 97% 82% 3% 15% 96% 78% 4% 18%
EED222 96% 66% 4% 30% 100% 70% 0% 30% 98% 75% 2% 23% 94% 69% 6% 25% 93% 80% 7% 14%
EED245 100% 86% 0% 14% 100% 82% 0% 18% 96% 74% 4% 21% 100% 91% 0% 9% 94% 78% 6% 16%
EED255 100% 100% 0% 0% 100% 100% 0% 0% 100% 100% 0% 0% 100% 95% 0% 5% 100% 92% 0% 8%
EED260 100% 100% 0% 0% 97% 97% 3% 0% 100% 96% 0% 4% 93% 93% 7% 0% 96% 92% 4% 4%
EED261 100% 100% 0% 0% 98% 98% 2% 0% 100% 84% 0% 16% 100% 100% 0% 0% 100% 92% 0% 8%
EED278 100% 86% 0% 14% 98% 78% 3% 20% 100% 89% 0% 11% 100% 83% 0% 17% 100% 79% 0% 21%
EED280 100% 90% 0% 10% 100% 95% 0% 5% 97% 81% 3% 16% 100% 92% 0% 8% 100% 84% 0% 16%
FCS250 100% 100% 0% 0% 100% 100% 0% 0% 100% 93% 0% 7% 100% 100% 0% 0% 100% 100% 0% 0%
FCS260 100% 100% 0% 0% 100% 100% 0% 0% 100% 93% 0% 7% 100% 100% 0% 0% 100% 100% 0% 0%
ITD200 95% 84% 5% 11% 94% 81% 6% 13% 94% 72% 6% 22% 94% 88% 6% 6% 100% 88% 0% 12%
ITD210 92% 46% 8% 46% 100% 59% 0% 41% 90% 75% 10% 15% 96% 93% 4% 4% 100% 81% 0% 19%
ITD220 83% 67% 17% 17% 92% 54% 8% 38% 100% 83% 0% 17% 97% 85% 3% 12% 100% 91% 0% 9%
Total 96% 70% 4% 26% 98% 79% 2% 18% 97% 74% 3% 23% 96% 79% 4% 17% 96% 75% 4% 22% *If no students enrolled or N < 1, percentages not computed. P= course success (A,B,C,P); F = course failure (D,F); W = course withdraw/incomplete (W,Y,I); R = course
retention (A,B,C,D,F,P)
39
Retention/Pass/Withdraw/Failure Data: Aggregated Data Analysis
Course retention rates ranged from 95.6% to 97.7%. Course success rates ranged from 69.7% to
79.4%. Without a statistical analysis it is unknown if these differences are significant. Course
failure rates ranged from 0% (CFS 250 and CFS 260) to 35% (EED 200).
Recommendation 9.
1. Review granular data for courses with high failure rates (CFS 163, CFS 164, CFS 206, ECH
128, and EED 200). Review to determine if failure is high as a result of not submitting
assignments or not successfully completing assignments, and the number of assignment
submission attempts.
2. IR review and crosswalk student failure data in each course with student percent
receiving financial aid in each course.
Crosswalk of Enrollment Data with Retention/Pass/Withdraw/Failure Data: Aggregated Data
Analysis
Overall, CFS 163 and CFS 164 have low enrollment. Coupled with low enrollment, these courses
have high failure rates and low pass rates. Of note is that CFS 164 is a high retention course and
CFS 163 is a high withdraw course. ECH 128, EED 200 and EED 212 have high enrollment and
concomitantly low pass rates. EED 200 and EED 212 also have high failure rates.
Recommendation 10.
1. Explore why students in CFS 163 and CFS 164 are not performing well and/or are not
persisting in the classes.
2. Explore why students in ECH 128, EED 200 and EED 212 are not performing well.
Preliminary Conclusions Tables 13 and 14: Defining Retention and Success Table 13 Retention includes Grade A,B,C,D,F, P, and W, and Table 14 Retention Grade
A,B,C,D,F,P does not include W. Therefore, we cannot compare Retention Percentages between
Tables 13 and 14. Table 13 Success includes Grade A,B,C,P and W and Table 14 Success includes
Grade A,B,C,P and does not include W. Again, we cannot compare Retention Percentages
between Tables 13 and 14.
The ECE program does not have analytic interventions such as PACE, Civitas, or PAR to improve
retention. Retention data was analyzed earlier in the review narrative. Formative and
summative review recommendations address the need for data and supports to increase
course and program retention.
40
IX.ImpactofCo‐CurricularPrograms
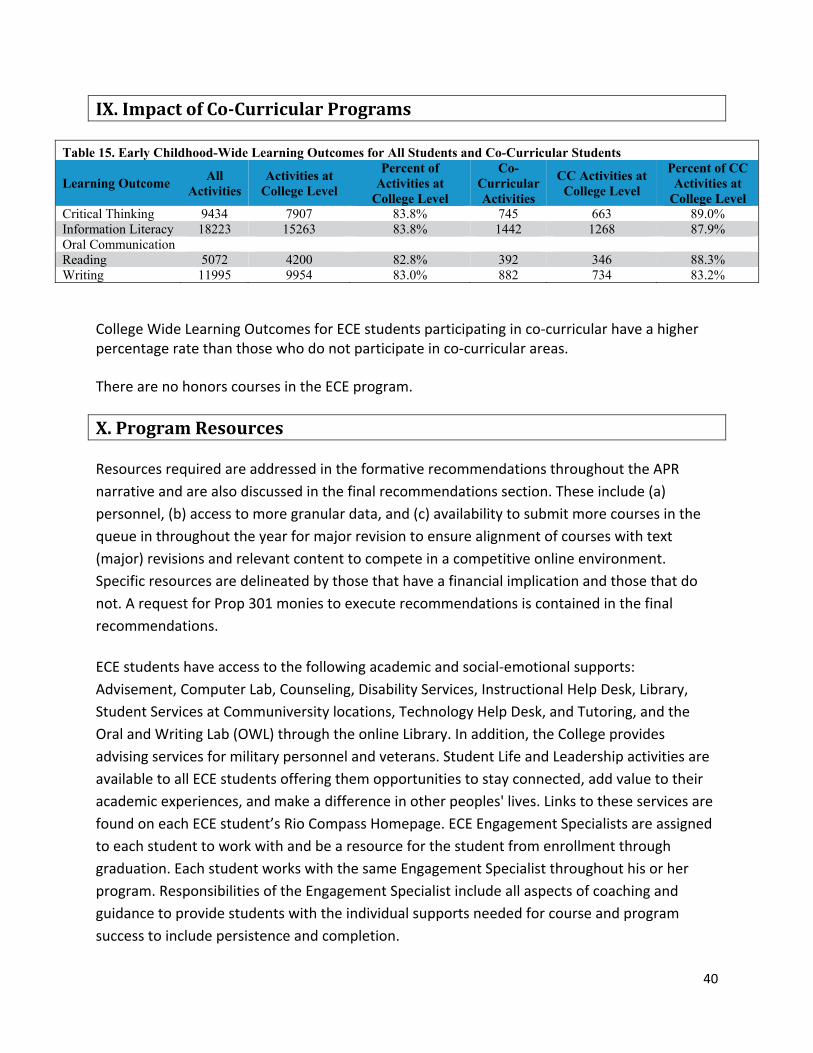
Table 15. Early Childhood-Wide Learning Outcomes for All Students and Co-Curricular Students
Learning Outcome All
Activities Activities at
College Level
Percent of Activities at
College Level
Co-Curricular Activities
CC Activities at College Level
Percent of CC Activities at
College Level Critical Thinking 9434 7907 83.8% 745 663 89.0% Information Literacy 18223 15263 83.8% 1442 1268 87.9% Oral Communication Reading 5072 4200 82.8% 392 346 88.3% Writing 11995 9954 83.0% 882 734 83.2%
College Wide Learning Outcomes for ECE students participating in co‐curricular have a higher percentage rate than those who do not participate in co‐curricular areas.
There are no honors courses in the ECE program.
X.ProgramResources
Resources required are addressed in the formative recommendations throughout the APR
narrative and are also discussed in the final recommendations section. These include (a)
personnel, (b) access to more granular data, and (c) availability to submit more courses in the
queue in throughout the year for major revision to ensure alignment of courses with text
(major) revisions and relevant content to compete in a competitive online environment.
Specific resources are delineated by those that have a financial implication and those that do
not. A request for Prop 301 monies to execute recommendations is contained in the final
recommendations.
ECE students have access to the following academic and social‐emotional supports:
Advisement, Computer Lab, Counseling, Disability Services, Instructional Help Desk, Library,
Student Services at Communiversity locations, Technology Help Desk, and Tutoring, and the
Oral and Writing Lab (OWL) through the online Library. In addition, the College provides
advising services for military personnel and veterans. Student Life and Leadership activities are
available to all ECE students offering them opportunities to stay connected, add value to their
academic experiences, and make a difference in other peoples' lives. Links to these services are
found on each ECE student’s Rio Compass Homepage. ECE Engagement Specialists are assigned
to each student to work with and be a resource for the student from enrollment through
graduation. Each student works with the same Engagement Specialist throughout his or her
program. Responsibilities of the Engagement Specialist include all aspects of coaching and
guidance to provide students with the individual supports needed for course and program
success to include persistence and completion.
41
Rio Salado student Engagement Specialist services are provided to all ECE students who are
active certificate or degree seekers. The level of support is dependent on the student’s needs.
Engagement Specialists work with students from the first course they are enrolled in within the
ECE program through graduation. Engagement Specialists work with students throughout
course work including internship approval, enrollment, and graduation application and follow
up to retain and engage students.
The program employs content experts for course delivery and development including revisions.
All instructors are required to complete a Rio Salado College orientation. The Department of
Early Childhood Education and Human Development offers training for its adjunct instructors
including those who teach in the ECE program.
The ECEHD Department is supported by a staff of nine personnel resources (including the chair)
for both the ECE, HD, and FLE programs. This includes a Faculty Chair, a Senior Manager, an
Administrative specialist, a Program Analysist, an Instructional Services Coordinators, an
Instructional Design Analyst and three Student Service Specialists. Of these, seven are funded
through Rio Salado College and two are funded through grant or Prop 301 monies.
Included in Rio Salado College’s new faculty orientation, faculty receive training on the RioLearn
LMS. All faculty in the ECE program are required to update their contact and professional
teaching philosophy and other information in LMS system; faculty are monitored for
compliance. All who teach classes recently updated all information according to Rio Salado’s
policy and procedures.
Students enrolled in the ECE face‐to‐face, hybrid, and online courses represent the full diversity
of students found at most colleges and universities who also need opportunities to engage in
co‐curricular activities with peers. Toward that end, the Rio Salado has created an honors
program and a number of interest organizations. At this time, the ECE does not have co‐
curricular programs specifically affiliated with its curriculum. However, students in the program
have access to all the Student Services and co‐curricular programs and services offered through
Rio Salado College.
As previously noted, each student enrolled in the program is assigned an Engagement Specialist
(Student Services Specialist). The role of Engagement Specialist is to support the student from
the first day of class. This includes all students who are pursuing a certificate or degree or those
taking a single class. The Engagement Specialist helps the first‐time‐enrolled student navigate
all issues related to first time enrollment in the program. These may include, but are not limited
to, welcoming each student into the program; encouraging each student throughout his or her
first class; weekly checks and emails if students have missing assignments; helping students
42
with program and enrollment decisions; and assisting students with accessing and navigating
the LMS.
Finally, in all courses links are provided in the course syllabus to the library, disabilities services,
and student solution services. Similarly, links to specific library resources are provided in each
course lesson.
XI.ProgramRecommendations,Decisions,andActionPlans
a.ProgramBestPractices
The Early Childhood Education Program prides itself on the support and professional
opportunities provided to adjuncts. Adjuncts are an integral component of the program and are
valued as such. Supports such as the ECEHD Help Desk and All Faculty Meetings are
intentionally designed to align with Rio Salado Core Practices of Learning, Innovating, and
Partnering.
Next, the Engagement Specialist program was redesigned in the 2015 – 2016 academic year to
provide students with a seamless and integrated approach to support students as they
matriculate through the program to complete their studies. Each student is assigned an
Engagement Specialist who works with the student throughout the program to help ensure
student success, retention, persistence and completion. Data (e.g., classes completed, GPA, and
the like) is collected monthly and yearly. This data provides a formative measure of student
progress toward achieving persistence, retention, and completion benchmarks.
Finally, the department began revising assignment rubrics to more closely align with student
learning goals, course competencies, and assignments. Each rubric is tailored to the
assignment’s expected outcomes and written in behavioral terms providing students with a
clear roadmap as to each assignment’s expectations.
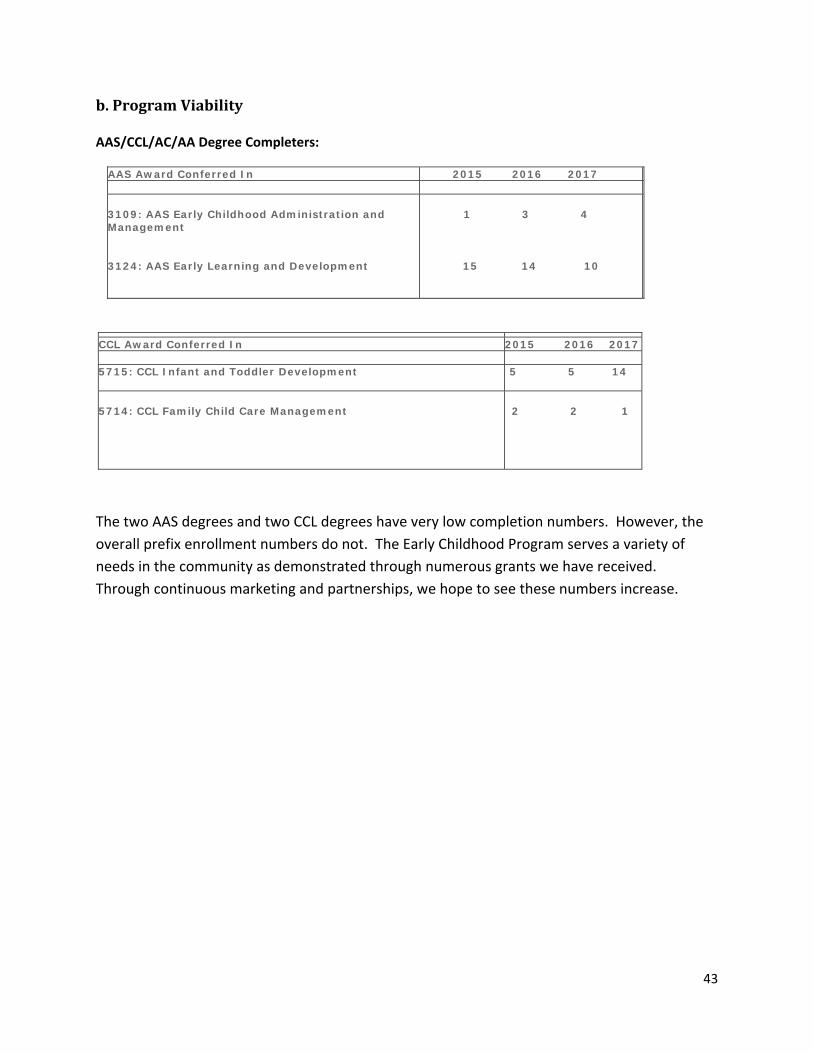
43
b.ProgramViability
AAS/CCL/AC/AA Degree Completers:
AAS Award Conferred In 2015 2016 2017 3109: AAS Early Childhood Administration and Management 3124: AAS Early Learning and Development
1 3 4
15 14 10
CCL Award Conferred In 2015 2016 2017 5715: CCL Infant and Toddler Development
5 5 14
5714: CCL Family Child Care Management
2 2 1
The two AAS degrees and two CCL degrees have very low completion numbers. However, the
overall prefix enrollment numbers do not. The Early Childhood Program serves a variety of
needs in the community as demonstrated through numerous grants we have received.
Through continuous marketing and partnerships, we hope to see these numbers increase.
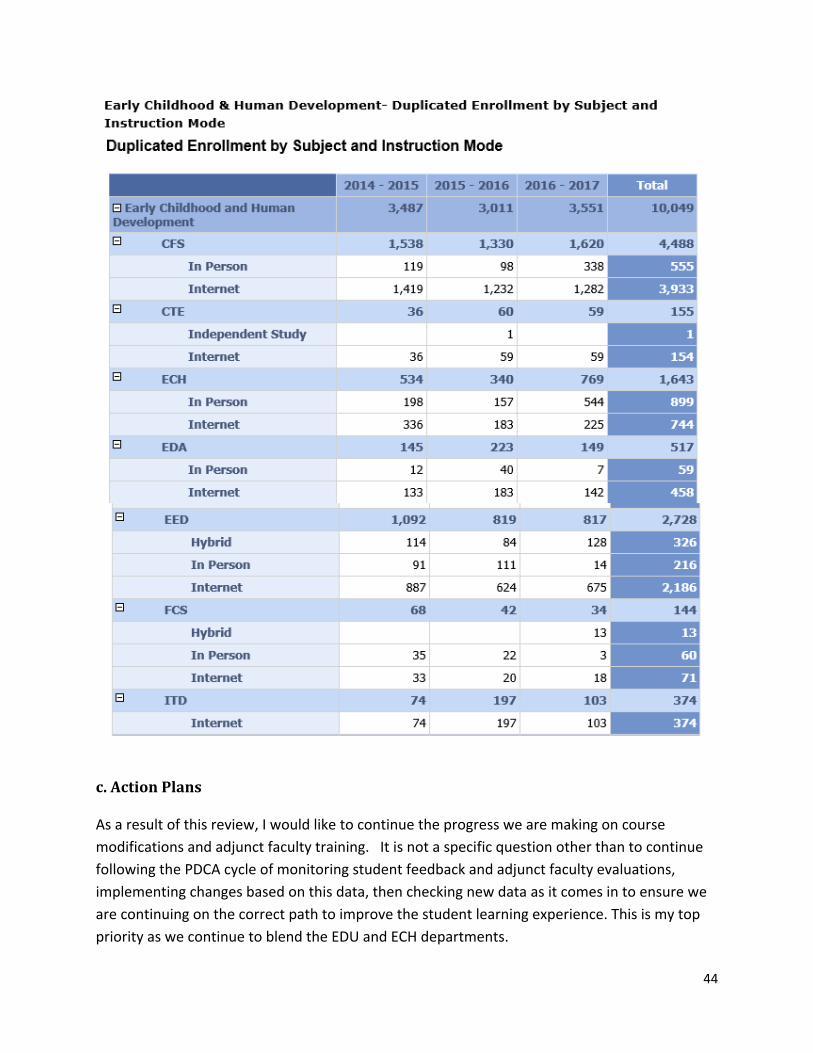
44
c.ActionPlans
As a result of this review, I would like to continue the progress we are making on course
modifications and adjunct faculty training. It is not a specific question other than to continue
following the PDCA cycle of monitoring student feedback and adjunct faculty evaluations,
implementing changes based on this data, then checking new data as it comes in to ensure we
are continuing on the correct path to improve the student learning experience. This is my top
priority as we continue to blend the EDU and ECH departments.
45
d.Recommendations
Context‐specific recommendations have been provide throughout this review (See Recommendation Lists 1 through 10).
A college wide, interactive dashboard (by discipline) to pull up instructor/course feedback through end of course surveys would make the process of reviewing data much more manageable and effective than current methods.
1. Recommendations that require Rio Salado College support
a. Marketing and / or marketer to target marketing strategies based on APR and
workforce data.
b. Increased ability to submit courses for revision in the “queue” to ensure timely and
relevant revisions imperative to attract and retain students in a competitive online
environment.
c. Access to more granular data to crosswalk and more‐specifically identify which
students are not succeeding in order to refine the role of engagement specialists and
identify the relationship between course failure and student financial aid.
2. Recommendations that require ECEHD unit support with a financial implication
a. Continue to refine and offer adjunct training based on data analysis and department
and student needs.
b. Design and implement a curricular review cycle.
c. Develop department‐specific guidelines for course developers aligned with curricular
review cycle.
d. Cross training with Rio Salado College advisors based on APR data to ensure
seamless matriculation of students to the next term and the next year.
3. Those that require ECEHD unit support without a financial implication
a. Request the continuation of a Prop 301‐funded position [Instructional Developer] to
ensure timely and relevant course revisions.
b. Request a Prop 301‐funded EPP specific marketer and recruiter position aligned with
APR data to (a) increase numbers of Hispanic students, (b) increase numbers of dual
enrollment students, and (c) increase dual enrollment high school partners.
46
References:
Ewert, S. (2009). What it’s worth: Field of training and economic status in 2009. Washington, D.C.: U.S. Department of Commerce, Economics and Statistics Administration, U.S. Census Bureau. Karp, M.M., Calcagno, J.C., Hughes, L.H., Jeong, D.W. and Bailey, T.R., (2007). The postsecondary achievement of participants in enrollment: An analysis of student outcomes in two states. St. Paul, MN: National Research Center for Career and Technical Education, University of Minnesota. Whitebook, M., McLean, C., and Austin, L.J.E. (2016). Early childhood workforce index – 2016. Berkeley, CA: Center for the Study of Child Care Employment, University of California, Berkeley.