Embed Size (px)
Citation preview

NWS State College Case Examples
Ring-of-fire convection of 10-11 April 2013 By
Richard H. Grumm and Charles Ross National Weather Service State College, PA
Abstract:
A large subtropical ridge over the western Atlantic and adjacent southern United States pumped deep moisture, strong winds, and instability into the Mississippi and Ohio Valleys then eastward across Ohio and Pennsylvania. This produced a series of early season MCS which brought strong and damaging winds to the region.
High CAPE was observed in the warm moist air over the ridge and south of a strong low-level frontal boundary. The conditions including the strong low westerly winds, deep moisture, and unseasonably high CAPE produced long lived quasi-linear convective systems. Embedded within these systems were bow echoes which accounted for most of the severe weather, from damaging winds, which affected the Mid-Atlantic region.

NWS State College Case Examples
1. Overview Flow about a strong ridge over the eastern United States and western Atlantic (Fig. 1b) brought a ring-of-fire (Weaver and Nignam 2008) severe weather event to the eastern United States on 10-11 April 2013. The surge of high precipitable water air brought severe weather from eastern Texas to southern New York (Fig. 2). Strong low-level southerly flow was present over the western Gulf States (Fig. 1c) where the precipitable water (PW) values were +1 to +2s above normal (Fig. 1d). The moisture plume and low-level winds turned eastward as the flow came over the ridge from the Ohio Valley to the East Coast. A strong 250 hPa jet was present well to the north in the gradient between the large ridge and the deep trough. The surge of high PW air (Fig. 1d) and warm temperatures (not shown) produced conditions similar to early summer than early spring. Not surprisingly, this lead to an early season severe weather event, which over Pennsylvania, included strong quasi-linear convective storms (QLCS: Weisman and Rotunno 2004). Gallus et al (2008) showed that linear convective systems tend to produce a significant number of wind reports, which most often occurred near bow echoes and squall lines. The probability if severe winds reports were higher with systems contained trailing stratiform rain. Hail is often observed too, though the size of the hail can vary widely with many events producing only marginally severe hail. Large hail is more often associated with descrete cells and stronger super-cell storms. QLCS’s require the evolution and maintenance of a cold pool (Weisman and Rotunno 2004). When a balance of the cold pool and shear is maintained, convection often occurs close to the region of convergence often referred to as the Mid-Altitude Radial Convergence (MARC) signature (Rasmussen and Rutledge 1993; Schmocker et al. 1996). Strong winds behind the MARC signature often indicated a strong rear-inflow jet. Many long-lived and damaging MCS and derecho events have this signature and can produce wind damage for several hundred kilometers. This paper will examine the ring-of-fire convection of 10-11 April 2013. The focus is on the pattern and conditions in which the event developed and the resulting severe weather over the Mid-Atlantic region.
2. Data and Methods
The large scale pattern was reconstructed using the 00-hour forecast of the NCEP Global Forecast System as first guess at the verifying pattern. The standardized anomalies were computed in Hart and Grumm (2001). All data were displayed using GrADS (Doty and Kinter 1995).

NWS State College Case Examples
Storm reports were obtained from the Storm Prediction Center. Processed SPC data was used to overlay on the anomalies and the base SPC images were used.
Radar data from the local AWIPS archive were used to make images of the radar evolutions.
3. Pattern over the region
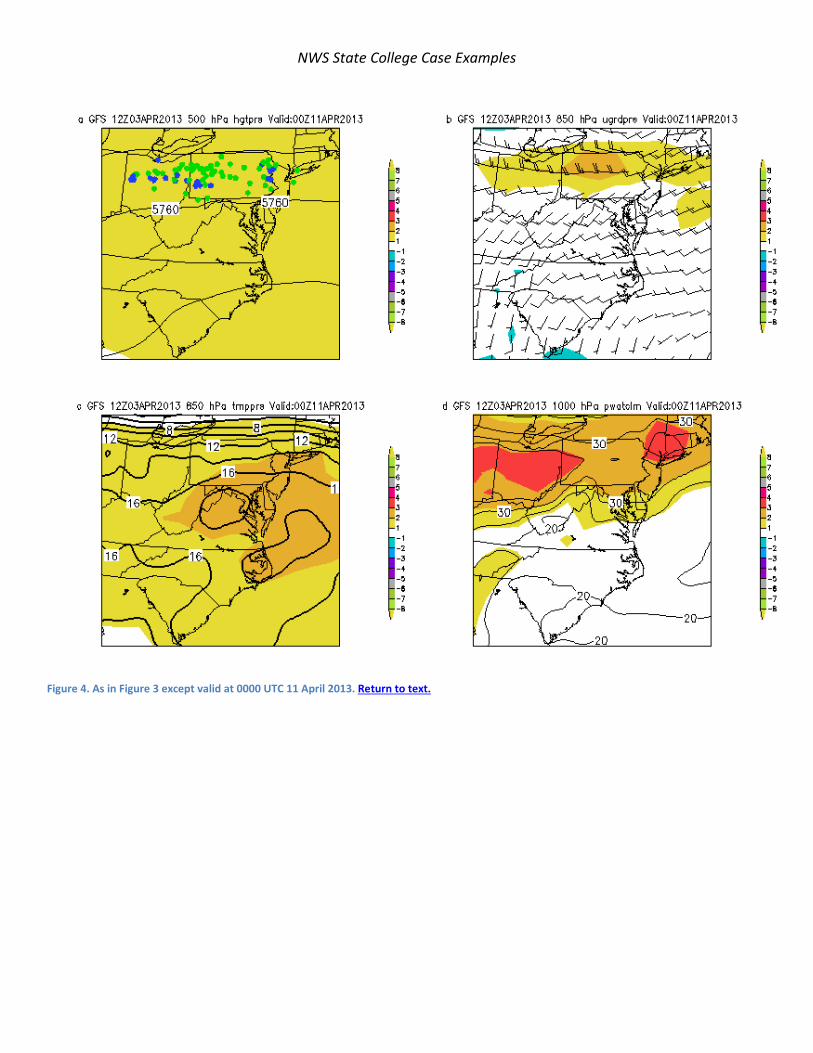
The larger scale pattern (Fig. 1) showed the early season western Atlantic ridge which produced conditions more similar to June than early April. The pattern over the region from 10/1800 UTC through 11/0600 UTC shows the anomalous 500 hPa ridge, over the top of which most of the severe weather was focused (Figs. 2-4a) and a strong low-level westerly 850 hPa jet (Figs. 2-4b). A strong frontal zone was present near the Pennsylvania-New York border (Figs. 2-4c) with a plume of deep moisture surging over the larger scale ridge on the warm side of the frontal boundary (Figs. 2-4d).
These data show that all of the severe weather occurred on the warm side of the boundary, in the plume of deep moisture and in close proximity to the low-level westerly jet rounding over the larger scale ridge. The critical issues here from a larger scale perspective was the strong winds and implied shear along with the surge of high PW air. The +2 to +3PW anomalies surged into Pennsylvania near the time of the second and more prolific wave of severe weather, which was dominated by QLCS convection with the severe weather focused near the bowing segments within the lines.
4. Convective Evolution
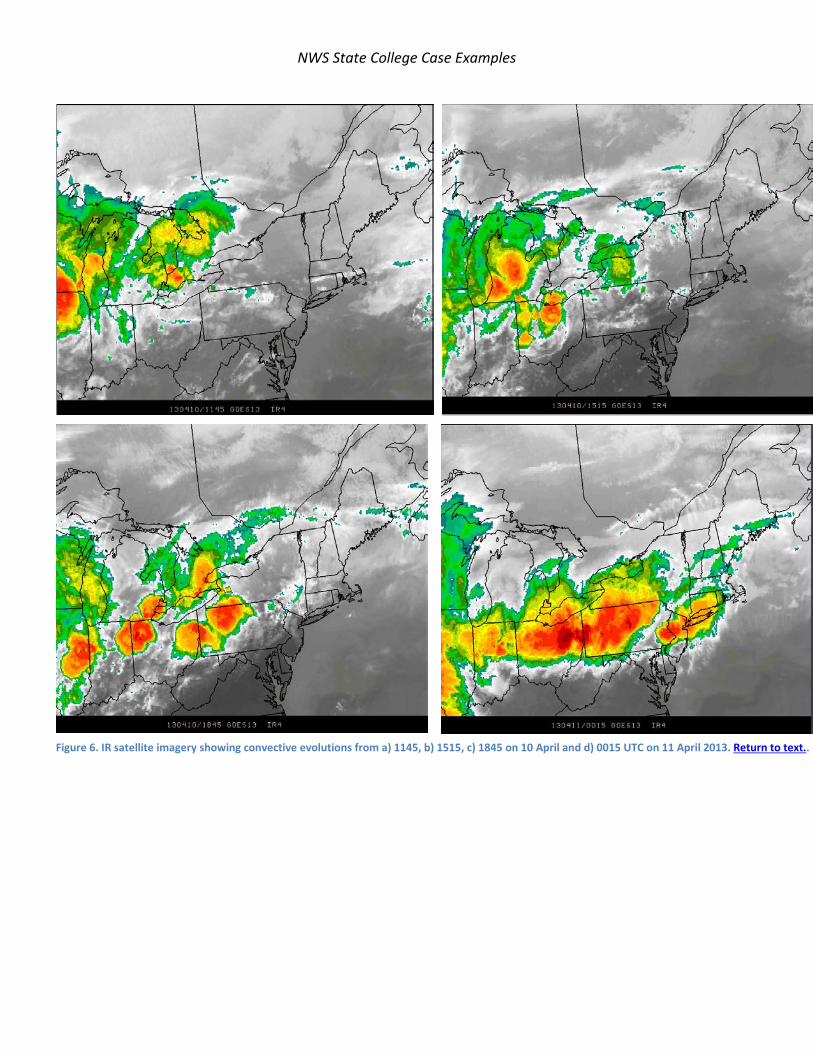
A cluster of convection over eastern Indiana (Fig. 6a) developed and organized and was located over north-central Ohio by 10/1515 UTC. This area developed from a previous system which had weakened as it exited Illinois, which then strengthened as it moved into Ohio becoming a well-developed MCS. This MCS then moved into Pennsylvania (Fig. 6d) and maintained itself all the way to the coast affecting New York and New Jersey. This system produced several reports of severe weather in western Pennsylvania where at times the 0.50 degree base velocity data indicated over 70kts of inbound winds. The system re-invigorated over eastern Pennsylvania producing wind damage reports over eastern Pennsylvania and southern New York (Fig. 2).
The second MCS to affect Pennsylvania had a more complex evolution and was the result of a merger between two MCS, one came out of Michigan and the other came out of Illinois. Similar to the earlier MCS this system too survived all the way to the coast.
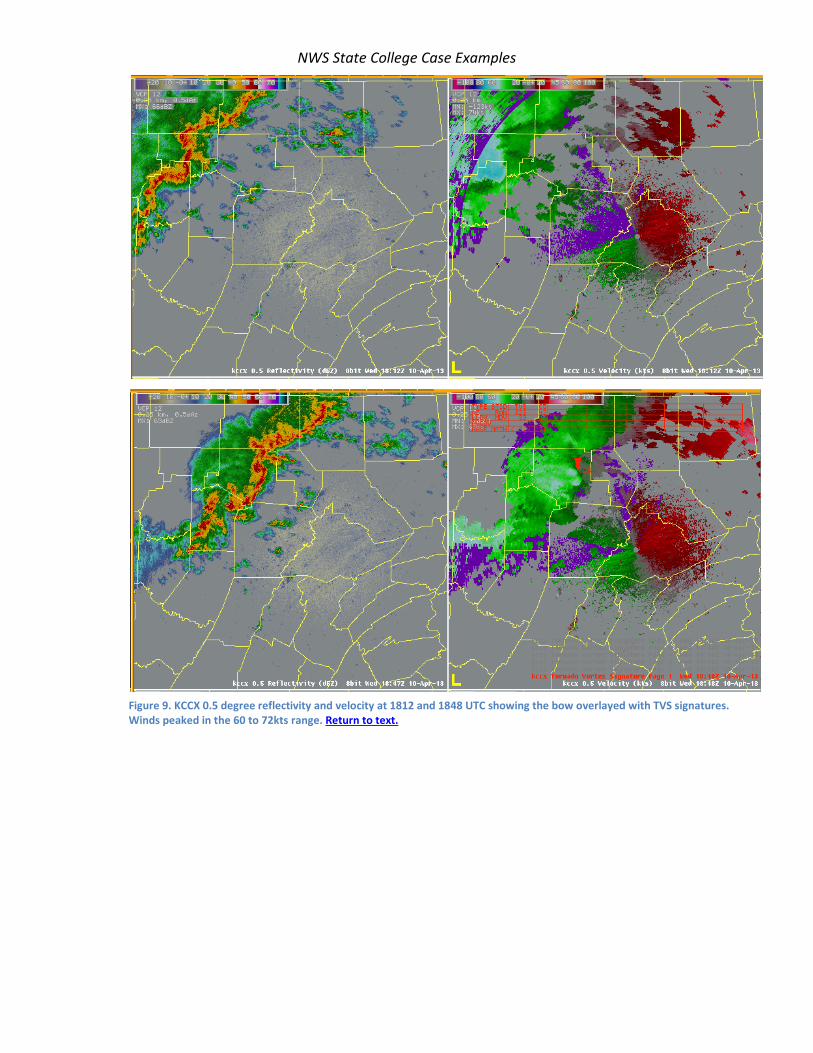
Figure 9 shows the base reflectivity and velocity at 0.5 degrees as the system moved across western Pennsylvania. The inbound velocities were in the 60 to 72kt range as the system swept into western Pennsylvania. Nearly all the reports of damaging winds were located near the apex of the bowing segments. This system weakened as it moved out of Elk County, where it was at

NWS State College Case Examples
1848 UTC (Fig. 9 lower). Looping the data revealed at TVS signature at 1827 UTC which persisted in most volume scans through 1848 UTC. TVS signature were computed over Elk and Cameron Counties. No tornado warnings were issued and no tornado reports were reported. All damage was straight line winds with 3 towns experiencing wind damage in Elk County and one in northern Clinton County. Several counties to the west also reported wind damage based on Pittsburgh, WFO reports.
Though not shown this system moved off the terrain in Lycoming County and producing wind damage. The system strengthened and produced additional reports of wind damage long its path to the coast. The path length of damage, though somewhat sporadic was over 300 miles. The damage path met the criteria for a derecho though some of the damage gaps were rather long.
It should be noted that there were other weaker lines of convection which produced rain and thunder. The second significant QLCS entered Pennsylvania later in the evening. This system had inbound and outbound winds in the 60 to 75kt range. It produced high winds, meeting severe criteria gusts at several METAR sites to include KUNV and wind gusts over 60mph1 at the National Weather Service office, about 2 miles from KUNV.
The radar imagery of this system as it approached and blew through the RDA are shown in Figure 10. The blue colors show inbound winds mainly over 60 and darker blues over 70kts. Once the system below through the RDA the lighter reds and whites indicated winds of 60 and over 70 kts.
Figure 11 shows the bow echo as it moved into the lower Susquehanna Valley. Winds behind the leading edge of convection were over 50 to 70 kts as the bow echo raced to the southeast. Though not show radar and satellite data indicated this system to reached the coastal plain.
The third MCS came later in the evening and produced one damager report in southwestern Pennsylvania. Though not a significant severe weather QLCS system, it contributed to the overally rainfall and in some locations affected by all 3 lines, it provided upwards to 50% of the total precipitation. In southern areas it accounted for all of the precipitation.
5. Summary
A large early season ridge over the western Atlantic brought unseasonably warm air and a surge of deep moisture into the eastern United States. The plume of moisture and strong winds around the massive ridge brought rain and severe weather on 10-11 April (Figs 1 &2) from the western Gulf northward into the Ohio Valley and then eastward across Ohio and Pennsylvania. A classic ring-of-fire convective event with warm season-like MCSs (Fig. 6-7) was associated with the convection from the Midwest to the Mid-Atlantic region. This event and the associated with 1 Employees at the office recorded over 5-10 minutes of high winds with sporadic wind gusts around 60 mph, working through the howling sounds of the winds blowing between the buildings. Bent signs, down trees, and power outages were reported in the swath of stronger winds in that region of State College.

NWS State College Case Examples
weather shows the power of strong ridges and their ability to transport heat and moisture poleward creating summerlike conditions and weather in early April.
The radar, satellite, and severe weather reports clearly show that to low-end derechoes affected the Mid-Atlantic region during the afternoon and again during the evening hours of 10 April 2013.
6. Acknowledgements
NWS staff for information and reports on the wind and local anemometer readings. Many storm reports came from spotters, emergency managers, and social media.
7. References
Coniglio, Michael C., Harold E. Brooks, Steven J. Weiss, Stephen F. Corfidi, 2007: Forecasting the Maintenance of Quasi-Linear Mesoscale Convective Systems. Wea. Forecasting, 22, 556–570. doi: http://dx.doi.org/10.1175/WAF1006.1
Doty, B.E. and J.L. Kinter III, 1995: Geophysical Data Analysis and Visualization using GrADS. Visualization Techniques in Space and Atmospheric Sciences, eds. E.P. Szuszczewicz and J.H. Bredekamp, NASA, Washington, D.C., 209-219.
Gallus, W.A., N.A. Snook, and E.V. Johnson, 2008: Spring and Summer Severe Weather Reports over the Midwest as a Function of Convective Mode: A Preliminary Study. Wea. Forecasting, 23, 101–113.
Johns, R. H., and W. D. Hirt, 1987: Derechos: widespread convectively induced windstorms. WeatherForecasting, 2, 32-49.
Klimowski, B.A., M.R. Hjelmfelt, and M.J. Bunkers, 2004: Radar Observations of the Early Evolution of Bow Echoes. Wea. Forecasting, 19, 727–734.
Rasmussen, E.N. and S. A. Rutledge, 1993: Evolution of Quasi-Two Dimensional Squall Lines. Part 1: Kinematic and Reflectivity Structure. J. Atmos. Sci. ,50, 2584-2606.
Schmocker, G.K., R.W. Przybylinski, and Y.J. Lin, 1996: Forecasting the initial onset of damaging downburst winds associated with a Mesoscale Convective System (MCS) using the Mid-Altitude Radial Convergence (MARC) signature. Preprints, 15th Conf. on Weather Analysis and Forecasting, Norfolk VA, Amer. Meteor. Soc., 306-311.
Weisman, M. L., and R. Rotunno, 2004:“A theory for strong long-lived squall lines” revisited. J. Atmos. Sci.,61,361–382.

NWS State College Case Examples
——, J. B. Klemp, and R. Rotunno, 1988: Structure and evolution of numerically simulated squall lines. J. Atmos. Sci., 45, 1990–2013

NWS State College Case Examples
Weaver, S. C., and S. Nigam, 2008: Variability of the Great Plains low level jet: Large scale circulation context and hydroclimate impacts. J. Climate,21,1532–1551.
Figure 1. The GFS 00-hour forecasts showing the pattern over the United States at valid at 0000 UTC 11 April 2013 showing a) 250 hPa winds and 250 hPa u-wind anomalies, b) 500 hPa heights and height anomalies with Storm Prediction Center storm reports overlayed, c) 850 hPa winds and 850 hPa v-wind anomaies, and d) precipitable water and precipitable water anomalies. Storm reports are color coded by type green for wind, blue for hail and red for tornado. Return to text.

NWS State College Case Examples
Figure 2. Strom reports from the Storm Prediction Center for 10 April 2013. Return to text.

NWS State College Case Examples
Figure 3. As in Figure 1 except valid at 1800 UTC 10 April 2013 showing a) 500 hPa heights and anomalies with severe reports, b) 850 hPa winds and u-wind anomalies, c) 850 hPa temperatures and temperature anomalies, and d) precipitable water and anomalies. Return to text.
NWS State College Case Examples
Figure 4. As in Figure 3 except valid at 0000 UTC 11 April 2013. Return to text.

NWS State College Case Examples
Figure 5. As in Figure 3 except valid at 0600 UTC 11 April 2013. Return to text.
NWS State College Case Examples
Figure 6. IR satellite imagery showing convective evolutions from a) 1145, b) 1515, c) 1845 on 10 April and d) 0015 UTC on 11 April 2013. Return to text..

NWS State College Case Examples
Figure 7. As in Figure 6 except valid at 2115 UTC 10 April and 0015 UTC 11 April. Upper panel shows the initial MCS over eastern Pennsylvania, the MCS which came out of Michigan over central Pennsylvania and the back edge of this system building into yet a third MCS. Lower panels show the older MCS over the coast and the complex interaction of the two trailing MCSs over Pennsylvania. Return to text.
NWS State College Case Examples
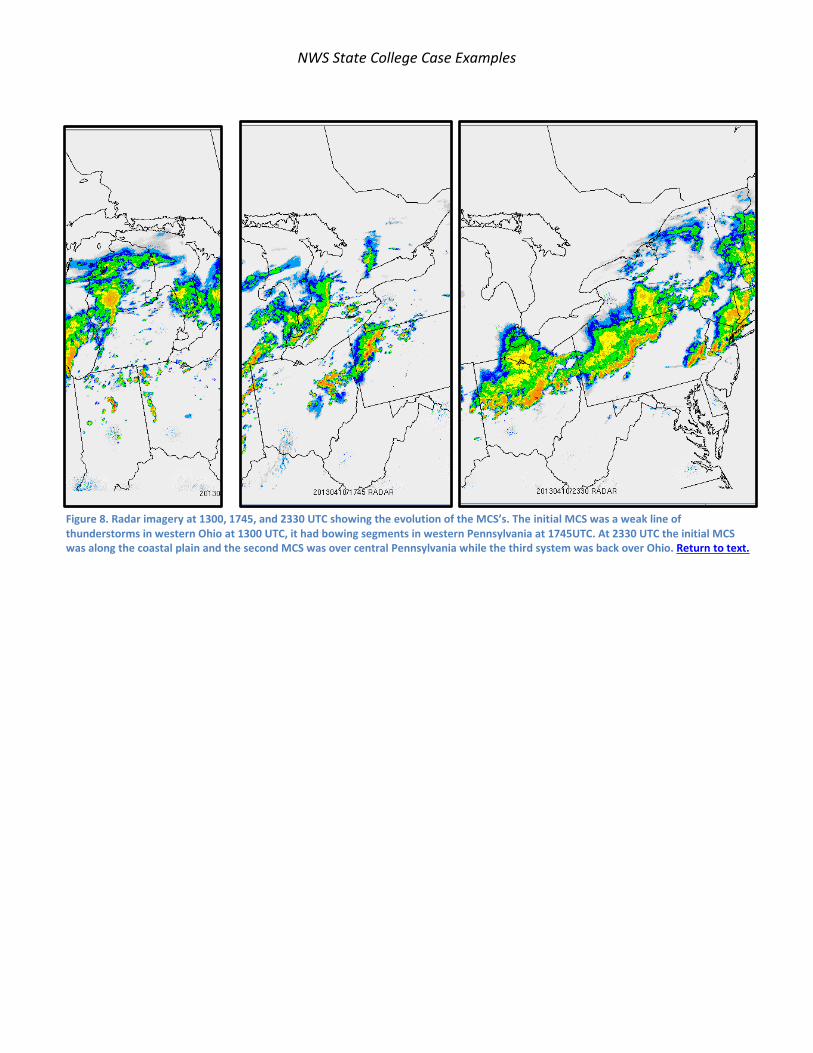
Figure 8. Radar imagery at 1300, 1745, and 2330 UTC showing the evolution of the MCS’s. The initial MCS was a weak line of thunderstorms in western Ohio at 1300 UTC, it had bowing segments in western Pennsylvania at 1745UTC. At 2330 UTC the initial MCS was along the coastal plain and the second MCS was over central Pennsylvania while the third system was back over Ohio. Return to text.
NWS State College Case Examples
Figure 9. KCCX 0.5 degree reflectivity and velocity at 1812 and 1848 UTC showing the bow overlayed with TVS signatures. Winds peaked in the 60 to 72kts range. Return to text.

NWS State College Case Examples
Figure 10. As in Figure 9 except for the second bow echo as it approached and blew through the RDA. Images valid at 2322 UTC, 2336 UTC and 2349 UTC. Return to text.

NWS State College Case Examples
Figure 11. As in Figure 10 except the system at 0017 and 0054 UTC as it move into the lower Susquehanna Valley. Return to text.

NWS State College Case Examples
Weisman and Rotunno 2004

NWS State College Case Examples

NWS State College Case Examples

NWS State College Case Examples

NWS State College Case Examples