Embed Size (px)
Citation preview
Rinat Ofer
Supervisor: Amit Keren
Outline Outline
Motivation.
Magnetic resonance for spin 3/2 nuclei.
The YBCO compound.
Three experimental methods and their
results.
Summary and conclusions.
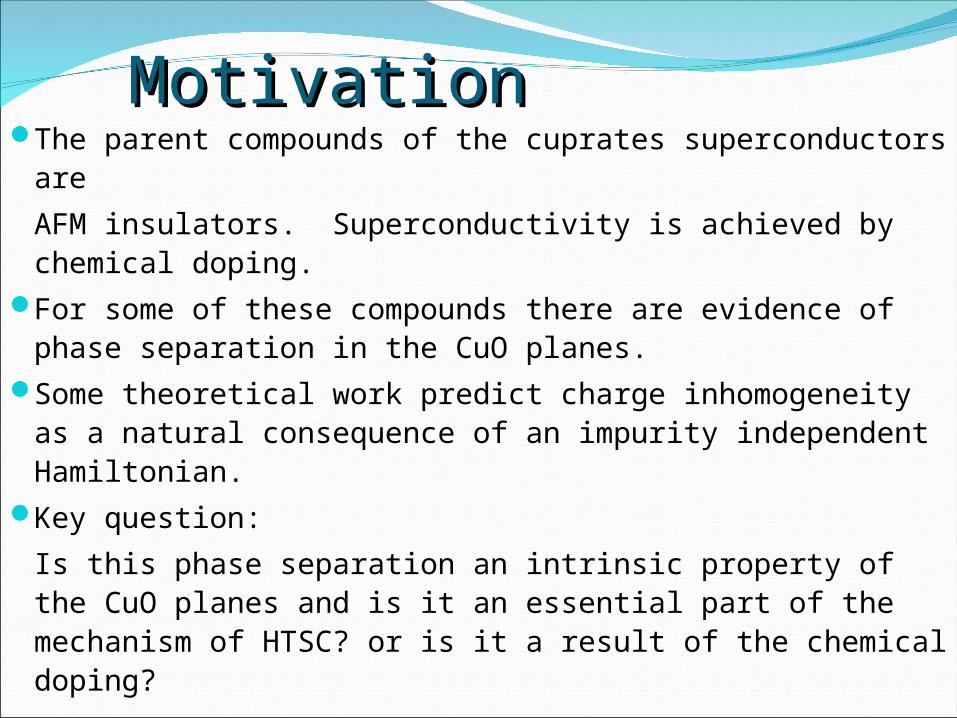
MotivationMotivationThe parent compounds of the cuprates superconductors
are
AFM insulators. Superconductivity is achieved by chemical doping.
For some of these compounds there are evidence of phase separation in the CuO planes.
Some theoretical work predict charge inhomogeneity as a natural consequence of an impurity independent Hamiltonian.
Key question:
Is this phase separation an intrinsic property of the CuO planes and is it an essential part of the mechanism of HTSC? or is it a result of the chemical doping?
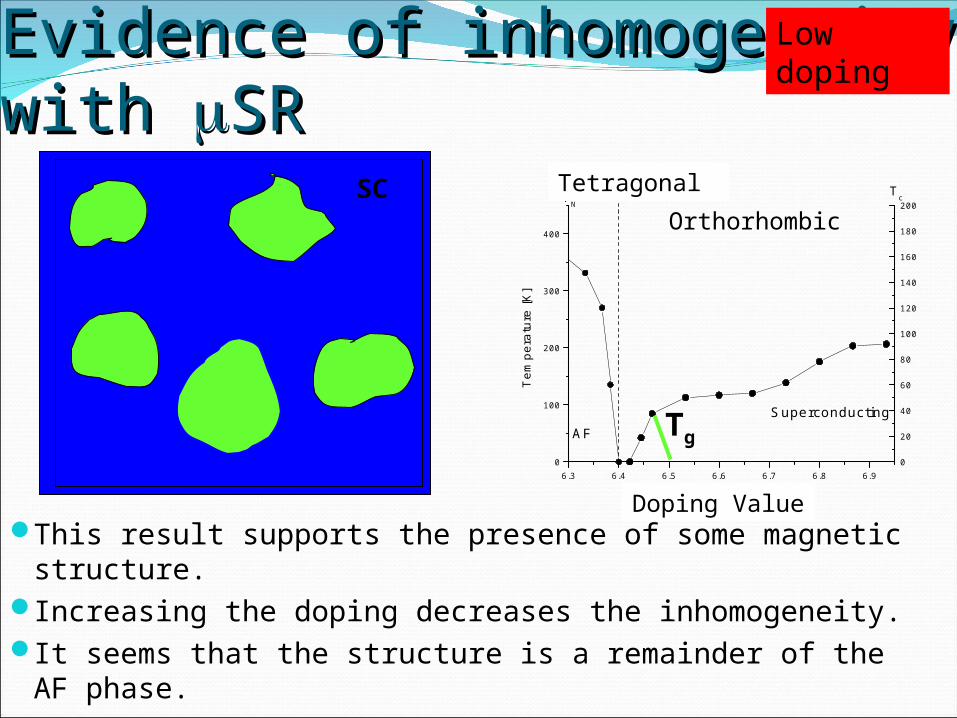
Evidence of inhomogeneity with Evidence of inhomogeneity with SRSR
This result supports the presence of some magnetic structure.
Increasing the doping decreases the inhomogeneity.It seems that the structure is a remainder of the AF
phase.
Low doping
6.3 6.4 6.5 6.6 6.7 6.8 6.90
100
200
300
400
AF
Tem
pera
ture
[K]
Doping value - y
Tc
Superconducting
OrthorhombicTetragonal
TN
0
20
40
60
80
100
120
140
160
180
200
Doping Value
Tetragonal
Orthorhombic
Tg
SCSC
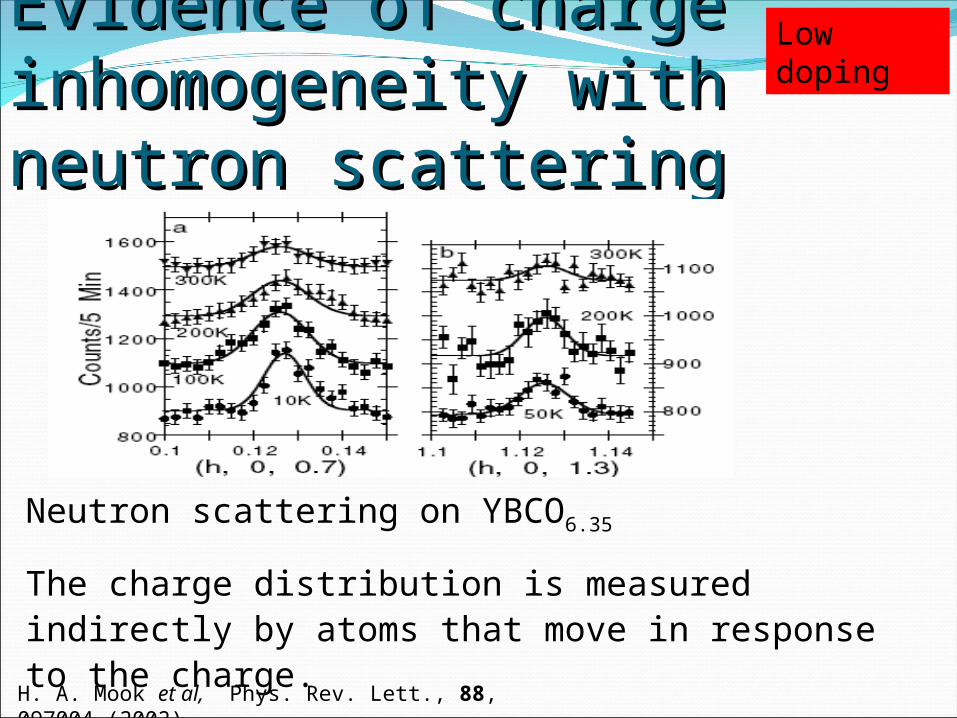
Evidence of charge inhomogeneity Evidence of charge inhomogeneity with neutron scatteringwith neutron scattering
H. A. Mook et al, Phys. Rev. Lett., 88, 097004 (2002)
Neutron scattering on YBCO6.35
The charge distribution is measured indirectly by atoms that move in response to the charge.
Low doping
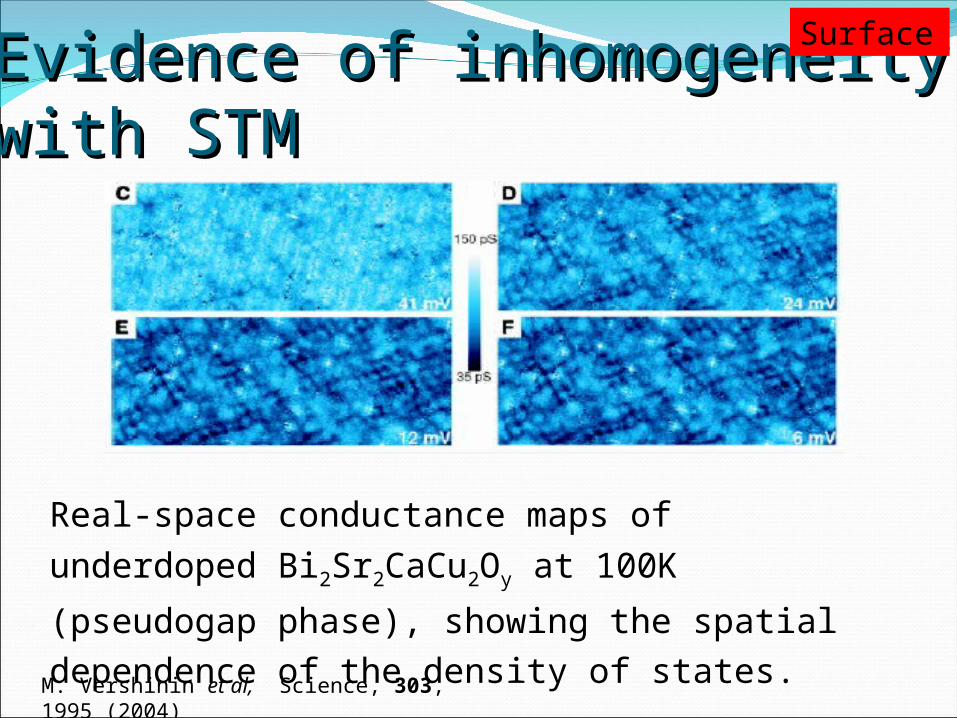
Evidence of inhomogeneity with STMEvidence of inhomogeneity with STM
Surface
M. Vershinin et al, Science, 303, 1995 (2004)
Real-space conductance maps of underdoped
Bi2Sr2CaCu2Oy at 100K (pseudogap phase),
showing the spatial dependence of the density of states.
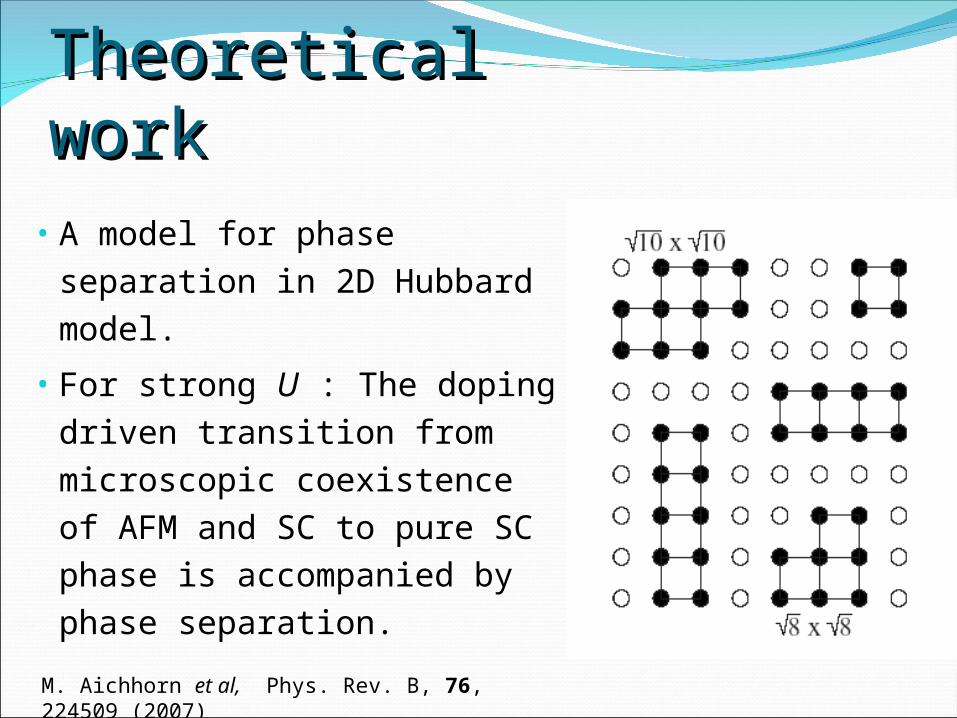
Theoretical workTheoretical work• A model for phase
separation in 2D Hubbard model.
• For strong U : The doping driven transition from microscopic coexistence of AFM and SC to pure SC phase is accompanied by phase separation.
M. Aichhorn et al, Phys. Rev. B, 76, 224509 (2007)
The problemThe problem
There is no clear correlation or anti-correlation between the dopant atoms and charge inhomogeneity.
Plan of operationPlan of operationMagnetic resonance experiment:
charge distribution in the bulk and not just on the surface.
NQR measurements on the Cu nuclei,
the charge distribution in the Cu-O planes.
The YBCO compound:
narrow NQR resonance lines,
distinguish between the different Cu resonance lines.

A nucleus under magnetic field :
Energy levels:
Transitions between the levels are forced by a rf magnetic field perpendicular to the static field.
A nucleus in solid additional interactions shift the energy levels.
We will focus on the quadrupole interaction.
NNuclear uclear MMagnetic agnetic RResonance esonance 0ˆH z
0 0 zH H Im g= - × = -rr
hH
0 0Hw g=
0 , 1...,E H m m I I I
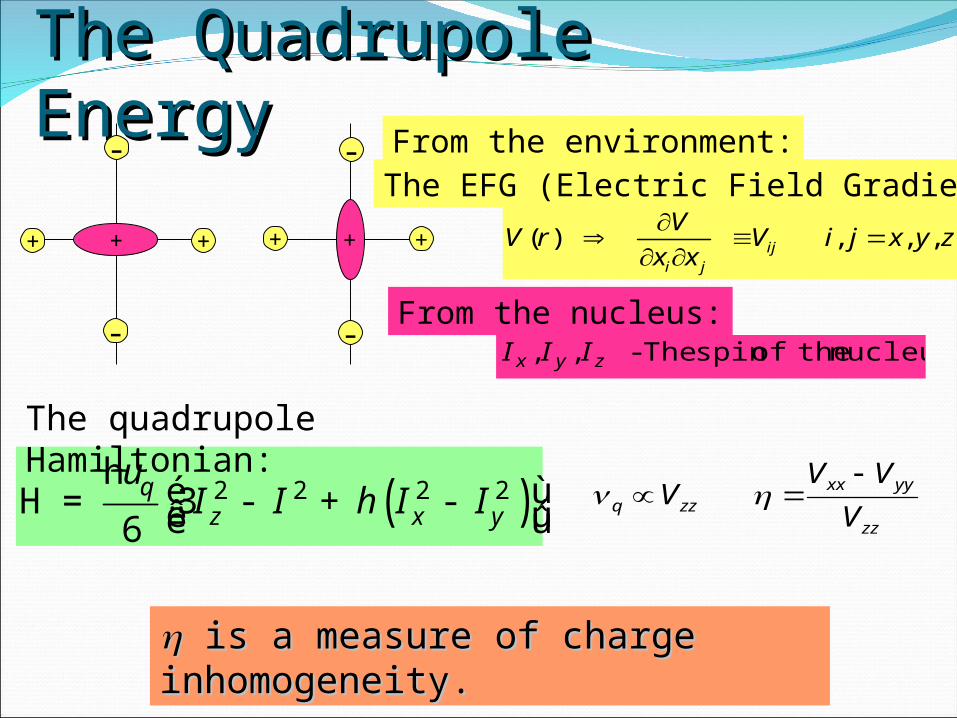
The Quadrupole EnergyThe Quadrupole Energy
( ) , , ,iji j
VV r V i j x y z
x x
nucleus theofspin The - ,, zyx III
The EFG (Electric Field Gradient):
-
+
-
+
-
-
+ ++ +
From the environment:
From the nucleus:
zz
yyxxzzq V
VVV
( )2 2 2 23
6q
z x yI I I Iu
hé ù= - + -ê úë ûh
H
is a measure of charge is a measure of charge inhomogeneity. inhomogeneity.
The quadrupole Hamiltonian:
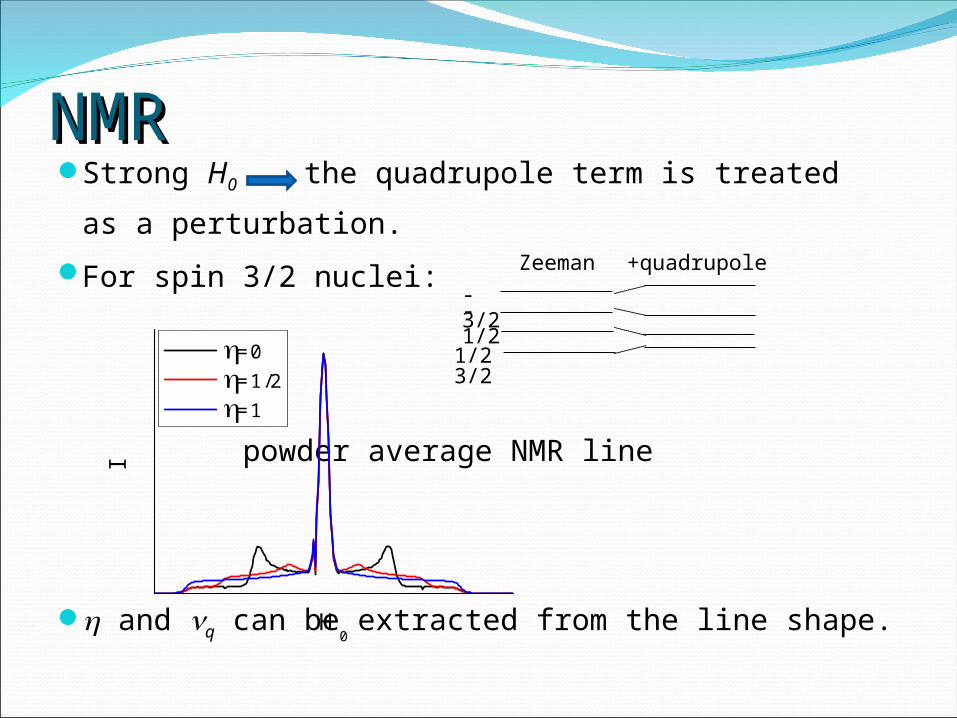
NMRNMRStrong H0 the quadrupole term is treated as a
perturbation.
For spin 3/2 nuclei:
powder average
NMR line
and q can be extracted from the line shape.
I
H0
=0 =1/2 =1
-3/2-1/2
1/2 3/2
Zeeman +quadrupole
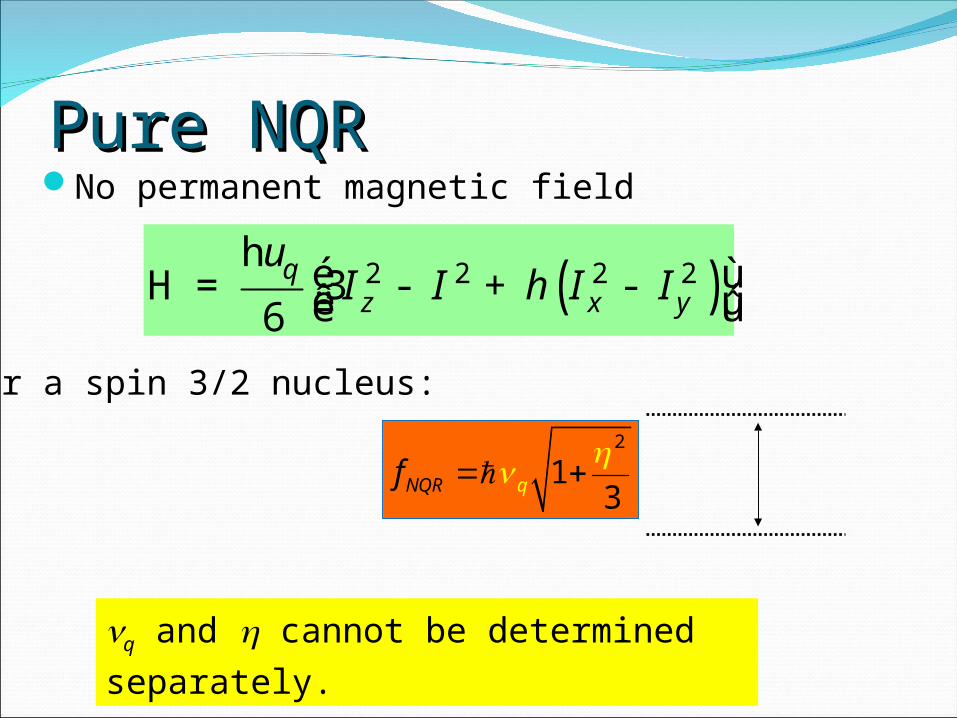
Pure NQRPure NQRNo permanent magnetic field
For a spin 3/2 nucleus:
2
13NQR qf
q and cannot be determined
separately.
( )2 2 2 236q
z x yI I I Iu
hé ù= - + -ê úë ûh
H
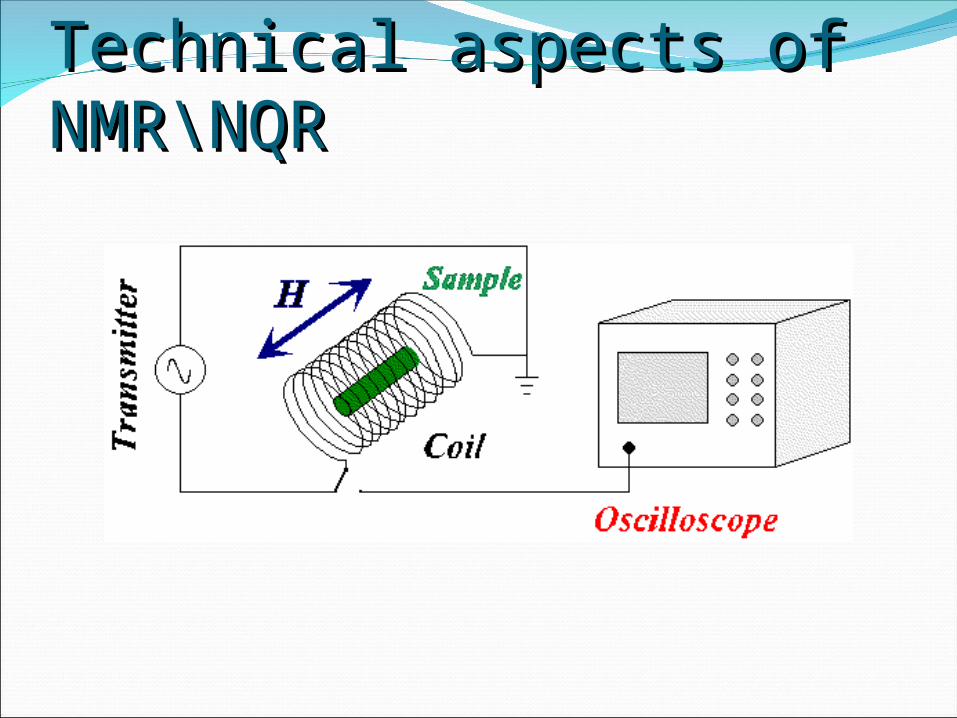
Technical aspects of NMR\NQRTechnical aspects of NMR\NQR
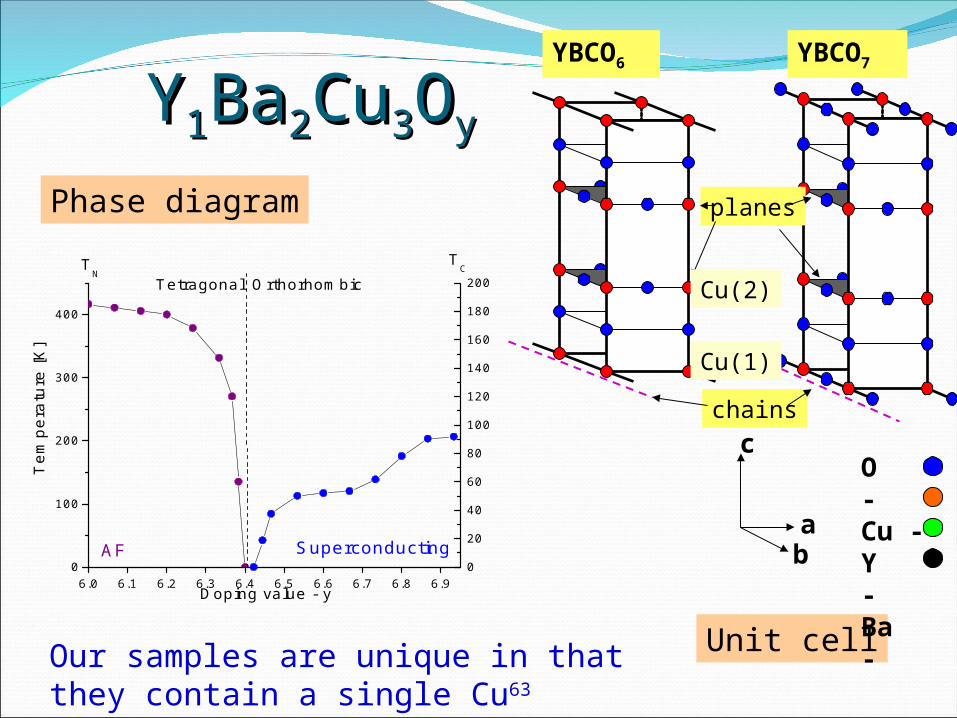
YY11BaBa22CuCu33OOyy
Phase diagram
6.0 6.1 6.2 6.3 6.4 6.5 6.6 6.7 6.8 6.90
100
200
300
400
AF
Te
mp
era
ture
[K
]
Doping value - y
TC
Superconducting
OrthorhombicTetragonalT
N
0
20
40
60
80
100
120
140
160
180
200
Unit cell
O -Cu -Y -Ba -b
a
c
YBCO6 YBCO7
planes
chains
Cu(2)
Cu(1)
Our samples are unique in that they contain a single Cu63 isotope and not two.
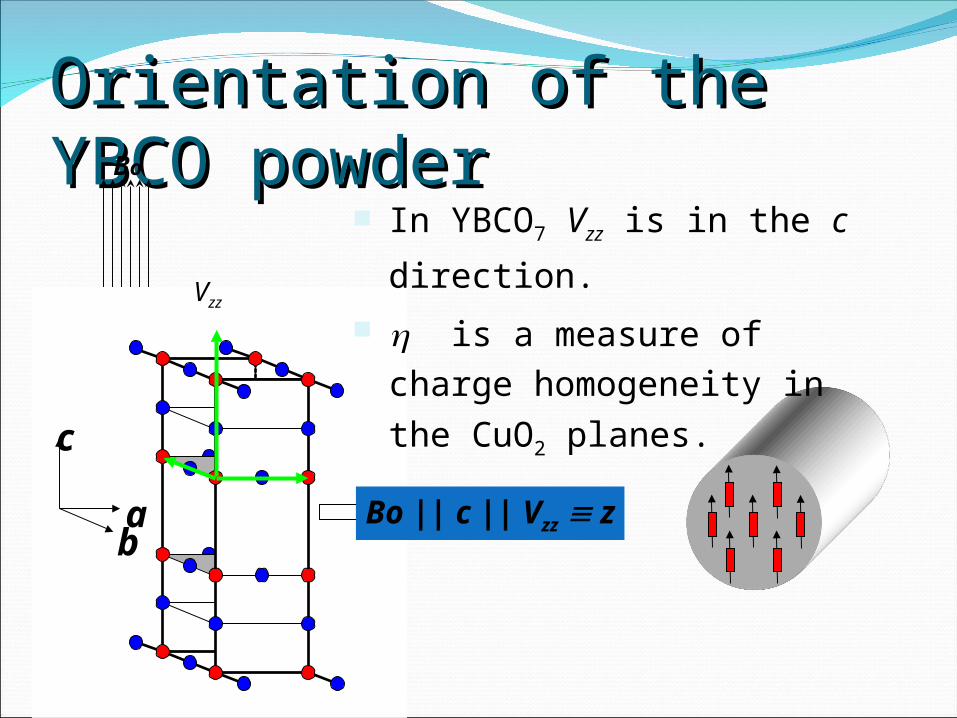
Orientation of the YBCO powderOrientation of the YBCO powderBo
b a
c Vzz
ba
c
Vzz
Bo || c || Vzz z
In YBCO7 Vzz is in the c
direction.
is a measure of charge
homogeneity in the CuO2
planes.
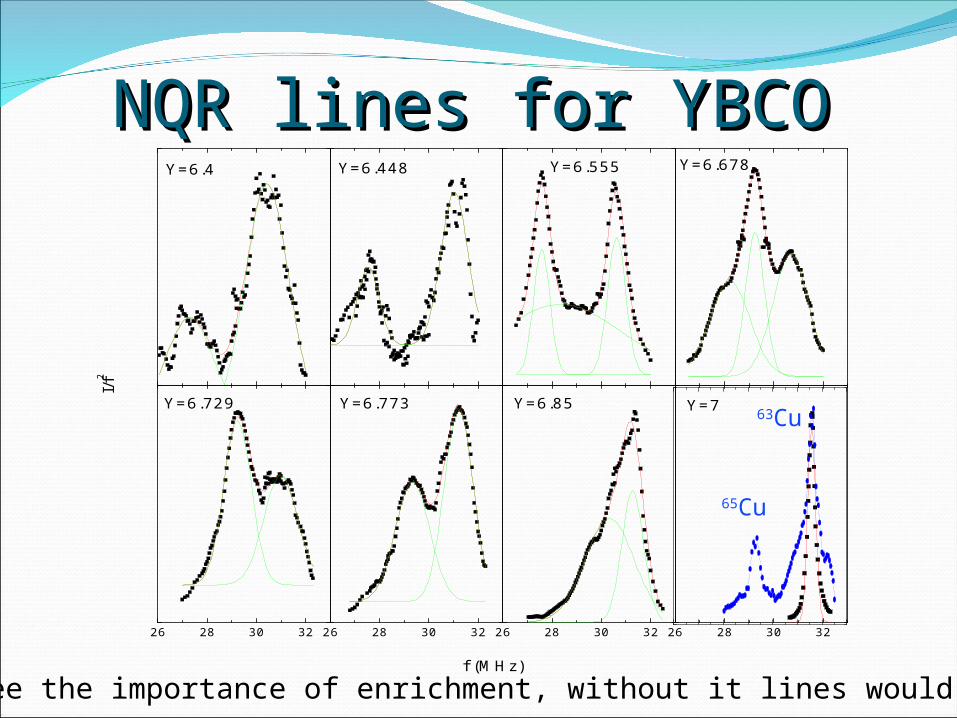
NQR lines for YBCO NQR lines for YBCO
26 28 30 32 26 28 30 32 26 28 30 32 26 28 30 32
I/f2
Y=6.4
Y=6.448
Y=6.555
Y=6.678
f (MHz)
Y=6.729
Y=6.773
Y=6.85
Y=7
One can see the importance of enrichment, without it lines would overlap.
63Cu
65Cu
27 28 29 30 31 32
6.4
6.5
6.6
6.7
6.8
6.9
7.0
y
f (MHz)
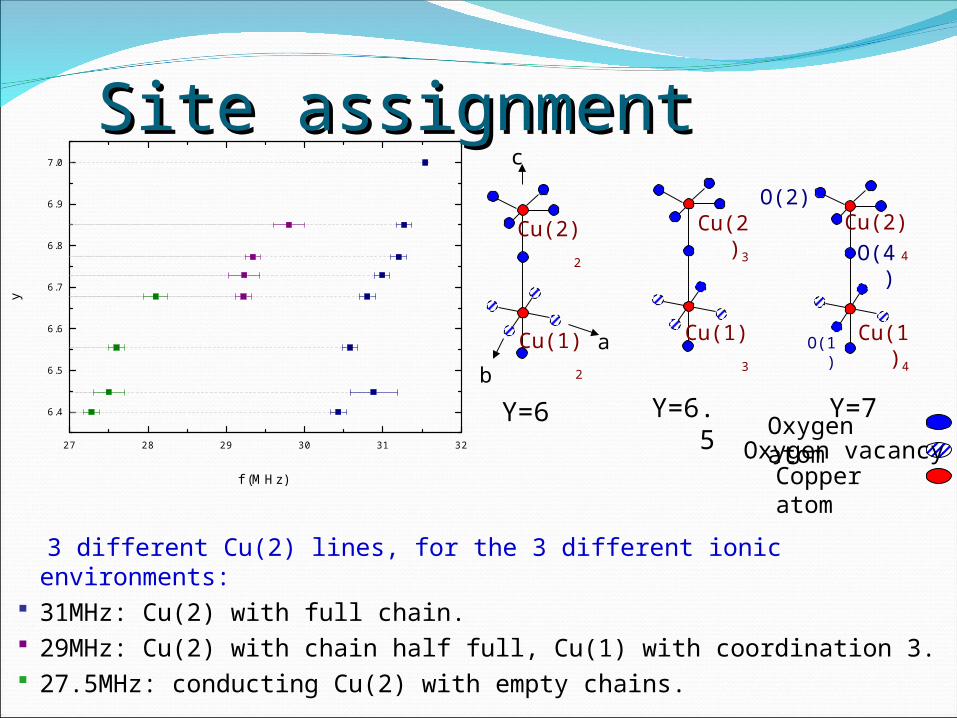
Site assignmentSite assignment
3 different Cu(2) lines, for the 3 different ionic environments: 31MHz: Cu(2) with full chain. 29MHz: Cu(2) with chain half full, Cu(1) with coordination 3. 27.5MHz: conducting Cu(2) with empty chains.
Y=7
O(2)
O(4)
O(1)
Cu(2)4
Cu(1)4
Y=6.5
Cu(2)3
Cu(1)3
c
a
Y=6
b
Cu(2)2
Cu(1)2
Oxygen atomOxygen vacancy
Copper atom
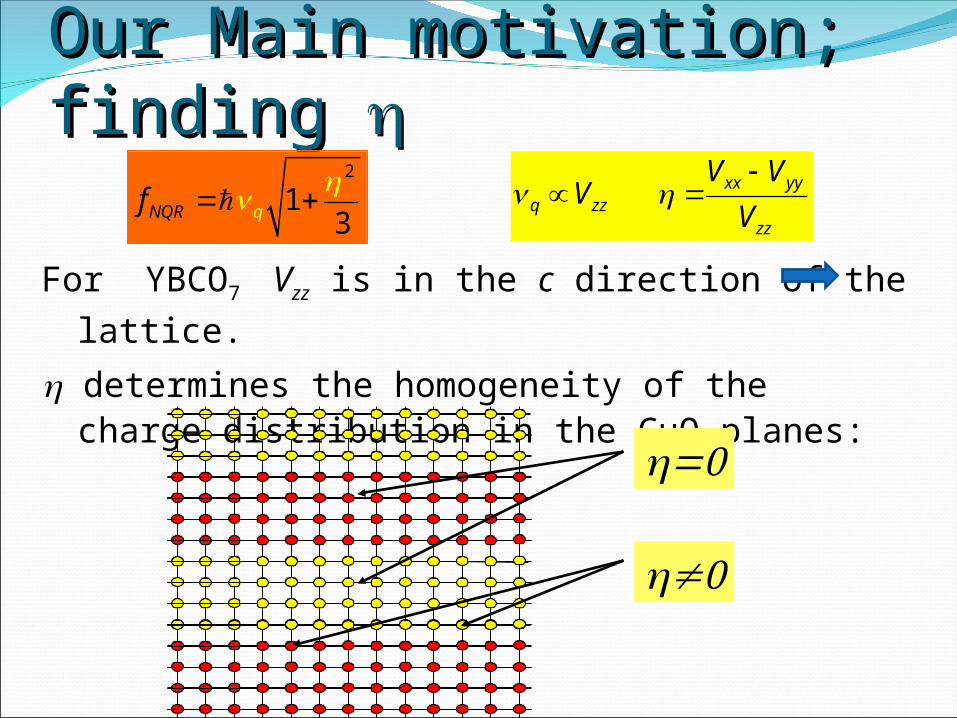
For YBCO7 Vzz is in the c direction of the lattice.
determines the homogeneity of the charge distribution in the CuO planes:
Our Main motivation; finding Our Main motivation; finding 2
13NQR qf
zz
yyxxzzq V
VVV
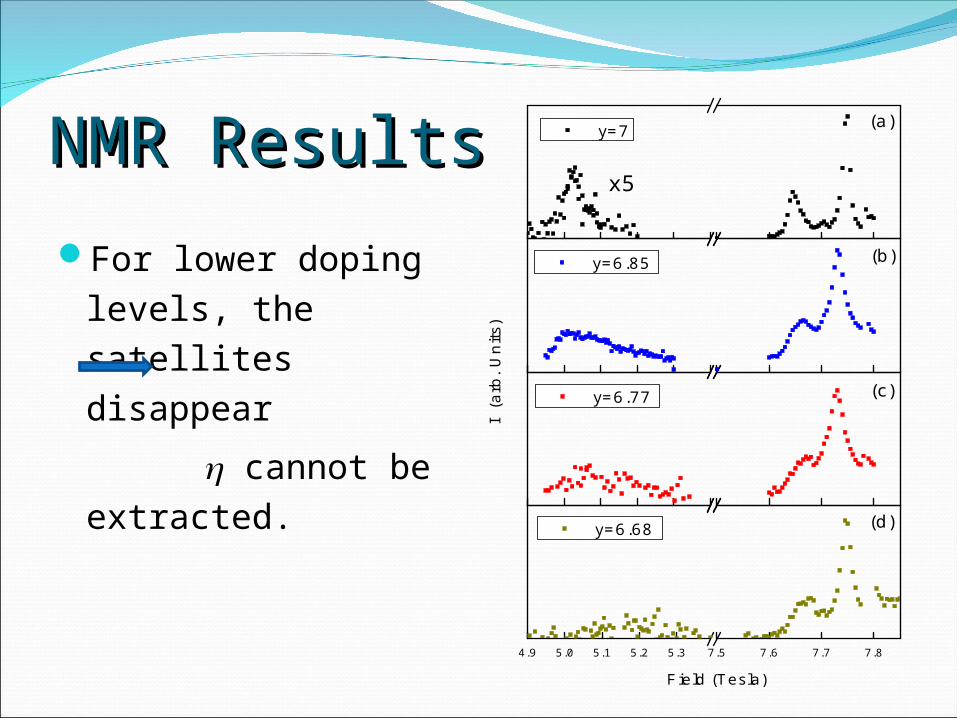
NMR ResultsNMR ResultsFor lower doping
levels, the satellites disappear
cannot be extracted.
4.9 5.0 5.1 5.2 5.3 7.5 7.6 7.7 7.8
(a)
Field (Tesla)
y=7
x5
(b)
y=6.85
(c)
y=6.77
I (
arb.
Uni
ts)
(d)
y=6.68
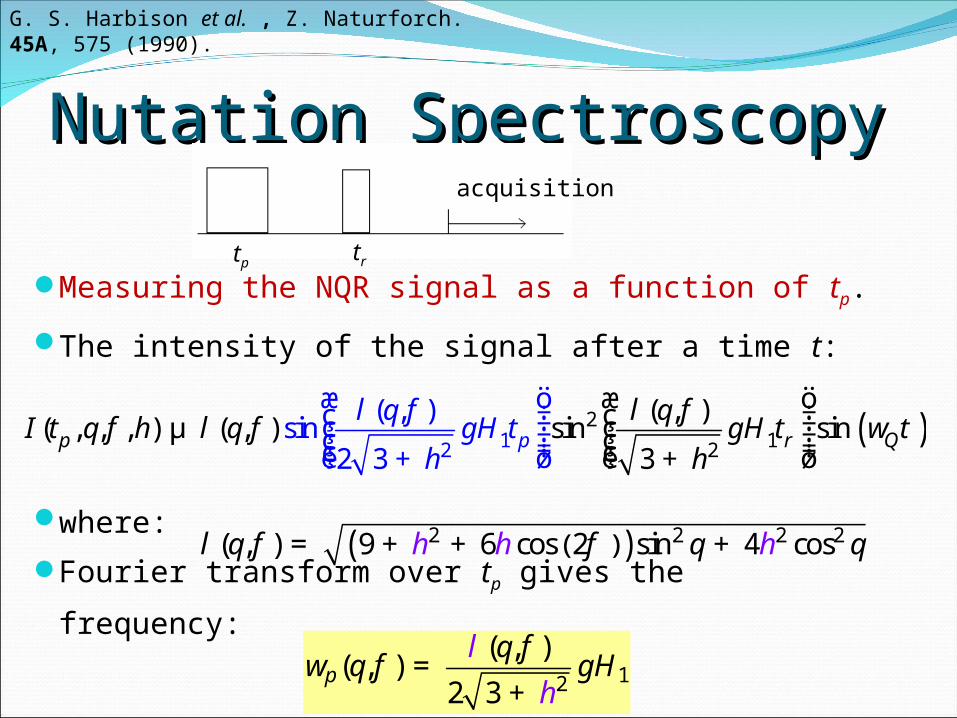
Measuring the NQR signal as a function of tp.
The intensity of the signal after a time t:
where:
Fourier transform over tp gives the frequency:
Nutation SpectroscopyNutation Spectroscopy
( )112
2
2
( , )s
( , )( , , , ) ( , ) sinin
2 3sin
3p r QpH tI t H t t
l q fq f h l q f g w
h
l q fg
h
æ ö÷ç ÷ç ÷ç ÷÷çè ø
æ ö÷ç ÷çµ ÷ç ÷÷è ø++ ç
( )( )2 2 2 2( , ) 9 6 cos 2 sin 4 cosl q q qh f hf h= + + +
12
( , )( , )
2 3p H
q fw q f
l
hg=
+
tp tr
acquisition
G. S. Harbison et al. , Z. Naturforch. 45A, 575 (1990).
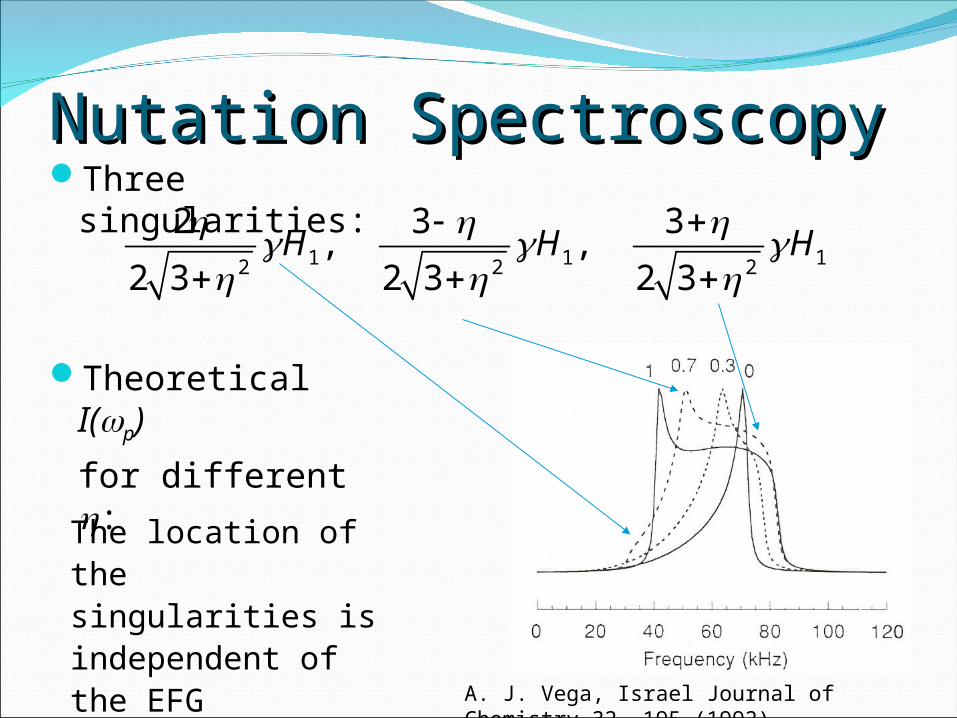
Nutation SpectroscopyNutation Spectroscopy
A. J. Vega, Israel Journal of Chemistry 32, 195 (1992)
Three singularities:
Theoretical I(p)
for different :
The location of the singularities is independent of the EFG orientation.
1 1 12 2 2
2 3 3, ,
2 3 2 3 2 3H H H
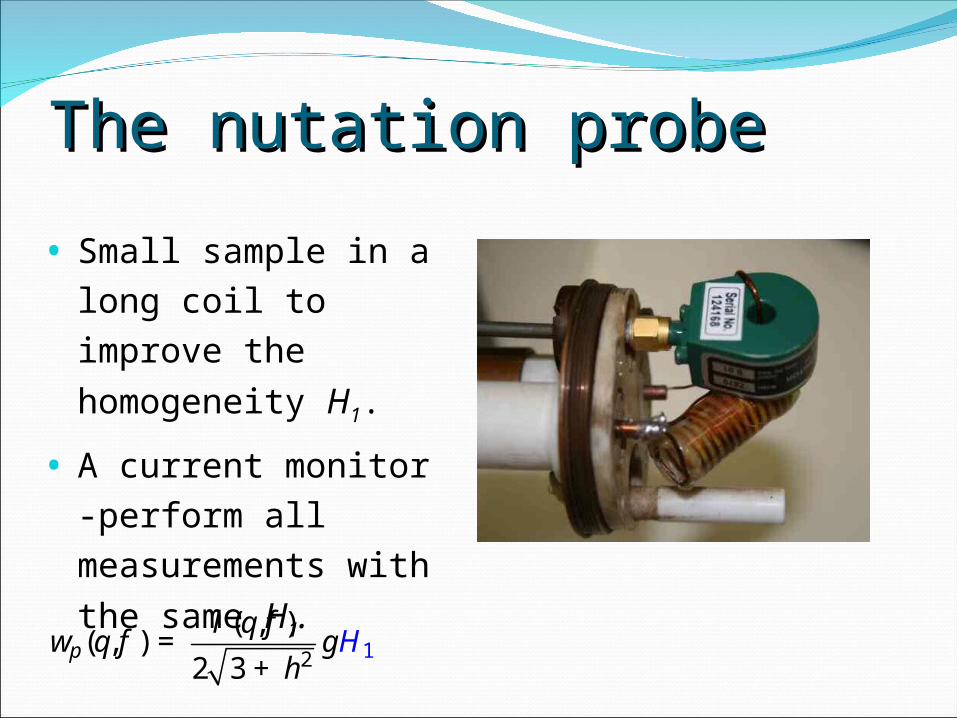
The nutation probeThe nutation probe
• Small sample in a long coil to improve
the homogeneity H1.
• A current monitor -perform all measurements with
the same H1.
2 1( , )
( , )2 3
p Hl q f
w q f gh
=+
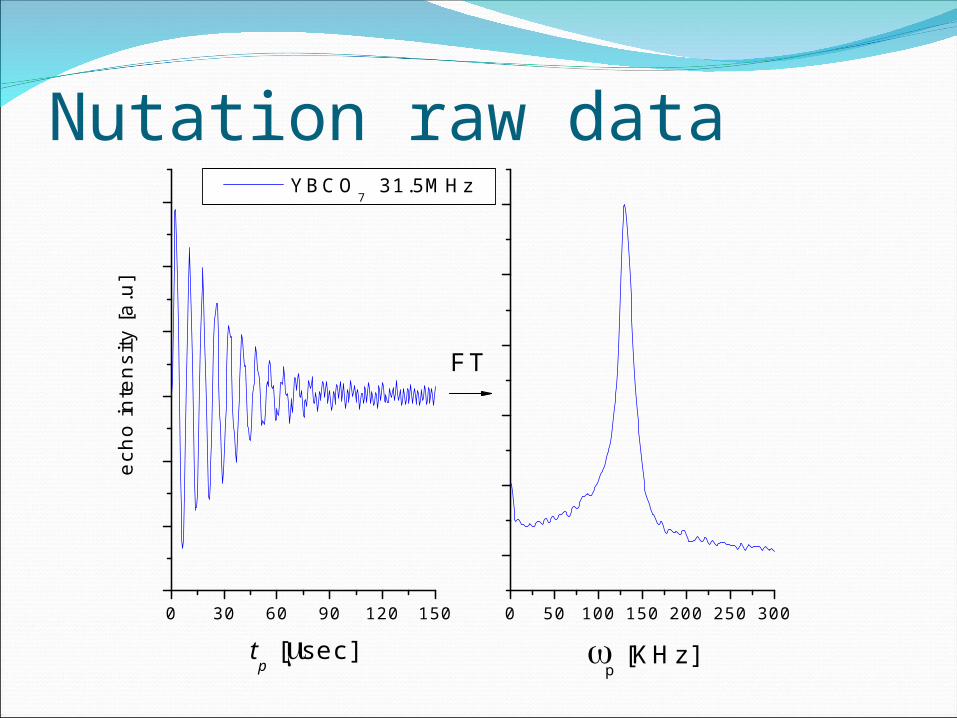
Nutation raw data
0 30 60 90 120 150 0 50 100 150 200 250 300
ech
o in
ten
sity
[a
.u]
tp [sec]
YBCO7 31.5MHz
FT
p [KHz]
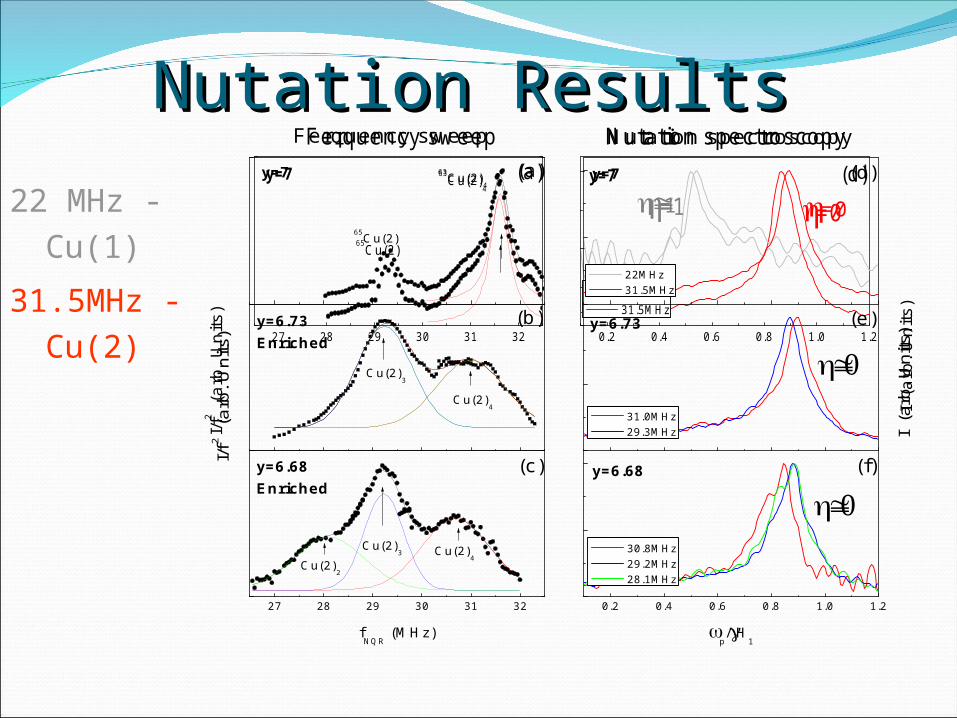
Nutation ResultsNutation Results
0.2 0.4 0.6 0.8 1.0 1.227 28 29 30 31 32
=1
I (a
rb. U
nits
)
I/f2 (
arb.
Uni
ts)
Nutation spectroscopyFerquency sweepy=7 (d)
22MHz 31.5MHz
=0
(a)y=7
65Cu(2)
63Cu(2)4
0.2 0.4 0.6 0.8 1.0 1.227 28 29 30 31 32
1 =0
y=7 (d)
22MHz 31.5MHz
y=6.73 (e)
31.0MHz 29.3MHz
y=6.68 (f)
p/H
1
30.8MHz 29.2MHz 28.1MHz
y=6.73Enriched
Cu(2)3
Cu(2)4
(a)y=7
65Cu(2)
63Cu(2)4
(c)
I (a
rb. U
nits
)
(b)
y=6.68Enriched
I/f2 (
arb.
Un
its)
fNQR
(MHz)
Ferquency sweep Nutation spectroscopy
Cu(2)2
Cu(2)3 Cu(2)
4
22 MHz - Cu(1)
31.5MHz - Cu(2)
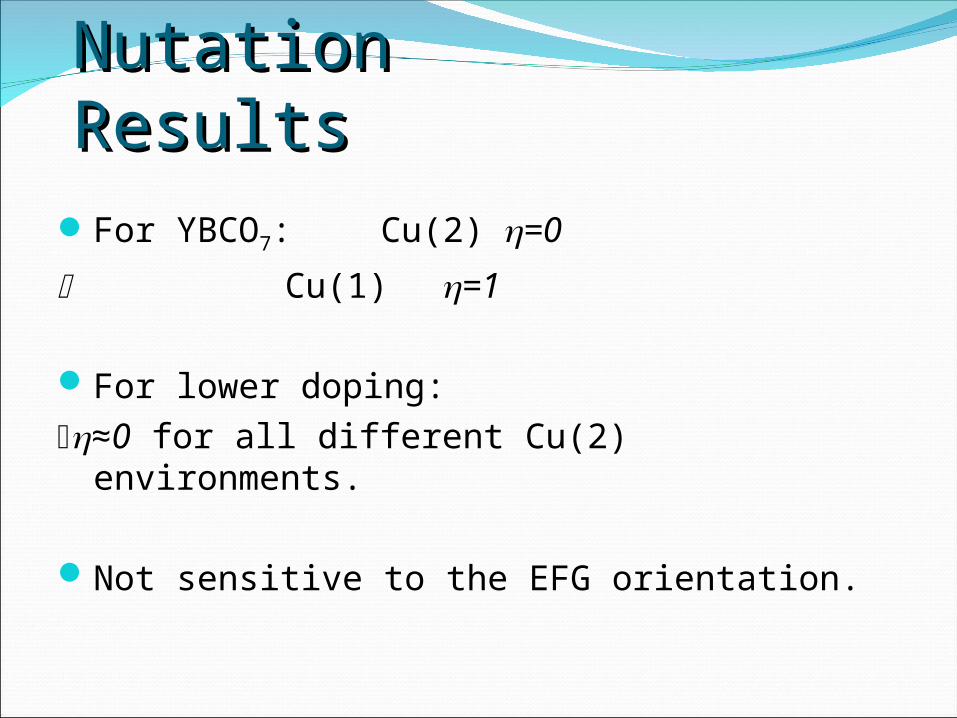
Nutation ResultsNutation ResultsFor YBCO7: Cu(2) =0
Cu(1)=1
For lower doping:≈0 for all different Cu(2) environments.
Not sensitive to the EFG orientation.
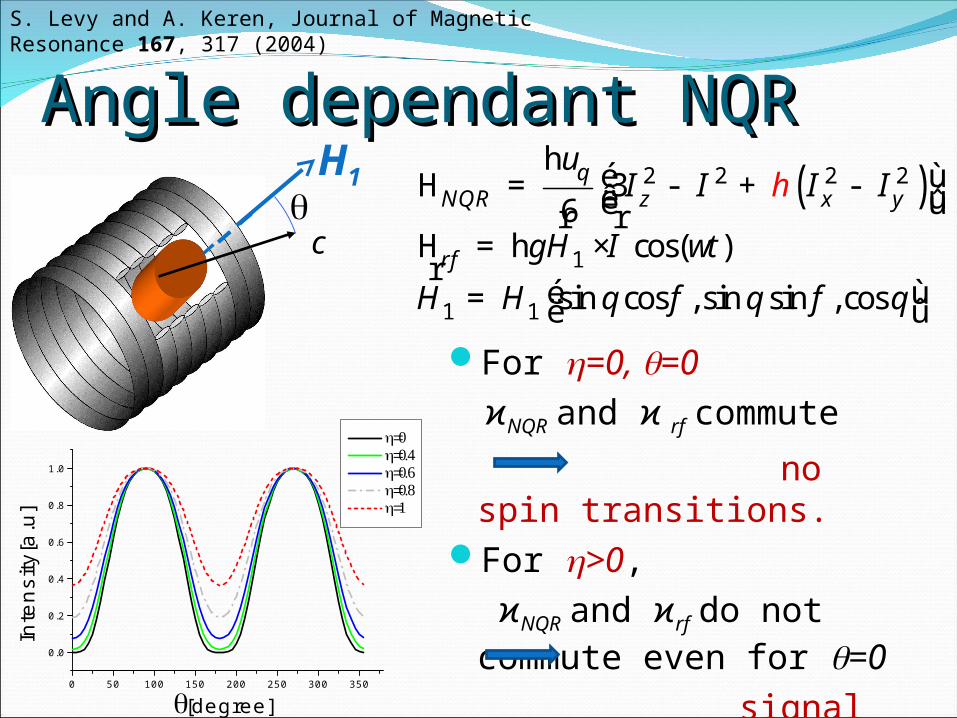
Angle dependant NQRAngle dependant NQR
0 50 100 150 200 250 300 350
0.0
0.2
0.4
0.6
0.8
1.0
Inte
nsity
[a.u
]
[degree]
H1
c
For =0, =0 ϰNQR and ϰ rf commute
no spin transitions.
For >0, ϰNQR and ϰrf do not commute even for =0
signal even for =0.
( )2 2 2 2
1
1 1
36
cos( )
sin cos ,sin sin ,cos
qNQR z x y
rf
I I I I
H I t
H H
u
g w
q f q f q
hé ù= - + -ê úë û= ×
é ù= ë û
h
r rh
r
H
H
S. Levy and A. Keren, Journal of Magnetic Resonance 167, 317 (2004)
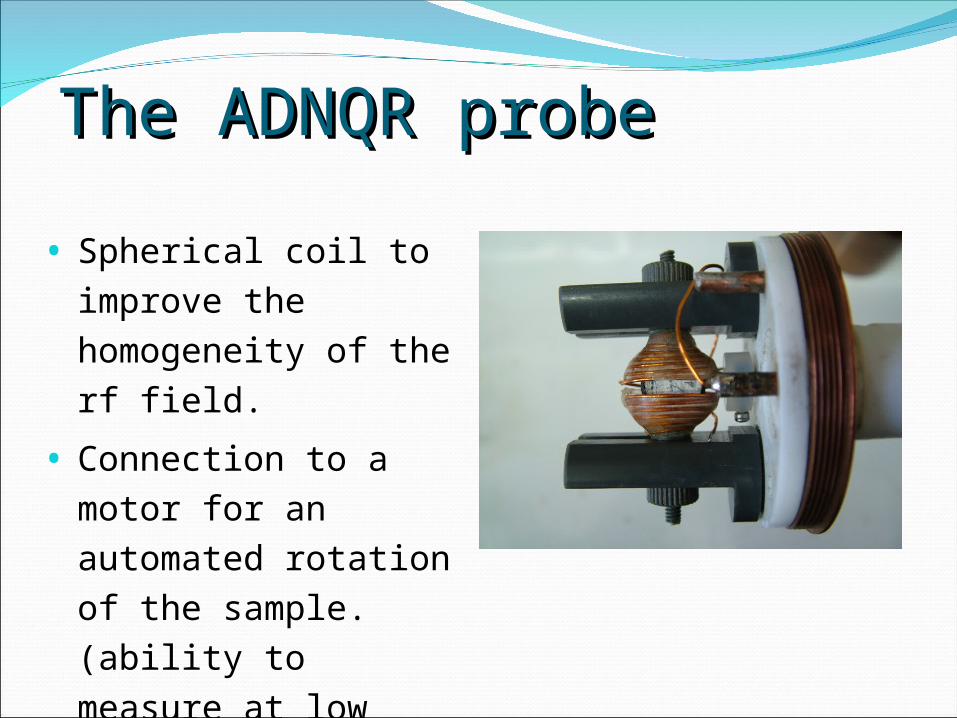
The ADNQR probeThe ADNQR probe
• Spherical coil to improve the homogeneity of the rf field.
• Connection to a motor for an automated rotation of the sample. (ability to measure at low temperatures).
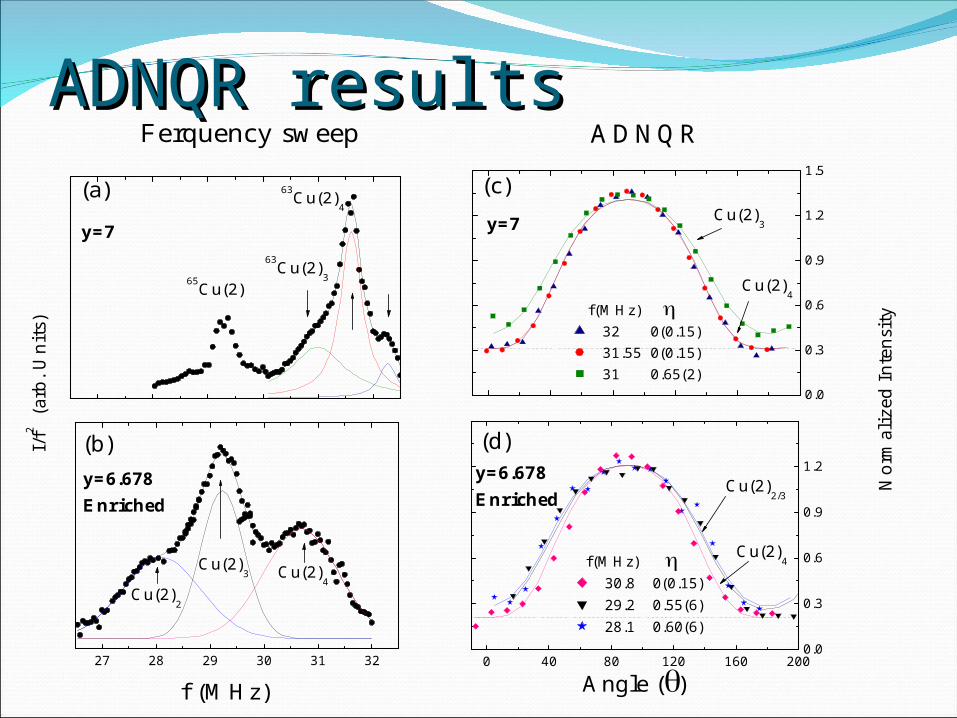
ADNQR resultsADNQR results
0 40 80 120 160 2000.0
0.3
0.6
0.9
1.2y=6.678Enriched
(d)
f(MHz) 30.8 0(0.15)29.2 0.55(6)28.1 0.60(6)
Cu(2)4
Cu(2)2/3
0.0
0.3
0.6
0.9
1.2
1.5
Angle ()
Nor
mal
ized
Int
ensi
ty
ADNQR
(c)y=7
f(MHz) 32 0(0.15)31.55 0(0.15)31 0.65(2)
Cu(2)3
Cu(2)4
27 28 29 30 31 32
(b)y=6.678Enriched
Cu(2)2
Cu(2)3 Cu(2)
4
f (MHz)
I/f2 (
arb.
Uni
ts)
Ferquency sweep
(a)
y=7
65Cu(2)
63Cu(2)4
63Cu(2)3
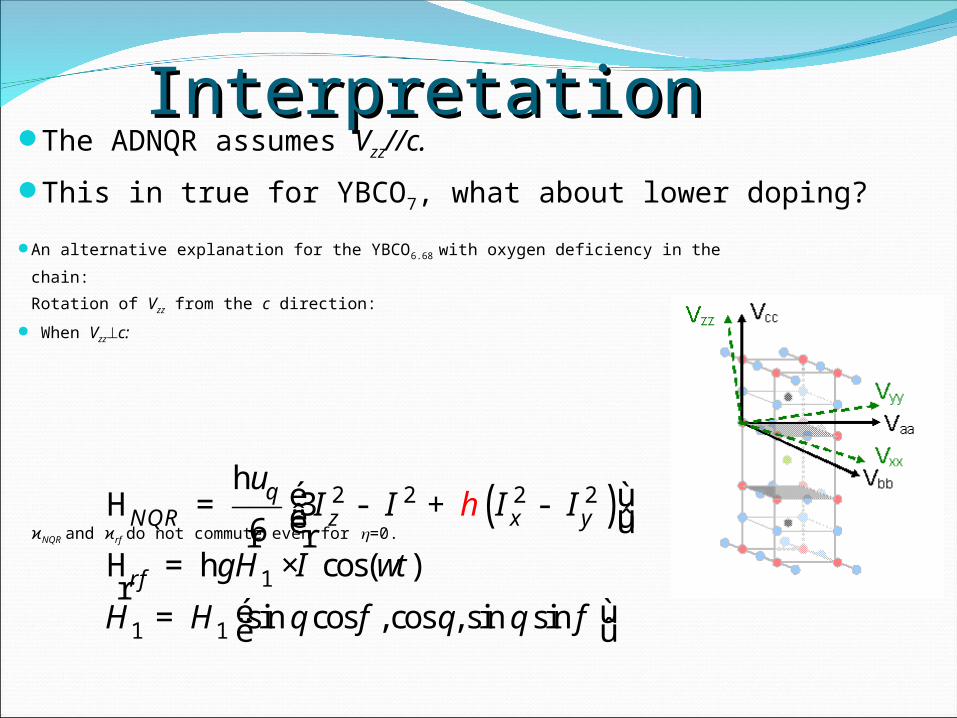
InterpretationInterpretation
An alternative explanation for the YBCO6.68 with oxygen deficiency in the chain:
Rotation of Vzz from the c direction:
When Vzzc:
ϰNQR and ϰrf do not commute even for =0. ( )2 2 2 2
1
1 1
36
cos( )
sin cos ,cos ,sin sin
qNQR z x y
rf
I I I I
H I t
H H
u
g w
q f q q f
hé ù= - + -ê úë û= ×
é ù= ë û
h
r rh
r
H
H
The ADNQR assumes Vzz//c.
This in true for YBCO7, what about lower doping?
SummarySummaryYBCO7 - =0, the CuO2 plane is charge
homogeneous.
For lower doping:
NMR – cannot be determined
Nutation – =0 for all different Cu(2) environments.
Not sensitive to the EFG orientation.
ADNQR: – For Cu(2) neighboring a full chain - =0
For Cu(2) next to an oxygen deficiency in the chain –there is a rotation of Vzz from the c direction.
ConclusionConclusion
Any charge inhomogeneity in the CuO2 planes
is found only in conjunction with oxygen deficiency in the chains.
In other words,
if there is a phase separation in the planes in the YBCO compound, it is correlated with the O dopant atoms.