Embed Size (px)
Citation preview

RIMapperWMS: a Web Map Service providingSVG maps with a built-in client
Barend Kobben
International Institute for Geo-Information Science and Earth Observation (ITC),Department of GIP, PO Box 6, 7500 AA Enschede, The [email protected] – http://kartoweb.itc.nl/RIMapper/
Summary. This paper introduces RIMapperWMS, a light-weight web mapping ap-plication that conforms to the Open Geospatial Consortium’s Web Map Service spec-ification. It serves interactive web maps from a spatial database back-end. Comparedto existing WMS implementations, it stands out firstly because it serves its mapsin the Scalable Vector Graphics format. This allows it to offer high-quality vectorcartography, specially suitable for mobile devices such as PDA’s and smartphones.Secondly, RIMapperWMS includes so-called VendorSpecific Capabilities that theOGC specification allows, in this case enabling it to produce the SVG output witha built-in Graphical User Interface, allowing the data to be disseminated to anySVG-capable application, without the need for a separate WMS client.
Key words: Web Mapping, Spatial Databases, WMS, SVG, built–in GUI
1 Introduction
This paper introduces RIMapperWMS, the result of a project to build a light-weight web mapping application that conforms to the Open Geospatial Con-sortium’s (OGC) Web Map Service (WMS) specification. We started out thisproject with two main questions: Firstly to see if it would be possible and prac-tical to extend earlier work in our SDIlightproject to build a WMS that servesits maps in the Scalable Vector Graphics format (SVG). This would allow itto offer high-quality vector cartography, specially suitable for mobile devicessuch as PDA’s and smartphones. Secondly, we wanted to investigate the pos-sibility for this WMS to produce the SVG output with a built-in GraphicalUser Interface (GUI). In this way, the data could be disseminated to any SVG-capable application, without the need for a separate WMS client, somethingno existing WMS offers at present.
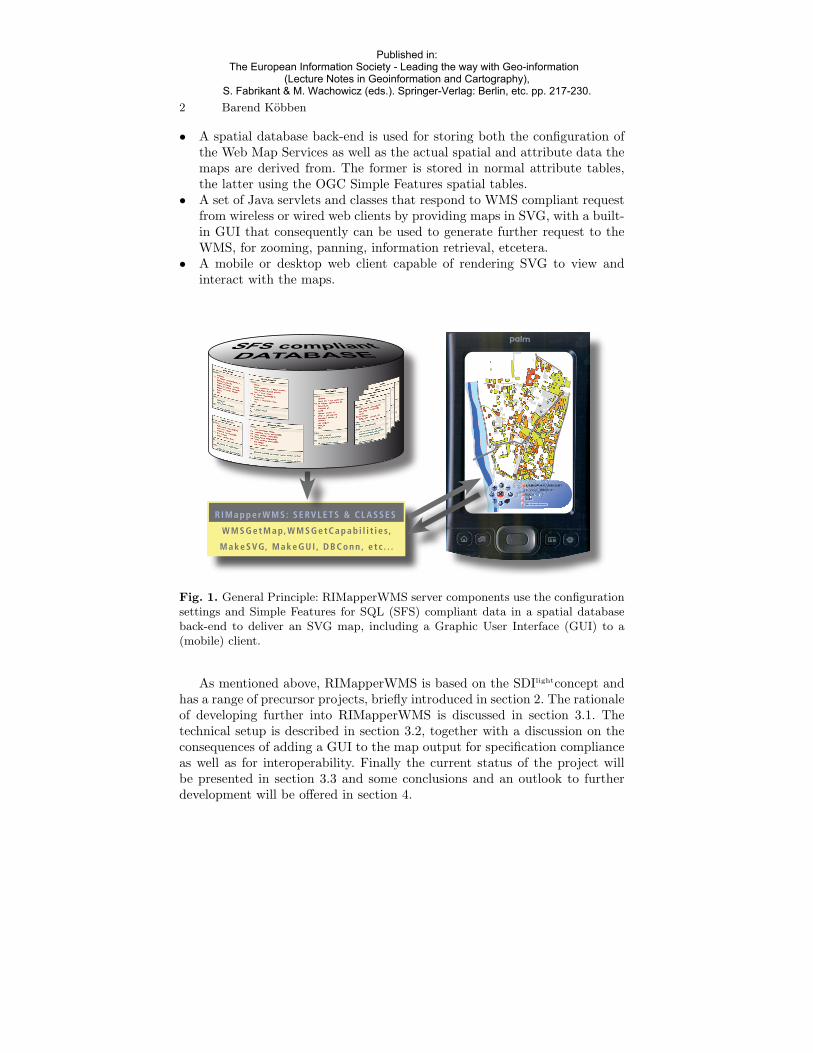
The resulting RIMapperWMS system serves interactive web maps froma spatial database back-end. The general components of the RIMapperWMSsetup, as shown in figure 1, are:
Published in:The European Information Society - Leading the way with Geo-information
(Lecture Notes in Geoinformation and Cartography),S. Fabrikant & M. Wachowicz (eds.). Springer-Verlag: Berlin, etc. pp. 217-230.
2 Barend Kobben
• A spatial database back-end is used for storing both the configuration ofthe Web Map Services as well as the actual spatial and attribute data themaps are derived from. The former is stored in normal attribute tables,the latter using the OGC Simple Features spatial tables.
• A set of Java servlets and classes that respond to WMS compliant requestfrom wireless or wired web clients by providing maps in SVG, with a built-in GUI that consequently can be used to generate further request to theWMS, for zooming, panning, information retrieval, etcetera.
• A mobile or desktop web client capable of rendering SVG to view andinteract with the maps.
Fig. 1. General Principle: RIMapperWMS server components use the configurationsettings and Simple Features for SQL (SFS) compliant data in a spatial databaseback-end to deliver an SVG map, including a Graphic User Interface (GUI) to a(mobile) client.
As mentioned above, RIMapperWMS is based on the SDIlightconcept andhas a range of precursor projects, briefly introduced in section 2. The rationaleof developing further into RIMapperWMS is discussed in section 3.1. Thetechnical setup is described in section 3.2, together with a discussion on theconsequences of adding a GUI to the map output for specification complianceas well as for interoperability. Finally the current status of the project willbe presented in section 3.3 and some conclusions and an outlook to furtherdevelopment will be offered in section 4.
Published in:The European Information Society - Leading the way with Geo-information
(Lecture Notes in Geoinformation and Cartography),S. Fabrikant & M. Wachowicz (eds.). Springer-Verlag: Berlin, etc. pp. 217-230.

RIMapperWMS: a WMS providing SVG maps with a built-in client 3
2 Earlier Projects at the Basis of RIMapperWMS
RIMapperWMS has grown out of a number of earlier projects. These employedmany of the software and database solutions used later for RIMapperWMS,and they have greatly influenced the way it has been set up, therefore wewill briefly describe these projects first. Like many projects and educationalmaterials developed within the GeoInformation Processing Department of theInternational Institute for Geo-Information Science and Earth Observation(ITC), they were based on what we dubbed the ‘SDIlight’ philosophy.
2.1 SDIlight
The term Spatial Data Infrastructure (SDI, sometimes also GDI for GeoDataInfrastructure) may be usually connected with (very) large regional or na-tional spatial data warehouses, but it is defined more generally in [3] as “thenetworked geospatial databases and data handling facilities, the complex of in-stitutional, organizational, technological, human and economic resources (...)facilitating the sharing, access to, and responsible use of geospatial data at anaffordable cost for a specific application domain or enterprise.” In many casesSDI data and application infrastructures are being developed using high-endgeospatial software solutions and large corporate databases, needing substan-tial investments in financial and human resources. But the principles of SDIscan be applied in more simple and cost-effective ways just as well. This down-to-earth approach, which we named SDIlight, is of particular interest for stu-dents, partners and clients of the International Institute for Geo-InformationScience and Earth Observation (ITC), an institute that aims at capacity build-ing and institutional development specifically in developing countries.
SDIlightserves as a general purpose test bed for applied as well as funda-mental research activities, and should provide researchers and students alikewith a proof-of-concept platform for relatively simple, low-cost, yet powerfulways of sharing data amongst various distributed offices and institutions aswell as the general public. To achieve that, we use Open Standards when-ever available, Open Source solutions where possible and commercial softwarewhere necessary. And because a considerable part of our courses is aimed attraining geo-informatics engineers, we have students also actively develop andbuild (parts of) such systems. In general, the main building blocks are:
• A spatial database backend that stores the geometry and the attributedata; Spatial data is stored using the Open Geospatial Consortium (OGC)Simple Features specifications. Both PostgreSQL/PostGIS and MySQLhave been used.
• A set of interoperable web applications that interface with the databaseand with each other, and fulfil tasks such as delivering maps for visuali-sation purposes, provide data in formats such as GML for data exchange,etcetera. We either use the UMN MapServer software, or develop our owncomponents in Java, using Apache Tomcat for deployment.
Published in:The European Information Society - Leading the way with Geo-information
(Lecture Notes in Geoinformation and Cartography),S. Fabrikant & M. Wachowicz (eds.). Springer-Verlag: Berlin, etc. pp. 217-230.

4 Barend Kobben
• Simple Web-based interfaces enabling access to the maps and data forboth desktop browsers and mobile platforms. At present, we concentrateon web browser clients, employing various techniques such as DynamicHTML (DHTML), Asynchronous JavaScript And XML (AJAX) and Scal-able Vector Graphics (SVG).
It is not the intention that SDIlightshould finally become one coherent sys-tem, rather it should be seen as a test bed in the broad sense of equipmentfor testing. It is the place where we can show fellow researchers, consultantsand students as well as possible users (such as GIS and Cartography depart-ments in developing countries) that the things we teach can be made to workquite quickly, in a relatively simple and low-cost setup. As such it has beenfunctioning for some three years now and has spawned a variety of projects,of which RIMapperWMS is the latest outcome.
2.2 RIMapper
A first application called RIMapper was developed in 2003 to investigate thepossibility of generating light-weight, versatile Risk Indicator Maps (RIMs)and deliver these to web clients as interactive SVG maps, based on XMLconfiguration files. These maps were to be part of an urban risk managementsystem, and therefore needed to fit a multitude of use cases, ranging from giv-ing the general public information about risks, to providing local authoritiesan interface to the underlying risk assessment databases and models. Further-more, the maps needed to be usable on a wide range of platforms, from theoffice systems of the local authorities to hand-held devices providing locationbased services to field personnel.
In the database tier, geometric features are stored as OGC Simple Fea-tures geometry using a MySQL database. Map layers can be either styleduniformly, eg. all roads sharing the same visualisation, or depending on somedata attribute per feature, eg. for a chorochromatic map of homes viewed byvulnerability type. In RIMapper, the database also stores common SVG codefragments and ECMAscript event listeners.
The application tier is a set of generic Java classes to do recurring taskslike extracting OGC features and attribute data from the database, translatingthese into fragments of SVG and ECMAscript, collecting and structuring thesefragments into valid output and delivering this output to the clients. The glueprovided to make all these parts act together are the XML map configurations.They are parsed to get a description of the map needed and all its componentparts, as well as the choice for the visualisation type per layer.
When all data needed has been collected by the system, the SVG outputis composed and handed over to the web server for delivery to the client. TheSVG generated will adhere to the SVG 1.1 Basic profile and will thus be suitedfor a broad range of clients, including PDA’s.
Using the RIMapper system, described in more detail in [6], one can veryflexibly offer database-driven maps on the web that are generated on the fly
Published in:The European Information Society - Leading the way with Geo-information
(Lecture Notes in Geoinformation and Cartography),S. Fabrikant & M. Wachowicz (eds.). Springer-Verlag: Berlin, etc. pp. 217-230.

RIMapperWMS: a WMS providing SVG maps with a built-in client 5
from the most recent data, and that can incorporate all the functionality,scalability and graphics quality that the SVG standard offers. The main dis-advantage of this original system is that it outputs the whole data extentin one client-side SVG file. This simplifies setup and is no problem for thesmall risk indicator maps it was designed for, but it makes the system notwell scaleable. Furthermore, the service interface does not comply to any ofthe available Open Standards.
Fig. 2. Example of a RIMapper interactive SVG map. It features a dynamicallychanging risk symbol showing the modelled risks (left half for floods, right halffor earthquakes) at the current pointer location (screen dump from BitFlash SVGmobile viewer on PDA, interactive original available on website [5]).
2.3 Web Application for Landslide Inventory
A second application of the RIMapper technology was a pilot of a web-basedsystem for updating the landslide map of the Serchio basin (Central Tuscany,Italy). This is an official document that represent the actual state of thelandslides in the region. The updating of the map is at present carried outby the local municipalities using paper sketch maps. The objective was tosignificantly speed up and simplify this updating process, while taking intoaccount the severe constraints of the municipal organisations. This was to beachieved by providing them with a lightweight Web based map applicationthat allows inventory of new landslides and submitting them via the WWWdirectly to a central database.
Published in:The European Information Society - Leading the way with Geo-information
(Lecture Notes in Geoinformation and Cartography),S. Fabrikant & M. Wachowicz (eds.). Springer-Verlag: Berlin, etc. pp. 217-230.

6 Barend Kobben
The functionality of RIMapper had to be extended with a mechanism forinput of the landslide locations. Implementing a digitizing functionality provedquite straightforward, using the scripting possibilities of SVG. The next stepis to insert a new path element in the DOM-tree. The client-side functionalityfor upload of the newly digitized polygon to the database is implemented, butthe authorities still will need to rework the server-side to actually receive theinputs and store them in a safe, transactionally sound, manner.
The work described here (and further in [9]) highlighted some of the inher-ent weak points of the original RIMapper setup. Having the landslide map forthe whole Serchio basin client-side, proved to be inefficient indeed. A systemwhere only the data needed are loaded from the server would be required fora production version. Such a system was also needed and indeed devised forthe Wireless Campus projects introduced below.
2.4 Wireless Campus LBS and CampusMapper
The Wireless Campus LBS project, described in more detail in [8], is a co-operation between ITC and the University of Twente (UT). Its aim is toprovide a platform for Location Based Services (LBSes) for the UT campus.The foundation for these LBSes is the existing Wireless Campus system thatprovides the whole University grounds with WiFi based internet access. Thepurpose of the project is not the development of the or even a Wireless Cam-pus LBS, but rather to investigate and set up the infrastructure necessaryfor LBSes based on it. It combines input from several research projects, eg.on WiFi positioning techniques [10] and on context-aware databases [1], withthe practical application of new as well as established techniques to provideuseful services for the UT campus population, and is intended to serve as atest bed for research as well as to benefit from the outcomes of research.
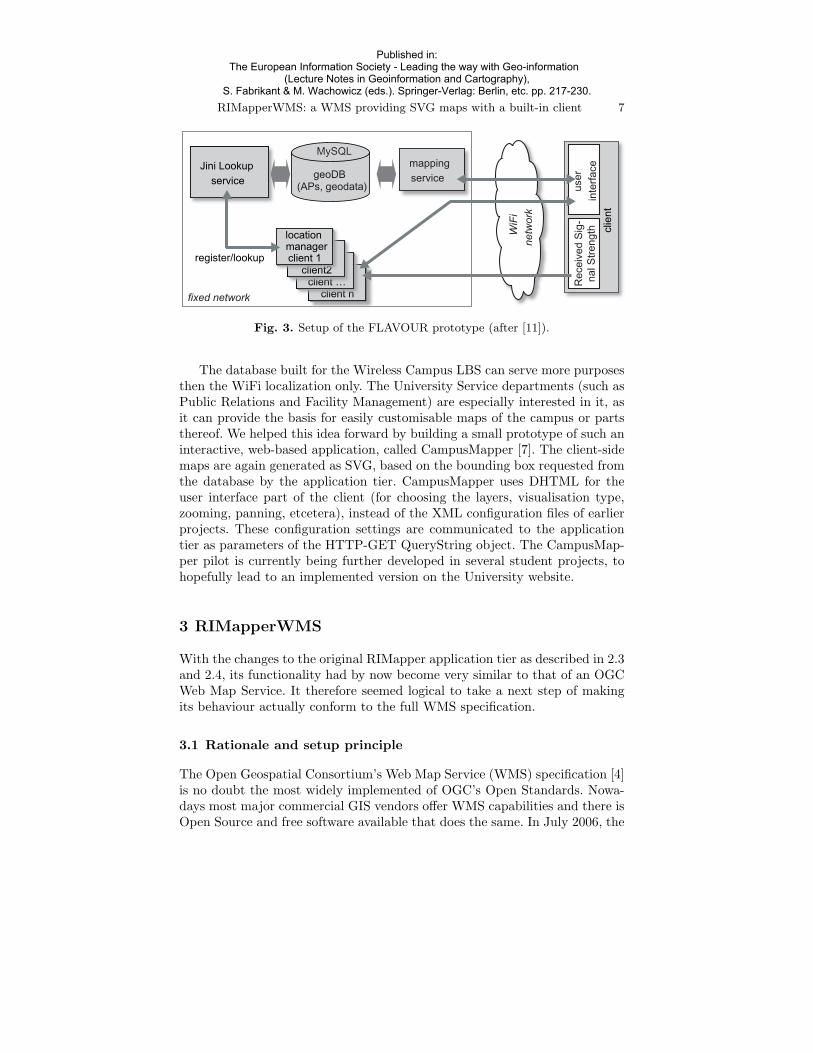
A first result was an LBS for participants of SVG Open 2005 (the 4th An-nual Conference on Scalable Vector Graphics), that was organised at the UTin August 2005. This pilot application called FLAVOUR (Friendly Location-aware conference Assistant with priVacy Observant architectURe, see [11]and figure 3) used WiFi localization techniques to firstly offer pull services forgeneral navigation as well as for locating fellow attendants and conference fa-cilities. Secondly, push services were established, eg. for messenger-type peer-to-peer communication and notifications by conference organizers. The testsat SVG Open 2005 were relatively successful: The localization functionalityworked quite reliably, although the accuracy was varying quite a bit over thevarious conference locations.
The mapping service of FLAVOUR (see figure 3) was based on RIMapper,but this time the server application was set up to request only those partsfrom the spatial database that are needed for the current map extent. Thischange was unavoidable, because for this application a fairly large databasehas been built, incorporating large scale topographic and building data of thewhole 140 hectare campus and its 650+ wireless network access points.
Published in:The European Information Society - Leading the way with Geo-information
(Lecture Notes in Geoinformation and Cartography),S. Fabrikant & M. Wachowicz (eds.). Springer-Verlag: Berlin, etc. pp. 217-230.
RIMapperWMS: a WMS providing SVG maps with a built-in client 7
location manage client n
location manage client n
location manage client …
location manage client …
location manage client2
location manage client2
location manager client 1
location manager client 1
MySQL
geoDB (APs, geodata)
fixed network
location manage client n
location manage client n
location manage client …
location manage client …
location manage client2
location manage client2
location manager client 1
location manager client 1
location manage client n
location
client n
location manage client …
location manage client …
location manage client2
location
client2
location manager client 1
location manager client 1
MySQL Jini Lookup
service
register/lookup
WiF
i
netw
ork
clie
nt
clie
nt
RS
S
qtio
n
user
inte
rfac
e
clie
nt
clie
nt
Rec
eive
d S
ig-
nal S
tren
gth
user
inte
rfac
e mapping
service
Fig. 3. Setup of the FLAVOUR prototype (after [11]).
The database built for the Wireless Campus LBS can serve more purposesthen the WiFi localization only. The University Service departments (such asPublic Relations and Facility Management) are especially interested in it, asit can provide the basis for easily customisable maps of the campus or partsthereof. We helped this idea forward by building a small prototype of such aninteractive, web-based application, called CampusMapper [7]. The client-sidemaps are again generated as SVG, based on the bounding box requested fromthe database by the application tier. CampusMapper uses DHTML for theuser interface part of the client (for choosing the layers, visualisation type,zooming, panning, etcetera), instead of the XML configuration files of earlierprojects. These configuration settings are communicated to the applicationtier as parameters of the HTTP-GET QueryString object. The CampusMap-per pilot is currently being further developed in several student projects, tohopefully lead to an implemented version on the University website.
3 RIMapperWMS
With the changes to the original RIMapper application tier as described in 2.3and 2.4, its functionality had by now become very similar to that of an OGCWeb Map Service. It therefore seemed logical to take a next step of makingits behaviour actually conform to the full WMS specification.
3.1 Rationale and setup principle
The Open Geospatial Consortium’s Web Map Service (WMS) specification [4]is no doubt the most widely implemented of OGC’s Open Standards. Nowa-days most major commercial GIS vendors offer WMS capabilities and there isOpen Source and free software available that does the same. In July 2006, the
Published in:The European Information Society - Leading the way with Geo-information
(Lecture Notes in Geoinformation and Cartography),S. Fabrikant & M. Wachowicz (eds.). Springer-Verlag: Berlin, etc. pp. 217-230.

8 Barend Kobben
OGC Implementation Statistics web page [14] listed 146 implementations. Al-though these generally render their maps in a pictorial format such as PNG,GIF or JPEG, a small proportion of them also offer vector-based maps inScalable Vector Graphics (SVG). Therefore, on first sight it may seem that aWMS version of RIMapper would not add much to already available solutions.
However, it is our impression that existing implementations that do sup-port SVG all treat the output as just another graphics format, and like theGIF and JPEG output, the maps are basically pictures only, with no inter-activity or ‘intelligence’. This impression is based on our intimate workingknowledge with two of the most prominent WMSes to support SVG (UMNMapserver and GeoServer) and a quick scan of the advertised capabilities ofthe other WMS implementations as found through URL [13]. To have the mapbehave like a mapping application, it needs to be wrapped in a Graphical UserInterface (GUI). There are many such GUI’s available, as dedicated server-side applications, or as part of general GIS clients (such as the Java-basedfreewares uDig and Jump).
But SVG is more than a graphics format only, it also offers interactiv-ity, through built-in ECMAscripting and full access to its XML DocumentObject Model. It is therefore possible to build an SVG map, or rather anSVG application, that includes its own GUI, which has been demonstratedby various examples available (for some excellent examples and tutorials, seeURL [2]). These solutions are programmed on a case-to-case basis however,and not easily generated or deployed repeatedly from a dynamic set of data.RIMapperWMS was set up to make such a solution more generic, by offeringa simple WMS conformant interface to the spatial data, including its ownbuilt-in client-side GUI. This GUI handles the map interaction and based onthat will generate new WMS-conformant service requests to change the viewon the data, add or remove data layers, get information on data attributes,etcetera. This principle is outlined in the UML Sequence Diagram in figure 4.
At first sight, it might seem that including the GUI generation part inexisting open source software would have been more straightforward thandeveloping our own WMS implementation. There were two main reasons todo so anyway: We did not have to build in from the ground up, as the existingRIMapper system already supported almost all functionality required. Makingit behave WMS compliant was estimated a limited effort, and indeed took lessthan 1 man–month. Additionally, in this way the system remains light-weight:only the functionality needed is in the system (the spatial DB, the WMSserver and SVG client logic), without the overhead of more generic systemssuch as UMN MapServer, which also support many other OGC specifications,datastores and output formats.
3.2 Technical Implementation
The database tier of RIMapperWMS is implemented in the PostgreSQLdatabase server. When using the PostGIS spatial extension for this Open
Published in:The European Information Society - Leading the way with Geo-information
(Lecture Notes in Geoinformation and Cartography),S. Fabrikant & M. Wachowicz (eds.). Springer-Verlag: Berlin, etc. pp. 217-230.

RIMapperWMS: a WMS providing SVG maps with a built-in client 9
Spatial Database RIMapperWMS SVG-capable(wireless) Webclient
Etcetera...
Initial GetMapRequest (getGUI=true)
SVG placeholder + GUI
GetCapabilities RequestQuery (SQL)
Data (Capabilities)
parse to XML
GetCapabilities XML
GetMap Request(getGUI=true)
Query (SimpleFeatures SQL)
Data (Simple Features)
parse data toSVG
add GUI code
SVG map + GUI
GUI action(zoom)
GetMap (zoomed extent)
Data Request(zoomed area)
zoomed Data (SFS)
Fig. 4. UML Sequence Diagram of requesting an SVG map with a built-in GUI(using the getGUI=true parameter) and then zooming in.
Source DBMS, one has a powerful, fully OGC-compliant spatial data server. Inearlier projects, we also supported the use of the MySQL database. MySQL’srecent versions do include spatial extensions, but they are not implementingthe full OGC specification, and especially the lack of support for Co-ordinateReference Systems and therefore for (re)projection and transformation, makesit unsuitable for a WMS. In the future, connectors for other compliant data-stores could be added.
All configuration is done using database tables. The system can simulta-neously serve multiple WMS ‘instances’, each from a seperate database. As
Published in:The European Information Society - Leading the way with Geo-information
(Lecture Notes in Geoinformation and Cartography),S. Fabrikant & M. Wachowicz (eds.). Springer-Verlag: Berlin, etc. pp. 217-230.

10 Barend Kobben
layer n
column*PK gid: integer = nextval('roads_... the_geom: type: varchar(32)
check+ enforce_dims_the_geom()+ enforce_geotype_the_geom()+ enforce_srid_the_geom()PK+ roads_pkey(integer)
layer ...
column*PK gid: integer = nextval('roads_... the_geom: type: varchar(32)
check+ enforce_dims_the_geom()+ enforce_geotype_the_geom()+ enforce_srid_the_geom()PK+ roads_pkey(integer)
fragments
column code: varchar(9999)* id: integer* name: varchar(32) = ''::character v... type: varchar(32) = ''::character v...
geometry_columns
column* coord_dimension: integer*PK f_geometry_column: varchar(256)*PK f_table_catalog: varchar(256)*PK f_table_name: varchar(256)*PK f_table_schema: varchar(256)* srid: integer* type: varchar(30)
PK+ geometry_columns_pk(varchar, varchar, varchar, varchar)
layer 1
column*PK gid: integer = nextval('roads_... the_geom: type: varchar(32)
check+ enforce_dims_the_geom()+ enforce_geotype_the_geom()+ enforce_srid_the_geom()PK+ roads_pkey(integer)
service_metadata
column abstract: access_constraints: = 'none'::charact... contact_electronic_mail_address: fees: = 'none'::charact...*PK id: integer = nextval('servic... keyword_list: * name: = 'OGC:WMS'::char...* title:
PK+ id_pkey(integer)
spatial_ref_sys
column auth_name: varchar(256) auth_srid: integer proj4text: varchar(2048)*PK srid: integer srtext: varchar(2048)
PK+ spatial_ref_sys_pkey(integer)
svg_styles
column*PK id: integer* name: varchar(50) style: text
PK+ css_styles_pkey(integer)
wms_layers
column abstract: * geom_col: = 'ogc_geom'::cha...*PK id: integer = nextval('wms_la... keyword_list: metadata_url: * name: opaque: smallint = 0* pkey: = 'gid'::characte... queryable: smallint = 0 scalehint: * srs_epsg_list: style_list: * title:
PK+ wms_layers_id_pkey(integer)
wms_styles
column abstract: classes: *PK id: integer = nextval('wms_st... legend_url_format: legend_url_height: smallint legend_url_online_resource: legend_url_width: smallint* name: styleattribute: * styletype: = 'single'::chara... svgstyles: * title:
PK+ id(integer)
Fig. 5. UML object diagram of the Data Model for the spatial data back-end. Notethe central wms layers table, n layer tables on the right, further WMS configurationtables on the upper-left and PostGIS-specific tables in the lower-left side.
can be seen in the data model in figure 5, the central configuration table iswms layers. This lists which data sets are available, what their co-ordinatesystem is, what styles they support, etcetera. The actual layer data is storedin n layer tables, that include the OGC compatible geometry columns andany attributes available. These layer tables are usually the result of importsfrom other data sources, eg. from ESRI shape files through the PostGIS loadertool. Further WMS configuration is taken care of in the service metadata,wms styles and svg styles tables. All this information is used by the appli-cation tier to determine the capabilities of the WMS instance. Setting theseconfiguration tables is currently done by using a generic SQL client, but weplan for future web-based configuration pages to make this process more user-friendly.
The application tier is employing a set of Java servlets and classes thatcan be deployed in any J2EE compatible servlet container (eg. Apache Tom-cat). The functionality of the previous projects has been expanded to sup-port the interfaces required for a Basic WMS : GetCapabilities and GetMap.GetCapabilities returns an XML description of the WMS’s information con-tent and acceptable request parameters. GetMap returns the map itself. TheWMS client can specify which information to be shown on the map (oneor more Layers), the Styles of those Layers, what portion of the earth is tobe mapped (Bounding Box), the projected or geographic co-ordinate refer-ence system to be used (the Spatial Reference System), the desired outputformat, the output size, etcetera. The WMS specification also describes anoptional Queryable WMS, additionally supporting the GetFeatureInfo inter-face, used for retrieving information about particular features shown on a map.
Published in:The European Information Society - Leading the way with Geo-information
(Lecture Notes in Geoinformation and Cartography),S. Fabrikant & M. Wachowicz (eds.). Springer-Verlag: Berlin, etc. pp. 217-230.

RIMapperWMS: a WMS providing SVG maps with a built-in client 11
Although our built-in GUI supports getting feature information client-side, bymouse-clicks or mouse-overs, it is not implemented through the standardizedGetFeatureInfo interface at the moment.
The client-side software needed for this setup has to be able to issueHTTP-GET and/or POST requests, as well as being able to render SVGcontent. With SVG being an official W3C recommendation, theoretically anyweb browser would be sufficient, but in practice the situation is somewhatmore complex. The most-used browser, Microsoft Internet Explorer, currentlyneeds a plug-in for supporting SVG. Some browsers have implemented native(inline) SVG support, with Firefox (1.5+) and Opera (9+) well on their wayto support the full standard, and our maps work well in both. The fact thatVista, the new Microsoft operating system, uses a graphics layer (XAML) thatis based on SVG, has lead to speculation that upcoming IE versions will alsosupport inline SVG. Furthermore, there are several stand-alone SVG clients,especially for PDA’s and smartphones.
3.3 Status of the current implementation
The first public beta of the system was released in December 2006 on thewebsite http://kartoweb.itc.nl/RIMapper/. This first release supports thefunctionality required for a Basic WMS version 1.1.1. Currently a newer WMS1.3.0 specification is ready, but there has not been a wide-spread adoptionof that specification. The main reason seems to be that it included somemajor changes in the underlying concepts, specifically in the way co-ordinatereference systems are dealt with. It requires, among other things, that thesystem can handle data an arbitrary sequence of axes for a projection, asopposed to the fixed longitude–latitude order of the 1.1.1 specification. Oursystem uses the transformation and projection capabilities of the underlyingPostGIS database, which in turn uses the open source PROJ4 library [15],as do UMN Mapserver and many other projects. This means that until thatlibrary has been upgraded to allow the new projection system, our and manyother WMS servers will not be able to support the new specification.
A point of discussion in implementing the system has been the questionof possibly breaking the interoperability principle of the WMS with our addi-tions. In our system, requesting the built-in GUI is done by adding a specificparameter (getGUI=true, see figure 4). Such an addition is covered by thespecification in the form of so-called VendorSpecific Capabilities. However,our specific addition introduces a WMS layer that has a built-in client whichis intrinsically unaware of any additional layers in a possible stack of so-calledcascaded WMS layers. In other words, when this RIMapperWMS layer is re-quested by a different WMS client, or as input for another WMS service, anyGUI actions from our layer would break the interoperability chain. For thatreason, the GUI is only included if the request comes from a RIMapperWMSclient, and therefore includes the VendorSpecific getGUI=true parameter. Ifnot, the GUI is not included and the map behaves like any other basic WMS
Published in:The European Information Society - Leading the way with Geo-information
(Lecture Notes in Geoinformation and Cartography),S. Fabrikant & M. Wachowicz (eds.). Springer-Verlag: Berlin, etc. pp. 217-230.
12 Barend Kobben
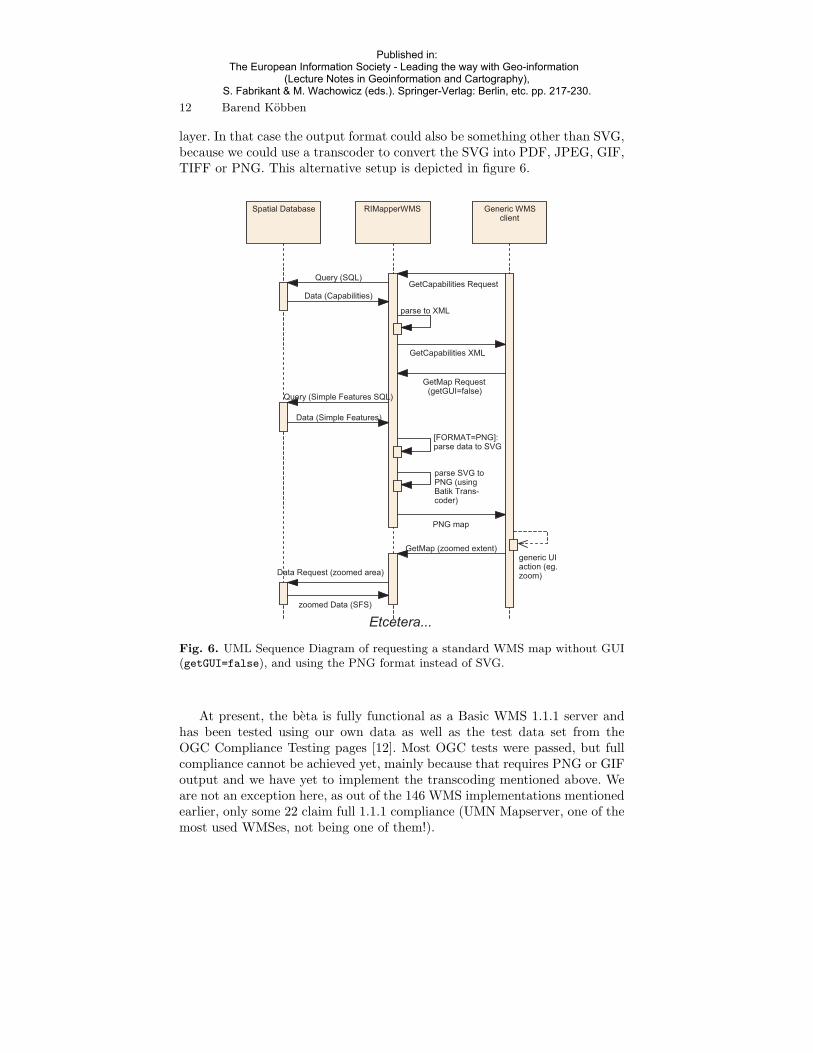
layer. In that case the output format could also be something other than SVG,because we could use a transcoder to convert the SVG into PDF, JPEG, GIF,TIFF or PNG. This alternative setup is depicted in figure 6.
Spatial Database RIMapperWMS Generic WMSclient
Etcetera...
GetCapabilities RequestQuery (SQL)
Data (Capabilities)
parse to XML
GetCapabilities XML
GetMap Request(getGUI=false)
Query (Simple Features SQL)
Data (Simple Features)
[FORMAT=PNG]:parse data to SVG
parse SVG toPNG (usingBatik Trans-coder)
PNG map
generic UIaction (eg.zoom)
GetMap (zoomed extent)
Data Request (zoomed area)
zoomed Data (SFS)
Fig. 6. UML Sequence Diagram of requesting a standard WMS map without GUI(getGUI=false), and using the PNG format instead of SVG.
At present, the beta is fully functional as a Basic WMS 1.1.1 server andhas been tested using our own data as well as the test data set from theOGC Compliance Testing pages [12]. Most OGC tests were passed, but fullcompliance cannot be achieved yet, mainly because that requires PNG or GIFoutput and we have yet to implement the transcoding mentioned above. Weare not an exception here, as out of the 146 WMS implementations mentionedearlier, only some 22 claim full 1.1.1 compliance (UMN Mapserver, one of themost used WMSes, not being one of them!).
Published in:The European Information Society - Leading the way with Geo-information
(Lecture Notes in Geoinformation and Cartography),S. Fabrikant & M. Wachowicz (eds.). Springer-Verlag: Berlin, etc. pp. 217-230.

RIMapperWMS: a WMS providing SVG maps with a built-in client 13
As all components of the system are either developed by ourselves, orexisting Open Source software, we are able to offer the whole system in asimple-to-deploy package, with installation instructions and example data.The system is made available under an Open Source license and we inviteanyone interested to experiment with the system, provide us with feedback orfurther develop the functionality.
4 Conclusion and Outlook
This project made it clear that RIMapperWMS was a logical extension ofthe series of software projects that all are based on the SDIlightphilosophyexplained in the section 2. These projects have served well as a test-bed andproof-of-concept platform for a limited group of students and researchers.Because this latest branch on the tree is implementing the popular OpenStandard WMS, we hope it might also be used in a broader context, by personsand institutions that have a need for a relatively light-weight, yet reasonablypowerful way of disseminating their spatial data through the Web.
Furthermore, we conclude that making the WMS produce SVG outputwith a built-in Graphical User Interface is possible within the OGC specifica-tion and indeed makes the output light-weight and easily deployed.
We plan to further develop RIMapperWMS. Extending the functionalityto a Queryable WMS, by adding support of the GetFeatureInfo interface,is high on the wish-list, other plans include support for client-side or server-side Styled Layer Descriptors and Web Map Context Documents. Dependingon the developments of the underlying libraries, we also hope to be able toinclude WMS 1.3.0 support at a later date.
When the application is considered stable, we plan to do useability andperformance tests of our architecture, especially for use on mobile devices. In-cluded in these tests should be a comparison between our strategy of includingthe GUI in the SVG response with the more ‘typical’ approach of having astand-alone SVG capable client consuming the WMS.
Acknowledgments. As mentioned earlier, RIMapperWMS grew out of a num-ber of projects, and the students and researchers involved are gratefully ac-knowledged for their contributions: Georgi Koprinkov, Stephanie Krane, Mau-rizio Latini, Nirvana Meratnia, Kavitha Muthukrisnan, Sebastiaan Waanders.
References
1. Arthur H. van Bunningen, Ling Feng, and Peter M.G. Apers. Context forubiquitous data management. In Katsumi Tanaka, Yutaka Kidawara, and KojiZettsu, editors, the 2005 International Workshop on Ubiquitous Data Manage-ment (UDM’05), pages 17–24, Tokyo, 2005. The IEEE Computer Society.
Published in:The European Information Society - Leading the way with Geo-information
(Lecture Notes in Geoinformation and Cartography),S. Fabrikant & M. Wachowicz (eds.). Springer-Verlag: Berlin, etc. pp. 217-230.

14 Barend Kobben
2. Carto:Net. SVG navigation tools tutorial, Last accessed: March 2006.http://www.carto.net/papers/svg/samples/.
3. Richard Groot and J. McLaughlin. Geospatial data infrastructure; concepts,cases and good practice. Oxford University Press, Oxford, etc., 2000.
4. Open Geospatial Consortium Inc. Web Map Service Implementation Specifica-tion (1.1.1). Technical Report 01–068r3, OGC, 2002.
5. International Institute for Geo-Information Science and Earth Observa-tion (ITC). RIMapper project pages, Last accessed: February 2007.http://kartoweb.itc.nl/rimapper/.
6. Barend Kobben. RIMapper—a test bed for online Risk Indicator Maps usingdata-driven SVG visualisation. In Georg Gartner, editor, 2nd Symposium onLocation Based Services and TeleCartography, Geowissenschaftliche Mitteilun-gen, pages 189–195, Wien, 2004. Institute of Cartography and Geo-Media Tech-niques.
7. Barend Kobben and Stephanie Krane. CampusMapper—a light-weight internetmapping tool using MySQL, Tomcat and SVG, Last accessed: September 2006.Unpaginated CD and website: http://www.foss4g2006.org/.
8. Barend Kobben, Kavitha Muthukrisnan, Nirvana Meratnia, and Georgi Ko-prinkov. Wireless Campus LBS—A testbed for cartographically aware databaseobjects. In Georg Gartner, editor, Symposium 2005 Location Based Services &TeleCartography, Geowissenschaftliche Mitteilungen, pages 47–51, Wien, 2005.Research group Cartography, Institute of Geoinformation and Cartography, TUWien.
9. Maurizio Latini and Barend Kobben. A web application for landslide inven-tory using data-driven SVG. In Peter van Oosterom, Siyka Zlatanova, and El-friede M. Fendel, editors, the 1st international symposium on Geo-informationfor Disaster Management, pages 1041–1054, Berlin, etc., 2005. Springer-Verlag.
10. Kavitha Muthukrishnan, Maria Eva Lijding, and Paul Havinga. TowardsSmart Surroundings: Enabling Techniques and Technologies for Localization.In LOCA2005 – co-allocated with the 3rd International Conference on Perva-sive Computing, page 11, Munich, 2005. Springer Verlag.
11. Kavitha Muthukrishnan, Nirvana Meratnia, and Maria Lijding. FLAVOUR—Friendly Location-aware conference Aid with priVacy Observant architectURe.Technical Report TR–CTIT–05–28, University of Twente, CTIT, 2005.
12. Open Geospatial Consortium Inc. Compliance Testing page, Last accesed:February 2007. http://www.opengeospatial.org/resource/testing/.
13. Open Geospatial Consortium Inc. Implementation by Specification page,Last accesed: February 2007. http://www.opengeospatial.org/resource-
/products/byspec.14. Open Geospatial Consortium Inc. Implementation Statistics page, Last accesed:
July 2006. http://www.opengeospatial.org/resource/products/stats.15. Frank Warmerdam. PROJ4. Cartographics Projections Library, Last accessed:
December 2006. http://www.remotesensing.org/proj/.
Published in:The European Information Society - Leading the way with Geo-information
(Lecture Notes in Geoinformation and Cartography),S. Fabrikant & M. Wachowicz (eds.). Springer-Verlag: Berlin, etc. pp. 217-230.


![interoperability.blob.core.windows.netinteroperability.blob.core.windows.net/web/MS-SVG/[MS … · Web view[MS-SVG]: Internet Explorer Scalable Vector Graphics (SVG) Standards Support](https://img.pdfslide.us/doc/110x75/5a6fc5167f8b9ac0538b61d3/interoperabilityblobcorewindowsnetinteroperabilityblobcorewindowsnetwebms-svgms.jpg)