Embed Size (px)
Citation preview

Rigorous Tests of Student Outcomes in CTE Programs of Study: Year 3 Report
June 2011
Marisa Castellano, Kirsten Ewart Sundell, Laura T. Overman,
and Oscar A. Aliaga • University of Louisville

Rigorous Tests of Student Outcomes in CTE Programs of Study: Year 3 Report
Marisa Castellano Kirsten Ewart Sundell
Laura T. Overman Oscar A. Aliaga
June 2011
National Research Center for Career and Technical Education Louisville, KY

ii
Funding Information
Project Title: National Research Center for Career and Technical Education Grant Number: VO51A070003
Act Under Which Funds Administered:
Carl D. Perkins Career and Technical Education Act of 2006
Source of Grant: Office of Vocational and Adult Education U.S. Department of Education Washington, D.C. 20202
Grantees: University of Louisville National Research Center for Career and Technical Education 354 Education Building Louisville, KY 40292
Project Director: James R. Stone, III
Percent of Total Grant Financed by Federal Money:
100%
Dollar Amount of Federal Funds for Grant:
$4,500,000
Disclaimer: The work reported herein was supported under the National Research Center for Career and Technical Education, PR/Award (No. VO51A070003) as administered by the Office of Vocational and Adult Education, U.S. Department of Education.
However, the contents do not necessarily represent the positions or policies of the Office of Vocational and Adult Education or the U.S. Department of Education and you should not assume endorsement by the Federal Government.
Discrimination: Title VI of the Civil Rights Act of 1964 states: “No person in the United States shall, on the ground of race, color, or national origin, be excluded from participation in, be denied the benefits of, or be subjected to discrimination under any program or activity receiving federal financial assistance.” Title IX of the Education Amendment of 1972 states: “No person in the United States shall, on the basis of sex, be excluded from participation in, be denied the benefits of, or be subjected to discrimination under any education program or activity receiving federal financial assistance.” Therefore, the National Research Center for Career and Technical Education project, like every program or activity receiving financial assistance from the U.S. Department of Education, must be operated in compliance with these laws.

i
Table of Contents
Rigorous Tests of Student Outcomes in CTE Programs of Study 1 Purpose and Significance of the Study 2 Theory of Change 3 Student Outcomes 4 Conceptual Base: Engagement, Achievement, Transition 5 Research Questions 9 Method 9 Sample 9 Measures 18 Study Design 19 Results: West District 24 Site Descriptions: Treatment Schools 24 POS Results: Treatment Schools 32 Site Descriptions: Control Schools 44 POS Results: Control Schools 50 Ninth-Grade CTE Results 55 Ninth-Grade Academic and Attendance Results 56 Student Survey Results 62 Results: East District 68 Site Description: Treatment School 68 POS Results: Treatment School 72 Site Descriptions: Comparison Schools 76 POS Results: Comparison Schools 81 Ninth-Grade CTE Results 86 Ninth-Grade Academic and Attendance Results 89 Student Survey Results 93 Discussion 97 POS Descriptive Results 97 CTE Results 99 Academic Results 100 Student Survey Results 102 Conclusions 103 References 105 Appendices 109 Appendix A: Who Was Lost to the Sample 109 Appendix B: Student Survey – Respondent Characteristics 113

ii
List of Tables Table 1 Selected Characteristics of Participating School Districts and Their Populations 10 Table 2 Baseline Characteristics of Sample, West District 14 Table 3 Baseline Attendance and Prior Achievement of Sample, West District 15 Table 4 Baseline Characteristics of Sample, East District 17 Table 5 Baseline Attendance and Prior Achievement of Sample, East District 17 Table 6 2008-2009 Demographic Characteristics of West District POS Schools 26 Table 7 2008-2009 Demographic Characteristics of West District Control Schools Visited in 2010 45 Table 8 Number of CTE Courses Taken, 2008-2009, West District 55 Table 9 GPA for CTE Courses Taken, 2008-2009, West District 55 Table 10 Academic GPA, 2008-2009, West District 57 Table 11 On Track for Graduation, 2008-2009, West District 57 Table 12 Honors Mathematics and English Coursetaking, 2008-2009, West District 58 Table 13 Levels of Math Courses Taken by Semester, 2008-2009, West District 60 Table 14 Students Taking Any Type of Algebra I Course, 2008-2009, West District 60 Table 15 Percent Students Passing Any Algebra I, 2008-2009, West District 61 Table 16 Percent Students Passing Math Courses Above Algebra I, 2008-2009, West District 62 Table 17 Ninth Grade Attendance Rates, 2008-2009, West District 62 Table 18 Student Survey Response Rates by Treatment Status, West District 63 Table 19 Characteristics of Respondents to Student Survey, West District 64 Table 20 Student Survey Responses, Identifying Job or Career Interests, West District 65 Table 21 Student Survey Responses, High School Teachers, West District 65 Table 22 Student Survey Responses, High School Courses, West District 65 Table 23 Student Survey Responses, College and Career Planning, West District 66 Table 24 2008-2009 Demographic Characteristics of East District POS School 69 Table 25 2008-2009 Demographic Characteristics of East District Comparison Schools 76 Table 26 Number of CTE Courses Taken, 2008-2009, East District 86 Table 27 Technical Skills Assessments Taken, 2008-2009, East District 87 Table 28 Technical Skills Assessments Taken Most Frequently, 2008-2009, East District 87 Table 29 Percent Proficient Scores on Technical Skills Assessments, 2008-2009, East District 88 Table 30 Most Proficient Scores on Technical Skills Assessments, 2008-2009, East District 89 Table 31 Academic GPA, 2008-2009, East District 89 Table 32 On Track for Graduation, 2008-2009, East District 90 Table 33 Honors Mathematics and English Coursetaking, 2008-2009, East District 90 Table 34 Levels of Math Courses Taken, 2008-2009, East District 91 Table 35 Students Taking Any Type of Algebra I Course, 2008-2009, East District 91 Table 36 Percent Students Passing Any Algebra I, 2008-2009, East District 92 Table 37 Ninth Grade Attendance Rates, 2008-2009, East District 92 Table 38 Student Survey Response Rates by Treatment Status, East District 93 Table 39 Characteristics of Respondents to Student Survey, East District 93 Table 40 Student Survey Responses, Identifying Job or Career Interests, East District 94 Table 41 Student Survey Responses, High School Teachers, East District 95 Table 42 Student Survey Responses, High School Courses, East District 95 Table 43 Student Survey Responses, College and Career Planning, East District 96

iii
Appendix Tables Table A1 Baseline Characteristics, West District Sample Versus Lottery Applicant Pool Versus District
Middle School Population, 2007-2008 110
Table A2 Prior Achievement and Attendance, West District Sample Versus Lottery Applicant Pool Versus District Middle School Population, 2007-2008
112
Table B1 Background Characteristics of Survey Takers and Nontakers, by Treatment Status, West District 113 Table B2 Background Characteristics of Survey Takers and Nontakers, by Treatment Status, East District 114

1
Rigorous Tests of Student Outcomes in CTE Programs of Study This longitudinal study, currently in its third of four years, is being conducted in the context of the reauthorization of the Carl D. Perkins legislation (2006), which funds career and technical education (CTE) nationwide. The recent reauthorization, known as Perkins IV, modified existing practice by increasing program accountability in the areas of academic achievement, technical skills achievement, and alignment with postsecondary technical education in the form of programs of study (POS). The Perkins mandate sets a high standard, but many states and local education agencies had already begun to develop programs to achieve these goals. This study estimates the impact of POS on student academic and technical achievement outcomes in high school. The study also addresses several of the research strands identified by the U.S. Department of Education (USDE), Office of Vocational and Adult Education (OVAE) as integral to the agenda of the National Research Center for Career and Technical Education (NRCCTE). First, this scientifically based study in schools implementing CTE POS seeks to identify successful models for addressing the education and training needs of high school students. We are examining the effects of POS on student outcomes compared to the traditional high school experience. Second, the results of this study may be used to increase the effectiveness and improve the implementation of POS at other high schools so that they implement coherent and rigorous CTE content aligned with challenging academic standards. The study is generating important results toward this end: longitudinal student outcome information on programs of study, including academic, technical, and work readiness measures. We have used the NRCCTE’s conceptual base (NRCCTE, 2008) of student engagement, achievement, and transition to form research questions, develop instruments and measures, and assess the effectiveness of participating POS. Student engagement is evident from students’ attendance and whether or not they stay in school—measures that are included in this study. We also focus on student achievement by investigating whether POS, which integrate coherent and rigorous technical content with challenging state academic standards, result in improvements in the academic achievement of students. The experimental portion of this study assesses the impact of POS on academic and technical outcomes compared to control groups, which have been made up of students who applied to be in the POS but were not selected in a random assignment process. We are applying the same research questions to the quasi-experimental portion of the study, comparing outcomes in our treatment group to a well-matched comparison group. The final results of this study will make an important contribution to the establishment of the efficacy of CTE programs of study. The interim results included in this report show that participating POS show evidence of the increased academic and technical rigor that Perkins IV was designed to infuse into CTE, but it is too early to make definitive statements about student outcomes in CTE POS high schools compared to control or comparison students in non-POS high schools. In addition to examining high school engagement and achievement measures, this study also seeks to investigate the transition of POS students to post-program employment or postsecondary education. Our student cohort, in the 11th grade at the time of this writing, will be on the cusp of

2
making this transition at the conclusion of our four-year longitudinal study. Should opportunities permit, we will seek to extend the study and report on the numbers of POS students who continue their education at articulating community colleges, including their first-year coursework. In addition, we anticipate that some students will transition directly to the workplace. Should an extension of the study be funded, we would report on those outcomes, especially job placement, wages, and job retention after six or nine months. This report describes very early findings from this longitudinal study of student outcomes in POS. The remainder of this introduction describes the intervention known as POS, the theory of change hypothesized to emerge from implementation of POS, and the kinds of outcomes being measured. A description of the study’s conceptual base, drawn from that of the NRCCTE, follows. The Methods section describes the study’s sample selection, baseline characteristics of the sample, measures we will use to estimate the impact of POS, and study design. Results are presented in two separate sections by district. These sections present data from two years of qualitative data collection and one year of systems achievement data. These sections also offer rich descriptions of our sites based on school visits, participant interviews, and classroom observations; these descriptions allow us to synthesize how the CTE (POS or non-POS) we observed did or did not meet the requirements of POS. Also presented are ninth-grade CTE and academic results, including GPA and mathematics coursetaking analyses. Each district results section concludes with findings from our student survey. Our Discussion section summarizes these results and offers some preliminary conclusions. Purpose and Significance of the Study This study was proposed in the context of the reauthorization of the Perkins legislation, which modified existing practice by increasing program accountability in the areas of academic achievement, technical skills achievement, and alignment with postsecondary technical education—in the form of POS. This study seeks to document student outcomes in districts large enough to allow for subgroup analyses and analyses of moderating conditions that might affect the impact of POS. Description of the intervention. According to the Perkins legislation, there are several components to CTE POS, which:
(i) must incorporate secondary education and postsecondary education elements; (ii) must include coherent and rigorous content aligned with challenging academic standards and relevant career and technical content in a coordinated, nonduplicative progression of courses that align secondary education with postsecondary education to adequately prepare students to succeed in postsecondary education; (iii) may include the opportunity for secondary education students to participate in dual or concurrent enrollment programs or other ways to acquire postsecondary education credits; and (iv) must lead to an industry-recognized credential or certificate at the postsecondary level, or an associate or baccalaureate degree (Perkins IV, Section 122[c][1][A]).
Because these were the legal components of POS, they were among the criteria we used to select our sites. Other criteria included the districts’ ability to support our study design (see Method,

3
below). Control and comparison group students from these districts have CTE programs at the comprehensive high schools they attend, and some students avail themselves of these programs. Those who do not take academic and elective courses that are typical of the range of such courses offered in contemporary American high schools. Differences between treatment and control/comparison sites. Overall, students participating in CTE programs at the control or comparison schools do not consistently experience all of the mandated elements of POS, because they were not mandated for all CTE programs with the passage of Perkins IV in 2006. For example, for students who participate in CTE programs at the control or comparison schools, these programs may not employ course sequencing to the extent that POS do. Non-POS CTE courses also may not have any postsecondary elements incorporated, or they may not have the same rigorous academics that POS enjoy. Similarly, the CTE courses at control or comparison schools may not include the opportunity to earn dual credit or industry-recognized credentials. During our site visits at the control and comparison schools, we observe CTE classes, study course catalogs, and interview school administrators, teachers, and guidance personnel who can help us understand the extent to which their CTE programs contain any elements of POS; we report these qualitative results elsewhere in this report. Generally speaking, given the level of support that POS have with respect to staff and resources in the participating districts, it is unlikely that CTE courses at comprehensive high schools can provide all of the components that POS programs do. We refer the reader to later sections on fidelity of implementation and mediating/moderating variables for more detail on how we will identify and document critical differences between the treatment and control conditions. Theory of Change POS change several aspects of the default high school experience. POS upgrade CTE, a program that has been perennially popular among students but traditionally considered less academically rigorous than college preparatory tracks in high school, and directed towards students not interested in attending college. As laid out in Perkins IV, POS infuse CTE with rigorous academics1
and seamless postsecondary connections; if implemented as mandated, POS may potentially lead to improved student outcomes in terms of high school achievement and completion and postsecondary matriculation.
POS differ from the CTE programs that might exist in the control or comparison high schools in their non-duplicative sequencing of secondary and postsecondary curriculum, in their rigorous content aligned with academic standards, in their opportunities for dual credit, and/or in their inclusion of a credential where relevant. Standard CTE programs might offer several of these elements but in the case of the participating districts in this study, only the POS offer the full set 1 The drumbeat for more rigorous academics has grown increasingly loud in recent years, and is perhaps best embodied by the “rigor and relevance” movement (Daggett, 2005), which calls for “effective learning, which takes place when standards, curriculum, instruction, and assessment interrelate and reinforce each other” (p. 1), and the Common Core State Standards, a multi-state initiative coordinated by the National Governors Association Center for Best Practices and the Council of Chief State School Officers (Achieve, 2010). The Common Core State standards, based on national and international benchmarks, will “define the knowledge and skills students should have within their K-12 education careers so that they will graduate high school able to succeed in entry-level, credit-bearing academic college courses and in workforce training programs” (Common Core State Standards Initiative, 2010).

4
of elements. More typical CTE programs still exist in the comprehensive high schools that serve as control or comparison schools. These two districts have chosen to create high schools dedicated to POS in the form of career academies or magnets. There are other such “specialty” high schools in the districts besides the participating schools, but they are not included in our sample. In addition to being a departure from traditional CTE, POS are also different from the typical high school experience for college preparatory students. POS provide the opportunity for college preparatory students accustomed to standard academic courses to be challenged in hands-on, career-based ways; they can also decrease the financial burden of higher education by allowing students to earn postsecondary credits in high school. The implicit theory of change is that infusing CTE programs with rigorous academics and postsecondary connections will (1) help students see the relevance of the academic subjects they are studying, and (2) attract a broad range of students of all levels of academic ability and interest, both of which should improve overall student outcomes. Student Outcomes It is hypothesized that student participation in POS will affect student academic and technical achievement outcomes in high school as well as the transition into postsecondary education, the military, or the workplace. These are in fact the indicators from the Perkins IV legislation. We will use the same indicators from that legislation to measure student outcomes in this study:
• Student attainment of challenging academic content standards and student academic achievement standards, as measured by the state-determined proficient levels on the academic assessments (Perkins indicators 1S1 and 1S2).
• Student attainment of career and technical skill proficiencies, including student achievement on technical assessments that are aligned with industry-recognized standards, where available and appropriate (Perkins indicator 2S1).
• Student rates of attainment of (1) a high school diploma, (2) a General Education Development (GED) credential, or other state-recognized equivalent (including recognized alternative standards for individuals with disabilities), and/or (3) a proficiency credential, certificate, or degree, in conjunction with a secondary school diploma (if offered by the state in conjunction with a secondary school diploma) (Perkins indicator 3S1).
• Student graduation rates (Perkins indicator 4S1). • Student placement in postsecondary education or advanced training, military service, or
employment (Perkins indicator 5S1). • Student participation in, and completion of, career and technical education programs that
lead to employment in non-traditional fields (Perkins indicators 6S1 and 6S2). These legislation-mandated outcomes fit the Center’s organizing framework of using CTE to improve students’ engagement, achievement, and transition and address issues of interest to OVAE and policymakers.

5
Conceptual Base: Engagement, Achievement, Transition Since A Nation at Risk (National Commission on Excellence in Education, 1983) decried the state of U.S. education and the challenges in preparing workers for the workforce of the future, the United States has embarked on reform efforts to improve its education and workforce preparation systems in light of forecasts of a changing labor force and changing work. The report cited high U.S. dropout rates and rates of college remediation and highlighted the difficulties American youth face as they “churn” (Osterman & Iannozzi, 1993) through the labor market, moving from job to job until they find one with their desired benefits and qualities. The U.S. economy of the 21st century is indeed different from that of the 20th: Gone are the traditional manufacturing jobs that provided many Americans with a middle class way of life. Cheaper labor across the globe now produces many of our goods, and technological advances in industry have also led to job losses as machines do the work once done by people. Current and future workers must be provided with the tools they need to enter the labor market and develop a career. This is not solely an American problem. Internationally, such issues have come to the fore among many developed nations because they also must respond to changing technology and the global economy. The Organisation for Economic Cooperation and Development (OECD, 2010) recently released a report, Learning for Jobs, stressing the importance of VET (vocational education and training, an international term for CTE) as a means of ensuring that youth and other trainees receive the skills they need to succeed. The OECD report recommended that countries use industry input to retool their education and training systems. Among the report’s specific recommendations, several are noteworthy for their similarity to recommendations made in Perkins IV, which preceded the report’s publication. The OECD report recommended incorporating such elements as soft skills, career guidance, and work-based learning opportunities into VET. Such elements are mentioned, although not mandated, in Perkins IV. Several organizations are actively participating in the conversation on school reform and workforce preparation, either by recommending action by federal and state governments (American Youth Policy Forum, 2008) or by examining the international context for possible solutions (Symonds, Schwartz, & Ferguson, 2011). The Symonds et al. Pathways to Prosperity report concluded that other countries enjoy better educational and economic outcomes than the United States for a variety of reasons (Symonds et al., 2011). The report reviewed data on American youth and young adults—including the United States’ high secondary dropout and college remediation rates, lack of apprenticeship opportunities, low postsecondary completion rates, and high rates of youth unemployment—and concluded that in the United States, too many youth enter adulthood without the skills they need to begin their careers. The authors recognized that for social and historical reasons, European solutions to youth development and preparation issues (e.g., national apprenticeship programs) would not work if simply transplanted to the United States. The report outlined examples of homegrown reforms that could have similar positive effects on workforce preparation. A U.S. youth development and preparation system must include multiple pathways to success—as opposed to suggesting that a four-year university education is the only way to success. It must include an employer role, and it also must be part of “a new social compact between society and its young people” (p. 23). Some of the report’s

6
recommendations are in fact found in Perkins IV: POS are prime examples of potential multiple pathways to success, and Perkins includes individual graduation plans and dual credit opportunities as authorized activities to enhance the CTE experience, as recommended by the Pathways to Prosperity report. One need not look outside of the United States for ideas on how to make our education system more useful and relevant for students and more beneficial to the economy. Education Week releases a yearly special issue on high school graduation rates and related topics. For 2011, Education Week chose to focus on the critical link between learning and jobs, noting that the focus on “college and career ready” has emphasized college preparation over all other options (Editorial Projects in Education [EPE], 2011). This has fed a “college for all” approach that has not been helpful for the majority of students who fall into one of several categories: high school non-completers (28% of the class of 2008; EPE, 2011), those who do not attend college in the fall immediately following high school graduation (31% in 2008; Aud et al., 2011), and those who do not complete a postsecondary program in the traditional timeframe. The latter outcomes are not yet known for the class of 2008, but even without that information, already 59% of the class of 2008 has not benefited from the “college for all” approach. High dropout and disengagement among high school students (Bridgeland, DiIulio, & Morison, 2006) has caused many policymakers to search for alternative approaches. The Education Week report described alternative approaches such as high school and postsecondary CTE programs that lead to associate degrees, certificates, and industry-recognized credentials that can help youth find skilled employment and give students the option of later returning to school for a higher degree. It appears that approaches are coming to the fore that go beyond expecting all young people to enroll in four-year universities. POS, as mandated in Perkins IV, are one such approach. This study seeks to uncover whether POS, if implemented as mandated, will (a) provide learning opportunities for high school students outside of the high school, whether this be in a college or workplace to enhance student engagement; (b) apply academic subjects to real work and real problem-solving to improve student achievement; and (b) develop programs that purposely span secondary and postsecondary so as to encourage young people to obtain education and credentials beyond high school to facilitate transition out of high school. What is known about the role of CTE in advancing this engagement, achievement, and transition framework is briefly reviewed below. Student engagement. As an example of curricular programming that is relevant to students, CTE has been proposed as a means of increasing student engagement and reducing dropout rates (Castellano et al., 2007; Plank, 2002; Plank, DeLuca, & Estacion, 2005). Engagement is a precursor to student achievement in and completion of high school, which itself is a precursor to a successful transition to postsecondary education or work. One study using the National Education Longitudinal Study of 1988 (NELS:88) dataset studied the relation between participation in CTE and dropping out, finding no relation between students classified as CTE concentrators (defined as those who took three or more CTE credits in a single program) and a reduced probability of dropping out of high school (Silverberg, Warner, Fong, & Goodwin, 2004). However, Silverberg et al. did not include dropouts in their analysis.

7
Plank (2002) similarly used the NELS:88 to describe the respective roles of CTE and academic coursework in dropping out. However, Plank elected to include dropouts in his analysis. Because these students had dropped out, their transcripts were incomplete and could not be categorized as CTE or any other concentration. Instead, Plank examined CTE as a proportion or ratio of the high school experience. He found that up to a certain point of inflection (about three Carnegie units of CTE to every four academic units), increasing the ratio of CTE coursework in high school lowered the probability of that student dropping out of high school. This was especially true for lower achieving youth. He concluded that a balanced combination of CTE and academic courses may reduce the risk of dropping out. There are three reasons why Plank’s method improved on previous studies. First, students often “concentrate” on CTE during their last two years of high school, so if students have dropped out, there will not be as many concentrators. Second, many students take CTE courses without ever completing a sequence and becoming a concentrator. Finally, it is simply more accurate to include the dropouts rather than censor them from the sample, which ends up distorting the CTE course influence on student dropout, as well as skewing the sample of high school students. However, there were concerns about the directionality of the association in Plank’s analysis (Plank et al., 2005), so he and his colleagues took their analysis a step further. Rather than employing standard logistic regression methods, Plank et al. used a different statistical technique—a hazards model with time-varying covariates reflecting the curricular mix. They reported that hazards models are useful for (a) describing the timing of life course events and (b) building statistical models of the risk of an event’s occurrence over time. Using the National Longitudinal Study of Youth of 1997 dataset, they found the same effect, although the point of inflection was 0.54 rather than 0.77. This translates into roughly one CTE credit earned for every two core academic credits. They found that this course-taking ratio was not significant for older students, who are at a higher risk of dropout regardless of other factors like participation in CTE. In a longitudinal study of student outcomes at high schools undertaking career-based whole school reforms, Castellano et al. (2007) used a similar technique for their analysis of the CTE effect on dropout. This study found that in each of the three comparisons, the odds of a student dropping out declined as the proportion of the high school experience invested in CTE courses increased, regardless of whether the student attended the treatment school or a comparison school. Due to the small sample size, no point of inflection was calculated. This study was quasi-experimental in nature, and although the comparison groups were closely matched, it was not a randomized controlled trial; as such, its results are merely suggestive of a causal relationship. Although certainly not definitive, these studies cumulatively suggest the value of CTE in student engagement and persistence and argue for further research. This study contributes to this literature by including dropout as an outcome in establishing the efficacy of CTE programs of study. Qualitative research is also being conducted at the sites in order to gather additional information about student engagement and dropout. Academic achievement. Regarding the impact of CTE participation on academic achievement, the results of previous studies have been mixed or shown no effect (Agodini & Deke, 2004;

8
Castellano et al., 2007; Kemple & Snipes, 2000; Stone, 2004). Other research shows CTE students making academic achievement gains in CTE programs where mathematics is embedded in the curriculum (Stone, Alfeld, & Pearson, 2008). In a random assignment experimental design, Stone et al. showed that students in math-enhanced CTE classes performed significantly better than control students on tests of math ability, without any negative impact on measures of technical skills achievement. The Stone et al. model described a promising direction for CTE, one that has been demonstrated in a rigorous test to improve academic achievement in various CTE program areas. Student transitions to postsecondary education and work. Many young people start college in the first year or two following high school, but only a relatively small percentage successfully complete college: Data from the high school class of 2002 show that nearly 43% of those who entered a postsecondary institution immediately after high school did not complete a four-year degree in six years; 73% did not complete a two-year degree in three years (Aud et al., 2011). Kemple’s longitudinal study of career academy student outcomes (Kemple & Scott-Clayton, 2004; Kemple & Willner, 2008) found no significant difference in postsecondary education enrollment or attainment rates over the control group. The changes to CTE and the Perkins legislation since these analyses were conducted call for updated analyses with more current data. Regarding the transition to work, evidence of the value of high school CTE is again mixed. Silverberg et al. (2004) reported correlational analyses of NELS:88 data showing no advantage to CTE students over other high school groups in terms of earnings. These analyses were not available to us for critical review. A different analysis of the same dataset showed high short- and medium-term payoffs (18 months to 8 years) of high school CTE courses for students who did not attend college (Bishop & Mane, 2004). Meer (2007) also used the NELS:88 in his examination of the returns to secondary CTE. Meer’s analytical model allowed him to compare alternative hypothetical outcomes for each track, showing how different types of students benefit from different tracks. He found that although CTE students from technical areas earned less than students from other tracks eight years after high school graduation, those same CTE students would not have earned more had they chosen an academic track. He concluded that technical CTE programs best serve the students who choose them. Kemple and Willner (2008) reported on labor market outcomes eight years after graduation from the career academies in their longitudinal study. They found that young men’s monthly earnings and hours worked per week were significantly higher than the control group, and that this was consistently so for the group that had been at high risk to graduate high school. Young women did not enjoy the same impacts. Young men were also found to be more likely to be married and living independently with their spouse and child than the non-career academy group, suggesting that career academies might improve family formation and social adjustment outcomes. Griffith and Wade (2002) conducted a smaller-scale study and found that CTE program participants had higher annual earnings six years after high school than did nonparticipants. However, this latter study did not control for systematic differences among students, such as student background characteristics or prior test scores, which might lead some to participate in CTE but not others. Most of these studies on the effects of CTE share the same methodology for determining the effect of high school CTE on earnings. They are based on correlational analyses of large
9
datasets; such analyses cannot provide the same kind of strong evidence of effectiveness as random assignment experiments, because they cannot fully control for unobserved variables that might create systematic differences between groups. In addition, the NELS:88 database consists of the high school graduating class of 1992, making this dataset nearly 20 years old. Policy changes since then make results from NELS:88 somewhat less relevant to current conditions. Although a convergence of correlational data does begin to signal some evidence of effectiveness, no such convergence has come to studies of CTE and earnings. Overall, it is clear that more research is necessary on the effects of CTE on engagement, achievement, and transition. One issue with most previous studies is that they were conducted within a very different policy environment. Perkins IV requires specific elements to be present in CTE programs of study—for instance, accountability for academic achievement—that change the essence of these programs. New research is needed to establish post-Perkins IV baselines. Research Questions The role of CTE in student engagement, achievement, and transition has been studied but continues to be unclear. The recent changes to federal legislation on CTE and the new requirement of POS lead to the research questions: To what extent does participation in a POS lead to improved student outcomes as compared to outcomes of (1) a cohort of control group students (who applied to be in the program but were not selected in a lottery process), or (2) a cohort with a closely matched comparison group? Specifically, to what extent does POS participation increase student:
a. academic achievement? b. technical skills achievement? c. high school completion? d. employability? e. completion of coursework leading to college credits? f. participation in and completion of programs by students considered nontraditional
for their gender (e.g., female students in automotive). How do POS differ from the traditional high school experience at the schools that the control and comparison group students attend?
Method
Sample We wanted to conduct the most rigorous test possible of the impact of POS on student achievement. This meant a random assignment to the treatment and control conditions (Shadish, Cook, & Campbell, 2002). To accommodate this study design, we looked for districts that had existing lotteries to place students in POS programs. West District was such a site. There, we have included three treatment schools and over twenty control schools (the home high schools of students not selected by the lottery). It is generally recognized, however, that finding true random assignment conditions in educational contexts is difficult. As described below, we

10
secured the participation of a strong POS school and four comparison schools in East District although no lottery was held there. A third district joined the study in Year 4. It uses a lottery to assign students to its POS. We will receive data on South District in time for the final report, at which time we will describe those participating schools. In this interim report, we only report results from West and East districts. Once we had secured the support of West and East districts, they began to identify our samples as we gathered descriptive information on the district contexts. Table 1 summarizes some important characteristics of the districts during our cohort’s freshman year (2008-2009) compared to the most recently available national averages (2006-2007). Table 1 Selected Characteristics of Participating School Districts and Their Populations
National Average West District East District
Characteristics 2006-2007 2008-2009 2008-2009 District Characteristics
Minority students (%) 45.01a 64.71b 66.31b Free lunch eligible (%) 41.8 42.6 48.7 Student/teacher ratio 15.4 17.2 14.3 Per pupil expenditure2 $10,4003 $7,546 $8,794
Population Characteristics Total population in district 16,7024 1,375,365 695,454 Population density of city per square mile5 79.6 4222.3 2232.3 Minority (%)6 31.9 28.4 38.9 All persons living below the poverty line (%)7 12.4 10.8 9.2 Children under 18 living below the poverty line (%)8
16.6 14.6 11.5
Youths ages 16 to 19 who are not enrolled in school (%)
20.2 31.4 21.4
Youth unemployment rate (ages 16 to 19) 9.3 9.7 11.1 Unemployment rate 3.7 4.2 3.7 Households receiving public assistance (%) 3.4 2.4 2.3 Median household income $41,994 $44,616 $50,579 Persons age 25 or over with a high school diploma (%)
80.4 79.5 86.2
Sources. National averages of characteristics were obtained from the website of SchoolDataDirect, an online service of the Council of Chief State School Officers’ State Education Data Center, http://www.schooldatadirect.org/app/location/q/stid=1036196/llid=162/stllid=676/locid=1036195/catid=-1/secid=-1/compid=-1/site=pes. Notes. District characteristics data were obtained from district websites or reports and the U.S. Department of Education Common Core of Data website, http://nces.ed.gov/ccd/. Population characteristics were based on 2000 Census data obtained from the U.S. Census website, http://www.census.gov/. 1a Sum of number of Native American, Black, Latino, and Asian students divided by the total number of students with reported race/ethnicity data. 1b Percent of students enrolled in the school district who identified as not White (i.e., identified as Black, Asian, Latino, or Native American). 2 Per pupil expenditures may not be comparable because districts may vary in their definition of what to include in total expenditure per student. 3 Based on 2006 data from SchoolDataDirect. 4 Total number in population from U.S. Census, divided by the number of districts in 1999-2000 from http://nces.ed.gov/pubs2001/100_largest/discussion.asp#tableA.5 Population density is based on the city in which each school district is located. 6 These percentages were calculated by subtracting the percent White (one race only) who are not Latino from 100%. 7 Percent of all individuals with a known poverty status who are living below the poverty line in the county in which the district resides. 8 Percent of individuals under 18 living below the poverty line in the county in which the district resides.

11
West District, located in a Western state, serves a large urban student population, over 60% of whom self-identify as ethnic minorities (see Table 1). Over 40% of the students are eligible for the federal free lunch program. West District has a larger student-teacher ratio and a lower per-pupil expenditure than the national average. In terms of population, West District has more people per square mile than the national average as well as a higher percentage of people who identify as minorities, but fewer people living below the poverty line. West District has a high percentage of youth ages 16 to 19 who are not enrolled in school. Unemployment rates are higher than the national average, but median incomes for workers are higher. East District is located in a large city in the Eastern United States. Over 65% of students self-identify as ethnic minorities, and almost half are eligible for the federal free lunch program (see Table 1). East District’s per-pupil expenditure is lower than the national average. The population density per square mile in the East District catchment area is greater than the national average. East District has a higher percentage of people who identify as minorities than the national average, yet fewer people living below the poverty line. The percentage of youths ages 16 to 19 who are not enrolled in school in East District is similar to the national average. The overall unemployment rate is the same in East District as the national average, although the youth unemployment rate is higher. Workers in the East District area earn higher median incomes; there are more high school graduates than the national average. In noting these differences between the two districts participating in this study compared to the national averages, it is important to remember that the national average includes many rural districts, yet West and East Districts are urban. West District’s baseline student sample. A lottery is held every spring in West District for oversubscribed high school choice options. There are program choices with standard eligibility criteria and programs with rigorous eligibility criteria. The first step consists of a pre-screening process, where students must qualify under the criteria of the programs they apply for or they are considered Not Qualified and do not participate in the lottery for that program. Like many districts, certain lottery preferences are provided in order to minimize student travel and maximize student diversity across schools. West District reserves 25% of the available seats at any school for sibling preference, 25% for geographical preference, and 25% for feeder preference. The remainder of the seats available—and those not taken in the preference lotteries—are utilized in a general lottery. This creates bias in the sample; the district could not provide any information on how many or which students were accepted into the treatment schools as a result of these preferences, except to say that in most cases, the reserved seats were not all taken by preference students, thus returning them to the general lottery. Applicants may submit one application per school. On their applications, students first select their school of choice, then choose and rank their preferred programs within that school. Each application is reviewed for eligibility. Special education students receive individual reviews; both program area and special education professionals determine eligibility. All qualified applicants are then placed into the general lottery. Students selected in the lottery are mailed a notification with a Letter of Intent, which must be signed by the student’s parent or guardian and returned to the district lottery office within 10 working days of the mailing. Failure to return the letter by the due date results in the student losing the seat. Students who apply and are selected to

12
more than one school are required to choose only one school. This choice is made by signing and returning the Letter of Intent indicating the student's choice. Once this selection is made, the student’s applications for other schools are no longer considered. After all Letters of Intent have been received, if there are still available seats, an alternate lottery is held. Any applicant who was not selected in the initial lottery or did not accept a seat for another program is randomly ordered in an alternate pool. As seats become available, students are contacted in the randomly determined order in which they appear in the pool. Once a student has accepted any seat, his or her name is removed from the alternate pool. Late applications are accepted; these are defined as any application submitted after the deadline for the initial lottery. A late application process is only utilized for schools that have seats remaining available after the qualified alternate pool has been exhausted. As openings become available, the lottery office runs a computerized random lottery of late applicants. Identification of the student sample for West District. One year after the lottery that was held in Spring 2008, the names of all students who had applied to any of the three treatment schools were placed into two datasets: The first consisted of ninth-grade students who had applied to and were enrolled in one of the three treatment schools. The second dataset was comprised of students who had applied to at least one of the three treatment schools but were not attending any of those schools. These files were sent from the district lottery office to the district research office. There, the files were merged with student background demographic and achievement data. There were 1,264 students in the first dataset and 4,285 students in the second dataset. This section provides more detail on those datasets and how the treatment and control groups were identified from them. The experimental sample was formed from the two datasets previously described. In the first dataset, there were four possible lottery outcomes listed for the treatment school in which a student was enrolled:
1. Not Qualified: The student did not meet eligibility requirements, appealed, and was entered into a later lottery.
2. Alternate Pool: The student met eligibility requirements, was entered into the lottery, was not selected, was placed in the alternate pool, and was selected in a subsequent lottery.
3. Selected: The student met eligibility requirements, was entered into the lottery, was selected, and enrolled in the school.
4. Late Lottery: The student turned in the application after the deadline, but because seats remained after the first lottery, the student was able to enter a late lottery and was selected.
There were two ways for students who had been identified as Not Qualified to get into a treatment school. First, they could appeal the decision and be put into a later lottery if their appeal showed they were eligible. Second, students who were not qualified for the program they applied to could be placed in another program at that school for which they did qualify, if there were seats available after all lotteries had been exhausted. Only a small percentage of students attending a treatment school were identified as Not Qualified (3%). Of the Not Qualified

13
students, those who gained entry into a POS by having been placed in an available seat were excluded from our sample because their placement was not due to randomization. This excluded 17 students. This resulted in a sample of 1,247 students randomly selected to and enrolled in one of the three treatment schools. The 17 excluded students join the Not Qualified group from the second dataset and are compared to the sample in Appendix A. The second dataset of students who had applied to one of the treatment schools but were not enrolled there contained 4,285 students identified by their current school location. Of these, 1,132 were duplicate records (students who had applied to more than one school or program) and were removed. There were 300 students for whom there was no record of their having enrolled in the ninth grade in West District for the Fall of 2008. These were students who had either formally or informally withdrawn from the district between the time they applied for the lottery and the subsequent fall. This brought the original sample to 2,853 students. The “not enrolled in POS” dataset provided information on up to four programs applied to and the outcome of each application. For each program applied to, one of three lottery outcomes was possible:
1. Not Qualified: The student did not meet eligibility requirements and thus was not entered into the lottery.
2. Alternate Pool: The student met eligibility requirements, was entered into the lottery, was not selected, and was placed in the alternate pool. From here, due to the limitations of the dataset, it was impossible to tell if the student (a) was ultimately selected and turned down a seat or (b) was not selected in the subsequent lotteries.
3. Selected: The student met eligibility requirements, was entered into the lottery, was selected, but did not enroll in the school.
Students could apply to more than one school. If they applied to more than one of our three treatment schools and were enrolled in one but not the other(s), they appeared in both datasets. There were 445 such “crossover” students. We eliminated from the second dataset all crossover students. We also removed students who had applied to one or more schools and did not qualify for any of them (n = 1,189). This reduced the original dataset down from 2,853 to 1,219 students. Both groups of Not Qualified students were combined and compared against the final sample in order to describe the entire applicant pool and what kinds of students were lost to the study sample as a result of eligibility requirements. See Appendix A for this analysis. As detailed elsewhere, the types of analysis we will perform to assess the impact of POS require any subjects selected for treatment in the random assignment to be assigned to the treatment group, regardless of whether they actually received the treatment. Therefore, the final treatment sample consists of the 1,247 students who were selected to and enrolled in one of the three treatment schools as well as 710 students who were selected to one of our three treatment schools but were not enrolled in any of them. This resulted in a total of 1,957 students in the treatment sample. The control sample was comprised of the 1,219 students from the second dataset minus those 710 students who were in the second dataset (because they had not enrolled in a treatment school) but had actually been selected by the lottery. This resulted in a total of 509 students in the control group: These were students who had applied to one of our three treatment schools,

14
met eligibility requirements, were entered into the lottery, were not selected, and were placed in the alternate pool, where they remained after all slots at the treatment schools had been taken. Background characteristics of the West District student sample. A comparison of student background characteristics was conducted for the sample. Cross tabulations and chi-square analyses were performed on gender, race, participation in the free- or reduced-price lunch program (a proxy for poverty or socioeconomic status [SES]), Limited English Proficiency (LEP) status, and special education status (i.e., the presence of an individualized education program or IEP). School engagement was assessed using eighth-grade average daily attendance and the variable Number of disciplinary occurrences, which was collapsed into four categories: (1) none, (2) one to two occurrences, (3) three to 10 occurrences, and (4) more than 10 occurrences. Achievement was assessed using results of the state’s criterion referenced test (CRT) test taken in eighth grade. Independent samples T tests were performed to compare average daily attendance and the scaled scores in reading and math. Comparisons of West District treatment and control groups. Table 2 shows that there are significantly more males in the treatment group than the control group (45.4% vs. 25.0%). At the same time, there are relatively more females in both groups. There is also a significant difference in racial composition, with the control group having significantly more Latino students (41.1% vs. 35.1%). In both groups, approximately one-third of students participate in the free school lunch program. Each group has a very small LEP population, in each case less than 3%, and few students with an IEP (3.6% treatment vs. 5.3% control). In terms of school engagement as measured by the number of eighth-grade disciplinary occurrences, according to chi-square analysis, there was no significant difference between the treatment and control groups. About a quarter of each group had one or more disciplinary occurrences. Table 2 Baseline Characteristics of Sample, West District
Characteristics
Treatment (N = 1,957) (%)
Control (N = 509) (%)
Total (N = 2,466) (%)
Gender Male 45.4*** 25.0 41.2 Female 54.6 75.0 58.8
Race/Ethnicity Black 11.5 8.8 10.9 White 37.8 34.0 37.0 Latino 35.1* 41.1 36.3 Asian 15.0 14.9 15.0 Native American 0.7 1.2 0.8 Other/Multiracial 0.0 0.0 0.0
Poverty Receives free lunch 29.4 33.6 30.3 Does not receive free lunch 70.6 66.4 69.7
Limited English Proficiency Yes 2.6 2.2 2.5

15
No 97.4 97.8 97.5 Has Individual Education Plan
Yes 3.6 5.3 3.9 No 96.4 94.7 96.1
School Engagement
# Disciplinary Occurrences None 77.3 76.4 77.1 One to two 17.4 18.5 17.6 Three to ten 5.1 4.9 5.1 More than ten 0.2 0.2 0.2
Note. Comparisons are based on cross tabulations and chi-square analyses. * p < .05, *** p < .001. There were no statistically significant differences in eighth-grade average daily attendance (see Table 3) or eighth-grade achievement. The average eighth-grade daily attendance in both groups was 97%.
Table 3 Baseline Attendance and Prior Achievement of Sample, West District
Treatment Control Total Indicator N M(SD) N M(SD) N M(SD) Eighth-Grade Attendance 1,863 97%(0.03) 498 97%(0.03) 2,361 97%(0.03) Eighth-Grade Pretest Math 1,866 368.46(77.05) 500 361.42(77.41) 2,366 366.97(77.17) Eighth-Grade Pretest Reading 1,866 344.80(55.32) 500 345.30(53.20) 2,366 344.91(54.87) Note. Independent samples T tests were performed to compare means.
East District’s baseline student sample. The treatment group in East District consists of the students enrolled at Blue Academy at the start of their ninth-grade year. The comparison group was created by the district research office after the prospect of random assignment was eliminated. East District comparison group identification. Usually, students are selected to attend Blue through a lottery, as at the POS high schools in West District. However, Blue was expanding its enrollment in the year in which our study began. As a result of this expansion, there were seats for all eligible applicants, so no lottery was held. In lieu of random assignment, East District personnel ran a cluster analysis on the other high schools in the district, searching for four comparison schools that were most similar to Blue in terms of student demographic variables, mobility, and prior achievement. Then propensity score matching (PSM) was employed to identify a comparison group. Propensity scores are the estimated probability that a subject is assigned to a treatment based on various pieces of information (Pasta, 2000). This predicted probability is obtained by conducting a logistic regression that predicts membership in the treatment group utilizing a vector of covariate predictors, in effect mitigating the effects of inherent differences among students in the different study conditions (Dehejia & Wahba, 2002; Foster, 2003; Shadish et al., 2002). Students with similar distributions across the covariates will have similar estimated propensity scores. Thus a student in the treatment condition can be matched with a comparison student possessing a similar propensity score, yielding reduced-bias estimates of effects during analysis (Rosenbaum & Rubin, 1985).

16
A matrix of treatment group variables was selected on which to match students from the comparison schools identified in the cluster analysis:
• Performance on standardized eighth-grade reading and mathematics tests • Gender • Race/ethnicity • LEP status • Special education classification • Free lunch status (as a proxy for poverty) • Eighth-grade retention • Number of violent incidents during the school year in which the student was involved • Number of nonviolent incidents during the school year in which the student was involved • Number of unexcused absences • Number of excused absences • Number of out-of-school suspensions • Number of in-school suspensions • Mobility during eighth grade (the number of school changes)
Once predicted probabilities were obtained, treatment students were matched with comparison students possessing exact probabilities when such were available, and similar probabilities with minimal difference when an exact match was not available. This matching procedure was conducted without replacement, so that a student identified as a comparison student for a particular treatment student was removed from the potential comparison pool before the next match for a treatment student was conducted. The propensity match procedure was carried out twice to provide two matched comparison students for every treatment student, to take into account attrition over the next three years of the study. A comprehensive file was created containing student background information from the eighth-grade year (2007-2008) of all treatment and comparison students. Background characteristics of the East District student sample. As with the West District sample, cross tabulations and chi-square analyses were performed on gender, race, free lunch status, LEP status, IEP/Special Education Status, and number of disciplinary incidents. Independent samples T tests were performed to compare eighth-grade average daily attendance and eighth-grade reading and math achievement. Tables 4 and 5 show the results of the PSM and the resulting comparisons performed on the background characteristics of the sample for this district. There are no significant differences between the two East District groups on any of the variables in either table, which confirms that the PSM procedure found appropriate matches for all of the treatment students at Blue. In keeping with the overall district demographics, Black students make up the majority in both groups, about two-thirds of the students in both groups are free lunch-eligible, and the proportion of LEP and IEP students are small. Over 75% of all students had no disciplinary incidents while in eighth-grade, and there were no statistically significant differences among the groups in this regard.

17
Table 4 Baseline Characteristics of Sample, East District
Characteristics
Treatment (N = 376)
(%)
Control (N = 752)
(%)
Total (N = 1228)
(%) Gender
Male 52.1 49.9 50.6 Female 47.9 50.1 49.4
Race/Ethnicity Black 71.0 70.5 70.7 White 10.6 11.2 11.0 Latino 10.4 10.6 10.5 Asian 3.7 3.6 3.6 Native American 0.3 0.1 0.2 Other/Multiracial 4.0 4.0 4.0
Poverty Receives free lunch 68.4 66.4 67.0 Does not receive free lunch 31.6 33.6 33.0
Limited English Proficiency Yes 4.3 4.8 4.6 No 95.7 95.2 95.4
Has Individual Education Plan Yes 2.4 2.3 2.3 No 97.6 97.7 97.7
School Engagement # Disciplinary incidents
None 76.3 75.9 76.1 One to Two 17.0 17.0 17.0 Three to Ten 6.6 6.8 6.7 More than Ten 0.0 0.3 0.2
Note. Comparisons are based on cross tabulations and chi-square analyses. Table 5 shows no significant differences on attendance or prior achievement: Both groups had eighth-grade average attendance rates of 98%. Reading and math achievement across both groups was also similar, as measured by East District’s exams. According to district records, over 80% of students performed at the proficient or advanced levels in math. A smaller percentage was proficient or advanced in reading: a little over 60%. Table 5 Baseline Attendance and Prior Achievement of Sample, East District
Achievement (Scaled Scores)
Treatment M(SD)
(N = 376)
Control M(SD)
(N = 752)
Total M(SD)
(N = 1,128) Eighth-Grade Attendance 98% (0.03) 98% (0.03) 98% (0.03) Eighth-Grade Pretest Math 363.22 (6.96) 362.90 (7.54) 363.00 (7.35) Eighth-Grade Pretest Reading 359.91 (7.10) 359.69 (7.49) 359.76 (7.36) Note. Independent samples T tests were performed to compare means.

18
Comparable variables across districts. In order to have comparable variables across districts, we standardized variables to the extent possible so that their values would match. For example, West District had a variable for Number of disciplinary occurrences, which included both violent and nonviolent incidents, whereas East District had two variables, Number of violent incidents and Number of nonviolent incidents. The values from the two variables from East District were added to create a constructed variable— Number of disciplinary incidents, which allowed us to compare this new variable with the Number of disciplinary occurrences variable from West District. West District provided data on which students had an IEP, indicating whether the student was receiving special education services. East District provided data on which students were receiving special education services. West District provided data on eighth-grade Average Daily Attendance. East District provided the number of excused absences and number of unexcused absences for eighth grade. Excused and unexcused absences were combined to form Total Number of Absences. The total number of absences was then divided by 180 (the number of days in the school year). This resulted in an absence rate, which was then subtracted from 1 to form the average daily attendance rate in East District, which could be compared with the attendance data from West District. Because each district used a different test for eighth-grade achievement, these scores were the one variable that we could not compare between districts. Power. At this stage of the study, the following power analysis is an estimate because there are corrections yet to be made for clustering—that is, for the fact that the students are nested in programs that are nested in schools, and therefore each student is not an independent observation (Cohen, 1988; Murphy & Myors, 2004). This fact makes a multilevel statistical analysis most appropriate; however, given that we have resources for only a small number of sites, a multilevel analysis would likely be extremely underpowered. We plan to revisit this after we have collected all of the final data. We used the estimates below in order to determine that our sample sizes were large enough to sufficiently minimize the probability of making a Type II error (i.e., failing to reject a false null hypothesis). We chose an effect size of d = 0.2. Using a Type I error rate of .05 and entering the number of students in the sample at each site yielded the following: West District: 1,957 treatment students, 509 control students: 0.95 statistical power East District: 376 treatment students, 752 comparison students: 0.95 statistical power New statistical tests of power will be conducted to take the lack of statistical independence into account. This will eliminate the danger of resulting standard errors that are spuriously small (and hence, confidence intervals that are similarly too small). To address the problem of statistical dependence, we will employ the correction offered by Kish (1965). Measures Most of our outcome measures are found in the systems data in our districts and are of practical interest to schools; these measures capture precisely those skills and content that POS are designed to address. Following are the same indicators from Perkins IV that were enumerated in the Research Questions above, along with the measures we are using to estimate outcomes:

19
a. Academic achievement: Academic and cumulative grade point average (GPA), 10th-grade test scores, Advanced Placement (AP) coursework, highest level of mathematics reached, type of diploma
b. Technical skills achievement: District or state technical skill assessments, CTE GPA
c. High school completion: Graduation d. Employability: District or state measure; if none, we may consider measures such
as participation in cooperative work experience, internships, or apprenticeships e. Completion of coursework leading to college credits: all dual credit, dual
enrollment, and online college courses f. Participation in and completion of programs by students considered nontraditional
for their gender (e.g., female students in automotive): School reports prepared for Perkins accountability purposes include these data.
Many of these measures are self-explanatory. Ideally, we would be able to administer comparable technical skills assessments across sites along with senior year academic achievement exams that incorporate the time in which students are exposed to the most advanced concepts in the POS. However, district leaders understandably limit the amount of research-initiated additional assessment that goes on in schools, and we agreed not to add to their already full testing calendars. We plan to collect employability or work readiness assessments if these are available. If, as we have previously described, POS infuse CTE programs with rigorous, standards-based academics and postsecondary connections and increase student engagement, then we must include measures of student engagement. Student attendance and retention/dropout over the four years of high school are our primary measures of engagement. In addition, we include questions on the student surveys that elicit student attitudes about school and their engagement to it. Study Design A critical aspect of our research is its design. In research on various kinds interventions, effectiveness can best be determined through true experiments with random assignment to treatment and control groups (Cook & Payne, 2002; Mosteller & Boruch, 2002), as has been shown by research in the physical sciences and medicine. This type of design provides the highest assurance that any unobserved differences between the two groups are not the result of systematic differences but are randomly distributed. West District meets the requirements of a randomized controlled trial (RCT) study design (Shadish et al., 2002), and, as noted, circumstances led to our including a rigorous quasi-experimental design in East District. In this study, the unit of randomization is the student. The measures of interest that will be used in our analyses include key measures of engagement, achievement, and transition that will estimate the effect of the POS on students in the experimental group. In addition, background characteristics (including prior achievement) were collected on the treatment and control groups in both districts. Any pre-existing differences between the groups will serve as covariates in further analyses as a way of minimizing the possibility that differences in outcomes reflect such differences. These characteristics include gender, race/ethnic origin, prior achievement,

20
participation in the free or reduced-price lunch program, LEP status, and IEP status. These variables have been shown to be vital to understanding the impact of educational interventions on student achievement; further, they are being employed in statistical analyses as appropriate to explore questions related to student-level outcomes either as covariates and/or individual differences variables. Randomized controlled trial (RCT). The first cohort of this study uses an RCT design (Shadish et al., 2002). We estimate the impact of POS through an Intent-to-Treat (ITT) analysis, in which students selected for the POS treatment through the district-run lottery are compared to students who applied to the lottery but were not selected. ITT analyses require that if subjects are selected for treatment by random assignment, they belong in the treatment group regardless of whether or not they receive the treatment. Therefore our analysis includes in the treatment group those students who were selected by the lottery, including those who were selected but through choice or other factors did not actually attend a POS school, or who dropped out during the study. ITT analyses are common in medical research, where they were developed to respond to the bias inherent in assigning subjects randomly to treatment and control groups but only analyzing those who actually received or completed the treatment (Wertz, 1995). Limiting the analysis in this way risks overestimating or underestimating the actual causal effect of the random assignment. ITT preserves sample size, and it provides a more complete analysis of program effectiveness. Its uses and effectiveness have made it part of many RCT studies in education (Ballou, 2007; Bifulco, Cobb, & Bell, 2009; Cullen, Jacob, & Levitt, 2006). In addition to ITT analyses, many studies of educational reforms and interventions also include an analysis that answers a more policy-relevant question: What was the impact of the treatment on those students who actually received the treatment? (Bloom, 2005). This is known as a Treatment-on-the-Treated (TOT) estimate of impacts. We plan to present both ITT and TOT estimates in later reports but chose to present ITT estimates only for the ninth-grade results. Quasi-experiment. The second cohort of this study, located in East District, uses a quasi-experimental design. This quasi-experimental study lacks the “random assignment of units to conditions” but otherwise shares “similar purposes and structural attributes to randomized experiments” (Shadish et al., 2002, p. 104). The treatment group in this cohort consists of the 2008-2009 eligible applicants to a wall-to-wall academy high school. Usually a lottery is held to accommodate students wishing to attend the school, but in this particular year, the school had been expanded and no lottery was necessary; all eligible applicants were able to enroll. The comparison group was identified by the district research office using a propensity score matching (PSM) procedure, described in the Sample section of this report, which generated a well-matched comparison group (Shadish et al., 2002). We present the same estimates of the impact of POS for this cohort as we do for the RCT cohort. Quantitative data analysis. There are two data analysis phases in this study. The central analysis will be performed once final high school data collection has taken place (upon the cohort’s graduation from high school, funding permitting). It includes the analysis of the impact of the enrollment in POS on measures of engagement (e.g., attendance, dropout), achievement (e.g., high school GPA), and transition (e.g., post-high school wages, enrollment in higher education).

21
We continue to explore the possibility of using hierarchical linear modeling (HLM) in these final analyses, although we may not have the necessary number of sites or schools to allow for this type of analysis. If we do not use HLM, the primary statistical technique will be the analysis of covariance (ANCOVA). This allows us to estimate all final comparisons between treatment and control groups based on prior achievement. For this purpose, we will use pre-existing measures of achievement—eighth-grade state test scores. We will perform interim analyses such as those in the present report as this longitudinal study proceeds. In this way we can track the progress of students as they move from one grade to the next. These yearly analyses will be conducted primarily using descriptive statistics, including chi square for on track for graduation and mathematics coursetaking analyses, analysis of variance (ANOVA) for GPA outcomes. We chose not to employ covariates in this first year of coursetaking analysis because students’ ninth-grade coursetaking was largely confined to required courses. Future analyses, including any TOT analyses, will be performed using a variety of statistical techniques, including T tests, logistic regression, and ordinary least square regressions. For these, we may disaggregate results by special populations and other student background characteristics, such as gender, ethnicity, SES, LEP, and special education status. Posthoc analyses. This study is designed to compare outcomes of students selected to participate in a POS and those who applied but were not selected through a lottery. This seemingly simple comparison is made more complex by the realities of school district policies and student post-lottery choices, only some of which are described here. Although an ITT estimate will be presented in the early years of this longitudinal study, including in this report, additional analyses based on the most policy-relevant complexities will also be run in the form of posthoc analyses and the results reported when warranted. One important posthoc analysis will eliminate from the treatment group those students who were selected by the lottery but did not receive the treatment because they did not return the Letter of Intent. They are currently in the treatment group because an ITT analysis includes all those who were intended to receive the treatment through the random assignment process. However, for practical purposes, these students did not receive the treatment; an important question for those in public policy is whether students who received the treatment fared better compared to those who applied but who were not selected and did not receive the treatment. This requires a TOT analysis. Another posthoc subanalysis would eliminate from the control group those students who did not attend a treatment school, but who did in fact receive the treatment at another of the district’s POS or magnet schools. For this study’s fundamental ITT analysis, these students were not selected to attend the three treatment schools and are therefore in the control group. But again, in practical terms, these students attended other schools in the district that provided the POS experience, and so an analysis will be run without these students—who have already been identified—in the control group.

22
Qualitative data analysis. To help us understand the process through which POS effect change, this study employs a qualitative component that measures mediating and moderating variables. It is insufficient to report student outcomes without a sense of the context and practices that produced them. As such, we are conducting interviews and classroom observations in both the treatment and the control/comparison conditions. Although we discuss the qualitative analyses separately from the quantitative, the qualitative results inform the quantitative outcomes and serve as another source of convergent evidence about the effectiveness of POS. We are conducting interviews with teachers, students, and administrators in both the treatment and control/comparison schools. These interviews focus on what participants perceive to be the most important differences between POS and the control/comparison condition, participants’ sense of how those differences influence outcomes, and how participants perceive the usefulness of their school’s programs as preparation for postsecondary education and work. The interviews also assist us in accounting for sources of variation in outcomes across these settings. We conduct classroom observations so that we may (1) discern program differences ourselves and (2) verify the presence and fidelity of treatment (O’Donnell, 2008). Interviews are audio-recorded and transcribed. The transcripts are classified by type (e.g., CTE teachers, students). Following the case study methods of Yin (2009) and the grounded theory approach of Strauss and Corbin (1990), the content of the transcripts are being coded and entered into a qualitative data analysis software package called HyperResearch© version 2.8. The classroom observation data are also being coded and entered into HyperResearch. Coding involves marking the instances of concepts or topics relevant to the study as they appear in the interview or observation data (e.g., project-based learning). Such open or general coding identifies concepts that can then be developed through axial coding, or grouping the data into topical categories that are more specific and descriptive (e.g., evidence of academic standards). These data can often be reduced to a series of matrices (Miles & Huberman, 1984) to aid in within- and cross-site analyses that identify the mediating and moderating variables that can help explain the outcomes. Codes can be queried within HyperResearch and yield a report rich with information from various stakeholders, including students, as well as data from the classes we observed. Such an analysis process maximizes triangulation of as many data sources as possible. Threats to validity. For both study cohorts, we have taken measures to reduce the potential influence of selection bias on membership in the treatment and control or comparison groups. In West District, this was mostly accomplished by the random assignment process of the lottery, as described in detail in the Sample section. It is important to recognize, however, that school districts institute lotteries for many reasons that usually do not include conducting randomized controlled trials. First, districts use lotteries to provide school choice opportunities for students where there are more students wanting to attend than there are seats available. Second, lotteries provide districts with a tool for integrating schools: Students from various parts of a district attend a magnet school that provides a popular program and attracts students from all parts of the district. If the integration goal is to be met, certain preferences must be introduced, and it is at this point that bias (as perceived by a research methodologist) is introduced into a district lottery sample. For instance, districts set aside a certain percentage of seats in a program for students who live in that area, students coming from a themed or magnet middle school, or siblings of students already attending that school.

23
In addition, districts often have lottery eligibility requirements that disqualify students with low prior achievement or poor histories of school engagement (e.g., absenteeism, disciplinary occurrences). All of these actions dilute school lotteries away from a pure random assignment and potentially introduce bias in precisely the areas that a lottery should prevent—in student characteristics that are often associated with achievement outcomes such as prior achievement scores and race/ethnicity. Geographical preferences bias the population one way or another, depending on the demographic distribution of racial and ethnic groups in the district. Sibling and feeder school preferences open up the possibility of including more students in these programs with prior experience in the subject, and this can affect student outcomes as compared to a wholly random sample of interested students being selected for the program. In terms of real district choices and proper governance of school choice options, these lottery outcomes are all perfectly acceptable and desirable: Students should be able to attend their neighborhood high school, students who have focused on a specific topic such as information technology in middle school should be able to continue their studies in high school, and district opportunities to desegregate schools should be seized wherever possible. But in methodological terms, we cannot say that students were completely randomly assigned to the programs through many district lotteries, including that of West District. Fortunately there exist statistical methods that we employ to control for some of the ways in which district lotteries are not like pure lotteries. Over the years of this longitudinal study, we will continue to monitor the sample for attrition and contamination in order to best explain the results we find. In East District, students self-selected to attend the treatment school, and all who were eligible were allowed to enroll, resulting in the possibility of selection bias being introduced into the treatment group. District personnel attempted to reduce selection bias in the comparison group through the sample identification procedure known as PSM, also described in the Sample section. All data will be collected over roughly the same time period, thus minimizing multiple-group threats to internal validity such as history and maturation. Multiple sites consisting of regular schools with typical teachers are being used to reduce the likelihood of systematic bias related to site-specific factors, as recommended by the quantity of evidence guidelines (U.S. Department of Education, Institute of Education Sciences, 2003). We are cognizant that the addition of high academic standards to POS could conceivably drive out lower achieving students to the extent that such students do not qualify for or even apply to programs like those found in our treatment schools, affecting the generalizability of our findings. Like many RCT studies using a “naturally occurring” randomization technique (i.e., district-run lotteries), this study only includes students who are motivated enough to apply for these programs. In our case, students were in eighth grade when they had the opportunity to apply for the lottery; thus we compared the students who applied to POS to the overall middle school population of that year in Appendix A. Similarly, we recognize that our study is limited in its generalizability due to our choice of very large urban districts for our sample. Our study design required as close an approximation of

24
random assignment as possible, which meant searching for district-designed lotteries in districts big enough to generate a large enough sample size for statistical power. During our search process, we attempted to locate smaller districts and programs with lottery processes, but none of these were able to meet the study’s design needs. The results of this study will be generalizable to many contexts serving many students, but they may not reflect the realities of smaller cities or more rural contexts attempting to implement POS. It should be noted that in both cohorts, student attrition over the course of the study is not central for our analysis, although it will eventually and only be used for a further level of analysis if those data become available. We continue to collect and analyze data on all sample members, even those who fail to complete the treatment, so as to maintain equivalence. Also, to the extent possible, we will follow up with and interview students who leave the groups in order to support the ITT analysis (Fisher et al., 1990). Student survey methodology. Working in conjunction with the NRCCTE’s two other field-based POS studies, the Rigorous Tests team developed a student survey that was administered to ninth-grade students in West and East Districts. An early version of the survey was piloted and refined by the Personal Pathways (South Carolina) study team at their study sites. After reviewing the Personal Pathways survey, the three field-based POS research teams agreed upon common questions and themes that would be shared across the individual studies and surveys, even though each was targeted to different study contexts and student cohorts (e.g., the Mature POS survey was administered to community college students). The Rigorous Tests survey was refined to suit our ninth-grade student cohort. The Rigorous Tests ninth-grade survey contained seven sections on course planning, POS, career planning, classes and schoolwork, plans for the future, beliefs and opinions about school, and background information (e.g., gender, age, race/ethnicity, parents’ level of education). The survey was formatted electronically in SurveyMonkey and configured so as to direct treatment and control/comparison students into appropriate questions based on their responses to key questions (e.g., a control student answering “No” to “Do you have or are you in a program of study, career major, academy, or program?” would skip questions on lottery participation and POS and instead be routed to the section about career planning).
Results: West District
Site Descriptions: Treatment Schools Relevant policies. West District is an urban district that experienced a large population increase prior to the recent economic downturn. To respond to this growth, new high schools were built and integrated into the district’s school choice program. West District is committed to preparing students for a knowledge-based economy: Recent changes to the high school graduation policy require all high school students from the Class of 2010 forward to complete a college- and career-ready course of studies. As in many states, these new graduation requirements increase the amount of required math and science. They also lower the number of required elective credits to one in either arts and humanities or CTE. This change does not eliminate the possibility of completing CTE sequences, however: 5.5 elective credits remain in the new requirements, a drop

25
from 7.5 credits. The district simply requires that one of these electives be in arts and humanities or CTE. Students may still receive a standard diploma by meeting the former graduation requirements, but schools are expected to schedule all students into this new course of studies. Like many school districts, West District has instituted an interim assessment system for academic subjects, designed to provide accurate, reliable, and timely data to help teachers target and differentiate their instruction. Students take interim assessments mid-semester and results are quickly made available to teachers and administrators in enough detail so that teachers can target topics that need to be emphasized or specific students who need extra assistance. West District guidance counselors are expected to provide all types of counseling services, including academic, social, personal, and career counseling. Students are required to prepare an individual graduation plan (IGP), which includes one year beyond high school. Most high schools in West District offer a number of CTE courses that allow students to earn dual credit, provided they are juniors or seniors, complete the course with an A or a B, and complete an application form. Other postsecondary credit-earning options include Advanced Placement (AP), dual enrollment (for courses not offered at the high school), virtual high school, and summer school. All students in the district are eligible to receive a CTE competency certificate in their program area upon graduation if they maintain a 2.0 GPA. The certificate displays students’ levels of skill competencies, hours of instruction, attendance records, and a brief explanation of the skill rating standards. A certificate with Honors is given to students who maintain a 3.5 GPA in their CTE program area. Recipients of this certificate are recognized at the graduation ceremony. History of POS. The impetus behind West District’s school choice program was to improve student achievement, promote diversity, and create an awareness of career opportunities relative to POS and magnet themes. A district administrator attributed the development of these schools of choice to visionary leaders who saw the rapid growth in the district and decided to provide high-quality educational options in all parts of the district. Another administrator described the goal as “elite schools for all children” as opposed to “schools for elite children.” Perkins IV was not a driving force behind the creation of POS high schools, according to the principal at Navy High School,2
one of our treatment schools. POS were developed with the help of Joint Technical Skills Committees (JTSCs) made up of the district, the community college, the state university, and relevant businesses. West District plans to “roll out” POS beyond the POS high schools to the comprehensive high schools. The CTE director has visited the high schools and worked with principals, counselors, and CTE departments to recommend changes so that all high schools will develop POS in the next few years.
West District’s POS schools offer the latest in CTE technology and curriculum, including project-based learning, opportunities to earn academic and technical postsecondary credits in the form of AP classes and tech prep, and working partnerships with industry. Programs provide students with the opportunity to learn all aspects of an industry (e.g., the construction 2 All school names are pseudonyms.

26
management POS includes instruction in related software, labor issues, and the scheduling and estimating tasks that contractors normally perform). These CTE programs meet the requirements of POS and have proven to be popular enough that the district holds a lottery to select and assign student applicants to their high schools of choice. Three of these high schools—Navy, Sky, and Azure—are participating in this study. One school has a long history of delivering CTE, another has built a reputation of “academic distinction and technological excellence,” and the third was just opened in the last few years. Each school delivers POS slightly differently: one through a project-based curriculum, another through an academic-technological focus, and the third through more traditional CTE infused with high-level academics. These differences reflect practices employed in many high schools implementing POS across the country, so the findings from these replications can be generalized beyond what could be done with any one high school. In the following sections, we will describe each of our three treatment schools—their histories, basic student demographics, unique characteristics of their CTE programs, and the CTE classes we observed during two site visits made in 2009 and 2010. We follow by summarizing and individually describing the ways in which the mandated and supporting components of POS have been implemented in the three schools. Treatment School: Navy High School Navy High School is a new, environmentally green, specially designed facility: It was the first purpose-built POS high school in the district. Navy serves 1,314 students drawn from its regional service area; although racially and socioeconomically diverse, the school has relatively more female, White, and Asian students and fewer Latino, IEP, LEP, and free-lunch eligible students than the district as a whole (see Table 6). Navy’s POS are housed in modular units that have been customized through input from the district’s JTSCs for each program area. POS modules consist of hallways dedicated to a specific program, with academic teachers housed in the area instead of a separate academic wing. Table 6 2008-2009 Demographic Characteristics of West District POS Schools Navy Sky Azure District
Characteristics (N = 1,314)
(%) (N = 1,857)
(%) (N = 995)
(%)
(%) Demographic Characteristics Gender
Male 42.1 46.4 59.5 51.5 Female 57.9 53.6 40.5 48.5
Race/Ethnicity Black 14.6 10.2 8.6 14.0 White 44.9 31.3 44.9 35.3 Latino 22.2 48.7 22.2 40.5 Asian 11.8 9.0 23.7 9.5
Receives free lunch (FRL) 20.9 36.6 20.7 42.6

27
Limited English Proficient (LEP) 2.6 4.5 1.6 20.2 Has Individual Education Plan (IEP) 4.0 10.2 1.2 10.2 Graduation Rate for Class of 2009 N/A 89.8 97.8 65.1 Note. N/A = not available; no graduating class yet. The total district population was not provided in order to mask the district’s identity. Navy was designed according to “best practice” tenets of contemporary education, including learning communities, integrated curricula, project-based learning (PBL), and the expectation that students will earn postsecondary credits while in high school and subsequently attend college. Although the foundation for each program is career-themed, we heard from several administrators that graduates may not choose to select their POS for their later careers. At Navy, this is not considered a failure: Students will have learned valuable workplace skills as well as gained strong academic skills that will help them earn money while they study something else. CTE at Navy. Navy offers POS in the areas of alternative fuels/transportation, biotechnology, construction management, culinary, engineering, hospitality, media/journalism, medical/health, teacher education, and early childhood. Senior internships are available for most POS at Navy, but students are not required to complete one. Career and Technical Student Organizations (CTSOs) are very popular, with dozens of students participating in (and winning) SkillsUSA competitions. Project-based learning (PBL). PBL is a guiding principle at Navy and appears to be a powerful and motivating way of combining academic and technical content knowledge and hands-on applications of that knowledge. The school’s PBL coordinator describes PBL as being done differently here—academic curricula are integrated into the program areas, not vice versa. Further, the school is structured around a number of small learning communities or “houses” incorporating multiple academic and CTE POS areas in which academic and program teachers work together. Our Spring 2010 site visit coincided with Navy’s annual multi-day open house related to PBL. Themes were space exploration, ecological awareness and conservation, and green technologies. Among other projects, students built and demonstrated a wind tunnel, designed space rovers, cultivated a hydroponics laboratory, set up a mobile astronomy lab, investigated the cross-species breeding habits of mantids, and explored the impacts of space travel on human health and fitness. One student conducted field research on the effects of antibacterial agents on common bacteria. Another collected bacteria at a number of local caves and sought help by cultivating a mentoring relationship with a faculty member in the biology department at the local four-year university. This student secured the promise of a spot in that faculty member’s research lab, and had an internship lined up with a prestigious medical clinic. The school is seeking PBL accreditation status—now in their second year of implementation, they are going through a three-year process that will culminate in a program review and site visit. Technology. Technology is omnipresent and integrated at Navy, reflecting the principal’s goal that technology enhance learning, not be used as an end in itself. Technologies that are currently used or soon to be implemented in the Culinary program include a Perkins-funded Apple server for iTunes University podcasting; 50” flat-panel monitors for displaying, via a new wireless system, live demonstrations and reviews of course material around the kitchen and across a hall to a program classroom; flipcams and mounted digital cameras for beaming demonstrations and lectures to schools and sites around the district and conducting real-time trainings and
28
professional development for other chef instructors in the area; a new server that will allow them to host the documents, software, and interfaces needed to process and track culinary internships for hundreds of district seniors; and Promethean whiteboards. Navy’s Media program features a professional-quality television production studio and editing suite that were built from the ground up, to the program chair’s specifications, using top-of-the-line film and digital media equipment. In Navy’s Transportation program, students use computers to program robots and operate hydraulic and pneumatic systems in the program’s lab facility. CTE classes observed at Navy. Because our Spring 2010 visit occurred during Navy’s annual PBL open house, we had no opportunities to observe CTE classes. Classes observed during our 2009 visit included Introduction to Culinary Arts and Introduction to Media Communications. The Culinary class covered food safety and sanitation, including the concept of “the danger zone,” principles of proper food handling and storage, food-borne illnesses, and differences in practice between professional and home kitchens. The chef-instructor enlivened her presentation with a bellringer set to music followed by an audio and PowerPoint-enhanced lecture. Her students relished the many chances they were given to ask and answer questions about food safety standards and the practices they or their families used at home. Students in the Introduction to Media Communications class were storyboarding in preparation for creating commercials for products of their own devising. Storyboards had been put together in a previous class and were being critiqued and improved in this one, using feedback provided almost solely by the teacher. Near the end of the period, students took props, costumes, and video cameras and conducted video shoots in locations outside the classroom. Time was not always well spent in this class, as students engaged in a fair amount of off-topic chatter. In a later interview, this teacher stated that she preferred to rely upon her own experience in the media/news industry rather than follow the district curriculum too closely. At our 2010 site visit, we found that this teacher had abruptly quit shortly before the start of the school year. Treatment School: Sky High School Sky High School has broadened its traditional mission as the district’s former career center to focus on providing upgraded, intensive academics while maintaining the school’s culture of high expectations and 40-year-old reputation for high-quality CTE instruction. As the first school to become a revitalized, new-model POS high school, Sky is showing its age—it needs more room, better facilities, a new roof, and a plumbing upgrade for its bathrooms. As of the fall of 2010, we learned that a rebuilding and expansion plan for Sky had been approved by the school board. In all other regards, Sky is a high performer and very competitive—a fact in which the principal takes great pride. Sky’s success is the reason the district sought to design and build several new high schools around career and technical POS. Although Sky must now compete for students with these other schools, this has had the positive effect of increasing local enrollments. Sky’s student body of 1,857, drawn from its regional catchment area, is more female and Latino compared to the rest of the district; although it has about the same number of IEP students, it has fewer LEP and free-lunch eligible students than the rest of the district. More demographic data are available in Table 6.

29
In addition to issues related to its aging physical plant, Sky has been hit by the budget crisis. The budget has affected the principal’s ability to hire new faculty in English and the Humanities. Further, a major change in staffing has affected the Culinary program. The previous head chef, an alternatively certified teacher from business and industry, lost his job after failing the Praxis; the new head chef-instructor has eliminated both a popular program fundraiser and the program’s cohort structure. Such changes aside, Sky markets its successes with printed materials touting its low dropout rate, high attendance and graduation rates, many AP classes, strong pass rates on the state high-stakes exam, healthy college-going numbers, safety, and tech prep and certification and licensure options. CTE at Sky. At Sky, CTE program sequences mostly begin in the 10th grade (sometimes in the 11th), with the ninth grade dedicated largely to academic coursework and other requirements. Sky offers a range of traditional and technology-focused POS in such areas as 3D animation, architectural engineering, automotive, business, computer networking, culinary, film and video, graphic arts, health, and welding. Sky’s thriving Career Center is now being replicated at other district high schools. Center staff proctor technical skills assessments and offer resume, internship, portfolio, and career-planning advice to students. Teachers may schedule the Center’s computers for career exploration, college planning, and four-year scheduling; business and industry representatives conduct on-site presentations and mock interviews there; and parent open houses and SkillsUSA competitions are also hosted. It maintains a job bank, subscriptions to interest inventories, and information about postsecondary education and military service. The Center’s director works with mentees at other district career centers, maintains connections with the postsecondary partners involved in Sky’s CTE curricula, and collaborates with business and industry partners. These partners often recruit students from Sky’s tried-and-true programs. Self-evaluation is a component of the Center’s work, and student, teacher, and community use is tracked and reported. We observed three sections of Sky’s required ninth-grade soft skills class during our 2009 visit. This class helps orient freshman students and introduces them to the soft skills and career planning instruction provided at the school. In it, students create their four-year course plans and explore state- and district-hosted websites offering career and postsecondary education planning tools and inventories. Standards of professional dress and business etiquette are also covered. CTE classes observed at Sky. During our 2010 visit, our students were in the 10th grade, and as such were taking introductory courses in their pathways. We observed several of these courses, which varied widely in rigor and quality. They included Introduction to the Culinary Arts, Introduction to Construction Technology, Introduction to Transportation Systems I, and Introduction to Desktop Publishing. Introduction to Culinary featured district-standard food safety and handling content delivered as a basic lecture. Unlike a similar but far more engaging and informative class observed at Navy, Sky’s chef-instructor failed to engage the class in discussing the concepts presented and showed poor classroom and time management skills. The well-organized Introduction to Construction Technology class was housed in Sky’s enormous construction lab—the largest in the district. This class covered sheetrock—types and sizes, fabrication, the history and design principles of,

30
and cutting and installation techniques—and included a balance of lecture and hands-on demonstration and practice. It also included an example of curriculum integration: The instructor helped students calculate the number and proper placement of cupped nails needed to secure different sizes and thicknesses of sheetrock. In the Introduction to Transportation Systems class, the teacher performed an oxy-acetylene cutting demonstration and went over various aspects of safety around this activity, including fire danger, proper tank storage, and recognizing the correct look of the flame that students would get a chance to spark on the following day. The Introduction to Desktop Publishing class edited a flyer from a jazz festival: Students’ computers were linked to the teacher’s so she could monitor their work. The focus of the class was on good design principles and accuracy of information. Treatment School: Azure Academy Azure Academy is a magnet high school of eight wall-to-wall academies: business and finance, computer graphic design, computer-assisted drafting and design (CADD), computer science, pre-engineering, information technology, legal studies, and systems technology support. In previous years, these programs served as a high-tech complement to Sky’s more traditional CTE before the district overhaul of CTE. Azure’s emphasis has always been more college than workforce preparatory. It got its start as a dedicated CTE high school 15 years ago: In its heyday, it was the district’s top-of-the-line technology school. As a magnet, Azure gets seven or eight more teachers (following the district’s staffing ratio) and classrooms built for smaller classes. Whereas some of the comprehensives are losing teachers and programs, Azure and other POS high schools are holding their own, and Azure maintains a reputation for high performance. It has been recognized as a Blue Ribbon School and numbers of its faculty have received national awards for teaching excellence. As a magnet, Azure draws its 995 students from all over the district, unlike the new POS high schools, which serve specific catchment areas. The student body is more male, White, and Asian than the district as a whole; it has fewer Latino, IEP, LEP, and free-lunch eligible students. See Table 6 for additional demographics. CTE at Azure. Due to its status as an early adopter and trailblazer for the other POS high schools in the district, Azure has now been placed in the position of having to “retrofit” its programs in order to measure up to the latest standards and supporting components of POS currently being laid out by Perkins IV, the state, and the district. The principal and her assistant principal recently attended a statewide training on POS (cf. Legislation and policies, below), and the principal acknowledged that they have some work to do in better aligning and sequencing their courses into four-course pathways, investigating additional industry certifications, and establishing stronger ties to community and business and industry partners. Azure remains technologically up-to-date and academically and technically rigorous, but time, staffing, and budget issues have chipped away at its certifications, dual enrollment and dual credit options, and connections to postsecondary and industry. Azure’s challenge is to take the programs that made it a forerunner of the district’s POS and reinvigorate them as fully modern POS without harming its reputation as a high-achieving school. The biggest development at Azure since our first site visit in 2009 is the construction of a new POS high school next door. This POS school is perceived by some at Azure as cannibalizing its clientele—particularly its Legal Studies program, which now is forced to compete with the new

31
school’s vibrant law enforcement pathways, high-tech classrooms, and partnerships with the local police, fire department, and other community law enforcement partners. CTE classes observed at Azure. Program sequences at Azure begin in the ninth grade with introductory coursework and a mandatory computer class. In 2009, we observed that computer class plus Computer Science I, Computer Graphics I, and CADD. The required computer class was working on Microsoft Office software—on this day, a rather arcane element of Excel. This course is structured at a level that makes it eligible for college dual credit, although the teacher tries to keep the class low pressure and lively. The Computer Science I teacher ran his classroom like a software development company. To complete a whole-class, multi-week video game project, students were occupying a variety of roles like programmer/coder, debugger, graphic designer, audio technician, and librarian/archivist. Students also served as each other’s teachers, producing screen capture videos of their programming techniques that were featured on the teacher’s website and played in class. Computer Graphics I, a design course for ninth graders, encompassed art/design and the translation of those designs to electronic media. In this class, students worked on cereal box designs that they had generated and critiqued in a previous class. Students used samples from a stack in the front of the room, and most appeared to be copying their designs. The teacher indicated that the program and class would be changing soon to a game-design focus, meaning that more advanced technologies (e.g., 3-D animation, vectoring) will receive a greater emphasis and “old school” graphics would dwindle in importance. The CADD class involved students working independently to create floor plans. After receiving peer feedback, they updated their designs using the CADD software. The teacher then switched the class’ activity to sketching. During our two-day site visit in 2010, we observed a broad range of 10th-grade classes, including Introduction to Robotics, IT Essentials, Civil and Criminal Law, and Accounting. Introduction to Robotics consisted entirely of small-group work on long-term projects using VEX classroom kits. Students were constructing a mobile robot that could pick up and stack blocks on a parallel surface; they could build their robots however they liked, given the available materials in the kit. Although the course is standards-based, this instructor assesses projects authentically by judging whether the robots do what they are supposed to. IT Essentials involved setting up peer-to-peer networks using hubs, repeaters, and other equipment and tools. Students used a Smartboard and Cisco networking software to set up and test virtual networks using different tools and components. The teacher’s lecture covered such concepts as MAC addresses, IP addresses and traces, packets, home and office networks, and building design and networking principles. The Civil and Criminal Law class observed was taught by a practicing lawyer. The syllabus included some challenging work including research and opinion papers, and their homework assignment was to defend a point of view about gay marriage using the equal protection clause of the Fourteenth Amendment of the U.S. Constitution. This period consisted of discussions of newspaper clippings on current events: Topics included family law, wrongful death, negligence, and scaling back on Miranda rights. During our observation, the Accounting class was being tested on how to record adjusting and closing general journal entries for a corporation and posting those entries to the general ledger. The test provided a mock income summary and
32
merchant inventories, and students were to fill out the journal and ledger accounts, culminating in a post-closing trial balance. POS Results: Treatment Schools In the sections that follow, we synthesize our observations of the four mandated components of POS, as contained in the Perkins IV legislation. These syntheses are followed by specific examples from the schools. Mandated Components of POS 1. Incorporate and align secondary and postsecondary education elements. This urban area includes within its boundaries one community college with several local campuses, two state university campuses, and various proprietary and trade schools available to high school graduates. Across West District, the process of aligning secondary and postsecondary curricular elements has been accomplished through the institutionalization of relationships between and across secondary and postsecondary institutions and business and industry. These relationships may be formal and district-wide, as in the case of the JTSCs that govern various programmatic areas, or more localized, as in the case of programs that work directly with postsecondary partners to align their curricula and standards. Across our treatment schools, we noted that district and school-level administrative support was key to maintaining and fostering these relationships. Secondary and postsecondary alignment is also fostered by the tech prep system, described in more detail in a separate section. For some program areas, secondary and postsecondary connections have been strengthened by the input of the JTSCs. JTSCs engage in curriculum alignment and articulation between secondary and postsecondary, program planning, standard setting, and resource development, among other activities. Both of Navy’s Culinary program’s chef-instructors are on the district’s JTSC for Culinary, through which they maintain strong connections to and relationships with local postsecondary institutions; both have also taught at the postsecondary level, and their familiarity with these institutions provides reassurance that their program is turning out students who are working at an equal or higher level than that produced at the community college. One Culinary teacher described the connections between secondary and postsecondary JTSC members in terms of “friendships,” a continual process of meetings and communication throughout the year, and shared interests. The Culinary JTCS is composed of representatives from the school district, regional CTE centers, and the local community college, along with members of the local restaurant and hotel and lodging associations and representatives from business and industry. The group works to protect community interests in education; promote communication between the district, postsecondary, and the community; evaluate and recommend curricula, facilities, and equipment needs; develop and review program standards; assist instructors with new technology; identify guest speakers for programs; and promote and support student organizations. During our 2010 site visit, we observed a meeting of a JTSC for construction technology, which included construction teachers from two of our treatment schools—Sky and Navy—in addition to postsecondary personnel, members of business and industry, and district CTE personnel. This meeting focused on curriculum revision and new safety standards.

33
According to Navy’s PBL coordinator, textbooks and curricular materials are chosen through cooperative work with local postsecondary institutions in order to create aligned curricula. Committees review materials and align programs with relevant national and state standards. Many Navy classes also have tech prep articulation. The PBL coordinator participated in the state POS training; at the school level, their work on POS has involved setting up curricular strands and making sure that coursework connects to standards and postsecondary programs. Azure is working to more tightly align its POS coursework with postsecondary programs. The principal and her assistant principal recently attended the statewide training on POS, and district funds have been found to help support them in reinforcing and aligning curricula. The new guidance counselor was not aware of the alignment of Azure’s curricula with postsecondary education but believed that all students were being taught to college-ready standards. 2. Include academic and CTE content in a coordinated, non-duplicative progression of courses. Across all of our treatment schools, much technical content is aligned with academic content. That is to say, the content of many or most technical and academic courses are aligned in rational, progressive sequences that allow students to take courses at appropriate times and with the prior knowledge and skills needed to succeed in those classes (Curriculum integration refers to a different kind of deliberate intermingling of technical with academic content in a single curriculum. We address curriculum integration under the general heading of “teaching and learning strategies” below.) With regard to the alignment of courses in a non-duplicative sequence, West District appears to allow diversity and flexibility in how POS high schools choose to structure their POS sequences (see also Course Sequences, below). In general, all three treatment schools offer programs that progress from broad-based introductory courses through more advanced courses to more intensive experiences in 12th grade. As noted in their individual school descriptions, however, Navy, Sky, and Azure differ in when students actually begin their POS—this may occur as early as ninth grade and as late as 10th or even 11th grade (as is the case for some Sky students who switch programs). Our treatment schools also vary in how they choose to present these courses and programs to students, as well as in how many and which kinds of intensive, capstone-style experiences they offer. All programs, by state and district mandate, are standards-driven. Navy students meet with a counselor at least once a year to discuss their four-year individual graduation plans, progress, and goals. The school’s four-year POS course of study plans have been newly developed. The school’s course registration guide lays these out for each of Navy’s 11 program areas: Courses are laid out in columns by grade, proceeding from general courses at the ninth-grade level through more advanced courses to advanced coursework plus a capstone experience during senior year. Academic coursework is laid out flowchart-style, with possible alternatives based on students’ programs, previous performance, or special needs. Given that their POS largely begin in the 10th grade instead of the ninth, Sky’s POS vary somewhat from the district’s suggested four-year templates but otherwise follow the recommended progression from broad introductions, through more intensive middle-range courses, to culminating or capstone courses.

34
Azure’s programs generally flow in a four-course pathway from introductory coursework in the ninth grade through increasingly more advanced coursework in the 10th and 11th grades, to the most advanced courses in 12th grade. Program blocks are featured in 11th and 12th grade. No mention is made in the school’s course registration guide of senior-year internship or capstone experiences. 3. Offer the opportunity, where appropriate, for secondary students to acquire postsecondary credits. As noted, West District students can take certain CTE classes in high school and receive college credit for the course if they pass with an A or a B. These students are no longer required to take those courses in their postsecondary program. Even if they take a class as a ninth-grader, during their junior or senior year they become eligible to apply for the credit. Such classes allow students to save hundreds in tuition and fees they might otherwise have paid at local postsecondary institutions. The program allows students to receive both high school and college credits, but students must apply while still attending high school. In addition, many of these credits are transferable to the state university system. The numbers of tech prep-eligible courses vary across our treatment schools as well as across programs. As noted, other postsecondary credit-earning options include AP, dual enrollment (for courses not offered at the high school), virtual high school, and summer school. According to the course registration guide, Navy offers 15 CTE classes that can earn dual credit. Although guidance counselors are aware of the availability of these credits, program teachers largely counsel students about dual credit opportunities. Navy’s Culinary students can earn as many as 12 postsecondary credits. In the medical program, only anatomy/physiology is a dual credit course, but students may earn credits through 13 available AP classes. Course articulation with postsecondary is less well-established in the Media program, partly due to the community college’s unwillingness to accept Navy’s courses in videography into the dual credit program. Sky offers 22 courses that can earn postsecondary credit accepted by the local community college and a further five credits in graphics arts-related pathways acknowledged by a local postsecondary art institute. Despite these high numbers, according to the principal, opportunities to earn postsecondary credit at Sky are not taken up as much as they could be. Although at least three-quarters of all Sky students go on to some form of postsecondary education, not all are taking full advantage of these opportunities. One new guidance counselor stated that she knew less about these credit options than she would like; she stated that CTE instructors were the best sources of information about such options. Opportunities to earn postsecondary credits seem weaker at Azure than at the other treatment schools. About 15 classes offer dual credit opportunities in Azure’s programs in Business and Finance, Computer Science, Engineering, IT, Networking, and Architectural Design. No community college classes are taught on site, but district policy allows students to take approved classes at the local college if they are not offered by the school. The guidance counselor cited AP classes as opportunities for students to earn postsecondary credits. Students interviewed were only vaguely aware of dual credit, and none had thought much yet about earning college credits in high school. The Robotics teacher noted that a distance education program in engineering with an area four-year university was no longer operational. The ninth-grade required computer class is eligible for dual credit: On the day we visited, the teacher gave a presentation about how
35
students could earn that credit, showing them the community college webpage and citing a college brochure touting the thousands of dollars district students had saved in the previous year by taking dual credit courses in high school. 4. Lead to an industry-recognized credential or certificate at the postsecondary level, or an associate or baccalaureate degree. The signaling power of industry certifications and credentials is evident to all of our treatment schools. Some nationally recognized programs—like Automotive Service Excellence (ASE), Project Lead The Way (PLTW), and the National Academy Foundation (NAF)—are frequently mentioned by our study participants as offering the highest assurance of academic and technical rigor and standards-based career preparation. The time, personnel, and monetary commitments required to establish and maintain such programs were often cited, however. So, too, were the costs to students for acquiring certificates or credentials. Overall, credentials and certificates were perceived as value-added to the POS experience. Navy is considering American Culinary Foundation (ACF) certification for its culinary program; in the meantime, its students may acquire ServSafe certifications, an industry-recognized portable food and alcohol safety certification that covers recipients for three years. Juniors or seniors may earn this certificate and carry it into jobs and/or postsecondary education. Specifically related to culinary, West District also uses ProStart, a secondary-level career-development program in culinary arts and foodservice management, which is driven by industry needs and standards and incorporates classroom curriculum, work experiences, and opportunities for students to participate in local and national competitions. School restaurants that are open to the public must be inspected by the local health department. Further, students must demonstrate proper sanitation, food safety, and professional dress standards to earn a health card, which is also portable to work or postsecondary education. A Navy guidance counselor reported that while a few students want to go straight into work—some of whom are looking for apprenticeships—most Navy students are college-bound. Most Navy programs lead to two- or four-year degree programs as well as community college certificate programs. Some of the latter include preparation for certificates such as those from the National Restaurant Association, the state preschool/daycare director license, and Certified Medical Assistant. Some certificates can also be earned in high school, and Navy is always looking for opportunities to provide more, but the principal acknowledged that the cost of some certification exams is prohibitive. Available certifications include the NCCER (National Center for Construction Education and Research) and the OSHA safety card in construction, CPR in early childhood, and Final Cut Pro in broadcast journalism and media production. In other programs, the only certification available is the district’s occupational competency certificate. Sky’s principal noted that their certifications and credentials are a major selling point—students are prepared for the ASE certification in Automotive Technology; A+ and CCNA certifications in CISCO Networking; Microsoft Certified Applications Specialist (MCAS) in Business Financial Services and Office Technology; and Final Cut Pro Certification in Television Productions. Culinary students may receive ServSafe certification, and Health Sciences students are prepared to take the Certified Nursing Assistant (CNA) exam.
36
Developing additional opportunities to earn industry-recognized certificates or credentials is a mandate for Azure as it seeks to reinvigorate its POS. The guidance counselor interviewed was not sure which credentials or certificates might be available to students; she believed Azure no longer offered CISCO networking certification. No explicit mention is made of CISCO or Novell certification in Azure’s course registration guide, only that “students will qualify to sit for a national industry-standard certification exam” upon completion of the networking sequence of courses. The guide notes that Business and Finance and IT students may prepare to sit for the Microsoft Office Certification exam; IT students may seek an Oracle Certified Professional (the standard for proficiency in SQL database design) certification; and Architectural Design students may sit for the AutoCAD certification exam. Supporting Components of POS Legislation and policies. Not long before our 2010 visit, the state held a regional POS training that included West District. The goal of the training was to provide guidance to districts as they began to create, implement, and sustain POS. The training defined POS according to the law, described how the components were reflected in current state practice, and provided examples of POS from other states. The roles and responsibilities of school-level staff and data reporting requirements were also discussed. Postsecondary representatives were present. This was a working meeting, and attending comprehensive high schools were expected to develop four-year course plans for POS at their schools. Relevant community college staff served as resources in this work. As we visited our treatment and control schools, this training workshop was mentioned by a number of school staff. As we asked about POS, it was clear that many comprehensive school staff were first introduced to the concept at this training. Across the district, the development and implementation of POS has been described as taking the Perkins initiative articulating secondary and postsecondary CTE programs known as tech prep to the next level—firmly establishing and institutionalizing practices, partnerships, and policies that were more loosely or locally arranged under tech prep. As noted in the section on POS in West District, above, POS were driven not so much by federal, state, or district mandates, but by a desire to boost student achievement and provide enriched, career-oriented educational experiences that truly produced college- and career-ready graduates. Perkins IV was not cited as a particular driver of POS implementation; instead, locally constituted partnerships of secondary, postsecondary, and business and industry members jointly envisioned the structure and mission of the district’s POS. District resources, JTSC guidance and support, and a community commitment to investing in the construction of new POS high schools have played a greater role in POS development and implementation. Sky’s principal commented that the state legislature has set proficiency standards so high that “sometimes I think they’re crazy.” Although the bar has been set high, he believed that he and his staff could meet the challenge. Otherwise, despite their constrained budget and ongoing facilities issues, he has little complaint with the support he has received from the district. The environment has been a positive one in which “the district has left us alone” to develop programs in partnership with Sky’s postsecondary, business, and community partners.

37
Partnerships. As should be clear throughout our discussion of West District, partnerships have been integral to POS development and implementation. They may be district-wide or more localized; institutionalized or highly personal and idiosyncratic to the school, the program, or even the POS teacher. Where they appear to function best is when personal or local relationships have become formal or institutionalized partnerships, as in the case of the JTSCs. However, such partnerships also need to be actively maintained by the district, schools, and teachers participating in them, lest they dwindle or cease to function. This can require a considerable investment of time and energy. In two treatment schools, Navy and Sky, specific positions have been dedicated to establishing and maintaining school-community partnerships; at the third, Azure, an administrator has been tasked with taking on these responsibilities. In Navy’s medical program, students work in industry, get internships with prestigious organizations and research institutes (including a local cancer research center, hospitals, and clinics), and learn high-level techniques. Local organizations come to the school looking for interns, despite the poor economy and liability concerns. Students also have opportunities to participate in competitions organized by local businesses, like a House of Cards competition sponsored by the local chapter of the Association for General Contractors (AGC). Sky has frequent meetings of its JTSCs and business and industry and postsecondary partners. The Career Center director is also a frequent participant in meetings with the school’s partners, especially local businesses and the community college. Such shared planning means that Sky’s curricula are well aligned with and similar to the community college’s curricula in rigor and quality. Strong, supportive relationships are maintained with upper administration at both the local community college and the district CTE office. One of Azure’s principal’s primary assistants has been charged with reaching out to and cultivating stronger relationships with postsecondary and business and industry partners and facilitating their interaction with Azure program faculty. The Robotics instructor stated that his program has no official connections with postsecondary institutions, but he has personal contacts in the mining engineering department at a regional four-year university where a number of his former students have won scholarships. The business instructor described a now-defunct sponsorship from a major bank. Azure’s legal studies program has shifted to a more intensive law focus (e.g., civil, criminal, international) that has created new opportunities to cooperate with the local university law school. Program faculty members incorporate face-to-face and online conversations between program students and university faculty. Field trips to the university law library include college faculty assigning problems that require student teams to use several different sets of law reference books to answer. Professional development. Professional development is a key component in the implementation of POS in West District. Professional development in support of POS ranges from the statewide POS training (see Legislation and policies, above), professional development for new teachers from business and industry, district-wide program-specific professional development, support for guidance counselors, and trainings specific to the needs and contexts of our treatment schools. There are professional development days in which academic teachers are brought in to help CTE teachers better understand certain academic concepts in order to ensure that academic standards are being met in the CTE classes, and there are also work days in which CTE teachers go into the
38
academic core classrooms to provide information and help teachers with PBL and other ways to engage students. This latter activity is more likely to occur in the POS high schools, according to the district CTE director. Across treatment schools, and in fact in all West District schools, alternatively certified teachers from business and industry receive additional professional development in the district’s support programs. A Culinary teacher at Navy described the district’s New Teacher program, for which she teaches a class for first-year teachers emphasizing curriculum integration, pedagogy, classroom management, child and adolescent development, and other knowledge and skills needed to support teachers and prevent attrition. For new alternatively certified culinary teachers, technology tools, including the district’s electronic curriculum, may help support and sustain them as they acclimate to the demands of the classroom. Given Navy’s strong emphasis on PBL, all new teachers receive a week-long training on PBL during the summer, and additional in-service learning opportunities are held during the year. Professional development for guidance counselors has included dual credit, credit retrieval, new counselor trainings, apprenticeships, and a workshop on improving the retention of nontraditional students in CTE programs. More generally, the district provides training on recognizing social and emotional issues as well. Navy’s transportation teacher mentioned a recent professional development training that was hosted by the community college. All high school teachers who are in some way involved with OSHA requirements— construction, automotive, metal fabrication—were required to attend. There were new rules updating safety requiring everyone who enters a construction jobsite, including students and teachers, to have a new safety card. The discussion centered on how best to ensure that high school teachers and students earn the safety card. Sky is currently working to develop professional learning communities (PLCs) and is doing in-services focusing on best practices and fostering communication across disciplines. One limitation to on-going professional development is the length of the contractual workday, which makes it a challenge to pay for teacher’s time after work or arrange for full-day substitutes. Additional, program-specific professional development is organized in part by the JTSCs, which help coordinate trainings. According to Azure’s principal, professional development happens all the time for the school’s program faculty and is organized and paid for by the district’s CTE office. Accountability and evaluation systems. As noted in Relevant Policies in West District, above, this district has prioritized the use of data for program improvement in both academic and CTE curricular areas. The three principals noted that they share student achievement data with their program chairs and faculty and use such data to adjust instruction. The district provides student performance data on an item-by-item level to help administrators and teachers compare that performance across the school, region, and district.
39
Navy’s teachers and programs use student assessment data to adjust their instruction. According to the PBL coordinator, such work has been attempted by the district for years but has often meant that a constant stream of student test score data has done little to impact student outcomes. As she commented, “It’s… ‘Here’s your test. Here’s your interim test. Here’s your midterm term. Here’s your semester exam.’ And what they’re saying [now] is that using that data and creating all this stuff that’s… very regimented… hasn’t improved anything over a period of time.” At Navy, they follow state academic content standards in constructing their exams and continually assess student performance, and all teachers are supported in this work with state-sponsored professional development services. Evaluation of student test data was also noted as a valued activity at Azure and Sky. Working collaboratively, teachers adjust their instructional strategies to better reach struggling students. College and career readiness standards. As noted in Relevant Policies in West District, above, West implemented a college- and career-ready course of studies as part of its new graduation policy, which mandates that students take at least one arts and humanities or CTE elective. At a larger level, however, West has demonstrated its commitment to college and career readiness by encouraging high-level academics and enriched CTE experiences in its POS high schools. Our treatment schools seem largely free to define college and career ready according to their unique contexts and student populations, but in the most general terms, all three schools have focused on preparing students to synthesize academic and technical content knowledge and skills and apply their knowledge and skills to the solution of real-world problems. This often involves working across CTE programs, across academic and CTE curricular areas, and across secondary and postsecondary systems. All of our POS schools are highly focused on preparing students to graduate ready to move on to some form of postsecondary education or training without the need for remediation. In order to be sure that students are prepared for whatever postsecondary option they choose, many Navy teachers make themselves available after school for tutoring. The transportation teacher described how teaching at Navy is different from other district high schools, in which he has also taught. At Navy, teachers do not show students exactly what to do. At Navy, “everything is based on problem solving.” Sky’s soft skills class for freshman students has a strong focus on preparing young people for the world of work and higher education. Nearly all the adults we spoke with mentioned the “huge change” they see occur in students during their time at Sky, such as an increase in leadership abilities, which some attribute to CTSOs and others to participation in service organizations and other opportunities. Another Sky initiative unites project-based learning with career and educational planning. Students develop personal portfolios of their program-specific work that follow them from year to year. As seniors, they participate in mock interviews with members of the local business community, who examine their portfolios and rate their professionalism and employability—and frequently hire graduates. Portfolios take a variety of forms depending on the program; portfolios are also in use in selected programs at Navy and Azure. Most students we spoke with at Azure were high achievers who were focused on their goals and knowledgeable about careers. One student in the business program was planning a career in medicine. There are no medical programs at Azure; she chose the school for its strong academic

40
reputation. This student offered an unsolicited comment about “how well they actually really do prepare you here for college. I feel really prepared because of the workload and the different ways that we are learning why—the reasons behind—what we’re doing.” An English teacher noted that all program areas taught at Azure require college degrees to be successful, so she seeks to “build up” students’ college-level literacy skills. She does this by giving the kinds of assignments that students will be expected do in college, like research papers and responding to written texts. The business teacher tells her students, “Employers want someone who’s well rounded. You need to take the same attitude with education. Don’t just come into your program area and excel in the program area and not excel in all the other classes. Content is the foundation of the program area. The math and English. The history, you know, for business. It all works together.” Course sequences. As previously described, our treatment schools all offer POS that progress from broad-based introductory courses through more advanced courses to more intensive experiences in 12th grade. The schools differ in when students begin their programs and also in the number and type of intensive, upper-level courses they offer. In general, most POS sequences appear to start in earnest in the 10th grade, as the ninth-grade year is often taken up with required coursework. After 12th grade, students are expected to carry the postsecondary credits they have earned through participation in dual credit and other credit-earning opportunities into aligned programs at the local community college or a four-year university. In some programs, teachers spoke of working directly with postsecondary institutions to align curricula and course sequences; in others, such alignment has been part of a larger, district-level effort to align its courses with the local community college. Courses at Navy progress from general courses at the ninth-grade level to advanced coursework and a capstone during senior year. The transportation teacher helped us understand how Navy’s transportation program differs from a standard district automotive program, in which students begin with a safety and tools unit and cover as many automotive systems as time allows. At Navy, the four-year program starts with an introduction to how systems work, then covers the various types of energy, , and progresses through generating power, applying that power in systems, programming robotics, and then introduces the eight NATEF automotive systems. Most of Sky’s course sequences begin in the 10th grade with rotations through nine-week introductory classes in the available programs within students’ general pathways (e.g., nine weeks of culinary, nine weeks of hospitality). Although in accepting a seat at Sky, students have already committed to a program, they may still apply to change programs within their pathway, pending the availability of a seat, prior to junior year. After this, no changes may be made. Although this structure gives students some freedom, it also puts a strain on their schedules: Many late deciders have to take summer, online, and other non-standard classes in order to accommodate needed electives. Azure’s business teacher mentioned that district business course titles had recently been changed, which spurred activity on the part of the curriculum committee that worked with the community college to submit the necessary paperwork to maintain alignment.

41
Credit transfer agreements. Articulation agreements with the local community college have been established at the district level for courses eligible for dual credit. These agreements apply to all district high schools. Guidance counseling and academic advisement. Career advising happens largely at the program level in West District POS schools. Several teachers across our treatment schools stated that guidance counselors serve largely academic planning needs (i.e., filling out four-year graduation plans) and are not connected—or experienced—in the programmatic areas that faculty are. Faculty are thus accustomed and expected to do both informal and formal advising, including counseling students about the best postsecondary programs to consider in their respective fields, providing advice on professional standards, and mentoring students in their job and college searches. Across schools, all students are required to have a plan encompassing their four years of high school and outlining the courses they will take. Completing such a plan shows students and their parents what high school requirements and postsecondary training and education are necessary to reach their anticipated career goals. At all of our treatment schools, many interviewees stated that even if students choose not to pursue their POS into postsecondary degrees and careers, the knowledge and skills they acquire can help them finance their schooling to meet their goals. Navy’s four counselors split their caseload in two, so that each pair services half of the school’s programs and thus becomes more familiar with their POS and teachers. Counselors meet individually with each student at least once a year to plan their schedules and monitor their progress. In senior year, students receive extra assistance as they make postsecondary choices and complete graduation paperwork. Parent-teacher meetings always include a counselor as a facilitator. Career guidance happens across the whole school, concentrating in the programs. Navy has an advocacy period in which students receive mentoring and advising from teachers and work on career exploration and resumes. This school also has a ninth-grade academy in which students are assigned a mentor teacher. Sky’s new guidance counselor stated that the best career guidance comes from CTE instructors. She saw guidance counselors as providing the most help related to academics and postsecondary planning. Career guidance and professional preparation are also part of the ninth-grade soft skills class. Additionally, Sky has a mentoring program in which academically struggling freshmen are paired with teacher mentors. According to Azure’s principal, guidance counselors are largely responsible for four-year planning and college preparation; career guidance happens with program instructors. The Robotics teacher agreed with this; he noted that program instructors are required to incorporate career guidance into their syllabi. In his area, this happens in the Introduction to Engineering Principles class. In the guidance area, the room known as the Career Center is in reality the repository for college-going materials, including course catalogs and financial aid information. Azure’s newest guidance counselor has implemented a ninth-grade cohort model intended to mentor and support freshmen socially and academically. She develops activities that relate to student-friendly topics and pairs students with older mentors. Because she is a largely academic counselor, this new counselor would like to learn more about Azure’s CTE programs, but her

42
ninth-grade clients have not yet plunged fully into their CTE pathways. The kinds of career guidance she offers students are class presentations, academic planning, setting of life goals, study skills, interest inventories, and exposure to the state’s online career information system. Two teachers at Azure commented on the role of POS in helping students pay their way through college—even if they choose to study in a different field. A graphic design teacher noted that talented, motivated students can use the skills learned in his program to work their way through college, making good money in the industry. A legal studies teacher stated that regardless of whether they ultimately pursue careers in law, graduates of his program can get paralegal licenses that will help finance school. Teaching and learning strategies. Strategies for engaging students in meaningful learning varied widely across our treatment schools. Curriculum integration was seen as a highly desirable, if elusive, ideal. Several teachers reported doing curriculum integration work largely on their own, finding time infrequently, on an as-needed basis, to seek input from peers in other curricular areas, observe each other’s classrooms, and offer each other critiques and feedback. However, curriculum integration remains a challenge because of staffing and scheduling issues. Other strategies noted in the schools included technology integration, project-based learning, school-based work opportunities, opportunities to participate in out-of-school work-based learning like internships and co-ops, and other interactions with local businesses. Navy’s Culinary instructors value unusual techniques that get students revved up and ready to learn. During an introductory Food and Nutrition classroom observation in 2009, we saw the instructor use music, movement, and a variety of instructional strategies and technologies to engage her students. Another strategy Culinary instructors employ is to make the students the teachers, as was the case when a group of elementary students were brought in for a day of student-led exploration of culinary. The program also takes on large catering jobs that bring Navy students into contact with movers and shakers in the community and local restaurant and hospitality industry. One challenge in Culinary is how to accommodate IEP students, who need a safe, structured environment, something not easy to provide in a setting that does not easily accommodate wheelchairs or the hearing and speech-impaired. Instructors frequently pair talented older students with IEP students to provide extra monitoring and help. The program’s use of technology also supports students with special needs. Sky finds it difficult to allocate time and resources to curriculum integration. The Culinary program’s chef-instructor had little awareness of the concept and no time or contacts with academic instructors. The welding teacher told students that he would not “take points off for spelling.” By contrast, the desktop publishing teacher teaches math that is crucial to publishing: decimals, percentages, and fractions. She noted that an English teacher has a newspaper unit in his course: students taking both classes often ask if they can work on the newspaper project in her Office Technology course. She has considered asking this teacher to work with her on increasing expectations for his students who are in her CTE area, but has not due to time issues. Curriculum integration is not being done consistently at Azure. The school is still working toward incorporating PBL— professional development had been done, but the availability of funding will determine whether the work will continue. From our visits, it appears as though

43
PBL at Azure is done by individual teachers bringing in elements from other disciplines to create a large project as opposed to working with other teachers to integrate course content. One teacher described how PBL drives the legal studies program. Each year, students take on large topics and are challenged to develop and prove a thesis, write a position paper, create a technology-enhanced presentation, and draft an action plan. Students use these products to generate personal portfolios that are used for college or job applications. The Robotics instructor believes his students’ creativity is sparked by the PBL-style, hands-on problem-solving that they do. He disdains curricula that force students to work in lock-step. An English teacher thought Azure teachers would do more PBL if their students could be cohorted so that each section of her class consisted of students from the same program area, but she understood the difficulty of doing cohorts. As a magnet, Azure draws students from all over the district who need to take the bus home. This leaves little time outside of class for collaborative work, which is necessary in PBL. West District POS high schools offer several examples of opportunities for students to apply their academic and technical knowledge and skills in real-world settings without leaving school. These include on-site restaurants, coffee shops, and full-service cosmetology facilities that are open to students, staff, and the general public. Through these, students gain experience in different capacities. At Navy, students gain practice in “front of the house” versus “back of the house” roles: Here, first-year hospitality and culinary students are required to do half-year programs in each area, since each needs to know each other’s business in the real world of restaurants, hotels, and tourism. On-site facilities also serve as showcases for the schools’ POS. At Sky and Navy, automotive students perform basic maintenance on faculty vehicles; faculty members provide the oil or transmission fluid needed and students perform the service during school hours. Graphic design studios and print shops provide another venue through which students may gain practical experience and interact with the public. At Sky, the graphic design teacher connects his students with members of the local business community needing design services. Students in one class were designing a logo for an area business that had agreed to offer a $50 prize to the designer of the winning logo. Students also compete to produce materials for the school, including the school’s logo, t-shirt designs, murals, fliers, graduation programs, and many other products. Sky’s student-run print shop produces and distributes student work. Sky’s career center lists available work-based learning (WBL) on its website, including job shadowing, a co-op job bank, work experience, junior year internships, and senior work study. Part of the job of the director is to ensure that the jobs she posts adhere to child labor laws, do not exploit the unpaid student worker, and do not displace adults. Although some of the newer high schools in West District do not have the clout to request paid positions, many of the jobs posted at Sky are paid. Sky maintains a list of dozens of business and industry people who come in to the school to conduct mock interviews of students. Although the goal is to teach interviewing skills, it is not uncommon for a businessperson to be impressed with a student and hire them. The school’s Automotive Youth Educational Systems (AYES) program also hosts an evening with students, parents, and panels of service managers from area dealerships looking for interns. Students are

44
interviewed and ranked and then sent out to internships based on that ranking. The AYES program also includes mentoring from technicians, and some interns are hired upon graduation to continue working with the same mentor technician. Due to the recession, there are fewer technician internship positions; the school expects these to increase in number when the economy recovers. Technical skills assessments. West District’s state Perkins plan notes that they are working to develop a technical skill attainment measure. The state plans to use third-party assessments as opposed to developing their own and had hoped to begin piloting the program in several CTE program areas in 2009-2010. However, the state budget shortfall has left them short-staffed and unable to implement the pilot program. Navy’s transportation teacher grades his students’ projects using a rubric that shows the student exactly what is expected. He said that he received in-house professional development on rubrics from the librarian, who has a website that helps teachers create rubrics. He considers rubrics to be a measuring stick of how much students are expected to know about a standard. Once he adopted them, he claimed he no longer had trouble engaging students, partially because they knew upfront what was expected of them. Azure’s business teacher grades her students’ projects using a rubric that shows the student exactly what is expected, usually consisting of teamwork, being on task, quality, spelling, grammar, content, and format. In the Computer Science I class we observed, the teacher gave the students an online formative skills assessment using a web-based service he pays for out of his own pocket. The Introduction to Robotics instructor shared his lesson plans, rubrics, and other materials from VEX Robotics, which outlined how the project involved robotics, engineering, math, geometry, measurement, electronics, and physics concepts like torque, motion, and forces. The VEX curriculum is written according to national-level standards, including National Science Education Standards and those of the International Technology and Engineering Educators Association and the National Council of Teachers of Mathematics. Site Descriptions: Control Schools
There are over 20 comprehensive high schools serving the students in our control group. We examined the course guides of all of our control high schools to see what kinds of CTE were being offered there. All of our comprehensive control schools offer CTE courses, and some offer career academies and magnet programs that are likely to be POS, such as NAF academies. One high school was recently reorganized around (non-lottery) wall-to-wall themed academies. Depending on the theme of such academies, we assumed that they might be POS and thus chose not to observe them. Instead, we noted their existence and studied their program course sequences so that we could identify control group students in those programs and remove them from a TOT estimate in our final analyses. Aside from those programs, no other CTE offerings were configured and described in the course guides in ways that could be considered POS. Although sequences such as Automotive I, II, and III may be offered at some schools, at others, a CTE program area might only contain one course, such as child development.
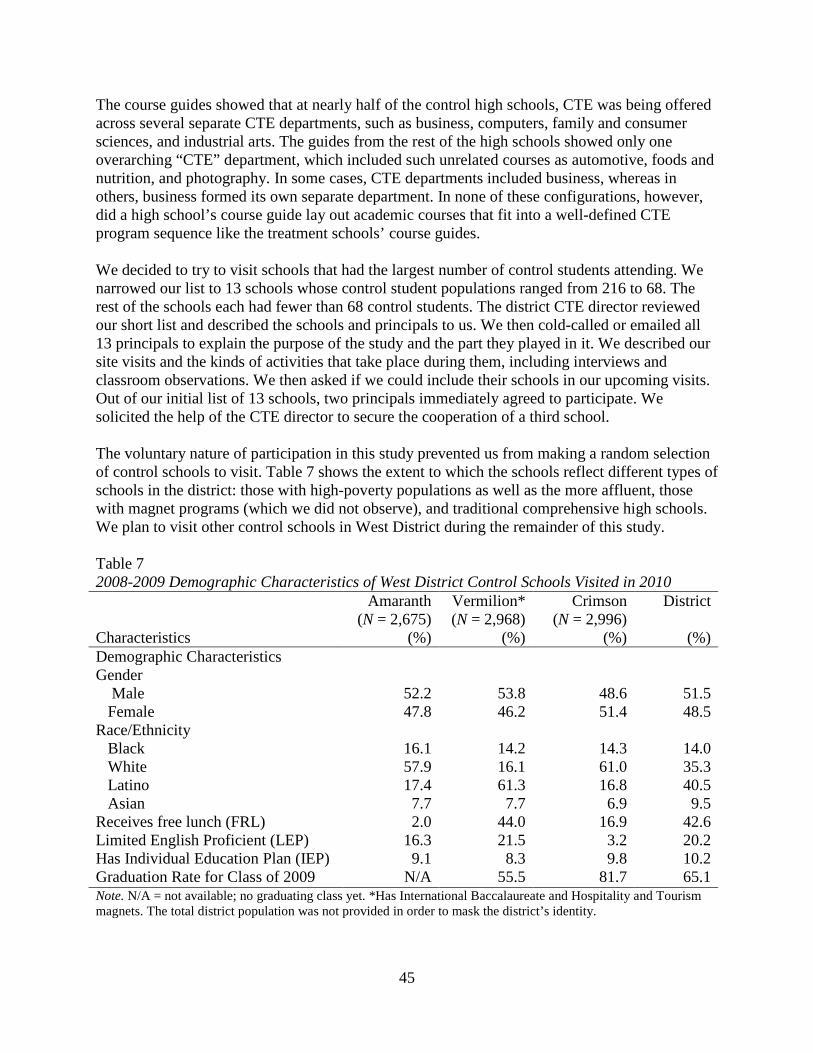
45
The course guides showed that at nearly half of the control high schools, CTE was being offered across several separate CTE departments, such as business, computers, family and consumer sciences, and industrial arts. The guides from the rest of the high schools showed only one overarching “CTE” department, which included such unrelated courses as automotive, foods and nutrition, and photography. In some cases, CTE departments included business, whereas in others, business formed its own separate department. In none of these configurations, however, did a high school’s course guide lay out academic courses that fit into a well-defined CTE program sequence like the treatment schools’ course guides. We decided to try to visit schools that had the largest number of control students attending. We narrowed our list to 13 schools whose control student populations ranged from 216 to 68. The rest of the schools each had fewer than 68 control students. The district CTE director reviewed our short list and described the schools and principals to us. We then cold-called or emailed all 13 principals to explain the purpose of the study and the part they played in it. We described our site visits and the kinds of activities that take place during them, including interviews and classroom observations. We then asked if we could include their schools in our upcoming visits. Out of our initial list of 13 schools, two principals immediately agreed to participate. We solicited the help of the CTE director to secure the cooperation of a third school. The voluntary nature of participation in this study prevented us from making a random selection of control schools to visit. Table 7 shows the extent to which the schools reflect different types of schools in the district: those with high-poverty populations as well as the more affluent, those with magnet programs (which we did not observe), and traditional comprehensive high schools. We plan to visit other control schools in West District during the remainder of this study. Table 7 2008-2009 Demographic Characteristics of West District Control Schools Visited in 2010 Amaranth Vermilion* Crimson District
Characteristics (N = 2,675)
(%) (N = 2,968)
(%) (N = 2,996)
(%)
(%) Demographic Characteristics Gender
Male 52.2 53.8 48.6 51.5 Female 47.8 46.2 51.4 48.5
Race/Ethnicity Black 16.1 14.2 14.3 14.0 White 57.9 16.1 61.0 35.3 Latino 17.4 61.3 16.8 40.5 Asian 7.7 7.7 6.9 9.5
Receives free lunch (FRL) 2.0 44.0 16.9 42.6 Limited English Proficient (LEP) 16.3 21.5 3.2 20.2 Has Individual Education Plan (IEP) 9.1 8.3 9.8 10.2 Graduation Rate for Class of 2009 N/A 55.5 81.7 65.1 Note. N/A = not available; no graduating class yet. *Has International Baccalaureate and Hospitality and Tourism magnets. The total district population was not provided in order to mask the district’s identity.
46
In the following sections, we will describe each of the three control schools visited in 2010—Amaranth, Vermilion, and Crimson—including basic student demographics, unique characteristics of their CTE programs, and the CTE classes we observed. We conclude by describing those mandated and supporting components of POS that we were able to identify in these schools. As non-implementers of POS—most comprehensive high schools in West District have been only recently introduced to the concept through the state’s POS training—these schools should not be expected to show evidence of POS. However, West District is beginning to “roll out” POS in all district high schools; those with more of the mandated and supporting components may find it easier to develop POS as the initiative grows in scale. Control School: Amaranth High School Amaranth is a nearly brand-new high school that was constructed on ecologically sound principles. The principal, a veteran academic and CTE teacher and administrator, has a strong commitment to CTE, seeing it as a powerful application of learning and value-added to core disciplinary areas. He is aware that his school must now compete with more career-focused but equally academically rigorous CTE-themed POS high schools. According to the principal and CTE coordinator, Amaranth has popular CTE courses and programs and popular CTSOs—like SkillsUSA, Future Business Leaders of America (FBLA), Family, Career and Community Leaders of America (FCCLA), DECA (formerly known as the Distributive Education Clubs of America), and ProStart—that co-exist with high-level academics and extracurricular activities in a comprehensive high school environment. Amaranth’s 2,675 students come from a variety of racial/ethnic and socioeconomic backgrounds; housing in this new and expanding suburban neighborhood includes subsidized apartments and mansions. The student body is more White than other schools in this majority-minority district, and it also has fewer IEP, LEP, and free-lunch eligible students (see Table 7). CTE at Amaranth. Classes identified as CTE in Amaranth’s course catalog include architecture/CADD, food and nutrition, family and consumer sciences, fashion apparel and construction, automotive technology, building maintenance services, and child development. Amaranth formerly had a woodworking program as part of its CTE offerings, but its woodshop was recently shuttered due to district budget cuts. Notably, Amaranth offers several additional career-oriented courses and programs that, despite being part of generally recognized career clusters (e.g., Warford, Beauman, & Kindall, 2008), are nonetheless situated “outside” CTE in the course catalog. These include commercial design, photography, business, communications and broadcast journalism, and computer science (including networking and website design). Amaranth students are encouraged to take advantage of CTE classes that can earn them dual credit, for which there are currently 15 cross-listed courses at the school. From 2008 to 2009, the number of Amaranth students receiving dual credit for such courses doubled from 86 to 175. The school’s photography instructor is also its CTE coordinator, and during our site visit, she was collecting students’ dual credit applications and expecting a healthy number of returns. Although the budget crisis impacting the state and the district has affected the school’s offerings, Amaranth nonetheless seems well-funded, with well-laid out classrooms for both its academic and CTE classes. Resources in CTE—particularly in the purpose-built automotive and culinary

47
classrooms and lab spaces—appear abundant and up-to-date. All classrooms are equipped with audio and video projection systems and modern computers; labs adjoin their related classrooms and are outfitted with high-quality, industry-standard equipment and materials. In the case of the food and nutrition class, the available technology suggested that the program is geared less toward professional than to home cooking applications. The automotive lab is also well-equipped. Photography students use new, state-of-the-art digital cameras and digital media software. The school’s CTE programs are run according to district and industry standards, seem to integrate academic content where appropriate (e.g., mathematics and science in automotive), and supplement classroom experiences with opportunities for hands-on participation and leadership in clubs and CTSOs. During our visit, students were preparing for SkillsUSA competitions, and several teachers and the principal praised the students’ successes in winning previous competitions. The automotive program, in particular, has won gold, silver, and bronze medals. Among the control schools visited, Amaranth comes closest to meeting most of the mandated components of POS and shows evidence of some supporting components. It has strong administrative and faculty support for CTE, offers a variety of CTE courses balancing technical, academic, and practical content and skills, and provides students with postsecondary credit-earning options. Despite this, Amaranth’s CTE offerings are not POS because POS elements appear only in selected courses or aspects of the school’s functioning and have not been implemented in any CTE program inclusively, deliberately, and systematically. Students are not presented with clear POS-like sequences of courses and aligned dual credit options. Amaranth’s administrators and instructors are also unfamiliar with POS as a concept. However, with focused professional development on POS, a more unified and inclusive CTE department, and an infusion of the resources and staff time needed to develop and execute POS, this school could be a strong implementer of POS. CTE classes observed at Amaranth. During our site visit, we observed Automotive Technology, Food and Nutrition, and Photography. The observed Automotive Technology class covered Ohm’s law, specifically electricity in automotive applications, through a multimedia PowerPoint lecture that covered amperage, voltage, resistance, and parallel and series circuits; the tightly written lesson plan included an explicit academic integration component. Food and Nutrition addressed salad- and dressing-making, as drawn from the vegetables unit of the course’s assigned text. Students assembled different salads in their respective groups, using dressings they had made the day before, and then sampled them at the end of the class, voting on their favorites. Photography II mostly consisted of an assignment in which students were asked to leave the classroom, quickly take a portrait of a classmate, and come back to the room to work with design software to superimpose an inspirational quote on top of that photo; this work required a fairly well-developed design aesthetic and interpretative, communicative skills.

48
Control School: Vermilion High School A nearly 50-year old comprehensive high school with a changing mission and student body, Vermilion High School now houses two academies accessible only through the lottery—an International Baccalaureate (IB) academy and an Academy of Hospitality and Tourism (AOHT)—alongside its regular academic and CTE offerings. Vermilion’s principal has been written about by the local press, recognized by a leading national principals’ organization, and acknowledged by the U.S. Department of Education for his school’s recovery from a legacy of poor performance and new status as a turnaround school. Situated in an economically challenged urban neighborhood, this large Title I school has 2,968 students, the majority of whom are Latino. Compared to the rest of the district, it has fewer IEP but more LEP and free-lunch eligible students (see Table 7). Many students speak Spanish. According to the principal, Vermilion employs an “aggressive” program of pull-out remediation and individualized instruction for struggling students; at the time of our site visit, the teachers of the two CTE classes we observed reported having lost “many” students to these pull-outs. CTE at Vermilion. Outside of its specialized academies, Vermilion’s CTE offerings include automotive technology, business (including accounting and marketing), child development, computer applications, fashion apparel and construction, food and nutrition, furniture and cabinetmaking, graphic design, and website design. Most CTE at Vermilion is not offered in POS-like coherent pathways or course sequences; with the exception of groupings like Accounting I and II, or Automotive I, II, and III, CTE courses are more likely to be stand-alone classes that students take as electives. Vermilion also hosts several CTSOs, including DECA, FCCLA, and SkillsUSA, although participation in these appears to be limited—unlike other schools we visited, we noticed no posters or marketing materials while on site, the principal did not mention them, and the automotive instructor interviewed said that his students did not participate in any CTSOs at this time. During our visit, woods and automotive were observed. Vermilion students may take advantage of opportunities to earn dual credit, for which there are seven available cross-listed CTE courses at the school. The school also offers a dual enrollment program for students interested in careers as teachers in West District; through articulation agreements with the local community college, participants take both their academic classes and college courses taught by college faculty on the home high school campus. Vermilion has standard classrooms and lab spaces for its academic and CTE classes. The woodshop and automotive labs—which include stadium-style seating for the lecture and seatwork portions of class—seemed well-resourced; both spaces were clean, organized, and full of well-maintained, industry-standard equipment and technology, although none of this equipment looked brand new. According to the two instructors interviewed, programs are run according to district standards, integrate academic content as appropriate (e.g., math and science in automotive), and supplement classroom experiences with opportunities for hands-on participation and leadership in clubs and CTSOs. Unlike other schools in the district during this visit, no mention was made of the SkillsUSA competitions that were coming up in two weeks. Vermilion’s CTE offerings are not POS because most lack coherent sequencing and clear postsecondary links; further, Vermilion’s CTE instructors do not seem familiar with the POS

49
concept. The school’s new guidance counselor attended the state’s POS training, but stated that no work to develop POS at Vermilion has been attempted at this time. Unlike Amaranth, which separates out its more academically intensive CTE courses like business and computer science from the CTE department, Vermilion combines all of its career-related courses—except AOHT—under the CTE heading. CTE classes observed at Vermilion. In Wood Tech, students worked on individual projects, which for this unit were a knick-knack shelf and a lidded jewelry box; students worked in pairs or alone, routing, cutting, and finishing their wood pieces for the jewelry box, operating a wood engraver, sanding, varnishing, or painting. Project instructions were highly prescriptive. Automotive Technology I had no particular focus on the day we observed. Students took a quiz, then some remained in their seats, nominally studying from a classroom textbook, while others independently tinkered with a couple of vehicles in the shop; one was a donated car being stripped for parts, and the other was a custom job for a Vermilion teacher. Control School: Crimson High School Crimson is a comprehensive high school built within the last 15 years to support this district’s growing population. As development spread across the city, new schools were built on the periphery, spurring more neighborhood growth that tended to be more affluent than the district as a whole. Crimson offers typical comprehensive high school activities and programs such as performing arts, CTE, Junior Reserve Officers’ Training Corps (JROTC), athletics, clubs, and yearbook, but there are no magnets or academies on this campus, meaning the school draws exclusively from local neighborhoods. The student body in 2008-2009 was made up of 2,996 students; like Amaranth, it is mostly White; compared to the rest of the district, it has fewer IEP, LEP, and free-lunch eligible students (see Table 7). Crimson boasts a high graduation rate (nearly 82% in 2009), which the staff attribute in part to its A/B block schedule. In such a schedule, students can take eight different courses per semester. Only four classes meet per day for nearly 90-minute blocks, allowing for longer learning times than 45-minute periods. With more total courses, students can continue taking electives even if they must re-take a course, and there is time to “double up” on classes in which they are weak. Due to district-wide budget cuts, Crimson was slated to end block scheduling in 2009-2010, but parents lobbied to keep it. The district allowed Crimson to remain on a block schedule but did not provide extra funding for staffing. The trade-off for retaining the blocks is larger class sizes. Retaining blocks is generally positive for CTE because more students are able to take more electives. However, sometimes students with no interest in CTE end up taking CTE in order to fill a block. Other high schools that dropped block scheduling have had to eliminate some CTE programs entirely. CTE at Crimson. CTE offerings such as food and nutrition or woods technology are housed in an Electives Department. Business forms its own separate department. Although some programs may exhibit a potential sequence (i.e., Woods Technology to Furniture and Cabinetmaking I and II), CTE is not formally laid out in this manner at Crimson. In some program areas, CTSOs are strong and popular, whereas in others, teachers are not as supportive.

50
CTE classes observed at Crimson. Not much time was spent on direct instruction in CTE classes during our classroom observations. The cabinetmaking teacher gave a short lesson on how to attach a veneer design onto a wood surface without splitting it, but for the rest of this class, and for the entirety of a 3D animation class that was observed, students worked independently on individual projects. By their sophomore year, students in the two CTE courses observed were largely self-directed and spent most of their time working independently or in small groups on challenging projects. Both instructional areas were well-equipped. The wood shop had high-quality precision power tools, and the teacher said he had the tools and equipment that are standard in the construction and woodworking industry, including computer numerical control equipment. The 3D animation classroom had a large computer lab and current software. POS Results: Control Schools In the sections that follow, we synthesize our observations of the four mandated components of POS, as contained in the Perkins IV legislation, as we observed them at the three control schools we visited. These syntheses are followed by specific examples from the schools. Mandated Components of POS
1. Incorporate and align secondary and postsecondary education elements. At the control schools we visited, CTE offerings are largely positioned as supplements to the schools’ academic curricula. The control schools’ CTE programs do not appear to have been purposefully aligned with programs at the local community college, except to the extent to which course curricula were developed by the district—not by instructors at these schools—to align with and generate dual credit, where such credit is available. In most cases, there appear to be no connections between the high school’s CTE programs and programs at the local community college or area universities, unlike at our treatment schools. At our POS schools, many CTE faculty members are active participants in the work of aligning and developing their curricula—some participate in their programmatic JTSCs. At the control schools we visited, by contrast, the faculty we spoke with were recipients of work done by the district and the JTSCs. Based on the CTE courses observed and a study of Vermilion’s course catalog, there are only limited connections made between secondary and postsecondary curricular areas there. No mention was made of school faculty working with the community college to align their programs. In fact, the automotive instructor stated that although he has good support from the district’s CTE liaison, he has no partners or contacts at the community college level. Some of Crimson’s CTE programs have no postsecondary program into which students could continue, as is the case with the Woods Technology and Cabinetmaking classes. 2. Include academic and CTE content in a coordinated, non-duplicative progression of courses. Across the control schools visited, we observed that most CTE courses are not offered in the kinds of sequences seen in POS high school—that is, courses increasing in specificity and challenge from introductory, broad-based courses through more specialized work and culminating in intensive, capstone- or seminar-style experiences. Some program areas, like automotive, do follow such a progression, as noted in Course Sequences, below. Generally, however, the control schools have not sought to align academic and CTE content into POS-like

51
pathways. Selected teachers across control schools mentioned that they had made personal efforts to incorporate curriculum integration in their classrooms (see Teaching and Learning Strategies, below), but curriculum integration is not a mandate at the control schools visited. Many CTE courses at the control schools are listed as elective options, some requiring pre-requisites. POS comprised of coordinated, academically challenging CTE courses have not been realized at the control schools observed. However, academics have been infused into some CTE classes. The course catalog entry for Furniture and Cabinetmaking notes that mathematical principles will be applied as needed in the cost planning, design, and construction of furniture and cabinets; the teacher stated that all courses are required to incorporate an essay component in their exams. Courses like Anatomy and Physiology and Epidemiology are offered in the Science Department, but they are not part of a coordinated progression of courses. 3. Offer the opportunity, where appropriate, for secondary students to acquire postsecondary credits. At the control schools visited, CTE dual credit remains an optional, not a primary, component of students’ graduation plans; at our treatment schools, it is understood by administration and faculty and promoted to students as a vital component of their overall POS. The number and type of dual credit-eligible courses offered vary according to the programs in place at the school. Amaranth offers a range of dual credit-eligible courses, but no mention was made during our visit of faculty exchanges or the availability of courses taught at the high school by community college faculty. Amaranth also has fall meetings with local community college representatives at which they set joint goals for dual credit program participation. Six dual credit-eligible courses are available within Vermilion’s non-AOHT CTE programs, and the school offers students other opportunities to earn postsecondary credits. However, these opportunities are not systematic or targeted to CTE students, and even in the AOHT, there is only one dual credit-eligible course. Eight CTE courses at Crimson offer the opportunity to earn dual credits at the local community college, including Accounting and Computer Applications. 4. Lead to an industry-recognized credential or certificate at the postsecondary level, or an associate or baccalaureate degree. There is little evidence of industry-recognized credentials or certificates in the control schools visited, nor of an administrative mandate to value such credentials and make them available to students. However, all district CTE programs have been designed to adhere to industry standards, so we did observe programs, like automotive at Amaranth and Vermilion, for example, that were being taught—with varying degrees of rigor—to National Automotive Technicians Education Foundation (NATEF) standards. Where the control schools differ from the treatment schools is in their lack of official status with such credentialing bodies. Given their different academic missions and lower numbers of CTE students, the control schools we visited have not invested the considerable funds and personnel hours required to acquire and maintain such certifications; principals and teachers in the CTE programs at Amaranth and Vermilion noted that their programs do not lead to any industry-recognized credentials, certificates, or degrees. Both schools have automotive programs built according to NATEF standards, but the programs themselves are not ASE-certified. Vermilion’s automotive instructor was hopeful that achieving ASE certification could become a school goal. Students currently have no opportunities to earn credentials or certificates other than the

52
district’s CTE competency certificate. There are also no credentials or certificates for CTE students at Crimson, other than the district’s CTE competency certificate. Industry standards do not appear to have influenced its CTE offerings other than through district standards and the district-wide articulation agreements developed with the local community college, which may have built-in industry requirements. Supporting Components of POS Legislation and policies. Our control schools are not yet implementing POS, and as such are not expected to adhere to state or district policy regarding them. However, schools know that POS are coming to all comprehensive high schools—a number of interviewees mentioned participating in the state training on POS, for example. For the time being, most of the CTE programs offered at the control schools we visited do not appear to be consistently and purposefully connected or responsive to the state or region’s economic or workforce development needs. Partnerships. Relationships with postsecondary and business and industry at the control schools visited appear to be largely personal and local, unlike the treatment schools, where such relationships have been formalized and institutionalized and dedicated personnel have been tasked with cultivating and maintaining them. However, the three control schools visited do have multiple connections with valuable partners in the community who support the schools’ programs in varied ways. At the course or program level, a number of Amaranth instructors actively work with community partners and employers. Examples provided by the principal included the anatomy instructor’s connections to a local hospital; the links between the automotive program and the local Chevy dealership; the foods instructor’s outreach to local restaurants as potential employers and training sites for her students; and the CADD instructor’s collaboration with local engineers on the program’s curriculum. Forming and maintaining such connections does not appear to be a consistent schoolwide mandate, however. According to Vermilion’s principal, the school has a strong and actively involved advisory board that includes leading businesses and power players in the local community. These board members help drive the school’s programs and provide valuable resources like field trip opportunities and internships or mentorships. One partner mentioned was the local convention center. It was uncertain whether these partnerships extended much beyond the school’s AOHT. The automotive instructor mentioned having connections with a local Dodge dealership and relationships with locals with skills in particular areas (e.g., a gentleman who came in to teach the students pinstriping and detailing). During boom economic times, Crimson’s cabinetmaking students were graduating and starting businesses doing construction and cabinetry for area residential developments. The woods teacher said that several alumni served on the program advisory board; their attendance varied with their workloads. Once the economy contracted, many of these businesses went under.

53
Professional development. The district funds and supports professional development for teachers and guidance counselors at all district schools. Some control school personnel we spoke with reported attending the state-level training on POS. The district recently embarked on an effort to develop POS at all comprehensive high schools. District CTE personnel visit each high school one at a time, meeting with the principal, the counseling staff, and the CTE staff to lay out what POS pathways are and emphasize their importance. Professional development is offered to Amaranth’s CTE instructors related to their programmatic areas, but neither of the three teachers or two administrators interviewed mentioned receiving professional development specific to POS. Programmatic professional development is also offered to Vermilion’s CTE instructors. As previously noted, the school’s newest guidance counselor participated in the POS training provided by the state, but she was largely unclear on the POS concept and no work to develop POS at Vermilion has yet been attempted. On some professional development days, Crimson’s CTE teachers work with academic teachers to see how they can teach academic concepts to their students to help them pass the state proficiency test. There was no mention of any reciprocal help on the part of academic teachers toward CTE teachers or students. One administrator attended the state-led training on developing POS. He felt that Crimson had many of the programmatic elements of POS in place and that they were mostly lacking in communicating opportunities to students and parents. He felt that once parents realized that there was money to be saved by earning college credits in high school, they would want their children enrolled in POS. However, the two CTE teachers observed did not seem familiar with the concept. Accountability and evaluation systems. West District values the use of data for program assessment and improvement, as described. All three control school principals noted that they share student academic achievement data with their program chairs and faculty and use data to adjust instruction. Crimson’s principal, for example, deals with data every day, from proficiency testing and attendance data to updates on credit deficiencies, first-time pass rates on the state test, numbers of CTE participants, and remediation rates of graduates attending the state university. Teachers are expected to review midterm exam results in time to gear teaching to students’ weak areas. Data updates often form the basis of teachers’ in-service professional development. The primary objective seems to be improving student performance on the state proficiency test. College and career readiness standards. We observed no particular standards related to college and career readiness during any of our control school visits. Course sequences. Most of the CTE courses at all three of the control schools visited were not offered as full, three- or four-year sequences of courses; they are offered in a more à la carte style. Course sequences have not been laid out for students, POS-style, so that they may see the connections between academics, CTE, and postsecondary education and careers.

54
Credit transfer agreements. During our control school visits, we did not observe anything unusual regarding credit transfer agreements; the control high schools follow district policy for dual credit and other opportunities for students to earn postsecondary credit. Guidance counseling and academic advisement. As in our treatment schools, college and career advising happen largely in CTE programs in the control schools visited. West District guidance counselors are primarily tasked with academic-related (e.g., four-year graduation plans, scheduling, testing) and college-related planning. Teachers then serve as the main source of career guidance for CTE students. Additional career guidance is available in largely optional career education courses; not all district schools have career centers. Tenth graders at Amaranth may opt to take a two-semester sequence of courses that pairs Careers (a career and postsecondary-awareness and planning class) with Driver’s Education. Students also must take a ninth-grade Computer Concepts class. Most career counseling happens at the programmatic or course level with CTE instructors. The school has a Career Center—perhaps built on the model originally established by Sky and promoted by the district—but its services were not observed during our visit. Career education is a required semester-long course at Crimson that is paired with driver’s education during the sophomore year. It teaches such skills as writing a resume and applying for jobs. Students must interview someone who works in a job in which they are interested. Given recent budget cuts, not every high school in the district has a career center, but those that do value them. A counselor noted the importance of Crimson’s Career Center to her own work because it provides students with opportunities for work experience through a work bank, offers them career exploration through web-based inventories, and ensures that teachers are promoting career awareness across the curriculum. A 10th grade student we interviewed did not recall whether she had a district-required IGP. Teaching and learning strategies. We did not note any remarkable teaching and learning strategies being used in the CTE programs at the control schools visited other than the integration of technology in class lectures and activities. As at the treatment schools, curriculum integration was cited by CTE teachers as a means of engaging students and incorporating rigor and challenge into the CTE curriculum. However, there was no evidence of an administrative mandate to foster curriculum integration or academic-CTE teacher collaboration in the schools visited, and the schools themselves were not configured so as to encourage such collaboration. Although academic standards appear to be high at Amaranth, apart from individual cases, curriculum integration is not being undertaken here as a schoolwide mandate. There is only limited evidence of curriculum integration work being done at Vermilion. The automotive instructor stated that he values curriculum integration and attempts it on his own—he provided samples of math-related worksheets and problems he gives to his students—but noted that he is unsupported by administration in this work. Technical skills assessments. The control schools visited follow district policy regarding the use of technical skills assessments.

55
Ninth-Grade CTE Results In the ninth grade, most students are fulfilling requirements; in some schools, few electives are available for them to take. However, in other schools, CTE sequences begin in the ninth grade, and some ninth-grade students take a required career education and soft skills course. We expect much better data on CTE coursetaking and achievement in later years in this study, as students take more CTE courses. We can expect CTE coursetaking to increase because nationally, 97% of all high school students take at least one CTE course during high school (Levesque, Lauen, Teitelbaum, Alt, & Librera, 2000). We report here on CTE results as our current data allow. The state in which West District is located has not yet developed its own technical skills assessments (TSA) for its CTE courses or programs. For this reason, we report ninth-grade CTE courses taken and GPAs earned. Table 8 shows that a significantly higher percentage of control group students took no CTE courses during their ninth-grade year. Among those taking CTE, significantly more treatment students than control students took two (31.4% vs. 24.4%) and three CTE courses (25.4% vs. 13.6%). Table 8 Number of CTE Courses Taken, 2008-2009, West District
Number of CTE Courses Taken
Treatment (N = 1,957) (%)
Control (N = 509) (%)
Total (N = 2,466) (%)
No courses 12.5*** 31.8 16.5 One course 29.2 27.5 28.8 Two courses 31.4** 24.4 29.9 Three courses 25.4*** 13.6 23.0 Four courses 1.5 2.6 1.7 Five courses .0 .2 .0 Note. 2x2 cross tabulations were performed. Significance was based on chi-square analyses. There were 1,712 treatment and 347 control students who took at least one CTE course during the 2008-2009 school year. As can be seen in Table 9, there was a significant difference between treatment and control students in ninth-grade CTE GPA favoring the control group, but the effect size was small. Table 9 GPA for CTE Courses Taken, 2008-2009, West District
GPA
Treatment (N = 1,712) M (SD)
Control (N = 347) M (SD)
Effect Size (Cohen’s d)
2008-2009 CTE GPA 3.17 (0.73)** 3.25 (0.80) -0.11 Note. An Analysis of Variance test was performed to compare mean differences.

56
Ninth-Grade Academic and Attendance Results
We are measuring academic gains using systems data, including course grades and state test scores as available. We compared several measures of ninth-grade achievement, including academic GPA, percentage of students taking honors math and English, the level of math course taken, and algebra pass rates. Academic GPA In this analysis, a GPA was calculated from students’ academic course grades. On the surface, course grades seem an unreliable measure of achievement because of the variation in grading standards across teachers and schools. However, there is a strong correlation between GPA and college admission test scores as a predictor of college success (Stumpf & Stanley, 2002), and some studies have shown the superiority of GPA over such tests in predicting college graduation (Atkinson & Geiser, 2009). Beyond educational predictive power, some studies show that GPA predicts salary level and job performance; however, such studies refer to postsecondary GPA (e.g., Roth & Clarke, 1998). In both districts, letter grades were converted to grade points as follows: A = 4.0, B = 3.0, C = 2.0, D = 1.0, and F = 0.0. Only the course grades that counted toward the students’ academic requirement for each respective content area were included. In other words, course grades that counted towards an elective credit were not included. We were given Fall 2008 and Spring 2009 semester letter grades for each course taken by the students in the cohort. Fall and Spring GPAs were computed for the following four content areas: math, science, English, and social studies. In West District, courses last the entire school year. Final GPAs were calculated by averaging the fall and spring semester GPAs for each content area. A mean of the final GPAs was then computed to calculate a final academic GPA. Some students received a value of “RP,” which stands for “Repeated Grade,” or “NM,” which stands for “No Mark.” We were informed that “RP” is a placeholder for when a student repeats a course. In West District, students are allowed to repeat courses and the lowest grade received never become part of their transcripts. In our dataset, there were a total of 7 students (5 treatment and 2 control) with a total of 11 courses with a value of “NM,” and 13 students (12 treatment and 1 control) with a total of 13 courses with a value of “RP.” Because we do not have an actual grade for computing GPA, “NM” and “RP” were recoded to “missing.” Table 10 shows the academic GPAs for the treatment and control groups in West District. There was no significant difference in ninth-grade academic GPA between the groups; both had an average GPA of about a C+. As shown in Table 10, the average GPA for the treatment group was 2.64, whereas the control group’s academic GPA was 2.65, and the effect size was small.

57
Table 10 Academic GPA,1 2008-2009, West District
Treatment
(N = 1,957) Control
(N =509) Effect Size M(SD) M(SD) (Cohen’s d) Academic GPA 2.64(0.87) 2.65(0.86) -0.01
Note. Academic GPA based on math, science, English, and social studies course grades. An Analysis of Variance test was performed to compare mean differences. 1Coding grade of “RP” or “NM” as missing and averaging fall and spring grades. On Track for Graduation
Perhaps the most common way to gauge if students are on track for graduation is to count credits. After all, if a student is behind in credits at the end of the freshman year, he or she must take more credits the following year in order to catch up. This can be difficult for struggling students. Studies have shown that there are several other important indicators of ninth-grade performance that predict graduation (Allensworth & Easton, 2005; Hartman, Wilkins, Gregory, Gould, & D’Souza, 2011). Using different district datasets, both of these studies found that the number of credits earned and number of F grades in core ninth-grade academic courses strongly predicted high school graduation. One might expect prior achievement in the form of eighth-grade test scores to be included in an on-track indicator, but Allensworth and Easton (2005) noted that in their Chicago Public Schools data, “40% of the freshmen entering ninth grade in fall 2000 with low eighth-grade test scores (those in the bottom quarter of their class) were on-track at the end of their freshman year and 68 percent of these on-track students graduated four years later” (p. 7). We used the Chicago indicators for Table 11 to see who was and was not on track for graduation at the end of ninth grade. Table 11 On Track for Graduation, 2008-2009, West District
On Track for Graduation
Treatment (N = 1,907)
(%)
Control (N = 509)
(%)
Total (N = 2,416)
(%) West District
On track 92.9 91.7 92.6 Not on track 7.1 8.3 7.4
Note. “Not on track” for graduation was defined as being in ninth grade during the 2009-2010 school year, or being in 10th grade but having failed two or more courses in either semester or both semesters of 2008-2009. Comparisons were based on 2x2 cross tabulations and chi-square analyses. There was no statistically significant difference in the rate of being on track for graduation between the treatment and control groups. Over 91% of each group was found to be on track for graduation at the end of ninth grade. Although the number of control students remained the same from 2008-2009 to 2009-2010, there was some attrition in the treatment group. Table 11 cites 1,907 students in the treatment group in 2009-2010; the study began with 1,957 treatment students, a difference of 50. Systems data suggest that 47 of these students left the district—there

58
is no record of attendance, coursework, or 10th grade high stakes test scores for these students. The last 3 of these students are assumed to be attending alternative schools, according to West District. Honors Math and English In comparing honors coursetaking between the treatment and control groups, we chose to include only mathematics and English because not all of the core academic subjects are required in the ninth grade. Mathematics and English are also the most common state exams given, so we chose to focus on those two subjects. Because courses run for a year in West District, the spring course designations were used to code whether students were in honors courses or not. If students took honors math and honors English that spring, they were coded as taking both honors math and English. West District control students were significantly overrepresented in taking honors courses compared to treatment students (see Table 12). Forty-six percent of treatment students took honors math and English compared to almost 53% of control students. In addition, 53% of treatment students took honors math, significantly less than the 59% of control students doing so. Table 12 Honors Mathematics and English Coursetaking, 2008-2009, West District
Honors Courses Taken
Treatment (N = 1,957)
(%)
Control (N = 509)
(%) Honors Math and English
Yes 46.3 52.7* No 53.7 47.3
Honors Math Yes 53.0 59.1* No 47.0 40.9
Note. Comparisons were based on 2x2 cross tabulations and chi-square analyses. * p < .05. Focus on Mathematics Mathematics coursework was selected for closer analysis for several reasons. Participation and achievement in math are gateway indicators for positive post-high school outcomes such as postsecondary educational attainment and labor market success (National Research Council, 1989; U.S. Department of Education, 1997). In addition, the mathematics course sequence in high school is usually well-defined, making comparisons relatively straightforward. Math is often embedded in CTE coursework, making student achievement in math particularly relevant for POS. Some research has shown that completing the math sequence is correlated with choosing STEM majors in college (Chen, 2009) as well as with college graduation and employment incomes (National Mathematics Advisory Panel, 2008). The earlier students begin the math sequence, the more time they have to complete it. Studies show the percentage of eighth-grade students taking Algebra I increasing. This percentage was 29% in 2004 (Perie, Moran, & Lutkus, 2005) and rose
59
to 39% in 2007 (Walston & McCarroll, 2010). But there are differences in characteristics between eighth-grade students who take algebra and those who do not. Eighth-grade algebra enrollment was more common for Asian students, students not living in poverty, students whose mothers had a bachelor’s degree or higher, students living in two-parent homes, private school students, and students with high prior mathematics achievement scores (Walston & McCarroll, 2010). However, many students who scored in the top two quintiles of mathematics performance in fifth grade3
had not moved on to an algebra course by the eighth grade—predominantly male students and Black students.
In this study, we have several measures of math coursetaking and algebra coursetaking, specifically. We do not have student records from their eighth-grade years, but we can deduce that students have taken Algebra I already if they take geometry or higher in the ninth grade—the first year of high school and the first year for which we have data. Forty-seven percent of the West District sample and 39% of the East District sample were taking geometry or higher in ninth grade, which is the same or higher than the 2007 national average previously noted. In both districts, the policy regarding taking algebra could be described as expecting but not requiring students to take algebra by the end of ninth grade. Math Levels Mathematics coursetaking data were used to compare the treatment and control groups on the level of math courses taken. Despite the relatively lockstep manner in which the math sequence is intended to be taken in most schools, the reality is much more complex. We found this to be the case especially for algebra. Many ninth-grade students are expected to be in algebra but are not ready for it. Extended versions of algebra have become a popular way for districts to cite a large percentage of ninth graders taking algebra—albeit an algebra course that is twice as long as a regular algebra course. West District also had an enhanced algebra option with a required co-course to help students master key concepts. Even with these options, our dataset was full of students taking non-intuitive sequences or courses not in the course registration guides, which required us to contact the district or school for clarification. A six-level variable was formed as follows:
1. Special education math: Specifically noted as not being in the standard course of study. 2. Basic math: All courses below Algebra I, such as Consumer Math or Introduction to
Math. 3. Enhanced Algebra I: A co-course is required with Algebra I for extra instruction. This
occurred only in West District. 4. Extended Algebra I: Extended sequences that span algebra over two years in West
District or two semesters in East District. 5. Algebra I: Regular or Honors Algebra I. 6. Above Algebra I: Geometry, Algebra II, Pre-calculus, Calculus, Advanced Functions and
Modeling.
3 Scores are from the mathematics battery given to 3,750 students in the Early Childhood Longitudinal Study, Kindergarten Class of 1998-1999 (ECLS-K) when they were in fifth grade.

60
A chi-square analysis was performed on the 6-level variable yielding a statistically significant relationship. Further analyses were run to determine where the differences occurred. These analyses are presented below. In West District, courses are taken over two semesters. In our ninth grade data set, it was not uncommon for a student to switch from one level of math to another from fall to spring or to take only one semester of a course. Because of the difficulty this presented in determining a student’s overall math level for ninth grade, we decided to show the math levels for each semester. Table 13 shows the results: In both the fall and spring semesters, statistically significantly more control students took an “enhanced” Algebra I course than did treatment students (5.7% vs. 1.7% in the fall and 6.5% to 1.6% in the spring). However, in the spring semester, statistically significantly fewer control students than treatment students took the first part of the “extended” Algebra I sequence (1.0% vs. 3.0%). The differences in coursetaking between Algebra I and above Algebra I were not statistically significant, nor were those for special education math courses. Table 13 Levels of Math Courses Taken by Semester, 2008-2009, West District Fall 2008 Spring 2009
Math Courses Taken
Treatment (N = 1,954)
(%)
Control (N = 507)
(%)
Treatment (N = 1,940)
(%)
Control (N = 504)
(%) Special Education Math 0.5 0.6 0.6 0.4 Below Algebra I 0.0 0.0 0.0 0.0 Enhanced Algebra I 1.7 5.7*** 1.6 6.5*** Extended Algebra I 2.8 1.4 2.9 1.0* Algebra I 46.9 47.9 46.6 47.2 Above Algebra I 48.2 44.4 48.2 44.8 Note. Comparisons were based on 2x2 cross tabulations and chi-square analyses. * p < .05, *** p < .001. Of the students who had not taken Algebra I by the beginning of ninth grade, about 99% of them in both groups were taking some kind of Algebra I course each semester, whether it was enhanced, extended, or regular Algebra I (see Table 14). Table 14 Students Taking Any Type of Algebra I Course by Semester, 2008-2009, West District Fall 2008 Spring 2009
Treatment (N = 1,013)
(%)
Control (N = 282)
(%)
Treatment (N = 1,005)
(%)
Control (N = 278)
(%) Took 99.1 98.9 98.9 99.3 Did Not Take 0.9 1.1 1.1 0.7 Note. Excludes students who had already passed Algebra I. Comparisons were based on 2x2 cross tabulation and chi-square analysis.

61
Success in Mathematics Coursework We have established that most students were taking some type of algebra, but taking the class is one thing; passing it is another. We next look at the results of this ninth-grade math coursetaking by examining the pass rates for our treatment and control groups, combining all types of algebra for this analysis. If students passed regular (or Honors) Algebra I, we coded them as having passed Algebra I. If students took the first part of extended Algebra I (regardless of passing), then they have one more year of it left at the end of ninth grade, so we coded them as “incomplete” for Algebra I. If students passed the second part of extended Algebra I, then we coded them as having passed Algebra I. If students failed regular (or Honors) Algebra I or the second part of the extended Algebra I, then we coded them as “failed” Algebra I. If students only took one semester of Algebra I, we coded them also as “incomplete” for Algebra I. As shown in Table 15, there was no statistically significant difference in the pass rate among students who took any type of Algebra I course—about 78% for both groups. Significantly more treatment students, however, did not complete their algebra course. Table 15 Percent Students Passing Any Algebra I, 2008-2009, West District
Treatment (N = 1006)
%
Control (N = 283)
% Passed 78.1 78.1 Failed 15.7 19.4 Incomplete 6.2* 2.5 Note. Comparisons were based on 2x2 cross tabulations and chi square analysis of dichotomized variables for each level. * p < .05. Chi-square analysis on a 2x3 cross tabulation of coursetaking above Algebra I yielded statistically significant relationships. To parcel out exactly where the differences occurred, dichotomous variables were created for each level of passing, failing, or having an incomplete for coursetaking above Algebra I. Of those students who took a math course above Algebra I both semesters of their ninth-grade year, a significant difference was found in the pass rate: Treatment students were significantly more likely to pass both semesters of the course than were control students (95% vs. 90%, respectively, see Table 16). Treatment students were also significantly less likely to fail than control students (5% vs. 9%).

62
Table 16 Percent Students Passing Math Courses Above Algebra I, 2008-2009, West District
Treatment (N = 942)
%
Control (N = 226)
% Passed 94.7* 90.3 Failed 4.6** 9.3 Incomplete 0.7 0.4 Note. Comparisons were based on 2x2 cross tabulations and chi square analysis of dichotomized variables for each level. * p < .05. ** p <.01. Student Engagement: Ninth-Grade Attendance As a measure of student engagement, we examined ninth-grade attendance rates for both groups. Table 17 shows no significant differences between treatment and control for West District; both groups had a high attendance rate of 96.6% for ninth grade. Table 17 Ninth Grade Attendance Rates, 2008-2009, West District
Attendance
Treatment (N = 1,612) M(SD)
Control (N = 297) M(SD)
West District Ninth-Grade Attendance 96.6%(0.05) 96.6%(0.06)
Note. *** p < .001. Student Survey Results West District used SurveyMonkey to administer the online survey to our student cohort during the spring of the students’ ninth-grade year (Spring 2009). West District purchased its own subscription to the service, set up the survey, and collected and shared their final data. Postcards with a “password” (the students’ district-assigned dummy ID number) were distributed to all students in the sample. The survey was left open for a period of weeks to allow students enough time to take it or for teachers to give students time in a computer lab if they had limited or no computer access at home. Due to administrative issues at the school level in one of our POS high schools (Navy), students were not able to take the survey until the fall of 2010 (their 10th-grade year). Because of the risk of response bias due to maturation effects, their data are not included in our analyses of West student survey responses. Students’ dummy ID numbers (their passwords) allowed us to link survey data to district data. The following section describes survey results for West District; additional details on characteristics of the respondents are found in Appendix B.

63
Response Rates In West District, the survey was taken in the spring semester of the students’ ninth-grade year, with the exception of Navy students, who are not included here. Table 18 presents the response rates for this district. Although fewer than half of the treatment students took the survey in the spring of 2010, significantly more treatment students responded to the survey than control students. Table 18 Student Survey Response Rates by Treatment Status, West District Treatment Control Total (N = 1,957) (N = 509) (N = 2,466) Response (%) (%) (%) Took Survey 45.8*** 33.8 43.3 Did Not Take Survey 54.2 66.2 56.7 Note. *** p < .001. Table 18 shows that fewer treatment students took the survey than did not, but it must be remembered that Navy students are counted as non-respondents. In actuality, the response rates at Sky and Azure were high: 89% and 95%, respectively. Only the absence of Navy students prevented us from achieving an overall high response rate among treatment schools. We expected to have a high response rate from treatment schools because the participating principals were more aware of the study than were control school principals. Further, because entire grade levels (i.e., our ninth-grade cohort) were eligible to participate in treatment schools, it is more likely that time in the school day was devoted to completing the survey at our treatment schools. In contrast, only 34% of control group students took the survey. We attribute this low response rate in part to the fact that our control students are spread across many high schools in the district. West District personnel helped disseminate information about the study and the survey to these schools’ principals and helped inform control students about their opportunity to participate in the survey. Ultimately, however, it proved challenging to motivate principals to follow up with what were isolated clusters of students in their schools. In addition, we speculate that many students who received our invitations lacked the motivation to participate. We were unable to incentivize survey participation due to a lack of funds. Among those students who took the survey in West District, Table 19 shows that significantly more male students from the treatment group took the survey, whereas significantly more female students from the control group took the survey. Significantly more Latino and LEP treatment students took the survey than did their counterparts in the control group.

64
Table 19 Characteristics of Respondents to Student Survey, West District Treatment Control Characteristics (N = 896)
(%) (N = 172)
(%) Demographic Characteristics Gender
Male 47.5 23.8*** Female 52.5 76.2
Race/Ethnicity Black 9.8 7.6 White 34.6 41.3 Latino 37.2 27.3* Asian 17.6 23.3
Receives free lunch (FRL) 29.2 25.0 Limited English Proficient (LEP) 2.3 0.0* Has Individual Education Plan (IEP) 3.9 5.2 (N = 862)
Mean (N = 167)
Mean 8th-Grade Reading Scale Score 343.82 347.62 8th-Grade Math Scale Score 368.45 371.37 Note. * p < .05, *** p < .001. The Student Experience at the Treatment and Control Schools The survey asked students about various aspects of their high school experience that are related to the kinds of preparation that POS should provide. In this section, we highlight those responses that show a significant difference between the treatment and control groups in the areas of (a) identifying job or career interests and (b) describing respondents’ teachers and coursework during their ninth-grade years. In the tables below, we have combined the responses agree and strongly agree (their other options were disagree and strongly disagree) as well as sometimes and often (their other options were rarely and never) in order to dichotomize the variables and more easily reflect differences between the groups. Table 20 shows two areas in which treatment students reported significantly more activity than control students with respect to researching their post-high school options. There were no differences in students’ experiences visiting local businesses through a school trip.

65
Table 20 Student Survey Responses, Identifying Job or Career Interests, West District Treatment Control (N = 891) (N = 172) Survey Items (%) (%) Researched different jobs or careers 91.8 86.6* Researched different colleges, universities, military branches, or
technical/community colleges 79.6 67.4***
Toured a local business with a group from my school 11.7 10.5 Note. * p < .05, *** p < .001. In Table 21, we see that treatment students were significantly less likely than control students to think that their teachers made their subject matter interesting and useful. Two thirds of treatment students agreed with this statement compared to more than three quarters of respondents at the control schools. There are many control schools in the sample, so it is difficult to pinpoint a reason for this result. Table 21 Student Survey Responses, High School Teachers, West District Treatment Control (N = 885) (N = 172) Survey Items (%) (%) Most of my teachers make the subject matter interesting and useful. 66.8 78.5** Most of my teachers have encouraged students to help each other. 70.0 73.2 Note. ** p < .01. Table 22 reports on student attitudes about the courses they were taking in ninth grade. Control students reported significantly more repeated content in their classes, but they also reported working hard to do their best work and meet high standards significantly more often than did treatment students. There was no significant difference in the amount of time reported spent on homework. In the previous section on ninth-grade outcomes, we saw that the academic press in West District is strong—it should not surprise us that control students are working as hard if not harder than treatment students. Table 22 Student Survey Responses, High School Courses, West District Treatment Control (N = 885) (N = 172) Survey Items (%) (%) My courses have repeated content that I had already learned. 74.8 83.8* I have tried to do my best work in school. 91.4 96.6* I have worked hard to meet high standards on assignments. 89.5 95.4* I spend a great deal of time on homework. 74.5 79.1 Note. * p < .05.

66
The survey results are consistent with what we know of West District through our observations and the results described earlier in this report: Students appear to be hard-working and challenged in their coursework at both the treatment and the control schools. The next section focuses on students’ college and career planning experiences and the kinds of people to whom they turn when seeking college and career information and advice. The Role of the Counselor in College and Career Planning
One section of the survey elicited student responses about the types of college and career planning they had done during the ninth grade, with whom they had done this planning, and who had given them the best advice. The first question asked, “Between the start of ninth grade and now, who have you talked to about the following topics?” The topics listed on the survey were:
• What courses to take this school year • Going to college • Possible jobs or careers when you are an adult • Things you’ve studied in class • Your grades • Finding a job after high school • Steps necessary to pursue your career • Applying to college or vocational/technical school
Students could choose from among several people they might have spoken with: parents, teachers, school counselors, or no one. Table 23 displays West District student responses for the set of questions about college and career planning. Perhaps the most important finding derived from Table 23 is the general conclusion that most students were talking with someone about these issues that are crucial to college and career planning. For most students, that person was overwhelmingly a parent. This was true especially for the control group students, who reported speaking to their parents about future jobs or careers and the steps necessary for careers significantly more than did treatment students. Table 23 Student Survey Responses, College and Career Planning, West District Treatment Control Total (N = 891) (N = 172) (N = 1,063) Survey Items (%) (%) (%) Talked with following about: What courses to take this year
Parent 75.8 75.6 75.7 Teacher 40.9 43.0 41.2 School Counselor 53.0 51.2 52.7 Have not discussed 9.8 8.1 9.5
Going to college Parent 85.4 88.4 85.9 Teacher 30.3 27.9 29.9

67
School Counselor 24.2 18.6 23.3 Have not discussed 11.6 8.1 11.0
Possible future jobs/careers Parent 85.9* 91.9 86.8 Teacher 28.8 29.7 29.0 School Counselor 16.3 11.6 15.5 Have not discussed 10.3 5.8 9.6
Things studied in class Parent 65.1 68.6 65.7 Teacher 55.2 51.7 54.7 School Counselor 10.1 7.0 9.6 Have not discussed 14.0 13.4 13.9
Grades Parent 87.3 85.5 87.0 Teacher 64.1 62.2 63.8 School Counselor 35.6* 26.7 34.1 Have not discussed 5.8 7.0 6.0
Finding a job after HS Parent 75.8 77.3 76.0 Teacher 14.5 12.2 14.1 School Counselor 7.0 7.6 7.1 Have not discussed 22.7 21.5 22.5
Steps necessary for career Parent 64.3** 75.0 66.0 Teacher 31.9 27.9 31.2 School Counselor 24.1 18.6 23.2 Have not discussed 23.9* 15.1 22.5
Applying for postsecondary Parent 67.2 61.0 66.2 Teacher 27.4* 19.2 26.1 School Counselor 21.9* 13.4 20.5 Have not discussed 25.9* 33.7 27.2
Note. * p < .05, ** p < .01. One important exception was the topic of applying to postsecondary institutions. Significantly more control students reported not having spoken with anyone about this topic during ninth grade. We assume that the POS experience helped the treatment students have such conversations earlier in their high school experiences; indeed, more treatment students reported having spoken with both teachers and counselors about their postsecondary plans. The role of the guidance counselor in West District appears to consist more of registering students for courses and assisting in college planning rather than serving as a source for job information or connections. Counselors were the least consulted persons regarding subjects studied in school and finding a job after high school. At the treatment schools, significantly more students reported speaking with their counselors about their grades and applying to postsecondary institutions than did control students. Our observations corroborate that POS teachers are expected to provide more career counseling than are counselors; career centers located in some district high schools are another source of career counseling or job placement.

68
Student Survey Summary Results from the survey suggest that West District treatment respondents spent significantly more time researching what they would do after high school and talking to adults about their options than did control respondents. There were significant differences favoring the control group on responses about the amount and quality of work they do for their classes, but both groups had a preponderance of students working hard on school assignments.
Results: East District
Site Description: Treatment School Selected characteristics of East District, such as population and employment data, are found in Table 1 in the Sample section. Like many urban school districts, East District has developed multiple magnet programs across grade spans. At the high school level, a number of schools (or programs within schools) offer a range of magnets available to students through a lottery process. Applicants must demonstrate successful completion of core competency standards in reading, math, and computers. We identified Blue Academy as a potential candidate for inclusion in the study because of its integrated technology academy structure and strong, well-articulated POS. Further, Blue is located in a state with statewide secondary-postsecondary articulation agreements, providing students with a seamless transition and the opportunity to earn college credit applicable to an associate degree or postsecondary certificate program. There are also local articulation agreements between the district and the one community college in this county. Blue was poised to be another experimental school for the study, but after submitting an application to conduct research in the district, we learned that there had been no lottery in 2008 when the target cohort of ninth graders applied. The district had increased the number of students allowed to enroll in the school; with no oversubscription, no lottery was necessary. Our negotiations with the district instead turned to designing a quasi-experimental study and the details of selecting a well-matched comparison group. We sought to retain East District because of the excellent POS we found at Blue that provided advanced technological training to highly engaged students. In the next section, we describe Blue Academy, its CTE programs and classes observed during site visits in 2009 and 2010, and the ways in which the mandated and supporting components of POS appear there. We then describe our comparison schools, which were part of our site visits. Treatment School: Blue Academy
Blue Academy is a state-of-the-art high school featuring nine pathways in three integrated technology academies combining rigorous academics with POS in engineering, medical sciences and biotechnology, and information technology (IT). Some programs in the engineering and IT academies are affiliated with NAF. Blue’s 1,081 students reflect the racial and socioeconomic composition of the district; the school is predominantly Black, and a large proportion of its students qualify for free and reduced-price lunch. Additional demographic details are contained in Table 24.

69
Table 24 2008-2009 Demographic Characteristics of East District POS School Blue District
Characteristics (N = 1,081)
(%)
(%) Demographic Characteristics Gender
Male 51.6 50.01 Female 48.4 50.0
Race/Ethnicity Black 77.2 41.8 White 9.2 33.7 Latino 8.0 15.5 Asian 0.0 4.7
Receives free lunch (FRL) 64.6 50.4 Limited English Proficient (LEP) 4.1 13.52 Has Individual Education Plan (IEP) 7.0 10.92 Graduation Rate for Class of 2009 87.7 69.9 Note. Unless otherwise noted, the demographic data were taken from school or district-level reports found on the district website or from archived reports provided by the district. The total district population was not provided in order to mask the district’s identity.1 Based on data obtained from the state report card website for 2008-2009. 2 Source: U.S. Department of Education Common Core Data for 2008-2009, http://nces.ed.gov/ccd. Two principals have been at Blue since the beginning of the study. With a background in elementary education and educational leadership, not CTE, the first principal was recruited as a changemaker. His leadership team and the academy directors established the school’s mission, solidified its academy concept and POS, and instituted its academy-specific guidance counselors. After achieving promising student achievement results within just a few years, this principal moved on to a leadership position outside the district. The new principal, who also has a non-CTE background, has committed to build upon his predecessor’s progress and programs. Blue’s structure is marked by strong top-down leadership that is diffused across its three academy directors, who undertake such tasks as ensuring that their curriculum is up-to-date and that teachers have the resources they need. The goal of the principal and his leadership team is to provide firm, fair, and consistent leadership, a core vision for the school, modeling and re-assessment of that vision, trust and collaboration among faculty and staff, and a safe, nurturing, challenging environment for students. Blue has identified a number of action- and growth-oriented goals and principles around which it organizes and assesses its many activities. These are related to accountability (constant and more frequent progress tracking in all areas of school functioning) particularly as connected to student performance (student engagement, rigorous entrance criteria, performance on assessments, college-going) and teacher performance (PLCs), collaboration and collegiality, good hiring practices); school safety (high staff/adult visibility around the school); school culture (creating an omnipresent and inspiring culture of excellence, pride, and nurturing); student opportunities

70
(additional ways of learning and preparing for college and career); and school-parent relationships (communication and participation). Impact of the budget crisis at Blue and in East District. The economic problems plaguing the state and district have had their most devastating impact on the ability of students to earn postsecondary credits and take courses at the local community college; such options have been drastically curtailed. Due to cuts in some counseling and support positions, some Blue staff have had to take on additional responsibilities. Cutbacks have also compelled the school to offer more broad-based, introductory courses that enroll greater numbers of students, and fewer small, specialized courses serving more limited numbers of students. Changes in the district’s busing plan have also created some changes in the student body; the school has had to adjust its morning and afternoon schedules to adjust to more carpoolers. Despite these cuts and adjustments, Blue remains well supported by the district. At the comprehensive high schools, the state and district budget crisis have badly affected elective funding (including CTE) and staffing levels. For this reason, students at these other schools may be placed in CTE courses or other electives not of their own choosing; this affects programs’ technical skills assessment scores. Worse still, as of our Fall 2010 visit, some fine CTE programs at the comprehensives had been shuttered, and other schools faced the possibility of closure. Blue’s core CTE mission and scores on the state technical skills assessments have helped preserve programs there. CTE classes observed at Blue. Program sequences at Blue begin in the ninth grade with introductory coursework and a mandatory computer class and progress to more advanced coursework in the remaining three years. During our Fall 2009 site visit, we observed 10th-grade classes like Programming II, Computer Engineering II, Medical Sciences I, and Drafting I. Programming II featured a review of programming subprocedures in preparation for an exam; students worked through a number of computer-based Visual Basic programming exercises; one was a module that asked users to select toppings for hot dogs, another was a random number generator, and the last was a shell game. Computer Engineering II class covered network issues in two primary activities. The first was a hands-on activity in which students created a patch cable (using ANSI [American National Standards Institute] color code standards) with an RJ45 connector (broadband cable) and tested it with a cable testing box. The second activity involved testing a local area network (LAN) network connection using the class-made cable and ping commands. Medical Sciences I was reviewing for upcoming midterm exams; the class consisted of a standard but engaging review of topics. At the end of class, they played a Jeopardy-like game in which the student host, sitting at a laptop in front of the class, chose from the exam topics for student teams to work on: Integumentary Systems, Skeletal Systems, Terminology, and Muscular Systems. Drafting I, a required course for several of the programs in the academy of engineering, is equal parts mechanical drawing on drafting tables and computer-aided design. During the observed class, the teacher described and demonstrated how to lay out simple three-dimensional objects, lining up the separate views according to industry norms. Students followed along on a Moodle-hosted PowerPoint, then worked on drawing some shapes on a worksheet.

71
During our Fall 2010 site visit, we saw a range of 11th-grade and upper division classes like PLTW Civil Engineering and Architecture (CEA), Automotive Service Technician III, PLTW Biotechnical Engineering, Web Design, and Honors eCommerce II. In the CEA class, the teacher sat among the students, using a laptop to show a PLTW PowerPoint. The topics for the day were foundation systems and how to estimate the costs of the concrete and rebar required for building foundations. Students were also working on a long-term project designing an affordable house. After the lecture on foundations, students were to either complete a worksheet on residential concrete estimation or work on their project. The Automotive Service Tech III class, which meets as a double block, covered electrical and electronics systems, beginning by reading an Ohm meter hooked up to a truck. The teacher, an industry retiree, impressed upon the students the importance of mastering electronics given modern automotive systems; however, many students seemed disengaged during this lesson. In the PLTW Biotechnical Engineering class, the topic of the day was forensic fingerprinting: Students were assigned a quick exercise in which they went online and researched key facts about fingerprinting while the teacher assigned pairs of students to fingerprint each other and leave their thumbprints on glass slides that they later would have to dust, analyze, and match with the inked samples. After a lively review of the information they had researched, the students jumped straight into hands-on crime lab activities, identifying potential “suspects” based on their slides. The observed Web Design class was the students’ first introduction to the topic—this class had spent the first nine weeks of the year on digital video production. The teacher asked students to log into their Moodle accounts and respond to a series of statements about web design and content; the teacher then got into the chat and reacted to their responses. This chat session then turned into a “live” discussion. The lesson also covered effective presentations and an introductory video about Prezi, the cloud-based presentation system. One class deserves extended comment: Honors eCommerce II provided excellent examples of both technology use and curriculum integration. In the class observed, the teacher used web-based communication tools to link the day’s primary technical topic—web forms like radio buttons and check boxes—to the subject of the recent elections and the structure of the legislative branch of government. She also brought in a career exploration element by using Skype and a digital video camera to contact a journalist at a well-known DC-based political newspaper; this journalist talked about her work and answered students’ questions about the field. Then the teacher shifted over to the computers, where students voted for their local and state candidates on a kids’ voting website. It was during this activity that she connected politics to the principles of web design in order to make points about the programming choices one would make to allow someone to vote online or electronically. A recurrent theme across observed classes was the intelligent use of integrated technology and equipment in instruction. In Algebra II classes we observed at Blue and across our comparison schools, teachers made use of digital projectors, Smart Boards , graphing calculators, and related software to drive instruction and increase student interest. In classes we observed, students talked about web design issues using the school’s Moodle site, interacted with a journalist in a different state using Skype and a digital video camera, programmed games using Visual Basic, responded to an online, teacher-created survey about their preparedness for an upcoming unit, assembled broadband cables and tested networks, and dusted for fingerprints in a simulated crime lab.

72
POS Results: Treatment School In the sections that follow, we describe our observations of the four mandated components of POS, as contained in the Perkins IV legislation, as we observed them at Blue. Mandated Components of POS 1. Incorporate and align secondary and postsecondary education elements. Curriculum alignment with postsecondary is a priority at Blue; in some programs, once-a-month alignment meetings are held in which teachers across the district review curriculum and pacing guides. Some meetings are held at the local community college and led by a community college instructor. The community college has also helped secondary teachers with their techniques: The community college IT chair we spoke with described the work he has done on the steering committee for the secondary and postsecondary IT standards, assessments, and curriculum that must be retooled constantly in alignment with industry demands. 2. Include academic and CTE content in a coordinated, non-duplicative progression of courses. Coursetaking at Blue follows a career clusters-oriented POS model—that is, a progression of courses beginning with a foundational, introductory course and leading to more intensive coursework in sophomore and junior year with a culminating experience in senior year. Students are also encouraged to take AP courses related to their academy. Students are required to complete their course sequences within their academies; once complete, they are encouraged to take related courses either within their academy or outside it. With the budget situation constraining the total number of courses the school can offer, it is becoming more difficult to fill students’ schedules. One academy chair noted that the shortage of courses means that more resources are being dedicated to introductory, broad-based courses with larger enrollments instead of the upper-level, highly specialized courses that serve fewer students. 3. Offer the opportunity, where appropriate, for secondary students to acquire postsecondary credits. District-wide, high schools offer students a number of opportunities to earn postsecondary credits, including articulated credit, AP, IB, concurrent enrollment at the local community college for classes not taught at the high school, virtual high school, and online university and community college courses. A highlight of our scouting visit to Blue in 2008 was the school’s concurrent enrollment program, which allowed students to take classes at the local college with funding, transportation, and material support. In 2009 and 2010, however, funding for this and similar postsecondary credit-earning programs had been largely withdrawn. In its place, students have been encouraged to take online courses—both virtual high school and online postsecondary courses. However, multiple interviewees expressed concern that students were not performing well in these courses, which lack the discipline and support structures present in real classrooms. As of our 2010 visit, an academy coordinator noted that just 18 students had registered for college courses—mostly online—in such areas as business, engineering, IT, and criminal justice. Only two or three were participating in early release. 4. Lead to an industry-recognized credential or certificate at the postsecondary level, or an associate or baccalaureate degree. All Blue programs lead to either an industry-recognized

73
credential at the postsecondary level or an associate or baccalaureate degree program. Given the advanced nature of some of Blue’s programs, industry certifications that are often earned in postsecondary educational institutions can be earned while students are still in high school. Blue also offers a range of certificates through its nationally credentialed programs. The NAF engineering academy has NATEF accreditation in automotive, NCCER accreditation in construction, and a PLTW program. The NAF-accredited IT academy offers CISCO and Oracle certifications. CompTIA A+ certification is available, in addition to an AP computer science class. Blue formerly offered a Microsoft certification. The medical academy guidance counselor noted that it was far more difficult for students to acquire their CNA certifications; the district stopped paying for the tests although the program continues to prepare students for certification. Supporting Components of POS Legislation and policies. The state graduation requirements for students in our cohort provide three content options: a college preparatory curriculum, a CTE focus, or a combination, “dual concentrator” option. Because students can change their option, it is possible to approach graduation lacking the credits needed to graduate under the more rigorous options and switch to a less onerous one. Blue students may not change, however, because they are in a CTE-based magnet with higher graduation requirements. Struggling students may opt to return to their home high school and are required to do so if they fail their core CTE courses. New state graduation requirements have been instituted since our study began. These mandate that all students take a college preparatory academic core and some sort of sequence (e.g., CTE, focused academics, JROTC). Students are introduced to career clusters before high school. These new requirements have opened up traditional CTE course sequences so that students take an introductory course and then may take related courses that broaden their experience. In this state, all courses taught at the high school must be approved at the state level; all courses taught at the community college must also receive state-level approval. State law has mandated that high school and postsecondary education institutions articulate courses and specified what some of those courses shall be. All postsecondary CTE programs are audited, not only to see if they are meeting requirements, but also to determine whether they are placing people in jobs. Partnerships. Postsecondary and business and industry partners provide vital support in Blue’s efforts to increase student engagement and preparation. Academy directors and faculty, many of whom come from industry, bring in guest speakers and familiarize students with the kinds of postsecondary programs and careers they may encounter after graduation. The school’s partnership with NAF (for the school’s engineering and IT academies) and advisory groups composed of postsecondary and business and industry representatives also bring resources. Before public and private funding shrank, there was a much stronger partnership between departments at Blue and the local community college. At its height, college instructors taught classes at Blue as well as taught Blue teachers so they could get certified to teach product-based courses (i.e., CompTIA A+). College counselors visited Blue to speak with both students and teachers about how to get into their programs and to give placement exams. The college also hosted a volunteer organization of businesspeople who taught after-school courses. The current
74
budget shortfall has curtailed much of this activity, however, as the college focuses on its own recession-driven enrollment increase. The partnership between the college and Blue had some downsides for the college. For instance, conflicts between high school and college schedules created difficulties for college instructors. Many Blue students who benefitted from taking classes at and receiving credit from the college later bypassed it when they graduated. These students were drawn to larger and out-of-state institutions that offered them scholarships. Overall, according to one academy coordinator interviewed in 2010, the budget crisis has not affected the quality of the relationships with Blue’s business and industry and community partners; they are now “more committed” to enhancing Blue’s programs and offerings. Professional development. During our 2010 visit, we saw that professional development in a POS is not just about “how to implement a POS,” as Blue’s programs preceded Perkins IV. Professional development assists both academic and CTE teachers schoolwide with topics like how to improve students’ technical literacy. Related to POS, with the implementation of the state’s new career clusters, Blue’s department chairs participated in a district meeting and then returned to the school to disseminate information to teachers and counselors. Accountability and evaluation systems. Assessment and accountability are valued at Blue; the school’s test results are advertised all over the school on posters titled, “The Data.” The school’s leadership is committed to moving all students to high scores on the state exams and has sought to increase academic and technical rigor and challenge so that all students emerging from Blue’s programs will be prepared to succeed without remediation. Teachers are expected to use data to improve their teaching and student performance. College and career readiness standards. Blue sets high expectations of students and provides them with the extra resources to meet them. Teachers are paid extra to stay after school and on Saturdays to provide tutoring in various subject areas. Soft skills are imparted to students at Blue through the school’s cultural practices that are modeled by faculty and administrators. All students are expected to move on to some form of college after graduating. Course sequences. The courses that make up POS are approved at the state level. Local educators are permitted and encouraged to develop new courses that then go through an approval process in order to be taught statewide. This approach aligns well with the statewide articulation agreements in place between secondary and postsecondary. But the process has its downside: One teacher has been involved in biotechnology curriculum development, but the process takes so long that the curriculum could be out of date by the time it is approved. Credit transfer agreements. A state-level articulation agreement exists between the community colleges and high schools, laying out principles for forming faculty committees to review courses and a process by which to award credit. The state articulation agreement is flexible: The agreement allows a college to accept some subset of articulated courses depending on the offerings at the local schools and the work of the curriculum alignment committees.
75
In this district, over 20 high school CTE courses may potentially offset about the same number of community college courses. In many cases, two high school courses in a sequence are the equivalent of an introductory course at the college. If a student gets a B and passes the technical skill assessment at 80% or better, then a notation is made on his or her high school transcript that they are eligible for college credit. In order to receive the credit, a student must attend the community college within two years of graduation and present a transcript showing the eligible postsecondary credit. In some cases, credit will only be awarded after the student presents a portfolio or takes an examination. This is not automatic granting of college credit, and it appears that many credits are never obtained because students forget that they have them, or they enroll at the college in a transfer program, in which case the CTE credits are moot. Guidance counseling and academic advisement. The state requires a percentage of all CTE curriculum content to be dedicated to career guidance. As such, career guidance happens largely in program classrooms. Many of the POS teachers come from industry, which is helpful in guiding students through career and educational choices. Blue’s dedicated academy counselors, unique to the school, provide additional support. Before the recession, all district high schools had career coordinators; now, some schools share a coordinator. These coordinators serve as liaisons between the district CTE office and CTE programs in schools and handle such duties as providing students with career exploration activities, arranging guest speakers and student internships, managing the technical skill assessment system onsite, coordinating dual enrollment and tech prep opportunities, ordering textbooks, and administering CTE student surveys. Blue no longer has a career specialist; the academy directors and guidance counselors share these tasks. Teaching and learning strategies. Curriculum integration occurs in all state CTE programs in the sense that the state mandated that relevant academic skills be embedded in programs; they are in fact part of the state’s technical assessment system. Specific integration techniques (i.e., team teaching, joint lesson development) were not mandated and are in fact rare, according to one district administrator. However, due to the adoption of PLCs at Blue, more work across disciplines is happening there. Curriculum integration also happens at the single-classroom level, with individual teachers creating their own integrated lessons (e.g., the eCommerce II class). Project-based learning is a component of the IT academy’s curriculum; postsecondary and business and industry partners have been strong supporters of this work. CTSOs also play a large part in the learning that takes place at Blue. Students compete in local and state competitions and have gone on to the national level in several academy areas. Technical skills assessments. The state requires CTE programs to assess technical skills using curriculum-based assessments that test student knowledge. The state expects CTE teachers to embed the relevant academic skills in their teaching and assess the more hands-on aspects in each program area. The state designed the assessments so that students who have not mastered the relevant academic skills or cannot accomplish the hands-on skills are unlikely to do well on the multiple choice technical assessment exams. Site Descriptions: Comparison Schools

76
The four comparison schools chosen by the district through a cluster analysis (see East District Comparison Group Identification, above)—Emerald, Heliotrope, Indigo, and Neon—are four strong high schools that are very different from one another. We want our comparison schools to be good schools so that if achievement outcomes and other measures are better at Blue, that would be strong support for the rigor of POS. In the following sections, we describe each of the four comparison schools visited in 2009 and 2010, including basic student demographics, unique characteristics of their CTE programs, and the CTE classes we observed. We conclude by describing those mandated and supporting components of POS that we were able to identify in these schools. As non-implementers of POS—most comprehensive high schools in East District have only limited familiarity with POS—these schools should not be expected to show evidence of POS. However, East District has a commitment to the POS model and plans to implement it in the comprehensives. Comparison School: Emerald High School Emerald High School is a 60-year-old facility serving the immediate suburbs of this urban district. Emerald has an IB magnet program as part of the district’s efforts to ensure diverse student populations. Emerald’s 2,005 students are ethnically diverse; as Emerald’s principal stated, the student body closely resembles the overall demographics of East District. Table 25 provides background data for the four comparison schools. Table 25 2008-2009 Demographic Characteristics of East District Comparison Schools Emerald Heliotrope Indigo Neon* District
Characteristics (N=2,005)
(%) (N=1,104)
(%) (N=2,479)
(%) (N=1,121)
(%)
(%) Demographic Characteristics Gender
Male 48.0 40.5 48.0 68.3 50.01 Female 52.0 59.5 52.0 31.7 50.0
Race/Ethnicity Black 48.5 89.0 58.5 52.5 41.8 White 27.3 2.6 16.5 37.1 33.7 Latino 14.9 2.3 18.6 5.2 15.5 Asian 2.7 4.2 3.3 1.2 4.7
Receives free lunch (FRL) 50.8 55.3 56.7 40.1 50.4 Limited English Proficient (LEP) 12.4 1.7 14.5 2.4 13.52 Has Individual Education Plan (IEP) 9.7 5.4 10.9 9.8 10.92 Graduation Rate for Class of 2009 72.8 88.9 72.0 88.1 69.9 Note. Unless otherwise noted, the demographic data were taken from school or district-level reports found on the district website or from archived reports provided by the district. The total district population was not provided in order to mask the district’s identity. 1 Based on data obtained from the state report card website for 2008-2009. 2 Source: U.S. Department of Education Common Core of Data website for 2008-2009, http://nces.ed.gov/ccd. *Neon has 667 high school students and 454 middle school students.

77
The principal described Emerald as being family-oriented and having low teacher turnover. The school’s alumni- and community-funded foundation, unique in the district, is one reason Emerald is able to attract, retain, and reward outstanding faculty. This foundation supports student scholarships and faculty professional development. During our 2010 site visit, the principal was aware that the district planned to expand POS into the comprehensive high schools. Emerald was in the process of developing a new NAF academy in engineering in partnership with business and industry and community advisors. The principal also expressed interest in establishing an Academy of Hospitality and Tourism, anchored in the school’s fine culinary program. CTE at Emerald. There are many CTE course offerings at Emerald, including business, marketing, health occupations, family and consumer sciences (culinary), technology education (PLTW), and automotive. Although CTE programs are offered in course sequences, students can switch and begin another sequence (thus finishing neither). Emerald students may participate in CTSOs, including DECA, FBLA, FCCLA, and Health Occupations Students of America (HOSA), and non-mandatory internships are also available. The state required high school automotive programs to be NATEF-certified in order to receive state funding. Students who complete the three-term sequence have accumulated more instruction hours in these areas than required by NATEF for certification. Depending on a student’s technical assessment scores and overall grades, postsecondary credits may be earned. Due to budget shortfalls, some electives at Emerald have been dropped, leading to students sometimes being placed in CTE classes in which they have little interest. In the case of automotive, the instructor was concerned that such students could be a hindrance to maintaining NATEF certification, which requires shops to meet certain task and performance requirements. Emerald’s culinary program is highly successful, having produced winners for several years running in citywide, regional, state, and national competitions and sent scholarship-earning students to highly respected culinary schools. The instructor whose Culinary I and II classes we observed in 2009 and 2010 is the lead culinary instructor for all of East District. In Culinary II and more advanced classes, Emerald students serve faculty at a student-run restaurant and regularly cater large school and community functions. CTE classes observed at Emerald. During our site visits in 2009 and 2010, we observed a range of CTE classes, including Automotive I, Culinary I and II, and PLTW Principles of Engineering. In Automotive I, students were going over a quiz about the location of various shop stations and equipment. In an interview with the instructor, we were told that hands-on activities mostly take place in Automotive II and III. The first class in the sequence focuses on getting to know the shop and its contents, safety issues, and general automotive engine theory. Culinary I spans one year and covers most of the basics including safety and food preparation; in Culinary II, students serve faculty at a student-run restaurant, working the various stations such as chef, salad chef, pastry chef, maître d’, server, and dishwasher. Across both site visits, we observed Culinary II students preparing luncheon items, baking pastry shells, making chicken salad, testing new dessert recipes, sanitizing workspaces, washing dishes, laundering clothes, and converting the attached classroom into a restaurant space, which involved not only re-arranging

78
tables and chairs, but also decorating the space and tables according to the season. During our 2010 visit, students were preparing for a number of upcoming events, including a catered dinner for community partners engaged in the school’s NAF academy development work. Also observed in 2010 was a lively PLTW Principles of Engineering course in which students were busy assembling marble-sorting machines controlled by student-written robotic programs. Comparison Schools: Heliotrope High School Heliotrope High School, originally established in the 1930s as an all-White high school, was integrated in the late 1950s. It was reorganized in the 1990s as a college preparatory high school with magnet programs in math, science, environmental studies, and IB. In recent years, the district established more rigorous entrance requirements for applicants to Heliotrope’s magnets; applicants now have to demonstrate eligibility by meeting or exceeding state standards and maintaining a certain level of performance in order to remain. The student body of 1,104 mostly Black students reflects the district’s overall majority-minority population; 55.3% of its students qualify for free or reduced lunch (FRL). Table 25 contains Heliotrope student demographics. CTE at Heliotrope. Heliotrope’s CTE offerings are largely technology-focused and include business education (e.g., computer applications), health sciences (e.g., medical sciences), information technology, “trades and industry” (e.g., drafting), and a PLTW program. Heliotrope hosts two CTSOs, HOSA and the National Technical Honor Society (NTHS). Heliotrope, like other schools in the district, recently lost its dedicated career coordinator, a position it now shares with multiple schools. Heliotrope has a career center, but we did not observe it during our visits, and no information is available about it on the school website. CTE classes observed at Heliotrope. Only one CTE class was observed during our first visit—a mostly 10th-grade computer fundamentals class. Despite the competence and professionalism of the instructor, the students in this class were largely off-task, lacked basic skills, and had poorly produced projects. A more advanced IT class was observed during our second visit. Students were working on a digital portfolio project; these portfolios showcased their work in the class, including a research report, product, newsletter, and bibliography. A PLTW course observed during our second visit, Digital Electronics, had low enrollment. The new teacher did not embellish the PLTW curricular materials to boost student engagement. Although the day’s assignment was completed, time was not well-managed; students joked around, took long trips to the bathroom, and were packed up five minutes before the end of class. Comparison School: Indigo High School
Indigo High School is a 40-year-old facility located outside city limits that was built to educate students from earlier rings of suburban development. The building of a new high school nearby, in addition to the state budget crisis, have caused disruptions at Indigo. Attendance boundaries

79
have changed, leading to a loss of some students and the acquisition of others.4
Several popular CTE programs have been closed, and others have lost staff and reduced their course offerings.
At the time of selection for this study, school profiles of the participating schools in East District showed that Indigo had the highest number of incidents resulting in both in-school and out-of-school suspensions. However, safety was not perceived to be an issue during our site visits. The school report card for 2008-2009 showed Indigo student test scores beat the district average on all but one academic core subject (English), and the graduation rate at Indigo is slightly higher than the district average. Indigo’s student body is the largest of the four comparison schools at 2,479. Table 25 provides demographic characteristics of Indigo students. CTE at Indigo. In 2009, CTE offerings at Indigo included agriculture, automotive, business and marketing, construction, family and consumer sciences, health occupations, IT, and trade and industry. As of our Fall 2010 site visit, Indigo had closed its automotive and construction programs. Indigo has an incipient PLTW program, but with only one teacher, it does not offer the full PLTW sequence. Programs offer course sequences so students can flow through the district’s CTE pipeline. The website lists DECA, FBLA, FCCLA, Future Farmers of American (FFA), HOSA, NTHS, and the Technology Student Association (TSA) as its CTSOs. CTE classes observed at Indigo. A biomedical technology course observed at Indigo during our Fall 2009 site visit resembled a standard biology course; students watched a movie during the block. During our Fall 2010 site visit, we observed a PLTW Principles of Engineering class, which closely followed the PLTW curriculum and covered parametric modeling. The class consisted of a lecture from a PLTW-produced PowerPoint presentation and accompanying worksheet and a brief exercise in computerized modeling undertaken by the students. In an upper-level fashion apparel course observed, students worked independently on a variety of projects including garments, cosmetic bags, and stuffed animals. Comparison School: Neon Visual and Performing Arts School
Neon Visual and Performing Arts School is a Grades 6-12 arts-focused magnet that enrolls students from all over the district. Neon also trumpets rigorous academics, high SAT and AP scores, community partnerships, and college-going culture. Applicants go through the district’s magnet school application process, submit recommendations, and participate in an audition or portfolio process in order to be considered. The student body of 1,121 (see Table 25; 667 high school students and 454 middle school students) is racially and economically diverse, but still predominantly Black. The school is located in an economically challenged area, and 40.1% of its students qualify for FRL. The principal described the school as also diverse in its students’ sexual orientations and identities. CTE at Neon. Outside of its arts programs, Neon’s CTE course offerings are minimal and include Apparel I and II, Costume Design, Computer Applications I and II, Fashion Merchandising, and, prior to the elimination of the class as of our second site visit, Small Business Entrepreneurship. We considered Theater Tech, housed in the Theater Department, to be a CTE course because its students construct stage sets and operate the lighting and sound 4 With respect to this study, no students coming from other high schools will be added to our sample.

80
systems for school performances—skills more in common with carpentry and other technical occupations. None of the school’s CTE courses are part of a four-course pathway. The guidance counselor noted that as seniors, “it suddenly dawns on” students that they have taken four CTE courses and are eligible to graduate with one of the district’s dual concentrator diplomas—CTE is not being pursued purposefully at Neon. Neon has been badly affected by the budget crisis, and cutbacks in electives have meant that some students are pushed into CTE to fill their schedules. This can have negative consequences for student engagement when an arts-focused, possibly non-academically inclined student gets “stuck” in a business or computers class. Neon appears to have no CTSOs, although, during our first visit, the business education teacher prominently displayed a Key Club (Kiwanis) banner in her class. The Apparel teacher told us on our second visit that she was excited about beginning an FCCLA chapter on campus. By the time of our second trip, budget cuts had eliminated many teaching positions at Neon, and the high school business program was gone. There were also fewer students attending Neon, because the district curtailed busing to magnets to cut costs. Neon has no dedicated career center, and career-exploration activities thus fall to regular guidance counselors in combination with classroom teachers. By state mandate, all CTE courses have some form of career exploration built in. A guidance counselor we interviewed explained that career exploration begins during the middle school years and extends through high school; he noted that students are encouraged to prepare for college or university attendance and participate in such activities as concurrent enrollment, online education, and internships. It is unknown how many students actually do participate in postsecondary credit-earning options. CTE classes observed at Neon. Two CTE classes were observed during our Fall 2009 visit—Small Business Entrepreneurship and Apparel I. In the Small Business Entrepreneurship class, students drilled on accounting- and finance-focused questions from an online test bank; later, they worked on business plans. As of our Fall 2010 site visit, this teacher was gone and high school-level small business entrepreneurship courses were no longer available. The Apparel instructor, who also chairs the CTE program in this school, believes that the courses they offer provide an applied, creative outlet and pathway for some of her students. Her Apparel I class featured a quick research session and debate about the merits of cloth versus disposable diapers, a textbook review discussion of principles of accessibility and function in clothing, and a session of project work. In 2010, we visited the Theater Tech class. Students were supposed to begin constructing the set for the school’s next dramatic production, but because there was to be another event in the school theater before the first performance, they could not finalize its configuration. Instead, students worked on clearing out the theater department’s storage areas. Students removed broken pieces of furniture from the area above the stage and scrap lumber from the scene shop and focused on getting their work area up to code.

81
POS Results: Comparison Schools In the sections that follow, we synthesize our observations of the four mandated components of POS, as contained in the Perkins IV legislation, as we observed them at the four comparison schools visited. These syntheses are followed by specific examples from the schools. Mandated Components of POS 1. Incorporate and align secondary and postsecondary education elements. As a district located within a state with a top-down educational structure, East District has been charged with following state-developed course and program curricula that align secondary and postsecondary elements. However, the comparison sites appear to have limited direct connections with the local community college or area universities; where they exist, such connections are generally personal and localized. Some of Emerald’s CTE programs have aligned classes with the community college for a seamless transition to postsecondary education. The automotive program appears to include secondary and postsecondary elements. There is a direct pathway from high school to college, including opportunities to earn dual credit and streamline student preparation. However, other of its CTE programs are not so aligned. The emerging NAF engineering academy may provide Emerald’s most POS-like CTE pathway, but it was still being developed as of our Fall 2010 visit. There have been only limited connections made between secondary and postsecondary curricular areas at Heliotrope. Although the district develops its curricula with input from postsecondary, no curriculum development work is being done at this school in collaboration with the local community college or universities. However, on a personal level, the IT instructor has connections to programs at the local state university, which occasionally sends IT students to Heliotrope to demonstrate new technology. In Indigo’s now-closed automotive program, the teacher’s main contact was with the local community college, which donated surplus cars and invited students to its open houses. As a NATEF-certified program, the facility was qualified to teach two of the eight areas making up the Automotive Service Excellence (ASE) certification exams. Students who completed those courses would not have to retake them at the college. Neon’s CTE courses have no clear connection to postsecondary. The district develops its curricula with input from postsecondary, and Neon follows these, but no curriculum development work with postsecondary is being done. Neither the business teacher interviewed in 2009 nor the Apparel teacher/CTE chair had connections with postsecondary, apart from Apparel’s status as a supplier of costumes for local schools, colleges, and theater groups. 2. Include academic and CTE content in a coordinated, non-duplicative progression of courses. East District’s state developed statewide technical standards for all CTE program areas and, as noted, aligned curriculum across secondary and postsecondary education. The course guides that teachers must use include the academic skills that are integrated into each course activity. None of our comparison schools’ CTE programs have been laid out on paper to show

82
the specific academic, CTE, dual enrollment, and postsecondary courses required and available for each program. At Heliotrope, not all CTE courses are available as full, structured pathways leading from an introductory course through middle-level courses and ending in an advanced final course; health sciences and PLTW clearly follow this pattern, but business education, IT, and drafting (trades and industry) do not. By comparison, no program areas at Neon are available as full, structured pathways leading from an introductory course through middle-level courses and ending in an advanced course. Neon’s arts-friendly CTE courses are driven by state and district standards; in that sense, then, its courses meet academic and technical standards. 3. Offer the opportunity, where appropriate, for secondary students to acquire postsecondary credits. Opportunities exist for students to earn college credit while in CTE programs in East District. Depending on the program area, students can either take college courses while still in high school and receive credit from both institutions, or they can complete certain high school courses at set performance levels and then apply for the credit upon enrollment in college. This is not technically dual credit because the credit is not automatically transcripted on an official student record. Funding to support such programs has decreased, however, due to the state’s budget crisis; all schools—including our treatment school, Blue Academy, mentioned online courses (both postsecondary and virtual high school) as alternatives. Many interviewees observed that these online courses were not necessarily a good substitute for real classroom experiences. Some of Emerald’s CTE programs, like automotive and business, offer opportunities to earn dual credit at the local community college; others do not. Emerald’s principal describes such credit-earning as popular, particularly online options. Heliotrope makes no mention of the availability of dual credit-earning programs on its website, and interviewees there—as at Emerald, Indigo, and Neon—stressed that budget cuts have drastically reduced the number of students taking advantage of concurrent enrollment. Postsecondary credit-earning options are now available mostly for academic classes (e.g., AP), in addition to online course options. At Neon, a guidance counselor noted that a few students participate in college learning experiences at the community college. 4. Lead to an industry-recognized credential or certificate at the postsecondary level, or an associate or baccalaureate degree. Opportunities to earn industry-recognized credentials or certificates are limited at our comparison schools, partly due to their cost. Previously, more CTE programs at Emerald included opportunities to earn industry-recognized credentials. They used to offer the A+ certificate, but IT courses are no longer offered. Automotive remains NATEF-certified, but students are not eligible to sit for certification exams until after more coursework and work experience. Culinary teaches to ServSafe standards, but does not require the test because of its cost. Heliotrope’s health program allows students to earn a CNA, although during our first visit, interviewees indicated that participation in field experiences had been suspended due to the recent outbreak of the H1N1 virus. The PLTW program is clearly tied to national and industry standards, but no other programs offer the ability to earn a certificate or credential.

83
Several Indigo CTE programs include an opportunity for students to earn an industry-recognized credential at the end of high school, such as the CNA in health, a state certificate for culinary, and certificates in network engineering. Students must earn a certain grade to sit for these exams; the district formerly paid for them. There are no CTE sequences at Neon that lead to an industry-recognized postsecondary credential or certificate. Supporting Components of POS Legislation and policies. The comprehensive high schools that serve as our comparison schools are not implementing POS. The CTE programs offered there are responsive to the region’s economic and workforce development needs to the extent that the district only funds CTE programs that can be connected to the local economy—and only continues to fund programs that support sufficient numbers of students. This policy, applied in the context of the current state budget crisis, has lead to the closure of good but expensive programs like the ASE-certified automotive program at Indigo. Partnerships. Partnerships with postsecondary and business and industry are present in some of our comparison schools and display greater and lesser degrees of institutionalization and formality. Programmatic advisory committees for selected programs were the most common partnership structures observed. Other partnerships were more localized and informal. Emerald’s principal stated that although the CTE curriculum was determined at the state level, business and industry representatives also played a role in their CTE programs, providing equipment, job and internship opportunities, and guest speakers. He particularly highlighted the input of advisory committees in the school’s automotive and engineering programs. Advisory committees composed of postsecondary and business and industry representatives also provide input into Indigo’s CTE programs. As part of Neon’s effort to improve its graduation rate, a local university fraternity has begun mentoring Neon students. Neon also partners with an artist community where Neon students are welcome to work. The assistant principal also noted their partnerships with many arts groups. Professional development. Professional development is available for all East District teachers and guidance counselors, although none has been provided related specifically to POS. The availability and intensity of CTE-specific professional development varied across the comparison schools. Emerald’s unique foundation allows teachers to apply for grants to fund professional development opportunities like conferences and enrichment courses. In preparation for the launch of the NAF academy, some teachers will be engaging in curriculum integration and project-based learning professional development during the summer of 2011. During our 2010 visit, Heliotrope’s principal reported that they had received a CTE instructional facilitator, a new CTE position; his job is to help CTE teachers “think outside the box.” The

84
facilitator is familiar with how to search for grants and encourages teachers to write grants to support activities. We heard nothing about professional development to help develop POS. No professional development related to POS was noted at Neon, which offers less CTE due to the budget and the school’s focus on its arts mission. Accountability and evaluation systems. Despite trying times, this district remains focused on improving student achievement and teacher responsibility for student achievement. We observed data-driven decision-making at every school, not just at Blue. Assessment results are available almost instantaneously and teachers and departments are responsible for addressing any weaknesses evident in the results. Teachers and students alike have taken up the call to improve test scores. In many senses, CTE has led the state in the use of assessment data to drive program improvement. At Emerald, we learned that the district recently adopted a new data and accountability system that is creating some headaches for academic teachers; CTE teachers are taking to the system quite easily, given that their assessments have been drawn from state or district-level testing banks for many years. But academic teachers are having to not only learn the new system but also create and upload their assessments, which in many cases are not standardized, as well. College and career readiness standards. College and career readiness is a concept that is often bound up in a district’s graduation requirements. For our cohort, college-preparatory, career-preparatory, and combination college- and career-preparatory courses of study were available. As described under Legislation and policies for Blue Academy, East’s new graduation requirements emphasize college-preparatory academics and a sequence of academic- or CTE-focused courses. In the comparison schools, “college and career ready” is variably described. Emerald’s principal described the school’s orientation to college and career ready as preparing all students with 21st-century skills and ensuring a smooth transition to postsecondary education and employment. He is particularly focused on graduation. To Neon’s principal, college and career readiness mean one word: “Graduation.” During our 2010 visit, administrators interviewed were all in agreement that increasing achievement and graduation numbers were their main goals. To accomplish this, they are looking at students’ credit accumulation; those with problems are encouraged to cross-enroll at a district evening school, consider Saturday school, or do credit recovery. Course sequences. East District’s state aligned its CTE curriculum across secondary and postsecondary educational levels and has approved curricula for all CTE programs in both POS schools like Blue and the comprehensive high schools. However, our comparison schools have not created POS-like sequences out of their available courses. Such is the case at Emerald. Emerald’s principal understands that broader CTE sequences will increase student interest and enrollment in CTE, however. As a high-performing school, Heliotrope draws students from all over the district, but the requirements of its magnet programs make scheduling a complete CTE sequence challenging. For example, IB courses are scheduled to meet every other day for a year, whereas PLTW courses meet every day for a semester. It is nearly impossible for students to complete both programs. The

85
upper level PLTW courses have sparse attendance, so the school is looking at dropping some of the “extras” and keeping and building the attendance of the three core PLTW courses. Credit transfer agreements. This state’s process of establishing articulation agreements with postsecondary institutions was described in detail in the Credit transfer agreements section for Blue Academy. The same processes of credit transfer and curriculum alignment hold at our comparison schools. However, our comparison schools appear to have limited articulated courses (and in some cases none), and students do not always automatically accrue postsecondary credit upon satisfactory completion of a college or dual enrollment course. Guidance counseling and academic advisement. As noted in our discussion of Blue Academy, East District is located in a state that requires every CTE curriculum to contain career guidance. Career guidance thus happens largely in CTE classrooms and is delivered by CTE teachers, not guidance counselors. Guidance counselors handle course scheduling, college preparatory activities, testing, and other typical tasks. Other career-related resources supplement in-class guidance; as noted, before the budget crisis, all high schools had a career coordinator—most schools now share a coordinator. Some schools—like Emerald, Heliotrope, and Indigo—also have career centers. Neon has none. Emerald students prepare individual graduation plans that are referred to every year at registration. The school’s career center coordinator and instructional coordinator both have an active role in counseling Emerald students; the school’s career center works with students on internships, job shadowing, and dual credit opportunities. They also help bring in guest speakers to classrooms, coordinate career fairs, and provide individual, not classroom-level, career exploration. Heliotrope also has a career center, although its services were not described during our visits. The school lost its dedicated career coordinator. However, it has gained a CTE instructional facilitator who helps teachers improve their instruction, as noted in Professional development, above. Indigo’s career coordinator administers career interest inventories, finds job shadowing and internship opportunities, helps students choose a high school course of study, and assists students in preparing for the transition to postsecondary education and employment. Indigo’s guidance counselors use the new district information management system to monitor and maintain students’ five-year plans; one student interviewed in 2010 mentioned that she consulted this online plan frequently. The guidance counselor noted that career counseling was a task shared by counselors, the CTE coordinator, and teachers. Recruiters (e.g., universities, community colleges, trade and technical schools, military) are often seen on campus. Teaching and learning strategies. As we described in this section related to Blue, this state mandates some degree of curriculum integration in that academic skills have been embedded in CTE curricula and assessments. However, curriculum integration as a collaborative activity between CTE and academic teachers happens only rarely. PLCs—active at Blue—were mentioned at two comparison schools, but in both cases, these efforts seemed targeted to academic departments and did not extend to CTE. At Indigo, the automotive teacher in the now-closed automotive program took professional

86
development workshops from a national CTE organization in order to integrate academics into his classes. Curriculum integration is not an administrative mandate at Heliotrope, where we found only extremely limited evidence of curriculum integration work being done in CTE classrooms. There was no evidence of curriculum integration at Neon. Related to PLCs, at Heliotrope, the principal said that the school’s PLCs are working across disciplines—foreign languages with social studies, health/physical education with biology—but no mention was made of CTE teachers participating in this cross-disciplinary work. Neon is creating PLCs within its core departments. Although Neon has no common planning time, departmental meetings have featured in-services in which an assistant principal showed teachers how to use data to improve student achievement. Technical skills assessments. The comparison schools follow the state CTE curriculum and technical skill assessment system. Before his school’s program closed, Indigo’s automotive instructor was part of a team that helped develop the questions used on the state’s assessments; these assessments are based on NATEF standards. Ninth-Grade CTE Results The state in which East District is located developed TSAs as part of its CTE curriculum. Students take multiple choice exams at the end of most CTE courses. These exams were developed to test academic knowledge as well as knowledge that could only have been mastered through hands-on learning. The state designed the assessments so that students who have not mastered these skills are unlikely to do well on the exams. In reporting CTE coursetaking in this district, we first performed an ANOVA test to compare mean differences in GPA. There were no significant differences (treatment CTE GPA = 2.46 vs. comparison CTE GPA = 2.44; table available upon request). Next, we provide coursetaking and TSA results. Table 26 shows the number of CTE courses taken during our cohort’s ninth grade. Most treatment students took one CTE course, which is the standard ninth-grade CTE load. By contrast, most comparison students took no CTE courses in ninth grade. Table 26 Number of CTE Courses Taken, 2008-2009, East District
Number of CTE Courses Taken
Treatment (N = 376)
(%)
Comparison (N = 752)
(%)
Total (N = 1,128)
(%)
No courses 0.0*** 53.5 35.6 One course 74.2*** 38.0 50.1 Two courses 24.7*** 8.4 13.8 Three courses 1.1* 0.1 0.4 Four courses 0.0 0.0 0.0 Five courses 0.0 0.0 0.0
Note. 2x2 cross tabulations were performed. Significance was based on chi-square analyses.

87
Systems data on the TSAs taken by our student sample in 2008-2009 showed a total of 437 TSAs taken: 239 by our treatment group and 198 by our comparison group. When we requested proficiency cutoff scores for these exams, we were told that three of the TSAs were field test versions and that those data were not valid. Eliminating these brought the number of TSAs taken to 335 (160 by the treatment group and 175 by the comparison group). Table 27 shows that although less than half of the students in either group took a TSA, a significantly larger percentage of treatment students did so (40.7% vs. 22.3%). Nearly 39% of treatment students and 21% of comparison students took one TSA. A small number of students took more than one exam. Table 27 Technical Skills Assessments Taken, 2008-2009, East District
Technical Skills Assessments Taken
Treatment (N = 376) (%)
Comparison (N = 752) (%)
Took a TSA during 2008-2009 school year Yes 40.7 22.3*** No 59.3 77.7 Number taken during the 2008-2009 school year 0 exams 59.3 77.7 1 exam 38.8 21.1 2 exams 1.9 1.2 Note.*** p < .001. Table 28 shows the assessments that were taken most frequently by both groups. It should be noted that the assessments students took at Blue Academy were more focused on a few program areas—that is, those programs offered at Blue, whereas the comparison group students took assessments from a much broader range of options, reflecting the diverse CTE course offerings at the four comparison schools. Each assessment taken at Blue was taken by at least 25 students; at the comparisons schools, many assessments, such as in culinary, were taken by only one student. Table 28 Technical Skills Assessments Taken Most Frequently, 2008-2009, East District
Technical Skills Assessment
Treatment (N = 376)
(%)
Comparison (N = 752)
(%) Offered to Treatment and Comparison
Drafting I 12.4 2.6 Health Occupations 23.1 2.3
Offered to Treatment only Electronics I 7.3 0.0
Offered to Comparison only Apparel Development I 0.0 5.1 Fashion Merchandising 0.0 2.4 Principles of Business Personal Finance 0.0 2.3 Sports and Entertainment Marketing I 0.0 3.7
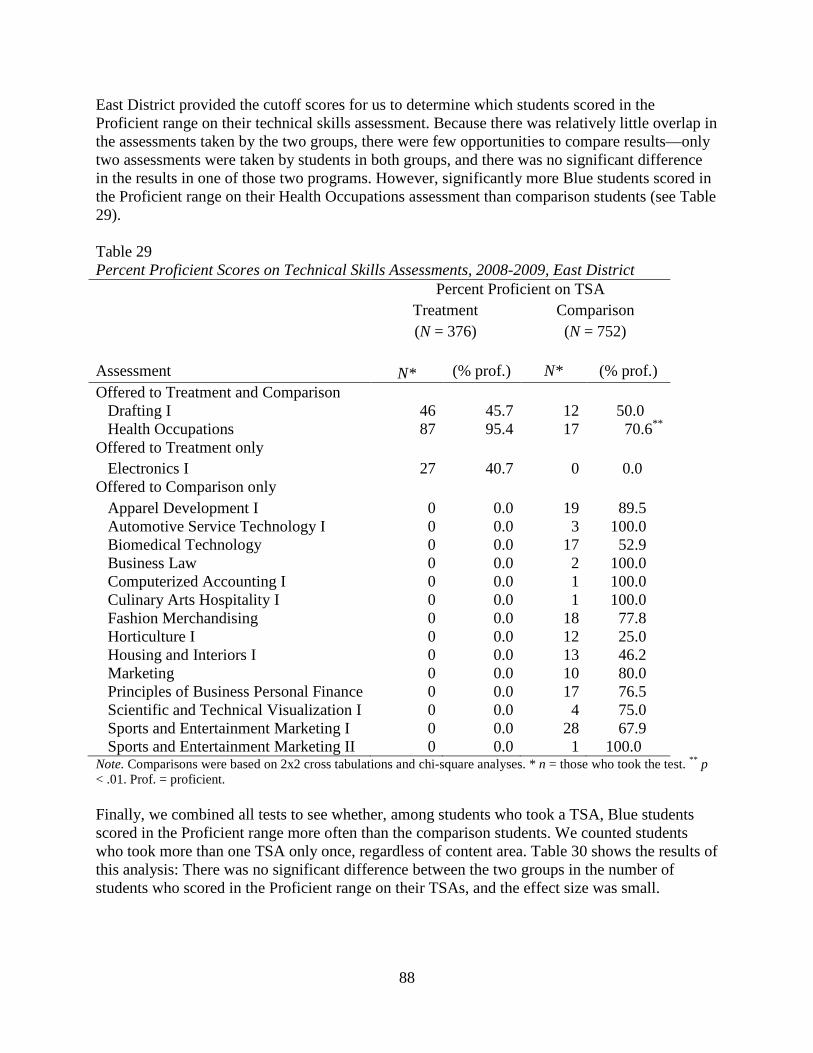
88
East District provided the cutoff scores for us to determine which students scored in the Proficient range on their technical skills assessment. Because there was relatively little overlap in the assessments taken by the two groups, there were few opportunities to compare results—only two assessments were taken by students in both groups, and there was no significant difference in the results in one of those two programs. However, significantly more Blue students scored in the Proficient range on their Health Occupations assessment than comparison students (see Table 29). Table 29 Percent Proficient Scores on Technical Skills Assessments, 2008-2009, East District Percent Proficient on TSA Treatment
(N = 376) Comparison (N = 752)
Assessment N* (% prof.) N* (% prof.) Offered to Treatment and Comparison
Drafting I 46 45.7 12 50.0 Health Occupations 87 95.4 17 70.6**
Offered to Treatment only Electronics I 27 40.7 0 0.0
Offered to Comparison only Apparel Development I 0 0.0 19 89.5 Automotive Service Technology I 0 0.0 3 100.0 Biomedical Technology 0 0.0 17 52.9 Business Law 0 0.0 2 100.0 Computerized Accounting I 0 0.0 1 100.0 Culinary Arts Hospitality I 0 0.0 1 100.0 Fashion Merchandising 0 0.0 18 77.8 Horticulture I 0 0.0 12 25.0 Housing and Interiors I 0 0.0 13 46.2 Marketing 0 0.0 10 80.0 Principles of Business Personal Finance 0 0.0 17 76.5 Scientific and Technical Visualization I 0 0.0 4 75.0 Sports and Entertainment Marketing I 0 0.0 28 67.9 Sports and Entertainment Marketing II 0 0.0 1 100.0
Note. Comparisons were based on 2x2 cross tabulations and chi-square analyses. * n = those who took the test. ** p < .01. Prof. = proficient. Finally, we combined all tests to see whether, among students who took a TSA, Blue students scored in the Proficient range more often than the comparison students. We counted students who took more than one TSA only once, regardless of content area. Table 30 shows the results of this analysis: There was no significant difference between the two groups in the number of students who scored in the Proficient range on their TSAs, and the effect size was small.

89
Table 30 Most Proficient Scores on Technical Skills Assessments, 2008-2009, East District Treatment Comparison (N = 153) (N = 168) Effect Size Ever Proficient (%) (%) (Odds Ratio) Proficient on at least one exam 73.9 66.9 1.40 Never Proficient 26.1 33.1 Note. Comparisons were based on a 2x2 cross tabulation and chi-square analysis.
Ninth-Grade Academic and Attendance Results
As noted, we are measuring academic gains using systems data, including course grades and state test scores as available. We compared several measures of ninth-grade achievement, including academic GPA, percentage of students taking honors math and English, the level of math course taken, and algebra pass rates. Academic GPA In East District, most courses are a semester long. If the course was a year-long course, the district included the course data with spring semester course grades. As in West District, GPAs were computed for math, science, English, and social studies. If a student repeated a course in the spring, we used the highest grade the student received to calculate their ninth-grade academic GPA, regardless of the semester in which the course was taken. There was no significant difference in ninth-grade academic GPA between the treatment and comparison students. As shown in Table 31, the average GPA for the treatment group was 2.13, whereas the comparison group’s academic GPA was 2.16. Table 31 Academic GPA, 2008-2009, East District
Treatment (N = 376)
Comparison (N = 752) Effect Size
M(SD) M(SD) (Cohen’s d) Academic GPA 2.13(0.79) 2.16(0.97) -0.03
Note. Academic GPA based on math, science, English, and social studies course grades. An Analysis of Variance test was performed to compare mean differences.
On Track for Graduation
As we did for West District, we used the Chicago indicators for Table 32 to see who was and was not on track for graduation at the end of ninth grade. We found no statistically significant difference between the two groups on being on track for graduation: 82.7% of the treatment group was on track to graduate on time, as was 78.7% of the control group. There appeared to be no attrition in our sample in this district between ninth and 10th grade.

90
Table 32 On Track for Graduation, 2008-2009, East District Treatment
(N = 376) (%)
Comparison (N = 752)
(%)
Total (N = 1,128)
(%) East District
On track 82.7 78.7 80.1 Not on track 17.3 21.3 19.9
Note. “Not on track” for graduation was defined as being in ninth grade during the 2009-2010 school year, or being in 10th grade but having failed one course in 2008-2009. East District courses last one semester, so there are no mid-course grades to count; we considered a Fail in the course to be the equivalent of the two Fails used in the Chicago study. Comparisons were based on 2x2 cross tabulations and chi-square analyses. Honors Math and English In East District, courses run for one semester, so if a student took an honors class in either the fall or spring, they were coded as taking honors for that content area. If they were coded as taking honors English (either fall or spring) and honors math (either fall or spring), they were coded as taking honors math and English. There were significantly more treatment students taking honors courses than comparison students (see Table 33). Nearly 34% of treatment students took honors math and English compared to 22% of comparison students. Thirty-four percent of treatment students took honors math compared to almost 24% of comparison students. Table 33 Honors Mathematics and English Coursetaking, 2008-2009, East District
Honors Courses Taken
Treatment (N = 376) (%)
Comparison (N = 752) (%)
Honors Math and English Yes 33.5 22.3*** No 66.5 77.7 Honors Math Yes 34.3 23.7*** No 65.7 76.3 Note. Comparisons were based on 2x2 cross tabulations and chi-square analyses. ***p < .001. Math Levels Mathematics coursetaking data were used to compare the treatment and comparison groups on the level of math courses taken. East District math courses taken by our cohort were classified into five types as shown (there was no “enhanced algebra” option as in West District). A chi-square analysis was performed on the five-level variable below, yielding a statistically significant relationship. The analyses presented below describe where the significant differences occurred.

91
1. Special education math: Specifically noted as not being in the standard course of study. 2. Basic math: All courses below Algebra I, such as Consumer Math or Introduction to
Math. 3. Extended Algebra I: Extended sequences that span algebra over two semesters in East
District. 4. Algebra I: Regular or Honors Algebra I. 5. Above Algebra I: Geometry, Algebra II, Pre-calculus, Calculus, Advanced Functions and
Modeling. Table 34 shows that significantly more treatment students were at the regular (or Honors) algebra I level than comparison students, and significantly fewer treatment students took a course that was below Algebra I than did comparison students. These findings suggest that the latter group is lagging behind treatment students in their progression through the math sequence, despite the similar percentages of students at the Algebra I or above level. Table 34 Levels of Math Courses Taken, 2008-2009, East District Treatment
(N = 376) (%)
Comparison (N = 752) (%)
Math Courses Taken Special Education Math 0.0 0.0 Below Algebra I 2.4 10.4*** Extended Algebra I 33.8 30.6 Algebra I 27.9 19.0** Above Algebra I 35.9 40.0 Note. Comparisons were based on 2x2 cross tabulations and chi-square analyses. ** p < .01, *** p < .001. Of the East District students who had not taken Algebra I by the beginning of ninth grade, significantly more treatment students were taking some kind of Algebra I course (i.e., extended, regular, or Honors Algebra I) compared to comparison students (96% vs. 89%, see Table 35). Table 35 Students Taking Any Type of Algebra I Course, 2008-2009, East District
Treatment (N = 243) %
Control (N = 458) %
Took 96.3*** 88.9 Did not take 3.7 11.1 Note. Excludes students who had already passed Algebra I in eighth grade. Comparisons are based on 2x2 cross tabulation and chi-square analysis. *** p < .001.

92
Success in Mathematics Coursework We next look at the results of this ninth-grade math coursetaking by examining the pass rates for our treatment and comparison groups, combining all types of algebra for this analysis. Because courses are one semester long in this district, students have time in the ninth grade to complete the extended Algebra I course. If students passed both parts of the extended Algebra I course, or if they passed regular (or Honors) Algebra I, we coded them as having passed Algebra I. If they failed only the second part of the extended Algebra I course, or if they only took one part of the extended Algebra I course, they were put in the “incomplete” category. If they failed regular (or Honors) Algebra I or the second part of the extended Algebra I, they were coded as failed Algebra I. Table 36 shows no significant difference in the pass rate of all students who took any Algebra I course—about 79-80% for both groups. Significantly more treatment students however, did not complete their algebra course. Table 36 Percent Students Passing Any Algebra I, 2008-2009, East District
Treatment (N = 234) %
Control (N = 407) %
Passed 78.6 81.3 Failed 12.8 16.7 Incomplete 8.5*** 2.0 Note. Comparisons were based on 2x2 cross tabulations and chi square analysis of dichotomized variables for each level. *** p < .001. Of those students who took a math course above Algebra I, there was no significant difference in the pass rate: approximately 98.5% of treatment students passed compared to 95.7% of comparison students, and there were no incompletes (table available upon request). Student Engagement: Ninth-Grade Attendance We examined ninth-grade attendance rates as a measure of student engagement. Table 37 shows high attendance rates for both groups; however, the treatment students had a significantly higher attendance rate during ninth grade than did the comparison students. Table 37 Ninth Grade Attendance Rates, 2008-2009, East District Treatment
(N = 374) M(SD)
Comparison (N = 743) M(SD)
East District Ninth-Grade Attendance 97.5%(0.05)*** 96.5%(0.03)
Note. *** p < .001.

93
Student Survey Results East District used SurveyMonkey to administer the online survey to our student cohort during the spring of the students’ ninth-grade year (Spring 2009). East District shared a link to the survey hosted on the NRCCTE’s SurveyMonkey account, giving us direct access to student survey responses. Postcards with a “password” (the students’ district-assigned dummy ID number) were distributed to all students in the sample. The survey was left open for a period of weeks to allow students enough time to take it or for teachers to give students time in a computer lab if they had limited or no computer access at home. Due to an extremely low response rate from the Spring 2009 survey administration, the survey was offered again in Fall 2009, when our students were in 10th grade, and the earlier ninth-grade results were thrown out. Students’ dummy ID numbers (their passwords) allowed us to link survey data to district data. Response Rates The survey results reported here were from the survey taken in the fall semester of students’ 10th-grade year. Students were asked to respond regarding their ninth-grade year. Table 38 presents the response. As was the case with West District, despite a low response rate at the treatment school, Blue Academy, the treatment response rate was still significantly higher than the comparison response rate. Table 38 Student Survey Response Rates by Treatment Status, East District Blue Comparison Total (N = 376) (N = 752) (N = 1,128) Response (%) (%) (%) Took Survey 34.6*** 20.1 24.9 Did Not Take Survey 65.4 79.9 75.1 Note. *** p < .001. Table 39 presents a closer look at the characteristics of student respondents. There were no significant differences between the two groups in terms of demographic characteristics or prior achievement as measured by eighth-grade achievement scores. This provides some level of confidence that the student groups who responded to the survey are somewhat similar, although Appendix B shows that the respondents are not fully representative of the whole group of students, particularly in the comparison group. Table 39 Characteristics of Respondents to Student Survey, East District
Characteristics
Blue (N = 130) (%)
Comparison (N = 151) (%)
Demographic Characteristics Gender
Male 50.8 46.4 Female 49.2 53.6
Race/Ethnicity

94
Black 71.5 80.8 White 8.5 6.0 Latino 8.5 6.6 Asian 5.4 3.3
Receives free lunch (FRL) 69.2 68.2 Limited English Proficient (LEP) 2.3 3.3 Has Individual Education Plan (IEP) 0.8 2.0
Mean Mean
8th-Grade Reading Scale Score 359.76 360.39 8th-Grade Math Scale Score 364.08 363.60 The Student Experience at the Treatment and Comparison Schools Treatment and comparison students who responded to the survey in East District reported no difference in having researched different jobs or careers (see Table 40). However, significantly more treatment students reported having researched postsecondary options such as higher education and the military. Further, significantly more treatment students reported having toured a local business with their school. These results align with our knowledge of the schools: We know that Blue provides these kinds of experiences to their students, whereas we did not see much attention to student identification of job or career interests during our observations at the comparison schools. Table 40 Student Survey Responses, Identifying Job or Career Interests, East District
Survey Items
Blue (N = 127) (%)
Comparison (N = 149) (%)
Researched different jobs or careers 89.0 82.6 Researched different colleges, universities, military branches, or technical/community colleges
87.4 77.9*
Toured a local business with a group from my school 36.2 16.8*** Note. * p < .05, *** p < .001. According to Table 41, equivalent numbers of students in both groups found that their teachers made the subject matter interesting and useful, but significantly more treatment students thought that their teachers encouraged students to help one another. This finding could be attributable to the school culture that is fostered at Blue Academy. Detailed elsewhere in this report, Blue’s culture fosters collegiality among teachers, students, and parents. It also promotes safety and excellence, and in such an atmosphere, people seem to be more likely to work together. In addition, many Blue teachers recently worked in industry, so they know that the ability to collaborate is highly sought after by employers.

95
Table 41 Student Survey Responses, High School Teachers, East District
Survey Items
Blue (N = 122) (%)
Comparison (N = 148) (%)
Most of my teachers make the subject matter interesting and useful. 67.2 69.6 Most of my teachers have encouraged students to help each other. 86.9 75.0* Note. * p < .05. There were few significant differences in student responses to queries about their high school courses (see Table 42). However, comparison students reported spending a great deal of time on homework significantly more often than did treatment students. We have seen the kinds of projects assigned at Blue—these are often long-term projects that assume time will be spent outside of class to complete them. Academic classes at all of the schools, both treatment and comparison, appeared to assign regular homework, so it is hard to understand the discrepancy in this finding across treatment and comparison groups. Conflicting as it does with our sense of these schools, this result is one we will attempt to understand during future site visits. Table 42 Student Survey Responses, High School Courses, East District Blue Comparison (N = 122) (N = 148) Survey Items (%) (%) My courses have repeated content that I had already learned. 74.6 74.3 I have tried to do my best work in school. 92.7 94.6 I have worked hard to meet high standards on assignments. 92.6 94.6 I spend a great deal of time on homework. 66.4 82.5*** Note. *** p < .001. The survey results in East District mostly fit what we know about the schools: Blue Academy differs from the others in its focus on college and career preparation through rigorous academics and time spent researching future options for students. The Role of the Counselor in College and Career Planning
One question in the survey asked, “Between the start of ninth grade and now, who have you talked to about the following topics?” The topics listed were:
• What courses to take this school year • Going to college • Possible jobs or careers when you are an adult • Things you’ve studied in class • Your grades • Finding a job after high school • Steps necessary to pursue your career • Applying to college or vocational/technical school
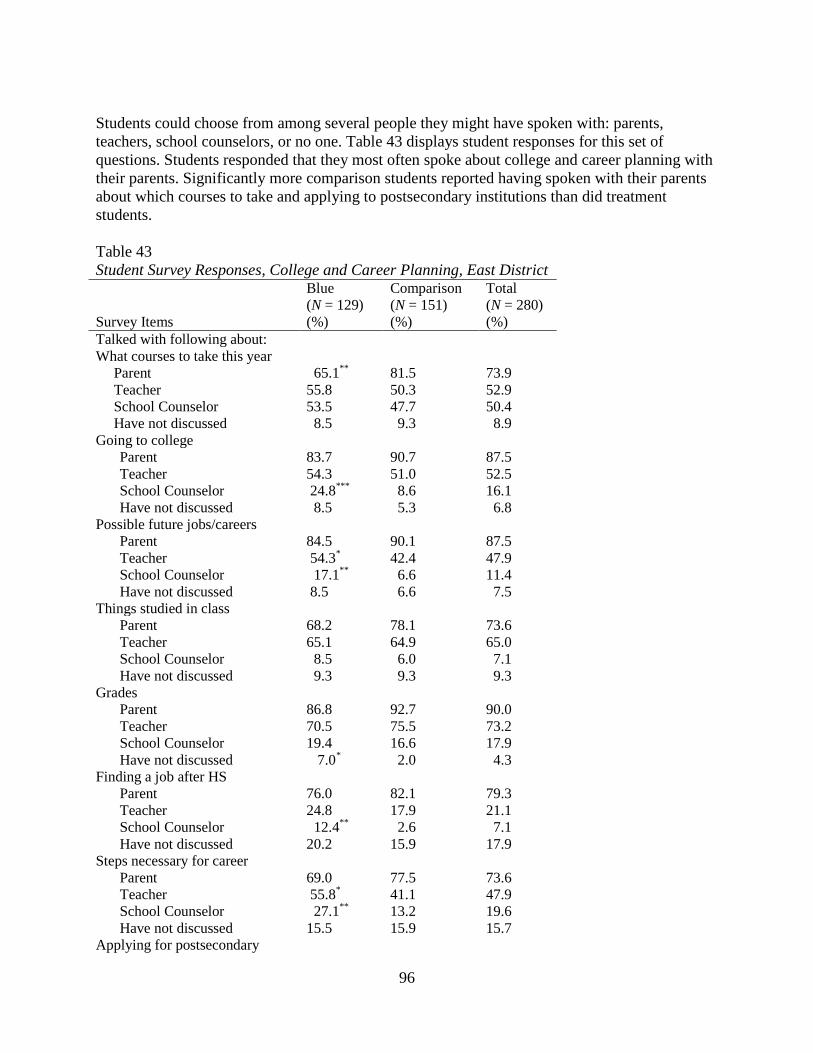
96
Students could choose from among several people they might have spoken with: parents, teachers, school counselors, or no one. Table 43 displays student responses for this set of questions. Students responded that they most often spoke about college and career planning with their parents. Significantly more comparison students reported having spoken with their parents about which courses to take and applying to postsecondary institutions than did treatment students. Table 43 Student Survey Responses, College and Career Planning, East District Blue Comparison Total (N = 129) (N = 151) (N = 280) Survey Items (%) (%) (%) Talked with following about: What courses to take this year
Parent 65.1** 81.5 73.9 Teacher 55.8 50.3 52.9 School Counselor 53.5 47.7 50.4 Have not discussed 8.5 9.3 8.9
Going to college Parent 83.7 90.7 87.5 Teacher 54.3 51.0 52.5 School Counselor 24.8*** 8.6 16.1 Have not discussed 8.5 5.3 6.8
Possible future jobs/careers Parent 84.5 90.1 87.5 Teacher 54.3* 42.4 47.9 School Counselor 17.1** 6.6 11.4 Have not discussed 8.5 6.6 7.5
Things studied in class Parent 68.2 78.1 73.6 Teacher 65.1 64.9 65.0 School Counselor 8.5 6.0 7.1 Have not discussed 9.3 9.3 9.3
Grades Parent 86.8 92.7 90.0 Teacher 70.5 75.5 73.2 School Counselor 19.4 16.6 17.9 Have not discussed 7.0* 2.0 4.3
Finding a job after HS Parent 76.0 82.1 79.3 Teacher 24.8 17.9 21.1 School Counselor 12.4** 2.6 7.1 Have not discussed 20.2 15.9 17.9
Steps necessary for career Parent 69.0 77.5 73.6 Teacher 55.8* 41.1 47.9 School Counselor 27.1** 13.2 19.6 Have not discussed 15.5 15.9 15.7
Applying for postsecondary

97
Parent 64.3* 77.5 71.4 Teacher 41.9 35.8 38.6 School Counselor 21.7* 11.9 16.4 Have not discussed 27.9 18.5 22.9
Note. * p < .05, ** p < .01, *** p < .001. Large numbers in both the treatment and comparison groups reported not having spoken with anyone about applying to postsecondary institutions; although the percentages are small, significantly more treatment students reported not having spoken with anyone about their grades. Counselors appear to play multiple roles for treatment students in East District: Students speak with them about course registration, college planning, and career planning. In fact, significantly more treatment students than comparison students reported having spoken with their counselors about going to college, future jobs or careers, getting a job after high school, the steps necessary for careers, and applying to postsecondary institutions. In two of those cases—future jobs or careers and the steps necessary for careers—treatment students also reported speaking with teachers more than did comparison students. Although much larger numbers reported talking with their parents about such topics, the number of students reporting speaking with counselors still reached significance in some cases. As noted in detail elsewhere in this report, counselors at Blue are dedicated to specific academies and receive training in those areas in order to be more effective. Whereas comparison students rely on parents for much of their information about college and career planning, Blue students have access to these specialized program-area counselors in addition to their teachers, many of whom have come to teaching directly out of thriving careers in industry. One reason why Blue students might have pointed to their teachers as sources of career information is the nature of the CTE curriculum, which includes opportunities to discuss careers in class. In contrast, fewer than half (46%) of the comparison students were taking CTE classes, according to Table 26. Therefore, not all comparison students had opportunities like Blue students to learn from a CTE teacher about a future job or career and the steps that must be taken to attain it. Our observations confirmed that career information is a part of this district’s CTE curriculum. Many schools also have career specialists who take on career counseling duties, but many of these positions in both treatment and comparison schools have been lost to budget cuts. Student Survey Summary Results from the survey suggest that responding treatment students (a) spent significantly more time researching postsecondary educational options and (b) spoke more to school personnel about various types of career planning. By contrast, responding comparison students reported speaking with their parents significantly more often. This suggests that the treatment group is shifting its locus of career planning expertise from home to school. In terms of the amount and quality of work respondents do for their classes, only one significant difference was found: Comparison students reported spending more time on homework than the treatment students.
Discussion

98
POS Descriptive Results Our observations of the CTE being offered at treatment schools in both West and East Districts would appear to confirm that these schools are offering POS—all appear to be implementing the four components mandated in Perkins IV. Additionally, our treatment schools have incorporated many of the supporting components considered key to POS development and implementation. In both districts, strong CTE programs also exist at our control or comparison schools, but aside from the academies mentioned, none of those observed to date can be described as fully functioning POS. West District. In our treatment schools, we found programs that were designed to (a) offer students opportunities to earn postsecondary credits while in high school, (b) provide progressive, program-specific course sequences laid out from introductory or foundational classes to senior-year capstone experiences, (c) align state standards-based academics into CTE programmatic content, (d) lead to postsecondary programs without content duplication, and (f) provide industry-recognized credentials to the extent possible. In one way or another, the control school CTE courses fell short of this. Some did not offer postsecondary or credentialing opportunities of any kind, others were not organized into coherent sequences, and we saw no evidence in our observations or our examinations of the course guides that academic courses were in any way aligned or cross-referenced to CTE. The possible exception to this are the academies offered at the comprehensive schools, which have been identified for subsequent analyses. Other components of POS in West District are not mandated by law but have been identified as supporting POS implementation and development. Many of these supporting components of POS were not evident in our visits to the control schools. This does not mean they do not exist at these or other control schools. However, we briefed the school administrators and teachers we interviewed as to the purpose of our visit and the basic structure and function of POS. None of these school personnel indicated that their schools were making efforts like incorporating college and career planning into the school day, promoting industry-recognized credentials, linking CTE to the local labor market, or using innovative teaching techniques that include applying academic learning to career or other themed contexts. East District. CTE is a well supported curricular component in the high schools. Instructional technology is in wide use throughout the district, and our observations suggested that teachers have clearly been trained in the use of this technology. However, East District, like many districts, has been negatively impacted by difficult economic times. Many of the elements of POS have suffered because of budget cuts. Students at both our treatment and comparison high schools have lost the support of the state funding that waived tuition for those taking classes at the community college. Nor can students depend any longer on district help in paying for the exams that grant industry-recognized credentials. Such opportunities—which include mandated elements of POS—continue to exist, but fewer students can take advantage of them. At Blue Academy, our treatment school, we found (a) four-year POS course sequences paired with specific, appropriate academic coursework that were clearly laid out for students and parents, and (b) strong curriculum alignment with the community college that included local

99
articulation agreements in addition to agreements negotiated at the state level. By contrast, there were no such relationships between CTE course sequences and specific academic requirements at the comparison schools. At the comparison schools, students may take CTE courses in one program area and move to another at any time. Our interviews revealed that some students were being placed in CTE courses they did not request through accidents of scheduling or the loss of other elective options. We did not hear that the CTE teachers at the comparison schools were as involved as those at Blue in establishing postsecondary alignments in addition to those the state had already developed. Other noteworthy components of POS at Blue are not mandated by Perkins IV but have helped the school maintain their POS; these components were not observed at the comparison schools. Blue has a strong faculty with recent careers in relevant industries. Further, Blue students are held to high standards that are communicated in many ways, starting from the time interested students research Blue on the district website and continuing through daily announcements, teacher-student interactions, and the overall school culture. Based on our observations, students at Blue can be described as doing impressive things with technology: building and testing computer networking components, designing and estimating building costs, researching and analyzing biotechnical materials, performing forensic crime scene analyses, and programming computer games. At our comparison schools, CTE ranged from high-quality, award-winning programs like Emerald’s culinary program to classes in which very little learning appeared to be taking place. These observations are limited by the structure of our site visits, in which we have the opportunity to observe only one session of any given class we select. However, the same limitation applies to our visits at Blue, where we were left with a very different impression of the overall rigor and challenge of its CTE courses. CTE Results We do not know enough about CTE achievement in West District to reach firm conclusions about CTE outcomes there. The lack of a TSA system there prevents us from saying anything definitive at this early point. We can say, however, that the control group’s ninth-grade CTE GPA was significantly higher than the treatment group’s, despite larger percentages of treatment students taking multiple CTE courses. We will continue to monitor CTE GPA at West District. Our observations of CTE in West District confirm that resources for CTE are more plentiful in the POS schools than in the control schools. This is not due to district favoritism; schools receive finite resources and must allocate them according to their needs, missions, and student populations. At the POS schools, which were constructed for the purpose of delivering a wide variety of technologically up-to-date, career-oriented POS, this means strongly supporting CTE; the comprehensive high schools have a wider range of competing demands on their funding. As a result, we saw less emphasis on course sequencing and real-world careers at the control schools compared to the treatment schools.. The story regarding CTE results is somewhat different in East District, which has a well-established TSA system. There, the data suggest that Blue students are taking significantly more CTE courses and TSAs; health occupations students in particular are significantly outscoring

100
their comparison counterparts. However, overall, there was no difference in CTE GPA or in the total number of students reaching proficiency in their respective courses and programs. Our observations of CTE in both treatment and comparison schools in East District revealed that Blue students enjoyed a school environment supportive of CTE as a means to attend college, more up-to-date equipment, teachers with former careers in POS areas, and stronger business and industry partnerships than comparison students. The comprehensive schools, on the other hand, often had more traditional programs (e.g., foods and nutrition as opposed to the more career-oriented culinary arts) that, as in West District, lacked a tangible connection to careers and “the real world.” PLTW programs were not fully funded at the comprehensive high schools and did not offer the entire sequence; as in West District, CTE had to compete for funds at the comprehensive high schools. This was especially the case at Neon, our performing arts high school. There is little CTE there, as the school has a very different core mission.5
Our results relating specifically to the structure of the schools’ CTE programs, content of observed CTE classes, and mandated and supporting components of POS are contained in the POS Results sections for West and East Districts. Our site visits, classroom observations, and interviews with key personnel generated rich data from which we drew our conclusions. Academic Results The exploration of ninth-grade achievement presented in this report is an early look at the academic press at our treatment and control schools. As with the CTE results, these early findings do not say much about the effect of POS. The results reported here are only for the ninth grade, which for most students is packed with course requirements, leaving little room for electives in any area. Students at some of our POS high schools have not yet begun their POS sequences. If we are interested in the effects of POS on student achievement, it should come as no surprise that we have found little discernible difference at this point—particularly any difference attributable to POS. Rather than look to POS to explain differences in results at this early stage, we have instead chosen to focus on building a descriptive base concerning the academic press at these schools, based on the achievement results and site visit observations we have made over two years. This base will be supplemented with data from further site visits in order to provide an explanatory context for the final outcomes of the study. West District. We found no difference between treatment and control students in terms of overall academic achievement (i.e., academic GPA) and progress toward graduation; however, significantly more control students were taking honors courses. There are many plausible hypotheses for this finding: Perhaps the POS high schools devote more staff and resources to POS than to multiple sections of other courses. Some of the POS schools see their regular courses as offering the same rigor as honors courses elsewhere; it is certainly the case that the POS schools offer about the same kinds and quantities of honors courses as offered at the comprehensives. It is also possible that students may be avoiding honors classes at the POS schools because of the more extensive technical expectations in their POS. In any case, the
5 Recall that comparison schools were not chosen taking CTE programming into account. Rather, the district matched the students attending Blue with students at the four high schools in the district that most closely matched Blue in specific characteristics (see the Sample section of this report for additional detail).

101
magnitude of the difference is not extreme and we look forward to observing patterns of honors course-taking as our student cohort moves toward graduation. In terms of mathematics results, among students who took a math course above Algebra I, treatment students were significantly more likely to pass that course than control students. The additional 5% of students passing in the treatment group is a statistically significant difference that should be seen as an accomplishment on the part of the treatment students—recall that the control group had nearly as large a percentage of students taking a math course above Algebra I (see Table 13). Indeed, there were no significant differences between the groups in prior achievement as measured by eighth-grade math test scores. Nearly half of the entire West District sample had already taken algebra by the time they entered high school, and nearly all the rest were taking it in ninth grade. Although this is mostly explained by the eligibility criteria for the POS, another conclusion we can draw is that West District prepares a sizeable number of students for Algebra I before or in ninth grade. This reflects well on the entire district culture regarding academic subject-area learning, because preparation for higher math begins in elementary school with a strong mathematics foundation and continues in middle school with increasingly more challenging concepts (National Mathematics Advisory Panel, 2008). Table 13 shows that significantly fewer treatment students took enhanced Algebra I (with the co-course) and significantly more treatment students took extended Algebra I (over a longer time span). Perhaps POS course requirements or the block schedules employed at the treatment schools make it difficult to take two mathematics courses per marking period, so students are more often offered the extended time span. Our analyses suggest that whether students took enhanced, extended, or regular algebra, the two groups passed these courses at similar rates (cf. Table 15). As with all academic courses, we will continue to monitor and report mathematics achievement over the remainder of the study. Other achievement results in West District were not significant. Our observations and the student survey results support the idea that West District holds high expectations for students, and the engagement (attendance) and achievement results seem to show that students attempt to meet those expectations. For the most part, we observed rigorous English and science courses that used class time wisely and employed a variety of pedagogical techniques intended to engage students and maximize learning; further, most teachers interviewed mentioned using interim assessments as a way to monitor and target student progress before the end of the marking period. Principals also noted a commitment to using assessment data to help improve instruction and increase student achievement. East District. In East District, there was no significant difference in ninth-grade academic GPA or progress to graduation between the treatment and comparison students. Interestingly, significantly more treatment students were taking honors courses. One could hypothesize that the more rigorous honors courses at Blue negatively affected their GPA, whereas at the comparison schools, higher grades were easier to earn due to less rigorous content. Data collected in future years may shed more light on this issue. Evidence of a strong academic press at Blue is found in the mathematics results: Among students who had not taken Algebra I by the beginning of ninth grade, significantly more treatment

102
students were taking some kind of algebra course (i.e., extended, regular, or honors) than were comparison students. Our treatment and comparison groups began ninth grade evenly matched in mathematics prior achievement, so although Blue students may have self-selected for the treatment, they were matched with students of similar prior achievement. Data suggest that students entering Blue without having taken algebra are being pressed harder to take algebra instead of a lower-level preparatory class or even the extended algebra sequence (cf. Table 34). The pass rates for algebra are respectable for both the treatment and comparison groups—about 79%—but more students appear to be progressing through the math sequence faster at Blue because they passed higher-level courses. Other achievement results in East District were not significant. Our observations and the student survey results support the idea that Blue holds high expectations for students and that college and career planning are central elements of the curriculum. Ninth-grade attendance data suggest that Blue students are significantly more engaged in school than the comparison students. Both treatment and comparison schools were well-equipped with instructional technology and the faculty had clearly received training on its use. At Blue, we saw rigorous, well-taught academic courses; we have not observed as many academic courses at the comparison schools to comment at length, although a range of regular and honors Algebra II courses observed across treatment and comparison schools during our 2010 site visit showed the district-wide adoption of digital projectors, Smart Boards, graphing calculators, and related software to deliver instruction. Student Survey Results Among respondents in both districts, we found that treatment students reported taking part in more postsecondary research and planning activities and speaking with adults at their schools about their options after high school. Control students in West District reported trying their best and working hard to meet high standards significantly more often than did their treatment group counterparts, but there was no difference in the amount of homework the groups reported they did. By contrast, in East District, there were no differences in students’ self-reported perceptions of their efforts, but significantly more comparison students reported spending a lot of time on homework. Across both districts, students reported speaking most often with their parents about college and career planning. One might conclude that this is simply the way ninth graders are at this point in their high school careers—they still orient more toward home in most matters, including those pertaining to the future. In each case in which there was a significant difference between groups in either district regarding with whom students had spoken, treatment students chose school staff over parents, whereas control or comparison students chose their parents over school personnel. This could be related to the POS experience: POS students are exposed to school personnel who have the expertise they can draw upon to succeed. They still get advice from their parents, but they are beginning to branch out—perhaps more so than control or comparison students, who may have fewer such opportunities. Regarding the role of guidance counselors, student responses in West District suggest that counselors are a source of information about postsecondary education, but that CTE teachers provide information about careers and how to attain them. In East District, CTE teachers are

103
expected to provide career information, and treatment students reported speaking with them and with counselors significantly more often than did control students. Treatment students may be speaking with CTE teachers about careers more often than comparison students because they have more opportunities to do so, given that they are all taking CTE courses, unlike their comparison peers. Treatment students also reported speaking with counselors about careers more often than did their comparison group peers, which might be attributable to Blue’s counselors being dedicated to specific POS—these counselors are knowledgeable about both careers and postsecondary education in their POS areas.
Conclusions
Although it is still too early in this longitudinal study for us to fully answer our research questions, this report begins to lay the foundations necessary to address one key study outcome—the academic achievement of POS students compared to that of control or comparison students. We have also presented rich, contextualized descriptions of POS implementation in each district regarding the other outcomes that will be measured at the end of the study—that is, what classrooms attempting to impart rigorous technical skills look like, how employability or soft skills are being taught, and how students learn about and take advantage of opportunities to earn postsecondary credits. These descriptions will be revised as we continue to visit sites, and they will be the source of our understanding of the differences between POS and non-POS. We will base any implications for program design and policy emanating from this study on our observations and interview data in addition to achievement outcomes derived from our analyses of district systems data. Given the ninth-grade results and observations reported here, it appears that across districts, our treatment schools have incorporated more college and career planning in the school environment. Additionally, certain academic foundations are being laid for POS students in the treatment schools that do not appear to be available to control or comparison school students. An example from the data that exemplifies the higher level of academic rigor at the treatment schools is the fact that significantly more treatment students were taking regular Algebra I in ninth grade in East District. Our district-level propensity score matching procedure ensured that our study cohort entered high school at an equivalent achievement level; however, more students were taking supported algebra courses in the comparison schools than at Blue. In terms of academic rigor within CTE courses, we saw much less evidence of challenging content in our comparison school CTE classroom observations than we did in many of our POS classroom observations. In POS classrooms, students were building wind tunnels, determining the course schedule in real time by responding to online surveys, constructing computers and networks, isolating DNA samples, and analyzing fingerprints to solve crimes. This is not to say that similar activities never occur in the control or comparison CTE programs; there are, for example, forensic science classes at the control schools. In the case of CTE curricula, similar content may be presented at both our treatment and control or comparison schools, but this content is often presented earlier in students’ course sequences at the treatment schools, allowing them more time in later years to complete more advanced work. For instance, students at Crimson, a control school, may take CADD and 3D animation and

104
graphics; students may also design a sequence for themselves (no such sequence is laid out in their course catalog) in which they take some related course each year. At Azure, by comparison, students enroll in the CADD POS; this sequence begins in the ninth grade and includes advanced courses not offered at the comprehensive high schools. Although Crimson students have the opportunity to earn postsecondary credit for one CADD course offered there, at Azure, five courses are available for postsecondary credit. In essence, our observations regarding course offerings at both the treatment and control or comparison schools lead us to conclude that CTE courses and programs at the control or comparison sites are not being used to their fullest potential: schools have not established clear, specific, structured CTE course sequences, aligned CTE courses or programs with academic core courses, or ensured that postsecondary credit-earning opportunities are available to all CTE students. In some schools, only one course in a given CTE area is available, precluding any possibility of a student self-creating a CTE course sequence. In future reports, as our treatment students further engage in their POS and the rest of their high school curriculum, additional measures of CTE and academic achievement will become available for analysis, like college credits and industry-recognized credentials earned in high school. We will incorporate these outcomes in our analyses in addition to continuing to examine academic and technical skills achievement.

105
References Achieve, Inc. (2010). Closing the expectations gap, 2010. Washington, DC: Author. Agodini, R., & Deke, J. (2004, February). The relationship between high school vocational
education and dropping out. Princeton, NJ: Mathematica Policy Research. Retrieved from http://www.mathematica-mpr.com/publications/PDFs/voc-ed%20dropping%20out.pdf
Allensworth, E. M., & Easton, J. Q. (2005). The ontrack indicator as a predictor of high school graduation. Chicago, IL: University of Chicago, Consortium on Chicago School Research. Retrieved from http://ccsr.uchicago.edu/publications/p78.pdf.
Atkinson, R. C., & Geiser, S. (2009). Reflections on a century of college admissions tests. Education Researcher, 38, 665-676.
Aud, S., Hussar, W., Kena, G., Bianco, K., Frohlich, L., Kemp, J., Tahan, K. (2011). The condition of education 2011 (NCES 2011-033). Washington, DC: U.S. Government Printing Office: U.S. Department of Education, National Center for Education Statistics..
Ballou, D. (2007). Magnet schools and peers: Effects on student achievement. Unpublished paper, Vanderbilt University.
Bifulco, R., Cobb, C., & Bell, C. (2009). Can interdistrict choice boost student achievement? The case of Connecticut’s interdistrict magnet school program. Educational Evaluation and Policy Analysis, 31, 323-345.
Bishop, J., & Mane, F. (2004). The impacts of career-technical education on high school labor market success. Economics of Education Review, 23, 381-402.
Bloom, H. S. (Ed.) (2005). Learning more from social experiments: Evolving analytical approaches. New, York, NY: Russell Sage.
Bridgeland, J. M., DiIulio Jr., J. J., & Morison, K. B. (2006). The silent epidemic: Perspectives of high school dropouts. Washington, DC: Civic Enterprises.
Carl D. Perkins Career and Technical Education Improvement Act of 2006 (Perkins IV), Pub L. No. 109-270, § 122.
Castellano, M., Stone III, J. R., Stringfield, S., Farley-Ripple, E. N., Overman, L. T., & Hussain, R. (2007). Career-based comprehensive school reform: Serving disadvantaged youth in minority communities. St. Paul, MN: National Center for Research on Career and Technical Education, University of Minnesota.
Chen, X. (2009). Students who study science, technology, engineering, and mathematics (STEM) in postsecondary education (NCES 2009-161). Washington, DC: National Center for Education Statistics, Institute of Education Sciences, U.S. Department of Education.
Cohen, J. (1988). Statistical power analysis for the behavioral sciences (2nd ed.). Hillsdale, NJ: Erlbaum.
Cohen, J. (1960). A coefficient of agreement for nominal scales. Educational and Psychological Measurement, 20, 37-46.
Common Core State Standards Initiative. (2010). About the standards. Washington, DC: Author. Retrieved from http://www.corestandards.org/about-the-standards.
Cook, T. D., & Payne, M. R. (2002). Objecting to the objections to using random assignment in educational research. In F. Mosteller & R. Boruch (Eds.), Evidence matters: Randomized trials in education research (pp. 150-178). Washington, DC: Brookings Institution Press.
Cullen, J. B., Jacob, B. A., & Levitt, S. (2006). The effect of school choice on participants: Evidence from randomized lotteries. Econometrica, 74, 1191-1230.

106
Daggett, W. R., Jr. (2005). Achieving academic excellence through rigor and relevance. Rexford, NY: International Center for Leadership in Education.
Dehejia, R., & Wahba, S. (2002). Propensity score-matching methods for nonexperimental causal studies. The Review of Economics and Statistics, 84, 151-161.
Editorial Projects in Education. (2011). Diplomas count: Beyond high school, before baccalaureate: Meaningful alternatives to a four-year degree. Bethesda, MD: Author.
Fisher, L. D., Dixon, D. O., Herson, J., Frankowski, R. F., Hearron, M. S., & Peace, K. E. (1990). Intention to treat in clinical trials. In K. E. Peace (Ed.), Statistical issues in drug research and development (pp. 331-350). New York, NY: Marcel Dekker Inc.
Foster, E. M. (2003). Propensity score matching: An illustrative analysis of dose response. Medical Care, 41, 1183-1192.
Griffith, J., & Wade, J. (2002). The relation of high school career- and work-oriented education to postsecondary employment and college performance: A six-year longitudinal study of public high school graduates. Journal of Vocational Education Research, 26, 3, 328-365
Hartman, J., Wilkins, C., Gregory, L., Gould, L. F., & D’Souza, S. (2011). Applying an on-track indicator for high school graduation: adapting the Consortium on Chicago School Research indicator for five Texas districts. (Issues & Answers Report, REL 2011–No. 100). Washington, DC: U.S. Department of Education, Institute of Education Sciences, National Center for Education Evaluation and Regional Assistance. Retrieved from http://ies.ed.gov/ncee/edlabs/regions/southwest/pdf/REL_2011100.pdf.
Kemple, J. J., & Scott-Clayton, J. (2004). Career Academies: Impacts on labor market outcomes and educational attainment. New York, NY: MDRC.
Kemple, J. J., & Snipes, J. C. (2000). Career Academies: Impacts on students’ engagement and performance in high school. New York, NY: MDRC.
Kemple, J. J., & Willner, J. (2008). Career academies: Long-term impacts on labor market outcomes, educational attainment, and transitions to adulthood. New York: MDRC.
Kish, L. (1965). Survey sampling. New York, NY: Wiley. Levesque, K., Lauen, D., Teitelbaum, P., Alt, M., & Librera, S. (2000). Vocational education in
the United States: Toward the year 2000 (NCES 2000–029). Washington, DC: National Center for Education Statistics, U.S. Department of Education.
Meer, J. (2007), Evidence on the returns to secondary vocational education, Economics of Education Review, 26, 559–573. Retrieved from http://www.stanford.edu/~jmeer/Meer _Evidence_on_the_Returns_to_Vocational_Education.pdf
Miles, M., & Huberman, M. (1984). Qualitative data analysis (2nd ed.). Thousand Oaks, CA: Sage.
Mosteller, F., & Boruch, R. (Eds.). (2002). Evidence matters: Randomized trials in education research. Washington, DC: Brookings Institution Press.
Murphy, K. R., & Myors, B. (2004). Statistical power analysis: A simple and general model for traditional and modern hypothesis tests (2nd ed.). Mahwah, NJ: Erlbaum.
National Commission on Excellence in Education. (1983). A nation at risk: The imperative for educational reform. Washington, DC: Author.
National Mathematics Advisory Panel. (2008). Foundations for success: The final report of the National Mathematics Advisory Panel. Washington, DC: U.S. Department of Education.
National Research Center for Career and Technical Education. (2008). Major research findings 2000-2007: Engagement, achievement, and transition. Louisville, KY: Author.

107
National Research Council. (1989). Everybody counts: A report to the nation on the future of mathematics education. Washington, DC: National Academy Press.
O’Donnell, C. L. (2008). Defining, conceptualizing, and measuring fidelity of implementation and its relationship to outcomes in K-12 curriculum intervention research. Review of Educational Research, 78, 33-84.
Organisation for Economic Cooperation and Development. (2010). Learning for jobs. Paris, France: Author.
Osterman, P., & Iannozzi, M. (1993). Youth apprenticeships and school-to-work transitions: Current knowledge and legislative strategy. Philadelphia, PA: National Center on the Educational Quality of the Workforce.
Pasta, D. (2000, April). Using propensity scores to adjust for group differences: Examples comparing alternative surgical methods. Paper presented at the 25th Annual SAS Users Group International Conference, Indianapolis, IN.
Perie, M., Moran, R., & Lutkus, A. D. (2005). NAEP 2004 trends in academic progress: Three decades of student performance in reading and mathematics (NCES 2005-464). Washington, DC: National Center for Education Statistics, Institute of Education Sciences, U.S. Department of Education.
Plank, S. B. (2002). A question of balance: CTE, academic courses, high school persistence, and student achievement. Journal of Vocational Education Research, 26, 279-327.
Plank, S. B., DeLuca, S., & Estacion, A. (2005). Dropping out of high school and the place of career and technical education: A survival analysis of surviving high school. St. Paul, MN: National Research Center for Career and Technical Education, University of Minnesota.
Rosenbaum, P. R., & Rubin, D. B. (1985). Constructing a control group using multivariate matched sampling methods that incorporate the propensity score. The American Statistician, 39, 1, 33-38.
Roth, P. L., & Clarke, R. L. (1998). Meta-analyzing the relation between grades and salary. Journal of Vocational Behavior, 53, 386–400.
Shadish, W. R., Cook, T. D., & Campbell, D. T. (2002). Experimental and quasi-experimental designs for generalized causal inference. Boston, MA: Houghton Mifflin.
Silverberg, M., Warner, E., Fong, M., & Goodwin, D. (2004). National Assessment of Vocational Education: Final report to Congress. Washington, DC: U.S. Department of Education.
Stone III, J. R. (2004). Math course taking for CTE concentrators: Evidence from three studies of the impact of a decade of education reform. Journal of Career and Technical Education, 21, 1, 49-68.
Stone III, J. R., Alfeld, C., & Pearson, D. (2008). Rigor and relevance: Enhancing high school students’ math skills through career and technical education. American Educational Research Journal, 45, 767-795.
Strauss, A., & Corbin, J. (1990). Basics of qualitative research: Grounded theory procedures and techniques. Thousand Oaks, CA: Sage Publications.
Stumpf, H., & Stanley, J. C. (2002). Group data on high school grade point averages and scores on academic aptitude tests as predictors of institutional graduation rates. Educational and Psychological Measurement, 62, 1042-1052.
Symonds, W. C., Schwartz, R. B., & Ferguson, R. (2011). Pathways to prosperity: Meeting the challenge of preparing young Americans for the 21st century. Cambridge, MA: Harvard University.

108
U.S. Department of Education. (1997). Mathematics equals opportunity. White paper prepared for the U.S. Secretary of Education, Richard W. Riley. Washington, DC: Author.
U.S. Department of Education, Institute of Education Sciences. (2003). Identifying and implementing educational practices supported by rigorous evidence: A user friendly guide. Washington, DC: Coalition for Evidence-Based Policy. Retrieved from http://www.ed.gov/rschstat/research/pubs/rigorousevid/index.html.
Walston, J., & McCarroll, J. C. (2010). Eighth-grade algebra: Findings from the eighth-grade round of the Early Childhood Longitudinal Study, Kindergarten Class of 1998–99 (ECLS-K) (NCES 2010-016). Washington, DC: National Center for Education Statistics, Institute of Education Sciences, U.S. Department of Education.
Warford, L. J, Beauman, K. M., & Kindall, R. (2008). CCTI career pathways: Five years of lessons learned and moving into the future. Presentation to the 2008 CCTI Summit. Retrieved from http://www.league.org/league/projects/ccti/summit/2008/2008CCTI-3.ppt#408,18,Summary Enrollment Totals.
Wertz, R. T. (1995). Intent to treat: Once randomized, always analyzed. Clinical Aphasiology, 23, 57-64.
Yin, R. K. (1994). Case study research: Design and methods (2nd ed.). Thousand Oaks, CA: Sage Publications.

109
Appendix A Who Was Lost to the Sample
We eliminated from the sample all students who had applied to one or more schools and did not qualify for any of them. Thus we limited our dataset to students who had applied at least once to our experimental schools and had qualified at least once for the lottery. While this is necessary for analysis purposes, it does create a sample that is different from the rest of the district’s middle schoolers in 2007-2008, and different from the entire applicant pool of that year. The ways in which the students entered into the lottery differ from the applicant pool will be mostly along the lines of the entrance criteria. This appendix describes that difference, and the students who were lost to the sample as a result of failing to meet the eligibility requirements of the programs to which they applied. In the datasets provided by West district, Qualified was defined as (1) being selected to and enrolled in a treatment school or (2) being in the second, “not enrolled” dataset and having an outcome of selected or alternate pool for that school. Not Qualified was defined as being in the “not enrolled” dataset and having an outcome of not qualified for the school(s) applied to, or being in the “enrolled” dataset but appearing to have been placed into rather than randomly selected for the POS. If a student in the “not enrolled” dataset applied to more than one program in a school and was labeled as not qualified for one but selected or alternate pool for the other, the student was counted as qualified. There were 2,466 qualified students and 1,206 students who were not qualified for the programs for which they applied.

110
Table A1 Baseline Characteristics, West District Sample Versus Lottery Applicant Pool Versus District Middle School Population, 2007-2008
Qualified
Applicants
Non-Qualified
Applicants
Total Applicant
Pool Total
Middle School Aggregate Data1 (N = 2,466) (N =1,206) (N = 3,672)
Demographics/Characteristics (%) (%) (%) (%) Gender
Male 41.2*** 50.6 44.3 56.9 Female 58.8 49.4 55.7 45.4
Race/Ethnicity Black 10.9*** 17.2 13.0 20.0 White 37.0*** 28.4 34.2 36.0 Latino 36.3*** 47.8 40.1 36.1 Asian 15.0*** 5.7 11.9 7.1 Native American 0.8 0.9 0.8 1.3 Other/Multiracial 0.0 0.0 0.0 0.0
Poverty Receives free lunch 30.3*** 40.0 33.5 44.8 Does not receive free lunch 69.7 60.0 66.5 55.2
Limited English Proficiency Yes 2.5*** 6.4 3.8 14.6 No 97.5 93.6 96.2 85.4
Has Individual Education Plan Yes 3.9*** 7.1 5.0 14.8 No 96.1 92.9 95.0 85.2
School Engagement # Disciplinary Occurrences
None 77.1*** 47.3 67.3 NA One to two 17.6 29.4 21.5 NA Three to ten 5.1 21.0 10.3 NA More than ten 0.2 2.2 0.8 NA Note. 1The total middle school population was not provided in order to mask the district’s identity. Demographic data were derived from school level data for the schools where such data were available. ** p < .01, *** p < .001. Gender was not a criterion for admission into any of the lottery-based high schools. However, there were significantly more males who were not qualified for the lottery than males who were qualified. Gender is often associated with middle school achievement, which was an eligibility requirement, and could explain the gender imbalance in the qualified pool of applicants to these POS schools. Similarly, students’ race, ethnicity, and poverty level were not criteria for eligibility for the lottery, but the district had regional preferences built in, so students from some minority groups and low-income students were differentially likely to enter the lottery for certain school choice options located in the various parts of the district. However, POS high schools were located throughout the district, so although a student might be less likely to be selected at one of these schools, they would be more likely to be selected at another. For this reason as well as others,

111
including the well-documented achievement gap in mathematics and reading among minority groups (Aud et al., 2010), significantly fewer Black and Latino students were qualified to enter the lottery, whereas significantly more White and Asian students were qualified. As can be seen in Table A1, students participating in the free or reduced-price lunch program, Limited English Proficient (LEP) students, and students with an Individual Education Plan (IEP) were significantly less likely to be qualified for the lottery. Significantly higher numbers of qualified students had no disciplinary occurrences in the previous school year than the not-qualified students. An eligibility requirement for the lottery was eighth-grade citizenship grades, but these were not available to us in a reliable format, so we report disciplinary occurrences instead. The aggregate middle school data reported disciplinary incidents in yet another format, so we could not compare them to our sample. Table A2 shows that qualified students had significantly higher attendance rates during the previous school year than those who did not qualify. We were unable to compare the CRT scores of our applicant pool with an analogous aggregate middle school mean score. Our entire baseline sample consists of the qualified applicants: Some are in the treatment group and others are in the control group. This ITT sample loses student applicants who share these characteristics: They are Latino, low-income, male, and special education students as well as students with at least one disciplinary occurrence, lower attendance rates, and lower eighth-grade CRT achievement scores. Middle school data were obtained from a state website that provided demographic data aggregated at the school level. Because we do not have student level data and cannot speak to the variability within the total middle school population, we are unable to perform tests of significance. However, we can speak to the differences without imposing significance on them. There were fewer male students, Black students, students participating in the free or reduced-price lunch program, LEP students, and students with an IEP in the qualified applicant pool than in the total middle school population. The average eighth-grade daily attendance rate was also higher for those in the applicant pool than those in the middle school population at large.

112
Table A2 Prior Achievement and Attendance, West District Sample Versus Lottery Applicant Pool Versus District Middle School Population, 2007-2008
Measure Qualified Applicants Non-Qualified Applicants Total Applicant Pool
Total Middle School1
N M(SD) N M(SD) N M(SD) M(SD) Eighth-Grade Attendance 2,361 97% (0.03)*** 1,166 94% (0.06) 3,527 96% (0.05) 93% (5.27) Eighth-Grade Pretest Math 2,366 366.97 (77.17)*** 1,184 283.96 (81.34) 3,550 339.29 (87.78) NA Eighth-Grade Pretest Reading 2,366 344.91 (54.87)*** 1,185 291.77 (60.15) 3,551 327.18 (61.97) NA
Note. 1The total middle school population was not provided in order to mask the district’s identity. Demographic data were derived from school-level data for the schools where such data were available. *** p < .001.

113
Appendix B Student Survey- Respondent Characteristics
West District The survey was conducted in Spring 2009 when West District students were near the end of their ninth-grade year. The goal was for all students in the sample to take the survey, but because of a miscommunication at the administrative level, Navy students did not take it during this term. The main body of this report compares the survey takers to each other, treatment versus control. Table B1 compares the background characteristics of those West District students who took the survey compared to those who did not, by treatment status. The table shows that among treatment group students, fewer Black students and fewer White students took the survey, and more Asian students participated. Among the control group students, more White students and Asian students took the survey, and fewer Latino, free lunch-eligible, and LEP students participated. In addition, control group students with lower eighth-grade math achievement scores were less likely to have taken the survey. We must be cautious in interpreting the survey results in terms of the confidence we can have that students’ responses are representative of the entire West District sample. Table B1 Background Characteristics of Survey Takers and Nontakers, by Treatment Status, West District Treatment Control Takers Nontakers Takers Nontakers
Characteristics (N = 896)
(%) (N = 1,061)
(%) (N = 172)
(%) (N = 337)
(%) Demographic Characteristics Gender
Male 47.5 43.5 23.8 25.5 Female 52.5 56.5 76.2 74.5
Race/Ethnicity Black 9.8 12.9* 7.6 9.5 White 34.6 40.5** 41.3 30.3* Latino 37.2 33.3 27.3 48.1*** Asian 17.6 12.7** 23.3 10.7***
Receives free lunch (FRL) 29.2 29.5 25.0 38.0** Limited English Proficient (LEP) 2.3 2.7 0.0 3.3* Has Individual Education Plan (IEP)
3.9 3.3 5.2 5.3
(N = 862)
Mean (N = 1,004)
Mean (N = 167)
Mean (N = 333)
Mean 8th-Grade Reading Scale Score 344 346 348 344 8th-Grade Math Scale Score 369 369 371 356* Note. * p < .05, ** p < .01, *** p < .001.

114
East District In East District, the survey was conducted early in the fall of 2009, when the students were young tenth graders. The questions asked students to think about their experiences during their ninth-grade year. Again, the main body of the report compares East District survey takers to each other, treatment versus comparison, and Table B2 compares the background characteristics of the East District students who took the survey compared to those who did not, by treatment status. Table B2 shows no significant differences between treatment students who took and did not take the survey. Among the comparison students, more Black students took the survey and fewer Latino students participated. These results should be taken into account when interpreting the results of the survey as presented in the main body of the report. Table B2 Background Characteristics of Survey Takers and Nontakers, by Treatment Status, East District Treatment Comparison Takers Nontakers Takers Nontakers
Characteristics (N = 130)
(%) (N = 246)
(%) (N = 151)
(%) (N = 601)
(%) Demographic Characteristics Gender
Male 50.8 52.8 46.4 50.7 Female 49.2 47.2 53.6 49.3
Race/Ethnicity Black 71.5 70.7 80.8 67.9** White 8.5 11.8 6.0 12.5 Latino 8.5 11.4 6.6 11.6* Asian 5.4 2.8 3.3 3.7
Receives free lunch (FRL) 69.2 67.9 68.2 65.9 Limited English Proficient (LEP) 2.3 5.3 3.3 5.2 Has Individual Education Plan (IEP) 0.8 3.3 2.0 2.3
Mean
Mean
Mean
Mean 8th-Grade Reading Scale Score 360 360 360 360 8th-Grade Math Scale Score 364 363 363 363 Note. * p < .05, ** p < .01.

National Research Center for Career and Technical Education University of Louisville, College of Education and Human Development, Louisville, KY 40292
Phone: 502-852-4727 • Toll-Free: 877-372-2283 • Fax: 502-852-3308Email: [email protected] • www.nrccte.org