Embed Size (px)
Citation preview

Copyright ©2015‐2016 Independent Insurance Agents and Brokers of America, Inc. All Rights Reserved. All data in this report is the property of A.M.Best Co. and is reprinted with its permission.

This document represents the 20th year the Independent Insurance Agents & Brokers of America (IIABA or the Big “I”) has reviewed the property‐casualty insurance market using premium data provided by A.M. Best Company.
For the fourth year in a row, all property‐casualty insurance premium lines grew. Combined, the market grew by $23 billion in 2014 over its 2013 levels.
After four years of strong growth, both personal and commercial lines have exceeded prerecession volumes and, combined, are now generating $555 billion in annual premiums.
The commercial lines market grew by nearly $10 billion in total premiums written, the primary metric used in this report. This sector has grown by nearly $45 billion since the market rebound began in 2011. Considering that IAs write nearly $8 of every $10 in premiums in this sector or $225 billion, 2014 was another excellent year for the independent agency model in this market.
The direct channel saw a 6% growth rate in 2014, slowing their double digit growth in recent years.
Copyright ©2015‐2016 Independent Insurance Agents and Brokers of America, Inc. All Rights Reserved. All data in this report is the property of A.M.Best Co. and is reprinted with its permission.
IAs still control a majority of the entire property casualty market, writing just over 58% of all premiums.
IAs continue to write 35% of all personal lines premiums
IAs retain their strong hold on the commercial insurance sales, writing over 80% of the market which has grown by more than $45 billion over the last four years
The national carriers lost NO market share and gained good percentages in all lines for 2014
Copyright ©2015‐2016 Independent Insurance Agents and Brokers of America, Inc. All Rights Reserved. All data in this report is the property of A.M.Best Co. and is reprinted with its permission.

P‐C Premium and Share Overview
29.25% 28.70%33.80%
8.30%
100%
162.4B 159.4B 187.5B 45.9B 555.2B
National Regional Exclusive Direct Total
2014 P‐C Overall Premium
Direct Written Premium/ Billions
%Share % Premium Growth 2013 to
2014
National 162.4B 29.25% 17.60%Regional 159.4B 28.7% ‐3.16%Exclusive 187.5B 33.8% 0.05%Direct 45.9B 8.3% 8.77%Total 555.2B 100% 4.3%
Copyright ©2015‐2016 Independent Insurance Agents and Brokers of America, Inc. All Rights Reserved. All data in this report is the property of A.M.Best Co. and is reprinted with its permission.

Commercial Premiums
24%
16%
9%1%
50%
2014 Total Commercial Premiums
National 135.6
Regional 88.4B
Exclusive 49.5B
Direct 2.6B
Total 276.1B
Direct Written Premium %Share
% Premium Growth 2013 to
2014
National 135.6B 49% 15.50%Regional 88.4B 32% ‐5.45%Exclusive 49.5B 18% ‐6.25%Direct 2.6B 1% 4.00%Total 276.1B 100% 3.72%
National agency carriers were the big winners in the commercial marketplace for 2014, picking up nearly 16% in new premiums amounting to $18 billion.
Copyright ©2015‐2016 Independent Insurance Agents and Brokers of America, Inc. All Rights Reserved. All data in this report is the property of A.M.Best Co. and is reprinted with its permission.

Direct Written Premium/ Billions %Share % Premium Growth
2013 to 2014
National 26.7B 9.60% 28.99%Regional 71.0B 25.50% ‐0.28%Exclusive 138.B 49.50% 2.53%Direct 43.3B 15.50% 9.07%Total $279.1B 100% 4.89%
5%
13%
24%
8%
50%
2014 Total Personal Premiums
National 26.7B
Regional 71.0B
Exclusive 138.B
Direct 43.3B
Total $279.1B
Again, the national agency carriers were the big winners in personal lines growth adding $6.7 billion to their bottom lines. And, as seen in the commercial space, the direct response companies saw growth, as well. The captive carriers still maintained their hold on about ½ of the market.
Copyright ©2015‐2016 Independent Insurance Agents and Brokers of America, Inc. All Rights Reserved. All data in this report is the property of A.M.Best Co. and is reprinted with its permission.

National IA carriers private passenger auto premiums increased by a little over 37% or nearly $4 billion and increased their share of the market to 7% up from 5.4% in 2013
Regional IAs lost a little ground in the auto market in 2014, dropping their share by nearly 2% and losing about $2 billion in premium
Captive carriers hold onto their 49% of the market, as they saw a $2 billion dollar increase
The direct companies also saw an increase of over 9%, adding $4 billion for 2014
Copyright ©2015‐2016 Independent Insurance Agents and Brokers of America, Inc. All Rights Reserved. All data in this report is the property of A.M.Best Co. and is reprinted with its permission.

Nat'l7%
Regional24%
Exclusive49%
Direct20%
2014 Private Passenger Auto
Nat'l
Regional
Exclusive
Direct
Direct Written Premium/Billions %Share
% Premium Growth 2013 to
2014
National 13.4B 7% 36.73%Regional 45.0B 24% ‐4.26%Exclusive 92.4B 49% 2.55%Direct 38.0B 20% 9.20%Total 188.9B 100% 4%
Copyright ©2015‐2016 Independent Insurance Agents and Brokers of America, Inc. All Rights Reserved. All data in this report is the property of A.M.Best Co. and is reprinted with its permission.

15%
28.70%
50.10%
6.20%
1
2014 Homeowner Market Share
National 12.8B Regional 24.8B Exclusive 43.3 Direct 5.3B
Direct Written Premium/Billions %Share % Premium Growth 2013
to 2014
National 12.8B 15% 23.08%Regional 24.8B 28.70% 7.83%Exclusive 43.3 50.10% 1.88%Direct 5.3B 6.20% 8.16%Total 86.2B 100% 6.82%
The homeowners insurance market experienced another year of gains, adding nearly $6 billion in premium and experiencing a nearly a 7% growth, likely due to the rebound of the housing market. And again, the national IA carriers saw exceptional growth.
Copyright ©2015‐2016 Independent Insurance Agents and Brokers of America, Inc. All Rights Reserved. All data in this report is the property of A.M.Best Co. and is reprinted with its permission.

2.2
3.2 3
4.5
5.6
4.7
6.8
2008 2009 2010 2011 2012 2013 2014
A look at annual premium growth inthe homeowners market since the recession
The growth in the homeowners market has increased the shares held by the national, regional and direct carriers, while reducing the share held by the captive carriers by nearly 3%. As in other lines, the national carriers saw a huge surge at 23% growth over 2013.
Copyright ©2015‐2016 Independent Insurance Agents and Brokers of America, Inc. All Rights Reserved. All data in this report is the property of A.M.Best Co. and is reprinted with its permission.
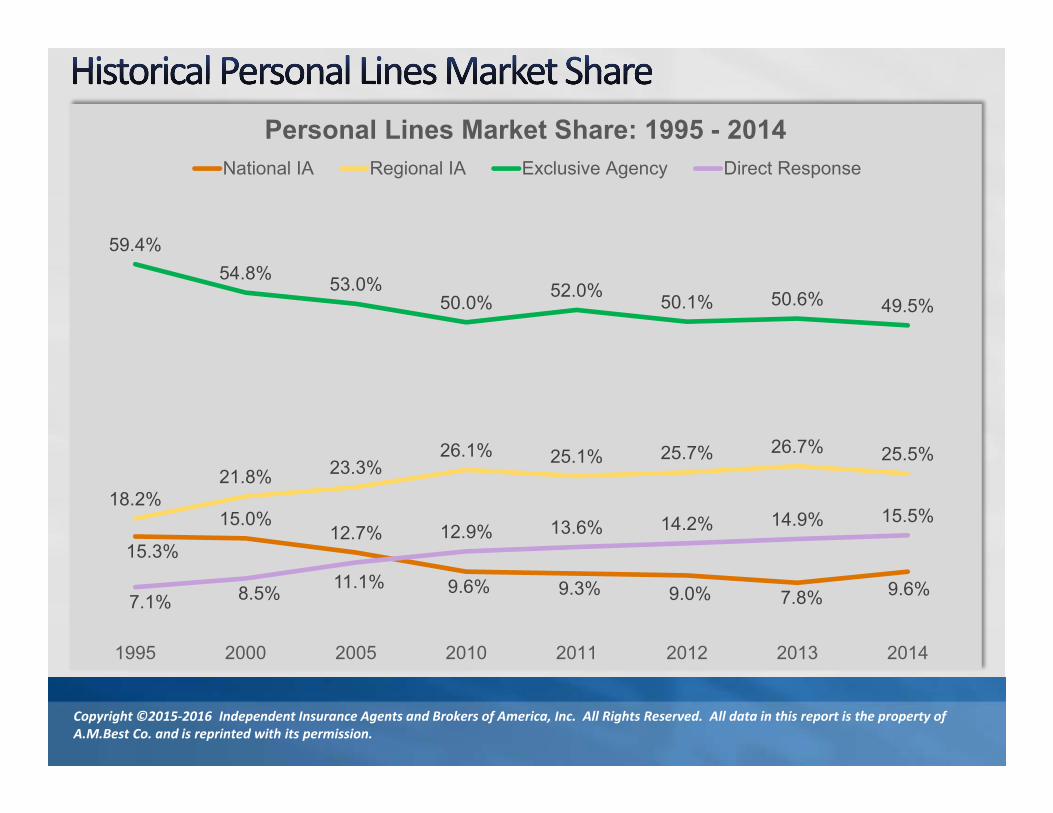
15.3%
15.0%12.7%
9.6% 9.3% 9.0% 7.8% 9.6%
18.2%21.8% 23.3%
26.1% 25.1% 25.7% 26.7% 25.5%
59.4%54.8% 53.0%
50.0% 52.0% 50.1% 50.6% 49.5%
7.1% 8.5% 11.1%
12.9% 13.6% 14.2% 14.9% 15.5%
1995 2000 2005 2010 2011 2012 2013 2014
Personal Lines Market Share: 1995 - 2014National IA Regional IA Exclusive Agency Direct Response
Copyright ©2015‐2016 Independent Insurance Agents and Brokers of America, Inc. All Rights Reserved. All data in this report is the property of A.M.Best Co. and is reprinted with its permission.
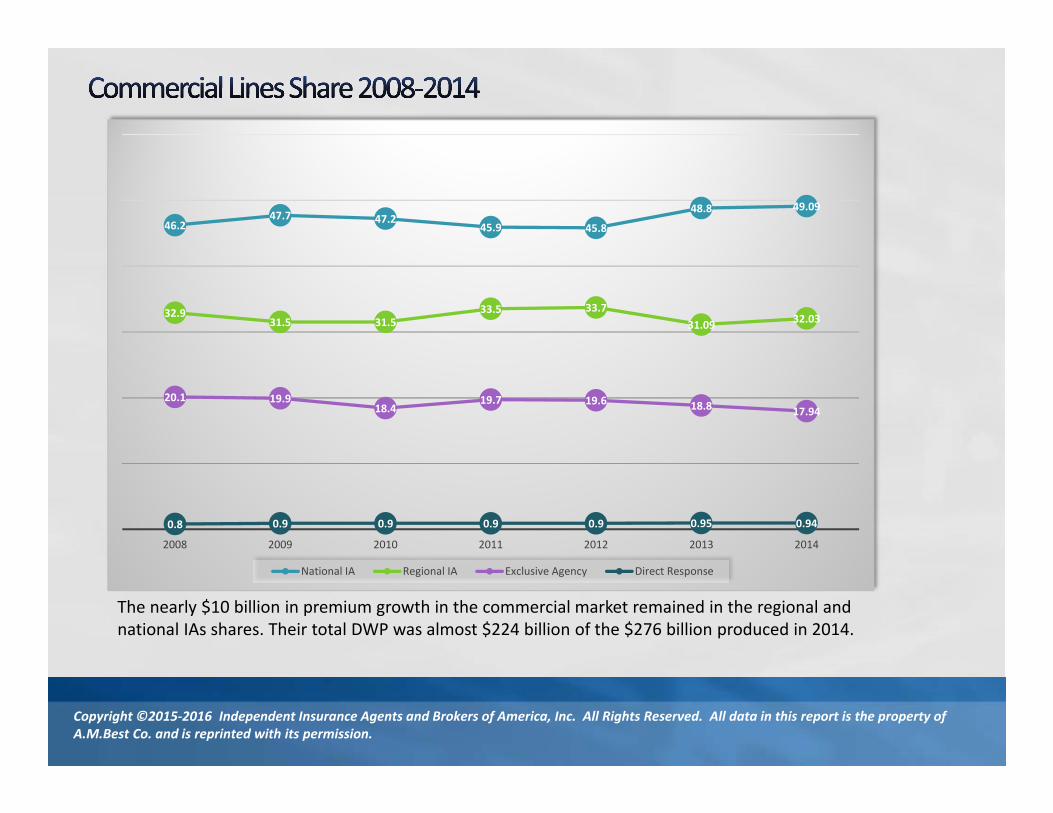
46.247.7 47.2
45.9 45.8
48.8 49.09
32.931.5 31.5
33.5 33.731.09 32.03
20.1 19.918.4
19.7 19.6 18.8 17.94
0.8 0.9 0.9 0.9 0.9 0.95 0.94
2008 2009 2010 2011 2012 2013 2014
National IA Regional IA Exclusive Agency Direct Response
The nearly $10 billion in premium growth in the commercial market remained in the regional and national IAs shares. Their total DWP was almost $224 billion of the $276 billion produced in 2014.
Copyright ©2015‐2016 Independent Insurance Agents and Brokers of America, Inc. All Rights Reserved. All data in this report is the property of A.M.Best Co. and is reprinted with its permission.

$47.90
$51.90
$54.90
2012 2013 2014
Worker’s Compensation Growth(in Billions)
In 2014, the worker’s compensation market had another strong year, recording over $3 billion in growth. At $54.9 billion, worker’s compensation now makes up 19.7% of the overall commercial p‐c market. The captive carriers control only 13% of this market, with state and national IAs controlling the remaining 87%.
Copyright ©2015‐2016 Independent Insurance Agents and Brokers of America, Inc. All Rights Reserved. All data in this report is the property of A.M.Best Co. and is reprinted with its permission.
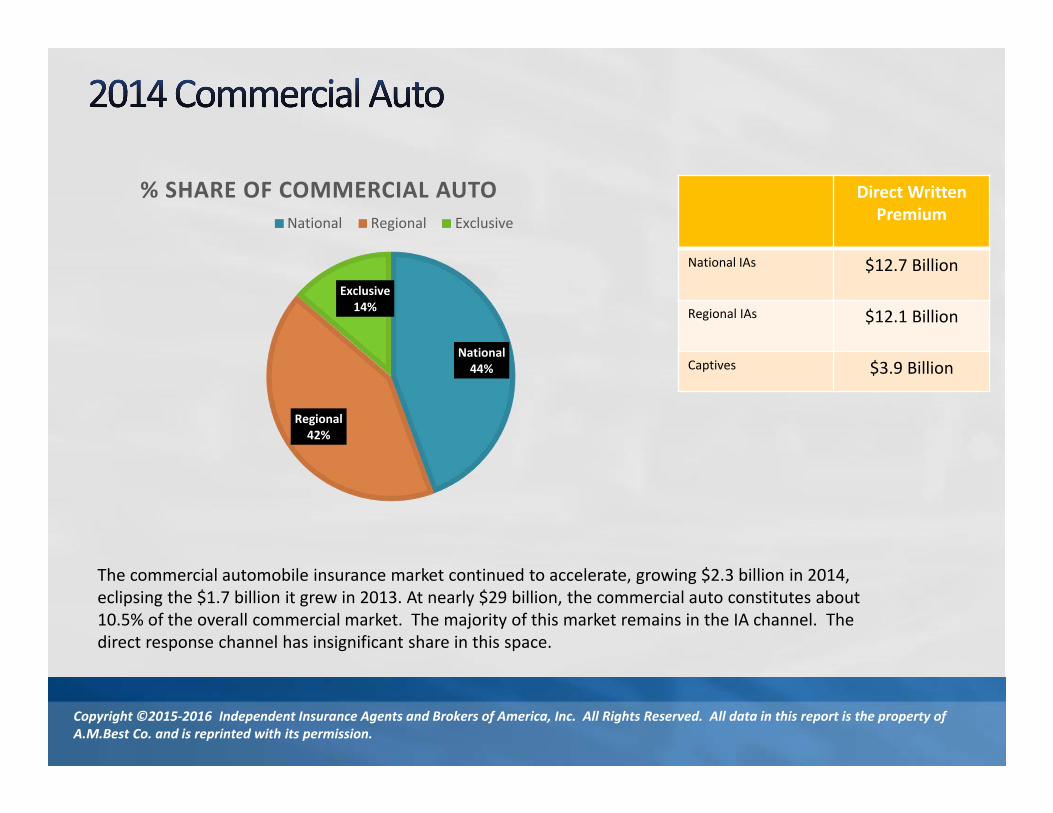
The commercial automobile insurance market continued to accelerate, growing $2.3 billion in 2014, eclipsing the $1.7 billion it grew in 2013. At nearly $29 billion, the commercial auto constitutes about 10.5% of the overall commercial market. The majority of this market remains in the IA channel. The direct response channel has insignificant share in this space.
National44%
Regional42%
Exclusive14%
% SHARE OF COMMERCIAL AUTONational Regional Exclusive
Direct Written Premium
National IAs $12.7 Billion
Regional IAs $12.1 Billion
Captives $3.9 Billion
Copyright ©2015‐2016 Independent Insurance Agents and Brokers of America, Inc. All Rights Reserved. All data in this report is the property of A.M.Best Co. and is reprinted with its permission.

States with 5 largest Gains and Losses in IA Personal Market Share 2013 to 2014
Percent Points Gained
Percent Points Lost
CA 1.34 OR ‐0.39IN 1.34 NH ‐0.39ND 1.17 MA ‐0.49WV 1.12 FL ‐0.50TN 0.96 VT ‐0.91MS 0.95 ME ‐1.07
States with 5 largest Gains and Losses in IA Commercial Market Share 2013 to 2014
Percent Points Gained
Percent Points Lost
ND 2.50 IN ‐0.57SD 2.46 WV ‐0.57TN 2.05 ID ‐0.66DC 1.95 FL ‐0.80MT 1.69 DE ‐0.99SC 1.68 VT ‐1.16
Copyright ©2015‐2016 Independent Insurance Agents and Brokers of America, Inc. All Rights Reserved. All data in this report is the property of A.M.Best Co. and is reprinted with its permission.
Direct response carriers saw no loss of personal lines share in any state for 2014 and posted a small gain (<1%). The captives show miniscule gains in only 7 states and lost about .50% overall. In commercial links, the gains posted in in the IA channel pushed the share held to over 75% in 42 states.

Number of States with IA Share by Range (Commercial Lines)Share 2005 2006 2007 2008 2009 2010 2011 2012 2013 201485‐90% 6 5 5 4 3 3 3 3 4 380‐85% 15 19 18 14 16 16 17 16 17 1975‐80% 20 19 18 25 24 23 21 22 18 2070‐75% 4 2 6 4 4 5 6 5 7 365‐70% 1 2 0 3 3 3 2 2 2 360‐65% 5 4 4 1 1 0 2 3 3 355‐60% 0 0 0 0 0 1 0 0 0 0
Number of States with IA Share by Range/Year (Personal Lines) Share 2007 2008 2009 2010 2011 2012 2013 2014 More than 50% 4 4 8 2 2 2 2 245‐50% 4 5 4 5 5 5 5 3 40‐45% 8 6 5 7 7 6 7 835‐40% 4 6 9 5 5 6 5 8 30‐35% 11 10 8 10 7 9 8 8Less than 30% 20 20 17 22 25 23 24 22
Copyright ©2015‐2016 Independent Insurance Agents and Brokers of America, Inc. All Rights Reserved. All data in this report is the property of A.M.Best Co. and is reprinted with its permission.

This is the 20th year in which A.M. Best Co. has provided the IIABA with year‐end market share data. All data in this report comes from A.M. Best and is printed with its permission. The 2014 calendar‐year figures represent the latest year in which segmented data is available from A.M.Best
In the charts in this report reflect the 2014 share numbers and are the most mature numbers compiled by A.M.Best. When referring to past reports you will note some premium and market share changes, as we have used the new numbers for prior years from the latest data which covers 2013. This occurs as the carriers adjust their reports, which then alters the market sharepercentages. Most of these are minor, but some may be significant.
Some data in the charts and graphs may not add to 100% due to rounding of minute numbers.
IIABA and A.M. Best work together each year to continually refine the data and make adjustments wherever possible. IIABA comments only on the number provided by A.M. Best.
Comments and questions about this research are welcome. Please contact Madelyn Flannagan, IIABA vice president, agent development, research and education.
Copyright ©2015‐2016 Independent Insurance Agents and Brokers of America, Inc. All Rights Reserved. All data in this report is the property of A.M.Best Co. and is reprinted with its permission.


![FURTHER VALIDATION OF FIRE DYNAMICS SIMULATOR …...International Journal on Engineering Performance-Based Fire Codes 10 Converge speed [s-1] 1.64 0.39 0.6 0.25 0.39 0.24 0.14 0.14](https://img.pdfslide.us/doc/110x75/5fde625c44ecab3f3344ec01/further-validation-of-fire-dynamics-simulator-international-journal-on-engineering.jpg)