Embed Size (px)
Citation preview

Research Collection
Doctoral Thesis
Hydrogenation over supported noble metal catalystsFrom characterization to design
Author(s): Makosch, Martin
Publication Date: 2012
Permanent Link: https://doi.org/10.3929/ethz-a-007603659
Rights / License: In Copyright - Non-Commercial Use Permitted
This page was generated automatically upon download from the ETH Zurich Research Collection. For moreinformation please consult the Terms of use.
ETH Library
Diss. ETH No. 20844
"Hydrogenation over supported noble metal catalysts: from
characterization to design"
A dissertation submitted to the ETH Zurich for the degree of Dr. sc. ETH Zürich
presented by
Martin Makosch
Dipl. Chem., Universität Ulm
Born February 18, 1984 in Augsburg
German citizen
Accepted on the recommendation of
Prof. Dr. J. A. van Bokhoven, examiner
Prof. Dr. K. Hungerbühler, co-examiner
2012


Table of contents
Table of contents
Abstract
Zusammenfassung
Chapter 1 Introduction 1
1.1. The catalytic mechanism 3
1.2. Tuning of selectivity over heterogeneous catalysts 4
1.3. Hydrogenation of nitrobenzene over heterogeneous catalysts 5
1.4. Hydrogenation of nitrobenzene over supported gold catalysts 8
1.5. Outline of the thesis 9
Chapter 2 Methods and experimental 11
2.1. Supported noble metal catalysts 12
2.1.1. Supported Au catalysts via deposition-precipitation 12
2.1.2. Supported Pt catalysts via impregnation 13
2.2. Kinetic experiments 15
2.2.1. Chiral columns for gas chromatography 15
2.2.2. Data processing for kinetic measurements 16
2.3. Transmission electron microscopy 18
2.4. Infrared spectroscopy 20
2.4.1. Transmission Fourier transform spectroscopy 21
2.4.2. Attenuated total reflectance infrared spectroscopy 22
2.5. X-ray absorption spectroscopy 25
2.5.1. High-energy resolution fluorescence detected X-ray absorption near edge
spectroscopy (HERFD XANES) 27
Chapter 3 Design and application of HERFD XAS/ATR FT-IR batch reactor cell 31
3.1. Introduction 32
3.2. Experimental section 34

Table of contents
3.3. Cell description 35
3.4. Results and discussion 37
3.4.1. Reduction of as-prepared Au/CeO2 catalysts in different solvents 37
3.4.2. Hydrogenation of nitrobenzene over Au/CeO2 40
3.5. Conclusions 43
Chapter 4 The dynamic structure of gold supported on ceria in the liquid Phase
hydrogenation of nitrobenzene 45
4.1. Introduction 46
4.2. Experimental section 47
4.3. Results 48
4.4. Discussion 54
4.5. Conclusions 57
Chapter 5 Hydrogenation of nitrobenzene over Au/MeOx catalysts - a matter of the
support 59
5.1. Introduction 60
5.2. Experimental section 62
5.2.1. Synthesis of materials 62
5.2.2. Kinetic measurements 63
5.3. Resutls 63
5.4. Disucssion 68
5.5. Conclusion 69
Chapter 6 Organic thiol modified Pt/TiO2 catalysts to control chemoselective
hydrogenation of substituted nitroarenes 71
6.1. Introduction 72
6.2. Experimental section 73
6.2.1. Catalyst preparation and modification 73
6.2.2. Kinetic measurements 73
6.2.3. Transmission electron microscopy measurements 74
Table of contents
6.2.4. Fourier transform infrared spectroscopy measurements 74
6.3. Results and discussion 74
6.4. Conclusion 80
Chapter 7 Controlling the chemoselectivity of hydrogenation reactions via surface
modification over supported Pt catalysts 81
7.1. Introduction 82
7.2. Experimental Section 84
7.2.1. Catalyst preparation and modification 84
7.2.2. Kinetic measurements 85
7.2.3. Transmission electron microscopy measurements 86
7.2.4. Fourier transform infrared spectroscopy measurements 86
7.2.5. In situ high energy resolution fluorescence detected X-ray absorption near edge
spectroscopy measurements 86
7.3. Results 87
7.3.1. Kinetic measurements 87
7.3.2. Catalyst characterization 91
7.4. Discussion 96
7.5. Conclusions 99
Chapter 8 Asymmetric catalysis over thiol modified Pt/TiO2 catalysts 101
8.1. Introduction 102
8.2. Experimental section 104
8.2.1. Catalyst preparation and modification 104
8.2.2. Kinetic measurements 105
8.3. Results 105
8.3.1. Hydrogenation of 2-phenyl-1-butene 105
8.3.2. Hydrogenation of acetophenone 106
8.4. Discussion 107
8.5. Conclusion 107

Table of contents
Chapter 9 Conclusion and outlook 109
Publications 113
Curriculum vitae 115
Acknowledgements 116
References 118

Abstract
Abstract
Hydrogenation reactions are among the most industrially applied heterogeneously-catalyzed
reactions and therefore receive extensive scientific interest. The heterogeneously catalyzed
hydrogenation of substituted nitrobenzenes is the general way to produce anilines, which are
valuable substrates for the production of pharmaceuticals, pigments and dyes. These
processes are performed at the ton scale. In this thesis we investigate the liquid phase
hydrogenation of (substituted) nitrobenzenes over supported noble metal catalysts at several
levels. We aim to determine the nature of the active site, the reaction mechanism and which
intermediates play a role in this reaction. Through the understanding of the working mode of
a hydrogenation catalyst, we want to design new modification procedures to control the
selectivity of heterogeneous catalysts for this reaction. To understand how a heterogeneous
catalyst functions, they have to be studied under reaction conditions. Over the past decades,
synchrotron-based X-ray radiation gained increasing interest for investigation of catalysts
under realistic conditions as the energetically intense X-rays have large penetration depths.
Numerous experimental setups exist for investigating heterogeneously catalyzed gas phase
reactions. Due to the lack of suitable in situ setups to investigate liquid phase reactions under
pressure, we designed an in situ cell which combines the methods HERFD XANES and ATR
infrared spectroscopy to follow our reaction under working conditions. These two
spectroscopic methods are the perfect combination to investigate heterogeneously catalyzed
liquid phase hydrogenation reactions: HERFD XANES yields the geometric and electronic
structure of the active material and ATR IR provides information about conversion of the
substrate, intermediates, selectivities, and adsorbates. Thus, we identified that the active site
of hydrogenation of nitrobenzene over supported gold catalysts is Au0. Any cationic gold
present at the beginning of the reaction readily reduce under reaction conditions and does not
contribute to activity. Changing the support caused a major shift in the reaction mechanism.
Whereas the Au/TiO2 catalyst converted nitrobenzene via the direct route, Au/CeO2 reacted it
via the condensation route. We found that nitrosobenzene accumulated on the surface of
CeO2, which was responsible for the condensation route to occur.
An important aspect in catalytic conversion is to have control of selectivity and to minimize
the formation of side products. We modified the catalyst surface to tune the chemoselectivity
for hydrogenation reactions over supported Pt catalysts. Adsorption of organic thiols caused
the selectivity to switch 100 % for hydrogenation of 4-nitrostyrene. All employed organic
thiol modifiers showed the strong influence on selectivity. The rate of conversion was
Abstract
strongly affected. The observed switch of selectivity due to modification was ascribed to the
opening of a new reaction route in which the adsorption mode of the substrate was different.
The densely packed surface-adsorbed thiols prevented the flat adsorption of the substrate 4-
nitrostyrene and thus the simultaneous hydrogenation of the two functional groups. As the
dihydrogen could still be activated, the hydrogen atoms reacted to nitrostyrene at the
metal/support interface. Chemoselectivity was induced by the preferential adsorption of the
nitro-group to the support. We applied this modification concept to achieve asymmetric
hydrogenation, by modifying supported Pt catalysts with enantiomerically pure thiol
modifiers to turn the nanoparticles in an all “chiral environment” for the enantioselective
hydrogenation of 2-phenyl-1-butene. The modification procedure did not show the desired
effect. Selected modifiers completely poisoned the catalyst and no conversion was observed.
For modifiers where activity was detected, no reasonably e.e. was obtained. These
preliminary experiments suggest that this modification procedure is not suitable for
heterogeneous asymmetric hydrogenation at the current state but potentially further
experiments can lead to positive results.
The broad appreciation of a heterogeneously catalyzed reaction is mandatory to enhance the
performance of the catalytic process. We developed a powerful tool to simultaneously
determine the structure of the catalyst and the reaction species in liquid phase reactions under
pressure over heterogeneous catalysts under actual working conditions and to establish
structure performance relationships. This reactor can be employed to liquid phase
heterogeneous and homogeneous catalyzed reactions. Our new surface-modification
procedure to directly influence the selectivity not only adds to the “heterogeneous tool box”
but also helps to understand existing modification procedures and to possibly develop new
modification concepts. Further research on heterogeneous hydrogenation reactions will
eventually result in fully adapted catalysts for specific applications that show high activity,
selectivity, and stability.

Zusammenfassung
Zusammenfassung
Hydrierungsreaktionen sind eine der meist angewandten heterogen katalysierten Reaktionen
in der Industrie und erhalten daher intensives wissenschaftliches Interesse. Die heterogen
katalysierte Hydrierung substituierter Nitrobenzolderivate ist die herkömmliche Methode um
Aniline herzustellen, die wertvolle Substrate für die Produktion von Pharmaka, Pigmenten
und Farbstoffen sind. Diese Prozesse werden im Tonnenmassstab vollzogen. In dieser Arbeit
untersuchen wir die flüssigphasen Hydrierung (substituierter) Nitrobenzole über geträgerten
Edelmetallkatalysatoren über mehrere Stufen. Wir versuchen die Natur der aktiven Spezies,
den Reaktionsmechanismus und welche Zwischenprodukte eine Rolle für diese Reation
spielen zu bestimmen. Durch das Verständnins der Arbeitsweise eines
Hydrierungskatalysators versuchen wir neue Modifizierungsmethoden zu entwickeln, um die
Selektivität eines heterogenen Katalysators für diese Reaktion zu kontrollieren. Um zu
verstehen, wie heterogene Katalysatoren funktionieren, müssen diese unter
Reaktionsbedingungen untersucht werden. Über die letzen Jahrzehnte erlangte
snychrotrongenerierte Röntgenstrahlung mehr und mehr Bedeutung für die Untersuchung von
Katalysatoren unter realistischen Reaktionsbedingungen, da sich die energetisch intensiven
Röntgenstrahlen durch hohe Eindringstiefen auszeichnen. Für die Untersuchung von
heterogen katalysierten Gasphasenreaktionen existiern zahllose experimentelle Setups.
Wegen dem Mangel an geeignten in situ Setups um Flüssigphasenreaktionen unter Druck zu
untersuchen, haben wir einen in situ Reaktor entwickelt, der die beiden spektroskopischen
Methoden HERFD XANES und ATR IR vereint, um unserer Reaktion unter
Arbeitsbedingungen folgen zu können. Diese beiden spektroskopischen Methoden stellen die
perfekte Kombination dar, um heterogen katalysierte Flüssigphasenhydrierungsreaktionen zu
untersuchen: HERFD XANES gibt Aufschluss über die geometrische und elektronische
Struktur des aktiven Materials, während ATR IR Informationen über den Umsatz des
Substrats, Zwischenprodukte, Selektivität und Adsorbate bereitstellt. Somit konnten wir Au0
als die aktive Spezies für die Hydrierung von Nitrobenzol über geträgerten Gold-
Katalysatoren identifizieren. Jegliches kationisches Gold, das zu Beginn der Reaktion
vorhanden war, reduzierte unter Reationsbedingungen und trug nicht zur Aktivität bei. Die
Variation des Trägermaterials rief einen signifikanten Wechsel des Reaktionsmechanismuses
vor. Während der Au/TiO2 Katalysator Nitrobenzol über die “direkte Route” umsetzte,
reagierte es über Au/CeO2 via die „Kondensationsroute“. Wir haben herausgefunden, dass
Nitrosobenzol, welches sich auf der Oberfläche von CeO2 ansammelt, für das Auftreten der
Zusammenfassung
„Kondensationsroute“ verantwortlich war. Ein wichtiger Aspekt bei katalytischen
Umsetzungen ist die Kontrolle über Selektivität, um die Bildung von Nebenprodukten so
gering wie möglich zu halten. Wir haben die Katalysatoroberfläche modifiziert um die
Chemoselektivität von geträgerten Platinkatalysatoren zu beeinflussen. Durch die Adsorption
organischer Thiole konnte ein Wechsel der Selektivität um 100 % für die Hydrierung von 4-
Nitrostyrene hervorgerufen werden. Alle verwendeten organischen Thiole zeigten einen
starken Einfluss auf die Selektivität. Die Reaktionsrate wurde stark beeinflusst. Der
beobachtete Wechsel der Selektivität, hervorgerufen durch die Modifikation, wurde durch das
öffnen einer neuen Reaktionsroute erklärt, bei der sich der Adsorptionsmodus des Substrats
ändert. Die dichte Packung des oberflächen-adsorbierten Thiols verhinderte eine flache
Adsorption des Substrats 4-Nitrostyrene und somit die simultane Hydrierung der beiden
Funktionellengruppen. Da das Wasserstoffmolekül noch immer aktiviert werden konnte,
reagierte atomarer Wasserstoff mit Nitrobenzol an der Metall-/Trägermaterialgrenzfläche.
Chemoselektivität wurde durch die bevorzugte Adsorption der Nitrogruppe auf dem
Trägermaterial hervorgerufen. Wir wendeten dieses Modifikationskonzept an, um
asymmetrische Hydrierungen durchzuführen, wobei wir geträgerte Platinkatalysatoren mit
enantiomerreinen Thiolen modifizierten, um die Nanopartikel in eine „total-chirale“
Umgebung für die enantioselektive Hydrierung von 2-Phenyl-1-buten umzuwandeln. Diese
Modifikationsmethode zeigte nicht den gewünschten Effekt. Ausgewählte chirale Thiole
vergifteten den Katalysator und kein Umsatz konnte beobachtet werden. Für Modifikationen,
bei denen Umsatz detektiert wurde, konnte kein e.e. erreicht werden. Diese vorläufigen
Experimente zeigten, dass diese Modifikationsmethode zur Zeit ungeeignet für die
heterogene asymmetrische Hydrierung ist. Möglicherweise könnten weitere Experimente zu
positiven Ergebnissen führen.
Ein breites Verständnis heterogen katalysierter Reaktionen ist notwendig um katalytische
Prozesse zu verbessern. Wir haben ein mächtiges Werkzeug entwickelt um die Struktur von
Katalysatoren und die Reaktionsspezies für Flüssigphasenreaktionen unter Druck über
heterogenen Katalysatoren unter Arbeitsbedingungen zu bestimmen, und um Verbindungen
zwischen Katalysatorstruktur und -wirkungsweise herzustellen. Dieser Reaktor kann für die
Untersuchung von heterogen und homogen katalysierten Flüssigphasenreaktionen eingesetzt
werden. Unsere neue Oberflächenmodifikationsmethode, mit der die Selektivität beeinflusst
wird, reiht sich nicht nur gut in die bestehenden Systeme ein, sondern kann auch neue
Denkanstösse geben, um existierende Methoden zu verstehen und um somit neue Konzepte
zu entwickeln. Weiter Forschung auf dem Gebiet der heterogen katalysierten Hydrierung

Zusammenfassung
könnte eventuell zu Katalysatoren führen, die sich durch hohe Aktivität, Selektivität und
Stabilität für spezifische Anwendungen auszeichnen.

Zusammenfassung

Chapter 1
Introduction

Chapter 1
2
1.
Heterogeneous catalysts are of fundamental importance for the worldwide production of fuels
and chemicals, both bulk1 and fine chemicals2. Because there is a growing world population,
an increasing worldwide demand for energy and feedstock, a drive towards sustainability, and
a limited availability of rare and noble metals, the development of new and better catalysts is
imperative. New catalysts which show maximum selectivity at high rates must be developed.
Ideally, such improvement is done by design of tailor-made systems for specific applications.
Current heterogeneous catalysts are often supported noble or transition metal systems and
solid acids such as zeolites. These catalysts are applied in a wide range of reactions such as
cracking, hydrogenation and oxidation reactions, especially when bulk chemicals are
produced in a large scale. Heterogeneous catalysts have the advantage of easy separation
from the product, high stability and good recyclability compared to homogeneous catalysts.
Homogeneous catalysts, with some exceptions, are mostly applied for special challenging
catalytic problems, e.g. for the production of fine chemicals, as they show very high
selectivity due to their high versatility. The structural environment can be easily and in some
cases rationally tuned via the variation of the ligands attached to the single atom active site. A
comparable versatility is highly desirable for heterogeneous catalysts.
Over the past decades, the study of heterogeneous catalysts has led to a gradual better
understanding of the interaction of the substrate with the catalysts and what parameters
determine the performance of a heterogeneous catalyst.3,4 A classical example of how to
control the catalytic properties of a heterogeneous catalyst via (surface) modification has
been commercially applied for many years; the famous Lindlar catalyst, which not only
selectively hydrogenates triple bonds to double bonds, but which also shows regioselectivity
of the resulting double bond.5,6 The surface of a Pd/CaCO3 catalyst is poisoned with lead
acetate to enhance selectivity, while reducing activity. Additional surface poisoning with
quinoline during the processing further increases the selectivity towards the double bond.7
Even after 60 years, the structure of this catalyst is still under investigation and improvements
are being proposed. To improve heterogeneous catalysts a deep understanding of all the
parameters which influence the reaction is necessary: it is important to know the mechanism
of a reaction, which involves the information what intermediates play a role during the
catalytic process, what is the nature of the active site during the reaction, i.e. the electronic
and geometric structure of the (noble) metal and how the support influences the overall
reaction. To achieve a deeper understanding of all these issues suitable in situ reactors must

Introduction
3
be developed to obtain information under realistic working conditions.4,8,9 One of the aims of
this thesis was to develop an in situ reactor, which enables determining the structure of the
catalyst under reaction conditions, the reaction mechanism and which role the reaction
intermediates play in the reaction. The reaction of interest is the hydrogenation of
(substituted) nitrobenzenes and the ultimate goal was to rationally design a better catalyst.
1.1. The catalytic mechanism
To rationally tune the performance of heterogeneous catalysts it is important to understand
the chemical bonding of atoms and intermediates with the catalyst and how they react. For a
given reaction the best catalyst bonds and reacts the key intermediates in just the right way to
provide a smooth reaction rate.10 To relate the electronic structure of transition metal catalysts
with the reactivity of heterogeneous catalyzed reactions, the d-band model is a useful
descriptor.11 The position of the d-band center is changed by variation in surface structure
and due to alloying. Moreover, the orientation of the atoms that form the active site control
the adsorption and reaction. The combination of DFT calculations with spectroscopic
measurements gives a deep understanding of the influence of changes due to an altered
structure of the surface and due to alloying and thus aims at rational planning to tune the
performance of heterogeneous catalysts. Therefore to understand a heterogeneous catalyst it
is imperative to know its structure (electronic and geometric) as well as to be able to follow
dynamic changes during the reaction under working conditions. Improved operando cells and
a clever combination of new spectroscopic methods can significantly help to understand the
catalyst structure during reaction.12 Synchrotron-based spectroscopic methods are useful, as
catalysts can be studied in situ due to the penetration depth of the high energy X-rays. An
illustrative example in which the understanding of the structure-performance relationship has
been achieved is the heterogeneously catalyzed methanol synthesis from carbon dioxide and
hydrogen. The industrially used catalyst is Cu/ZnO/Al2O3. Its active site is well-studied by
theoretical and experimental methods.13 The Cu/ZnO/Al2O3 catalyst consists of porous
aggregates of Cu and ZnO nanoparticles which are structurally promoted by Al2O3. The high
activity of this catalyst can be explained by the “Cu-ZnO synergy”. Under reaction
conditions, which are reducing, the surface of the Cu atoms gets partially covered by ZnOx
species. Under the harsh reaction conditions (200 to 300 °C and 50 to 100 bars) a partial
surface CuZn alloy is formed on the steps of the Cu surface. Another example of following
the structure of the catalyst during reaction is that of CO oxidation, which helped to
understand the origin of oscillations in conversion observed over supported Pt catalysts. The

Chapter 1
4
combination of mass spectroscopy with time- and space-resolved XAS measurements showed
that the oscillations were paralleled with reduction and re-oxidation of the surface. A
disordered platinum surface oxide yielding oxygen defects was identified as the active site.14
Also, knowing the catalyst structure helped to understand the origin of selectivity for semi-
hydrogenation of alkynes. Synchrotron-based XPS analysis revealed that significant amounts
of subsurface carbon and Pd-C formed in situ during the hydrogenation reaction.15,16 In the
selective hydrogenation regime the Pd-C phase was identified as the active phase. XANES
measurements showed that over Pd/Al2O3 and Pd/SiO2 catalysts surface carbide-like phases
are formed rapidly after the exposure to the alkyne substrates.17 High selectivities are
obtained by surface poisoning by alkyne of the carbide-like structure, which is stable under
reaction conditions and is only partially reverted to hydride upon exposure to H2.
1.2. Tuning of selectivity over heterogeneous catalysts
The optimal catalyst yields high activity, selectivity, and stability combined with reusability.
The drawback of highly active catalysts is that they do not necessarily provide high
selectivity. If several functionalities are present in the same reactant, a very active catalyst
reacts all of them. Two possible ways to create high activity and selectivity are to enhance the
selectivity of the very reactive catalyst or to increase activity of a not so active, but selective
catalyst. Numerous surface modifications of heterogeneous catalysts are found in the
literature for tuning regioselectivity, chemoselectivity, and enantioselectivity. Tuning the
properties of a heterogeneous catalyst can be achieved via the decoration of the surface with
inorganic and organic species. Foreign atoms are introduced to cover the active material to
either tune the activity of the active metal or to selectively poison certain surface sites which
are active for an undesired reaction. This method is well known and applied for the Lindlar
catalyst. Pd particles supported on CaCO3 are poisoned by Pb to improve the performance
during the hydrogenation of triple bonds. This poisoning method results in exclusive
selectivity towards the triple bond which keeps all other and all resulting double bonds intact.
The selectivity towards the triple bond can be increased even more by the addition of
quinoline to further poison the Pd nanoparticles. The effect of this modification is ascribed to
a change in solubility of H2 in the Pd phase which influences the activity of the catalyst.7,18
The modification works also with Cu and Bi salts, but Pb shows the best results. The
poisoning with Pb also finds application for other chemical reactions. A successful system for
the chemoselective hydrogenation of nitro-groups is a Pt/CaCO3 catalyst poisoned with
Pb.2,19-21 The authors assume that due to the decoration of the active Pt nanoparticles with Pb
Introduction
5
atoms the nitro compound is not able to adsorb on the catalyst surface anymore whereas H2 as
a small molecule can still reach the active surface, dissociate and react the nitro-group. This
catalytic system showed a high chemoselectivity for various substituted nitro compounds.
A variety of organic molecules such as thiols, phosphines, aldehydes and amines are used for
tuning the selectivity of catalysts especially for hydrogenation reactions. The effect of these
modifications is either to selectively poison certain surface sites, due to a changed adsorption
mode of the substrate or to modify the electronic or geometric structure of the active site.
Molecules that contain sulphur atoms have been successfully applied to tune the performance
of several hydrogenation catalysts. Sulphur is a catalyst poison as it fully blocks the active
sites of a heterogeneous catalyst22, however the application of bulky organic molecules
adjacent to the sulphur group restrict full poisoning of the active surface and thus keeps
specific sites still active for catalysis.23 Sulphur containing molecules find application for the
gas phase hydrogenation of 1-epoxy-3-butene over Pd/Al2O3 catalysts.23,24 Whereas the
selectivity towards 1-epoxybutane is only 11 % for an unmodified supported Pd catalyst, an
improvement to 94 % selectivity can be achieved via the surface modification with
alkanethiols. The authors in this case ascribe the changed selectivity to the metal-sulphur
interactions either by electronic or geometric modification of the surface, whereas a strong
dependence of the alkane chain attached to the thiol group was found.25 The alkanethiols with
longer chains led to a higher ordering of the thiols on the surface and thus resulted in a higher
tendency to the selective 1-epoxy-3-buten hydrogenation over the modified Pd/Al2O3
catalyst.
1.3. Hydrogenation of nitrobenzene over heterogeneous catalysts
As shown above, methods exist how to actively tune the performance of conventional
heterogeneous hydrogenation catalysts. A rather new discovery is, that gold shows unique
properties for the hydrogenation of nitrobenzene.26 The heterogeneous hydrogenation of
substituted nitrobenzenes is a reaction of great interest, because aniline and its derivates are
valuable substances in the chemical industry for the production of polymers, pharmaceuticals,
herbicides, and dyes.27 In former times the reduction was carried out with stoichiometric
amounts of reducing agents such as iron (Béchamp reduction) or sulfides. In the case of the
Béchamp reduction the byproduct Fe2O3 was sold as pigment or additive. As new cheaper
and cleaner ways to produce pigments were found, this reaction was not profitable anymore
and thus heterogeneous hydrogenation became more favorable. Over the time many catalytic
Chapter 1
6
systems were found for the reduction of nitrobenzenes. The state-of-the-art catalysts are
mostly active metals, such as Pt, Pd, Ni, Cu, and Ir, which are supported on various materials,
such as activated C, CaCO3, and SiO2, depending on their application.20 At laboratory- and
industrial-scales the reaction is performed in the liquid phase in polar as well as apolar
organic solvents or alcohols. Reactors for this hydrogenation should enable very good
dispersion of the hydrogen gas, good suspension of the (heterogeneous) solid catalyst in the
reaction mixture, efficient heat removal and safe handling/removal of the product. Two
reactors fulfill these requirements: the stirred autoclave and the loop reactor. Efficient
hydrogen dispersion and a large heat exchange surface are provided for the loop reactor,
which is employed for rapid reactions with a high substrate concentration which require a low
reaction temperature. The stirred autoclave is more versatile and can be used also for
reactions where the substrate must be added continuously.20
Haber proposed a reaction scheme (Scheme 1.1) for the electrochemical hydrogenation of
nitrobenzene and its derivates in 1898;28 however, there is an ongoing debate about the
reaction mechanism over heterogeneous catalysts.
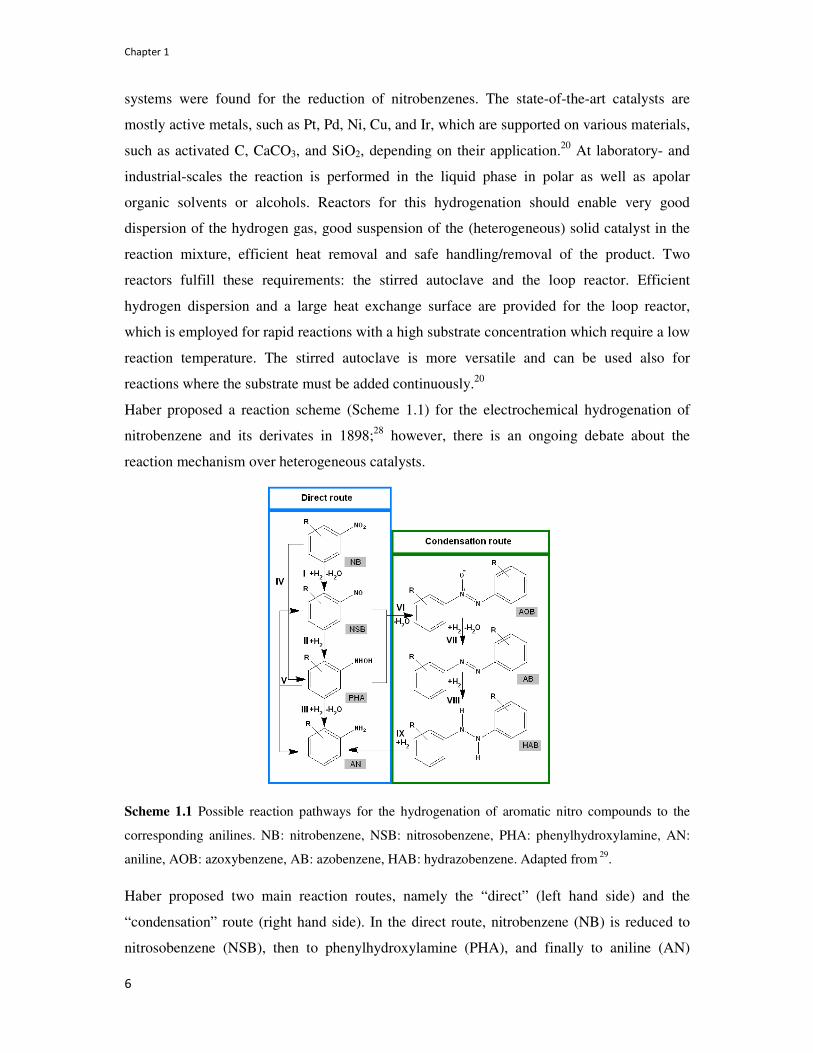
Scheme 1.1 Possible reaction pathways for the hydrogenation of aromatic nitro compounds to the
corresponding anilines. NB: nitrobenzene, NSB: nitrosobenzene, PHA: phenylhydroxylamine, AN:
aniline, AOB: azoxybenzene, AB: azobenzene, HAB: hydrazobenzene. Adapted from 29.
Haber proposed two main reaction routes, namely the “direct” (left hand side) and the
“condensation” route (right hand side). In the direct route, nitrobenzene (NB) is reduced to
nitrosobenzene (NSB), then to phenylhydroxylamine (PHA), and finally to aniline (AN)

Introduction
7
(Steps I–III). A variation of the direct route is the “no-nitroso route” (Step IV), in which
nitrobenzene directly reacts to phenylhydroxylamine and then to aniline.30 The condensation
route occurs when the two intermediates nitrosobenzene and phenylhydroxylamine
condensate to form azoxybenzene (AOB) (Step VI). This species is then hydrogenated to
aniline in consecutive steps via the intermediates azobenzene (AB) and hydrazobenzene
(HAB) (Steps VII–IX). Another possible step in the transformation of nitrobenzene to aniline
is the decomposition of phenylhydroxylamine into nitrosobenzene and aniline (Step V).
Aniline is produced by the disproportion of phenylhydroxylamine.31 The nitrosobenzene
generated by the disproportion reenters the catalytic cycle and is subsequently transformed
into phenylhydroxylamine. These findings are based on measurements of nitrobenzene
hydrogenations over Ir/C poisoned by Hg. Azoxybenzene is the first intermediate that is
formed in the condensation route, which is observed when the reactions are performed in the
presence of a base. Azoxybenzene can also be detected at slow reaction rates, for example,
over Pd/SiO2 in methanol at 25 °C.32 The prevention of the condensation intermediates and
phenylhydroxylamine is highly desired. Condensation intermediates are carcinogenic,
additionally phenylhydroxylamine bears hazardous dangers. The decomposition of nitro
compounds is a very exothermic reaction (ca 2000 kJ mol-1) and follows, once triggered, a
self accelerating process.20 An accumulation of phenylhydroxylamine is one possible
decomposition initiator as its decomposition is exothermic as well.20,33 Once the
decomposition started it is hard to control; as this reaction does not consume hydrogen
(compare Scheme 1.1) stopping the hydrogen supply and stirring does not slow down the
process. Immediate cooling is imperative to prevent nitro-decomposition of the reaction
mixture. Common methods to prevent hydroxylamine accumulation is the addition of (toxic)
decomposition promoters such as V, Fe, Co, Cu and Tl salts, of which V salts are the most
effective.20,34,35 These promoters accelerate the reaction rate, possibly because they open a
“catalytic bypass” by faster decomposing phenylhydroxylamine which also leads to the
product aniline (Step V in Scheme 1.1).34 Recently, the selective catalytic hydrogenation of
functionalized nitroarenes has been reviewed.21 The authors describe precisely the tailoring of
selective catalysts by using organic and inorganic modifiers and their application for different
catalytic problems. Also, the effect of solvent, particle size, and support are discussed. The
discussion on the influence of the support focuses on selectivity, activity, and stabilization of
the metal nanoparticles. Other reports detail the effect of the composition of the reaction
mixture,36 the noble metal,37 and support38-40 on selectivity, activity, and stability.

Chapter 1
8
1.4. Hydrogenation of nitrobenzene over supported gold catalysts
As mentioned gold showed unique properties for the hydrogenation of substituted
nitroarenes. Chemoselective hydrogenation has been reported for nitrobenzenes in the
presence of aldehyde-, bromo-, chloro-, olefinic- groups.21,41-47 In all cases selectivites > 90
% have been reported. When supported on metal oxides, which show the effect of strong
metal support interactions (SMIS), such as TiO2 and Fe2O3, gold shows a very high
chemoselectivity towards the nitro-group in the presence of other reducible groups during the
hydrogenation of substituted nitroaromatics, without the addition of soluble metal salts to
prevent hydroxylamine accumulation, thus making it a “green” alternative to common
hydrogenation catalysts.26 The origin of the high chemoselectivity was investigated by means
of DFT calculations. It was found that the metal/support interface plays an important role for
the preferential hydrogenation of the nitro group. H2 is dissociated on metallic uncoordinated
gold atoms and the substituted nitroarene adsorbs strongly and preferentially on the support.
Via diffusion it reaches the metal/support interface where it reacts with the chemisorbed
hydrogen at low coordinated gold atoms.40 Based on ex situ GC measurements and in situ gas
phase IR measurements, the authors proposed that the hydrogenation of nitrobenzene
proceeds via a variation of the direct route proposed by Haber.48 Nitrobenzene is directly
hydrogenated to phenylhydroxyl amine and then further to the product aniline. A more
detailed analysis, based on in situ ATR FT-IR measurements showed that this reaction route
had to be slightly corrected. The in situ measurements in the liquid phase revealed that
phenylhydroxylamine could be identified on the surface of the catalyst. Although
nitrosobenzene was not directly detected the authors propose that this short lived intermediate
plays a role in the reaction mechanism. The hydrogenation of nitrobenzene over supported
Au/TiO2 proceeds via the direct route, whereas the intermediates nitrosobenzene and
phenylhydroxyl amine are strongly adsorbed on the catalyst surface. The fact that
nitrosobenzene was not detected during these measurements was ascribed to the reaction rate
being faster than the detection limit of the measurement equipment. The observed
accumulation of phenylhydroxylamine on the catalyst surface lead to a poisoning of the
Au/TiO2 catalyst.29 At first, the rate determining step was supposed to be the hydrogenation
of phenylhydroxylamine to the final product aniline as a gradual accumulation of the former
was observed by gas phase FT-IR measurements.48 More detailed kinetic studies revealed
that the hydrogen dissociation over supported gold catalysts is not as efficient as over

Introduction
9
conventional hydrogenation catalysts.37 Thus questions arose how to improve the activity of
supported gold catalysts. It has been shown that alloying gold with more active materials
such as Pt can significantly increase the hydrogenation rate49 while keeping the high
chemoselectivity towards the nitro-group.37 Also, a three-fold increase of activity was
reported for the hydrogenation of chloro-nitrobenzenes for Au-Pd /Al2O3 catalysts with molar
Au/Pd ratios of 20 while keeping the high selectivity towards chloro-aniline, whereas lower
ratios resulted in hydrochlorination as side-reaction due to the high hydrogenation activity of
Pd. Enhancement of activity for gold catalysts cannot only be achieved due to alloying.
Recently it was shown that the addition of Ag(I) salts significantly increases the reaction rate
while maintaining the high selectivity towards the nitro-group in the liquid phase
hydrogenation of various halogenated nitrobenzenes. For a Au/SiO2 catalyst AgOAc was the
most effective hydrogenation promoter.47 Alloying gold with other metals also showed
different interesting properties for the hydrogenation of nitrobenzenes.45 Gold supported on
Al2O3 was found to be selective for the gas phase semi-hydrogenation of m-dinitrobenzene.50
Whereas Au/Al2O3 exclusively produced m-nitroaniline, Ni/Al2O3 leads to full reduction, m-
phenylenediamine respectively. Interestingly alloying Au with Ni yielded mixtures of the
semi- and fully-hydrogenated products, thus enabling fine tuning of the product distribution.
Gold shows unique properties for the liquid phase hydrogenation of (poly-) substituted
nitrobenzenes especially in terms of selectivity. The reaction is well studied throughout the
literature; nevertheless open questions remain for this hydrogenation reaction. Although the
reaction mechanism has been investigated, it is still unclear which parameters influence the
reaction route. Additionally, the active phase of the catalyst during the reaction is still under
discussion. We aim to provide more insights into the reaction in this work.
1.5. Outline of the thesis
This dissertation details the liquid phase hydrogenation of (substituted) nitrobenzenes. As
mentioned our aim is to unravel which parameters influence the performance of a
heterogeneous catalyst, in our case supported gold and platinum catalysts, concerning
activity, selectivity, reaction mechanism and subsequently to actively influence the
performance of our supported noble metal catalysts. The first two chapters give the reader an
overview and an introduction of the literature and the experimental methods employed. To
gain more insights into the working mode of our catalysts we designed a reactor cell which
combines simultaneous high energy resolution fluorescence detected X-ray absorption near
edge spectroscopy (HERFD XANES) and attenuated total reflectance infrared spectroscopy

Chapter 1
10
(ATR FT-IR). This combination of methods enables us to monitor the catalysts structure
(HERFD XANES), activity, reaction intermediates and adsorbates on the catalyst surface
(ATR FT-IR) under working conditions and thus allows us to establish structure-performance
relationships. Chapter 3 shows the design and feasibility of the in situ reactor cell. By using
this cell we aim to unravel which oxidation state of supported gold is active for the
hydrogenation of nitrobenzene, which is reported in Chapter 4. This chapter was achieved via
the collaboration with another PhD student, Christiane Kartusch. Additionally, we were
interested in how the support influences the reaction mechanism. Chapter 5 describes the
impact of the variation of the support on the reaction route of the hydrogenation reaction.
Chapter 6 shows the effect of the surface modification of supported Pt catalysts by organic
thiols. A unique and complete change in selectivity for the hydrogenation of 4-nitrostyrene
was observed. Chapter 7 explains the remarkable different reaction selectivities. Chapter 8
applies what we learned about surface modification for tuning chemoselectivity to
asymmetric catalysis over supported Pt catalysts. Chapter 9 gives an overall conclusion of
this dissertation and shows an outlook how the determination of mechanism and active sites
can be employed to rationally improve the performance of heterogeneous catalysts.

Chapter 2
Methods and experimental
Chapter 2
12
2.
2.1. Supported noble metal catalysts
Supported noble metal catalysts in various shapes are the most applied systems in industrial
heterogeneous catalyzed reactions for the production of bulk and fine chemicals.1,2 As
heterogeneous catalyzed reactions take place on the surface of the catalyst, supporting noble
metals (e.g. Au, Ni, Pd, Pt, Rh etc.) on metal oxide supports (e.g. Al2O3, CeO2, Fe2O3, SiO2,
TiO2 etc.) leads to a higher surface to bulk ratio (dispersion) of the material and thus a higher
availability of active sites per gram of the precious noble metal. The most common
preparation methods for supported noble metal catalysts are co-precipitation, deposition-
precipitation and impregnation. As deposition-precipitation and impregnation were used in
this work they will be explained in more detail in the following.
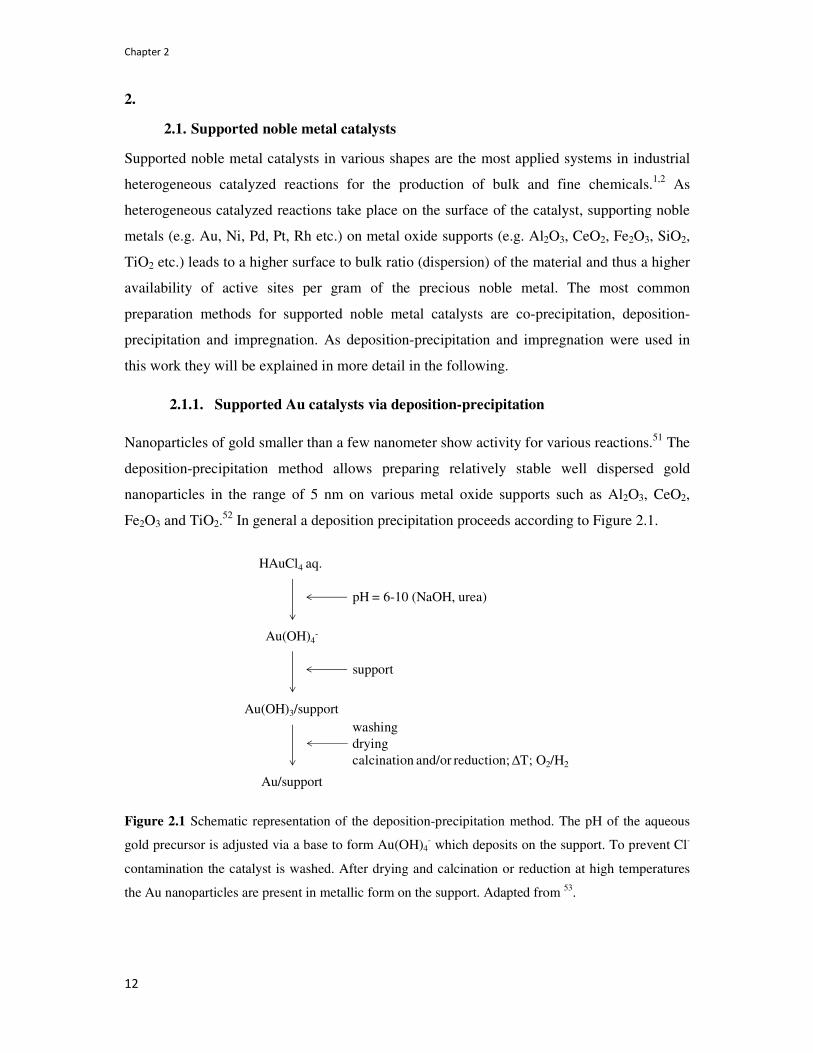
2.1.1. Supported Au catalysts via deposition-precipitation
Nanoparticles of gold smaller than a few nanometer show activity for various reactions.51 The
deposition-precipitation method allows preparing relatively stable well dispersed gold
nanoparticles in the range of 5 nm on various metal oxide supports such as Al2O3, CeO2,
Fe2O3 and TiO2.52 In general a deposition precipitation proceeds according to Figure 2.1.
Figure 2.1 Schematic representation of the deposition-precipitation method. The pH of the aqueous
gold precursor is adjusted via a base to form Au(OH)4- which deposits on the support. To prevent Cl-
contamination the catalyst is washed. After drying and calcination or reduction at high temperatures
the Au nanoparticles are present in metallic form on the support. Adapted from 53.
washingdryingcalcination and/or reduction; ∆T; O2/H2
HAuCl4 aq.
pH = 6-10 (NaOH, urea)
Au(OH)4-
support
Au(OH)3/support
Au/support

Methods and experimental
13
An aqueous solution of tetrachloroauric acid is used as a precursor and is mixed with the
support at high pH. After deposition of the Au(OH)3 species the catalyst precursor is washed,
dried and calcined. After calcination or reduction gold is present as metallic nanoparticles.
Initially NaOH was used to adjust the pH of the aqueous solution53, by changing to urea a
higher Au loading could be achieved as all gold from the liquid phase deposits on the
support.54 When urea is used for adjusting the pH this method is referred to as deposition-
precipitation with urea (DPU).55 For preparation of Au/SiO2 or Au/C catalysts the deposition-
precipitation cannot be employed as the isoelectric point of these supports are too low (< 5) to
yield strong interaction with the hydroxides of the Au precursor.56
All gold catalyst used in chapter 3, 4 and 5 were synthesized by deposition-precipitation of
gold onto the surface of the support using urea according to 54. Prior to synthesis, the supports
were calcined at 500 °C to remove all residuals. In a teflon container, the support (3 g; CeO2
MicroCoating Technologies, respectively TiO2 P25 Acros) was dissolved in water (300 mL)
containing urea (0.9 g). The gold precursor HAuCl4·3H2O (59.97 mg; Au: 49 %, 99.9 %
metal basis, ABCR-Chemicals) was added to this solution. Subsequently, the mixture was
stirred at 80 °C for 16 h under the exclusion of light. The precipitate was filtered, washed
three times with water to prevent Cl- contamination, and dried in vacuum over night. The
resulting catalysts were referred to as “as-prepared”. All as-prepared catalysts were heated to
the corresponding reduction temperature (60 °C for Au/TiO2 catalysts, 300 °C for Au/CeO2
catalysts) in a flow of 100 ml min-1 5 % H2/He (v/v) at a rate of 2 °C min-1 and kept at that
temperature for 2 h. Subsequently, the catalyst was cooled down to room temperature in the
same flow. Special pretreatment procedures of the supported Au catalysts to investigate
performance will be described in detail in the experimental section of the corresponding
chapters.
2.1.2. Supported Pt catalysts via impregnation
Impregnation of high surface area porous supports is the easiest method to prepare supported
noble metal catalysts. In general, noble metal precursors with thermally instable anions are
chosen, such as nitrates, acetates, carbonates and hydroxides.57 The support is mixed in an
aqueous solution with the dissolved precursor at certain temperature, concentration and time.
A variation of this method is the incipient wetness impregnation. Here the support is mixed
with the dissolved metal precursor such that the volume of the solvent corresponds exactly to
the pore volume of the support. Figure 2.2 shows the schematic process of the incipient
wetness impregnation method.
Chapter 2
14
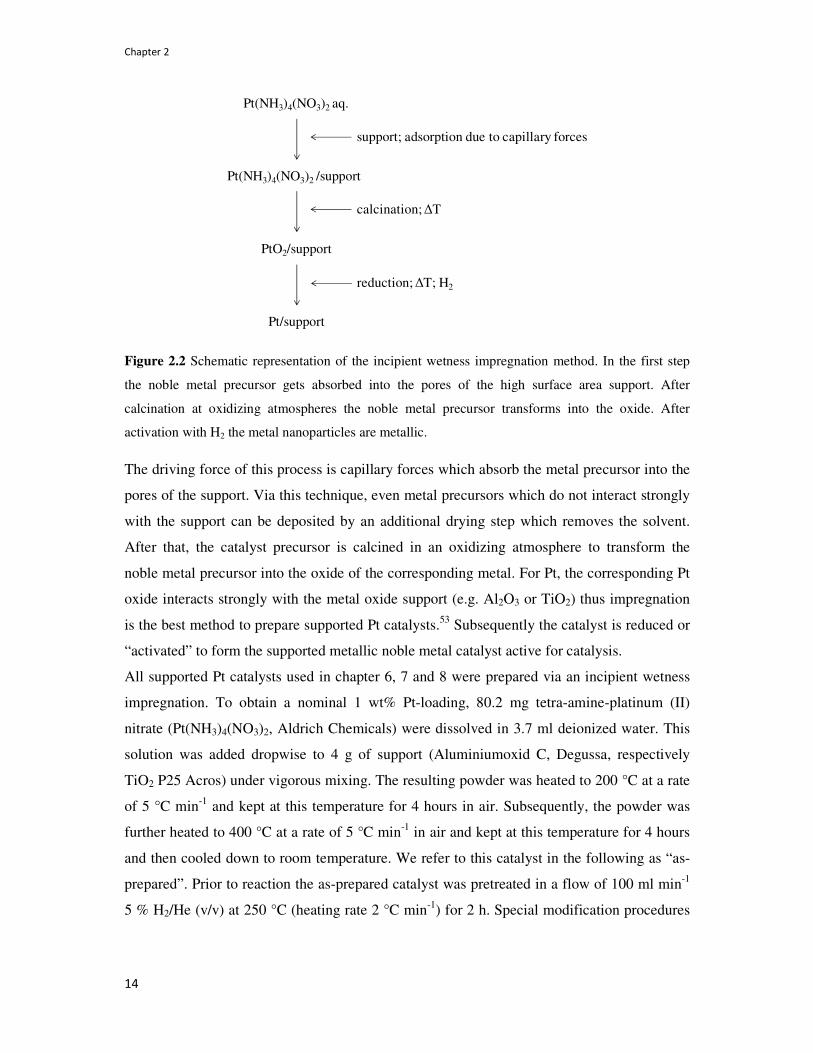
Figure 2.2 Schematic representation of the incipient wetness impregnation method. In the first step
the noble metal precursor gets absorbed into the pores of the high surface area support. After
calcination at oxidizing atmospheres the noble metal precursor transforms into the oxide. After
activation with H2 the metal nanoparticles are metallic.
The driving force of this process is capillary forces which absorb the metal precursor into the
pores of the support. Via this technique, even metal precursors which do not interact strongly
with the support can be deposited by an additional drying step which removes the solvent.
After that, the catalyst precursor is calcined in an oxidizing atmosphere to transform the
noble metal precursor into the oxide of the corresponding metal. For Pt, the corresponding Pt
oxide interacts strongly with the metal oxide support (e.g. Al2O3 or TiO2) thus impregnation
is the best method to prepare supported Pt catalysts.53 Subsequently the catalyst is reduced or
“activated” to form the supported metallic noble metal catalyst active for catalysis.
All supported Pt catalysts used in chapter 6, 7 and 8 were prepared via an incipient wetness
impregnation. To obtain a nominal 1 wt% Pt-loading, 80.2 mg tetra-amine-platinum (II)
nitrate (Pt(NH3)4(NO3)2, Aldrich Chemicals) were dissolved in 3.7 ml deionized water. This
solution was added dropwise to 4 g of support (Aluminiumoxid C, Degussa, respectively
TiO2 P25 Acros) under vigorous mixing. The resulting powder was heated to 200 °C at a rate
of 5 °C min-1 and kept at this temperature for 4 hours in air. Subsequently, the powder was
further heated to 400 °C at a rate of 5 °C min-1 in air and kept at this temperature for 4 hours
and then cooled down to room temperature. We refer to this catalyst in the following as “as-
prepared”. Prior to reaction the as-prepared catalyst was pretreated in a flow of 100 ml min-1
5 % H2/He (v/v) at 250 °C (heating rate 2 °C min-1) for 2 h. Special modification procedures
reduction; ∆T; H2
Pt(NH3)4(NO3)2 aq.
support; adsorption due to capillary forces
Pt(NH3)4(NO3)2 /support
calcination; ∆T
PtO2/support
Pt/support

Methods and experimental
15
of the supported Pt catalysts in order to enhance either chemo- or enantioselectivity will be
described in detail in the experimental section of the corresponding chapters.
2.2. Kinetic experiments
Chemical reactions at industrial levels are performed in the gas and liquid phase. Reactions in
which one of the reactants cannot be, or only at very harsh conditions, vaporized to the gas
phase are generally executed in the liquid phase, which is often the case for the production of
fine chemicals. The production of aniline and substituted analogues via hydrogenation is
generally performed in the liquid phase as the solvent affects the activity and selectivity of
catalysts.20 At the laboratory scale these reactions are performed in stainless steel autoclaves
which can withstand high pressure (200 bars) and high temperature (250 °C). In this work
kinetic experiments were performed in Premex 50 ml stainless steel autoclaves in Chapters 5,
6, 7 and 8. A typical reaction composition consisted of toluene (25 g), internal standard (120
mg; mesitylene, puriss > 99.0 %, Sigma–Aldrich), an appropriate amount of catalyst, and
substrate. This mixture was filled into an autoclave and purged three times after sealing by
using H2 (5 bars) and while stirring. The autoclave was then pressurized to 10 bars by using
H2 and heated up to the corresponding reaction temperature under constant stirring, during
which the reaction started. Samples were taken at fixed time intervals by means of a sample
tube. The samples were filtered and analyzed by gas chromatography (GC) using an Agilent
7820A with an apolar 30 m HP 5 MS column. The temperature program consisted of 20 °C
min-1 heating steps from 80–300 °C at a split ratio of 10/1. In Chapters 6 and 7 the split ratio
had to be increased to 60/1 to separate the peaks of the different reaction species. Gas
chromatography is an easy reliable technique and can always be employed when the sample
can be vaporized without decomposition.
2.2.1. Chiral columns for gas chromatography
In Chapter 8 chiral capillary columns were employed to separate the enantiomeres of the
asymmetric C=C double bond hydrogenation. State of the art chiral columns in general
contain functionalized cyclodextrines which are responsible for the separation.
Cyclodextrines form chiral, cyclic cones containing D(+)-glucose residues bonded through a
(1-4) glycosidic linkage. There are 3 types of cyclodextrines employed for chiral columns: α-,
β- and γ-cyclodextrine which contain 6, 7 and 8 glucose residues and thus yield different
diameters of 4.7-5.2 Å, 6.0-6.5 Å and 7.5-8.5 Å respectively.58 Functionalization of the OH
groups of the glucose units can yield different properties and thus a variety of columns exist

Chapter 2
16
customized for various separation challenges. The key factor of a chiral column is the
separation factor α which is given by:
� � ��������� ������������ � ���� ������������ ������������ � ���� ��� 2.2-1
The separation factor α should be greater than 1 to achieve a reasonable separation of the two
enantiomeres. The separation factor can be influenced by 3 parameters:
• Oven isothermal temperature: the lower the oven temperature the better the
separation
• Cyclodextrine content: the higher the cyclodextrine content the better the
separation
• Column diameter: the smaller the column diameter the better the separation
The enantiomeric excess was calculated via the ratio of the peak area of the two
enantiomeres. In this work a Cyclosyl-B column was used in an Agilent 7890A GC. The
separation was done at an isothermal temperature of 40 °C.
2.2.2. Data processing for kinetic measurements
To relate the GC areas to the corresponding moles of each reaction species a constant amount
of mesitylene acting as internal standard (IS) was added to each experiment. For every
reaction species (substrate, intermediate and product) a calibration row was established by
increasing the concentration of the corresponding species while maintaining the internal
standard concentration. By plotting the ratio of the molar amount of the species Sa, n(Sa), and
the molar amount of the internal standard IS, n(IS), over the ratio of the GC areas of the
corresponding species, A(Sa), and the area of the internal standard, A(IS), a calibration factor
fc is obtained by the slope of linear regression. Figure 2.3 shows an example for a calibration
row of nitrobenzene.

Methods and experimental
17
Figure 2.3 Example for GC calibration for nitrobenzene (NB). The calibration factor fc corresponds to
the slope of the linear regression.
This calibration factor fc is used to relate the GC area at a certain time t of a certain species a,
A(Sa)t, to its molar quantity n(Sa)t according to:
������ � �� � ����� � ������������ 2.2-2
An important factor in batch mode liquid phase reactions is the carbon balance or C-balance.
This value resembles the sum of all molar quantities for the different reaction species, i.e.
substrate, intermediates and products (a,b,c…x) at a certain time t related to the molar
quantity of the substrate before the reaction n(Sub)t0 according to:
� � ������� � ������������…������ ���! " � �!! 2.2-3
The C-balance is an indicator whether reaction species were lost during the reaction
(evaporation, strong adsorption on the catalyst etc.) or cannot be detected via GC in the liquid
phase. In this work only results with a C-balance greater than 95 % were taken into account.
Once the molar quantities and the C-balance are established the conversion of the substrate,
Conv(Sub), at time point t can be calculated according to:
���#�� �� � ���� ���! ��� ������ ���! " � �!! 2.2-4
whereas n(Sub)t0 resembles the molar quantity of the substrate before the reaction. The rate of
reaction at a certain time point t based on the conversion of the substrate in mmol gcat-1 s-1 was
established according to:
������� � ��� ���! ��� �����$!%�&��� 2.2-5
2.0 2.5 3.0 3.5 4.0 4.5
3.0
3.5
4.0
4.5
5.0
5.5
6.0
6.5
7.0
7.5
n(S
)/n
(IS
)
A(S)/A(IS)
y = 1.6x - 0.19
R2 = 0.9973
Chapter 2
18
For the rate of formation of intermediate or product a respectively the same equation was
used except that (nat0-nat) was employed. For the chemoselective hydrogenations in Chapter 6
and 7 the selectivity Sela towards a certain product a in relation to all the other intermediates
and products b, c, … x was calculated according to:
���� � � ����������…��" � �!! 2.2-6
All these factors (C-balance, rate, selectivity) were used to compare the performance of the
catalysts used in this work and to establish structure-performance relationships.
2.3. Transmission electron microscopy
Transmission electron microscopy (TEM) evolved to a powerful tool in material science and
improvement of TEM equipment is an active field of research. The breakthrough of the
aberration correction leads to a detection limit in the sub Å regime. Improvement of electron
microscopy also lead to different measurement modes. State of the art electron microscopy is
scanning transmission electron microscopy (STEM) where a focused coherent beam is
scanned over a defined area of the sample. In catalysis the electron microscopy technique is
used to investigate e.g. the morphology of zeolite crystals and most important the elucidation
of the particle size, morphology of the particles and stability of supported noble metal
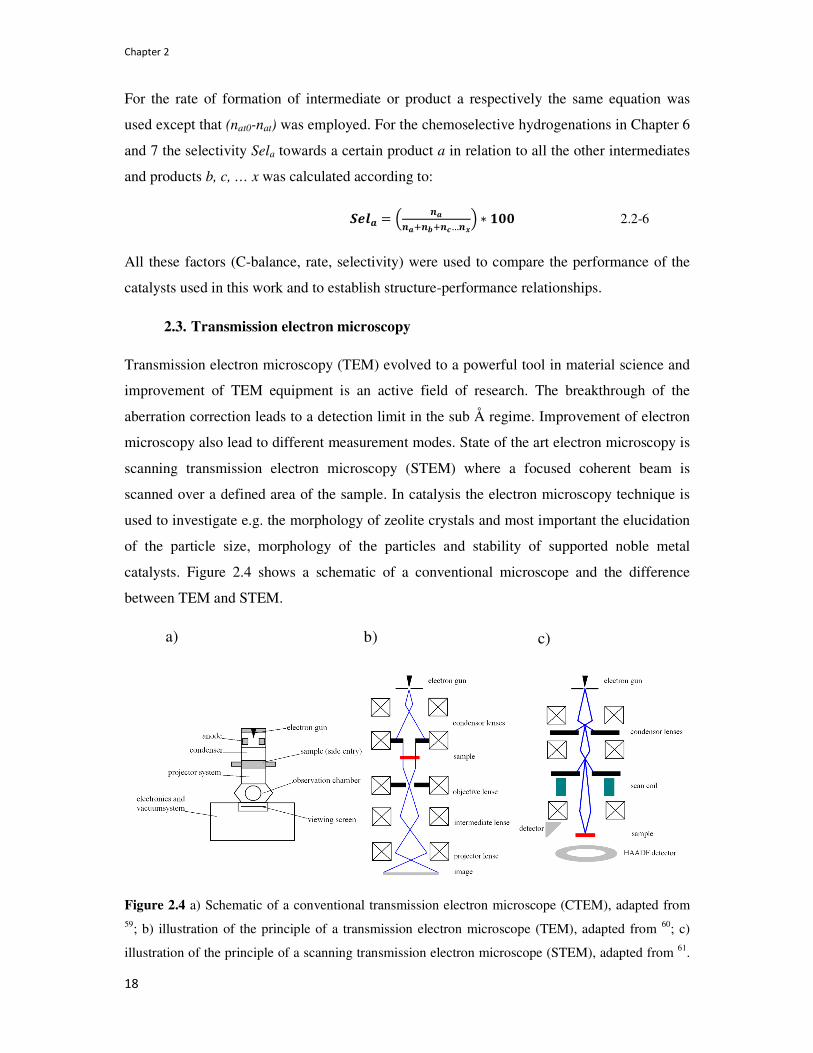
catalysts. Figure 2.4 shows a schematic of a conventional microscope and the difference
between TEM and STEM.
Figure 2.4 a) Schematic of a conventional transmission electron microscope (CTEM), adapted from 59; b) illustration of the principle of a transmission electron microscope (TEM), adapted from 60; c)
illustration of the principle of a scanning transmission electron microscope (STEM), adapted from 61.
a) b) c)

Methods and experimental
19
The electron beam is generated via “electron guns” made from W- or LaB6 cathodes
generating electrons either by heating (thermoionic guns) or by applying an extraction
voltage (field emission guns). The electron beam gets accelerated towards the anode and
channeled via a condenser system towards the sample. A projector system allows either
imaging or diffraction whereas the image or diffraction pattern is projected onto a viewing
screen. The contrast visible in TEM pictures does not originate from a loss of intensity of the
electron beam as the samples in most cases are not thicker than 100 Å, but due to a phase
difference (to the primary beam) caused by the interaction of the electron beam with the
atoms of the sample.59 Here the nature and the thickness of the sample play an important role:
the scattering is higher when many atoms or heavy atoms interact with the primary electron
beam. An objective aperture tunes the contrast via interference of the diffracted beam and the
primary beam. Is only the primary beam taken into account the image results from a bright
field image; if only one or more diffracted beams are taken into account the mode is called
dark field image. In a transmission electron microscope a large area of the sample is
illuminated and the magnification of the image is achieved via a projector system after the
sample, thus the whole image is recorded at once (Figure 2.4 b). A disadvantage of TEM is
that image contrast is a function of sample thickness and focus and thus no unique image
represents a “simple” representation of the sample. In contrast to TEM the focus of the STEM
electron beam is done before the sample to form a 1 Å probe (Figure 2.4 c). This beam is then
scanned via scanning coils over a defined small area of the sample. The scattered electrons
are then collected via the simultaneous combination of various detectors to form the image as
a function of the position in a straight forward way. A high-angle annular dark field
(HAADF) detector collects electrons scattered at high angles. According to Rutherford high
Z elements scatter to high angles more strongly than light ones and thus the representing
image is achieved by Z contrast. The combination of STEM and energy dispersive X-ray
spectroscopy (EDXS), electron energy-loss spectroscopy (EELS) respectively is a powerful
tool to investigate structure morphology and composition as function of position of e.g.
supported noble metal catalysts at the nano scale.
In this work electron microscopy was used to determine the particle sizes of all supported
metal catalysts used in this work. Electron microscopy measurements were performed on a
HD2700CS (Hitachi, aberrationcorrected dedicated scanning transmission electron
microscope (STEM), cold FEG, 200 kV) or a Tecnai F30 ST (FEI, FEG, 300 kV). The high-
resolution capability of HD2700CS 27 (shown to be better than 0.1 nm) is due to a probe
corrector (CEOS) that is incorporated in the microscope column between the condenser lens

Chapter 2
20
and the probe-forming objective lens so that a beam diameter of ca. 0.1 nm can be achieved.62
A special bright field setting allows one to record highly-resolved phase-contrast STEM (PC-
STEM) images (similar to HRTEM) without delocalization artifacts. The catalyst was
suspended in ethanol and a drop of the suspension was supported on a perforated copper grid
by evaporation of the solvent. To determine the particle size distribution, TEM pictures were
analyzed with the Image J software and 200 particles distributed over various micrographs
were taken into account for each measurement.
2.4. Infrared spectroscopy
Infrared (IR) spectroscopy is a powerful tool which is extensively used in all fields of
chemistry. Especially in catalysis infrared spectroscopy, as a non invasive technique, is
applied for catalysts characterization as well as for following the reaction under working
conditions as characteristic IR vibrations can be used to distinguish substrates, intermediates
and products. The infrared region (14300 cm-1 to 100 cm-1) which is located between the
ultraviolet-visible and the microwave region of the electromagnetic spectrum is commonly
divided in three sub-categories: near-, mid- and far-IR are found in the regions of 14300-4000
cm-1, 4000-400 cm-1 and 400-100 cm-1 respectively. For general application the mid-IR
region is used as most organic chemicals have characteristic vibration features in this range
and a variety of commercial available spectrometers exist. Several experimentally different
applications of IR spectroscopy exist which are tailored to the corresponding application
among them transmission Fourier transform infrared spectroscopy (FT-IR), diffuse
reflectance infrared Fourier transform spectroscopy (DRIFTS) and attenuated total
reflectance infrared (ATR-IR) spectroscopy. The intensity of the IR beam before and after the
sample are given by Lambert-Beer´s law: the intensity I0 of the incident beam diminishes
exponentially over the path length l depending on the sample concentration [J] and ε the
molar absorption coefficient to the intensity I according to:
��& ��! � �' ()*� 2.4-1
In spectroscopy the term “absorption” (A) is more general, relates to A = ε[J]l and is
dimension less as the unit of ε is L mol-1 cm-1. The ratio ++, is referred to as “transmission” (T)
and relates to A as log 0 � �1. As the concentration [J] is part of Lambert Beer´s law, IR can
be used for qualitative as well as for quantitative analysis but requires calibration.

Methods and experimental
21
In this work transmission FT-IR and ATR IR spectroscopy were used in Chapters 3, 4, 6 and
7 and thus will be explained in more detail in the following.
2.4.1. Transmission Fourier transform spectroscopy
State of the art commercially available transmission Fourier transform spectrometers apply
Fourier transformation for detection and analysis of spectra, which enhances the detection
limit compared to spectrometers with monochromators, as the entire emitted radiation of the
sample is used for detection.63 For transmission FT-IR the sample is placed between the
incident IR beam, which is modulated via a Michelson-interferometer, and the detector. A
Michelson interferometer divides the incident IR beam into two beams, introduces a path
difference p so that destructive and constructive interference can occur and recombines the
beams.64 Doing so, an interferometer transforms a certain wavenumber ν of the incident beam
into a variation of the intensity of the exiting beam and thus the different wavenumbers of a
coherent source become distinguishable according to:
��2� � 3 ��4�∞
! �� 5 ��%�642��4 2.4-2
Fourier transformation of the measured I(p) yields the spectrum I(ν) according to:
��4� � 73 8��2� � �� ��!�9∞
! ��%�642�2 2.4-3
Transmission IR is always applied when the sample itself or the supporting material is
transparent for the IR beam so that good spectrum resolution can be achieved within a
reasonable time. For recording transmission IR spectra the sample is generally pressed to
self-supporting or KBr-supported pellets and then mounted via various experimental cells
into the IR beam.
In this work transmission FT-IR spectroscopy was used to characterize the organic thiol
modified supported Pt catalysts in chapter 6 and 7. Fourier transform infrared measurements
were recorded on a Bruker Equinox 55 FT-IR spectrometer. For that, pellets of 3 mg of the
corresponding catalyst mixed with 97 mg KBr were pressed at 5 tons for 1 min. Prior to the
measurement, a background spectrum in air was recorded with 50 scans per spectrum.
Samples were recorded between ν = 4000 and 1000 cm-1 for the supported Pt catalysts with a
resolution of 1 cm-1. A total of 1000 scans per spectrum were averaged. The spectrum of the
modified supported Pt catalyst was background corrected with the spectrum of the

Chapter 2
22
unmodified catalyst and a constant air background. The raw data was smoothed by 25 points
using the OPUS software.
2.4.2. Attenuated total reflectance infrared spectroscopy
Attenuated total reflectance infrared spectroscopy (ATR IR) is one of the most applied
techniques where the sample (solid or liquid) is placed in close contact to a sensing device (in
most cases a crystal). ATR IR can be applied without sample preparation or dilution and even
in case the sample itself allows no transmission of IR beams. By coating an ATR crystal it is
even possible to measure adsorbents on the catalyst surface in the liquid phase as well as in
the gas phase.29,65,66
The ATR IR concept can be explained by total reflection. Figure 2.5 illustrates the path of
radiation from a dense optical medium 1 to the rare optical medium 2.
Figure 2.5 Representation of Snell´s law for radiation passing from an optical dense medium n1 to a
optical rare medium n2. Incident beams at or above the critical angel θc do not obey Snell´s law but
reflect internally in the rare optical medium. Adapted from 67.
The Snell´s law describes the angle at which radiation is refracted by passing from one
transparent medium to another with different refractive indices:
�� %��:� � �� %��:� 2.4-4
with n1 and n2 as the refractive index of medium 1 and 2 and θ1 as the angle of incidence and
θ2 as the angle of refraction with respect to the normal to the interface. If the refractive index
Methods and experimental
23
of medium 1 is bigger than the index of medium 2, n1 > n2, then the former is the dense
optical medium and the latter the rare optical medium. If radiation passes from an optical
dense medium 1 to an optical rare medium 2, the incident angle θ1 will always be smaller than
θ2. If the angle of incidence will be further increased the critical angle θc will be reached
where according to Snell´s law the refracted angle θ2 will eventually reach 90 °, i.e. refracted
parallel to the media interface. In practice only incident angles below θc obey Snell´s law,
whereas incident radiation ≥ θc will internally reflect in the optical dense medium with the
same angle as the incident angle. The critical angle θc can be easily calculated by knowing
the refractive indices of medium 1 and 2 according to:
:� � %�� � ���� 2.4-5
Materials that show internal reflection are known as internal reflection elements (IRE). At the
point of the reflection the electrical field of the IR beam´s photons extends perpendicular to
the beam direction into the rare optical medium whereas the IR beam is confined to the IRE.
The field in the optical rare medium is also referred to as evanescence wave and
exponentially decays over distance z according to:
; � ;!� <= 2.4-6
where E0 is the strength of the electrical field at the surface and γ a constant. The strength of
E (around 1/e of E0) which effectively interacts with the optical rare medium containing the
sample is known as the penetration depth dp and directly depends on the wavelength of the
incident IR beam. The penetration depth dp can be calculated via the incident wavelength λ of
the IR beam in a vacuum, the refractive indices n1 and n2 and the angle of incidence θ1
according to:
�2 � >�6��?%���:� �������
2.4-7
As the penetration depth is responsible for the interaction of the IR beam and the sample and
thus the performance of the ATR IR device the material of the IRE which defines the
refractive index has to be chosen accordingly. Most IREs are made of zinc sulfide (ZnS),
germanium (Ge) or diamond because all these materials have a high refractive index n1. ATR
IR devices are available in various experimental setups such as vertical variable angle
attenuated total reflection (VATR), horizontal attenuated total reflection (HATR), in situ
cylindrical internal reflection cell for liquid evaluation (CIRCLE) and DiComp sensors. In
Chapter 2
24
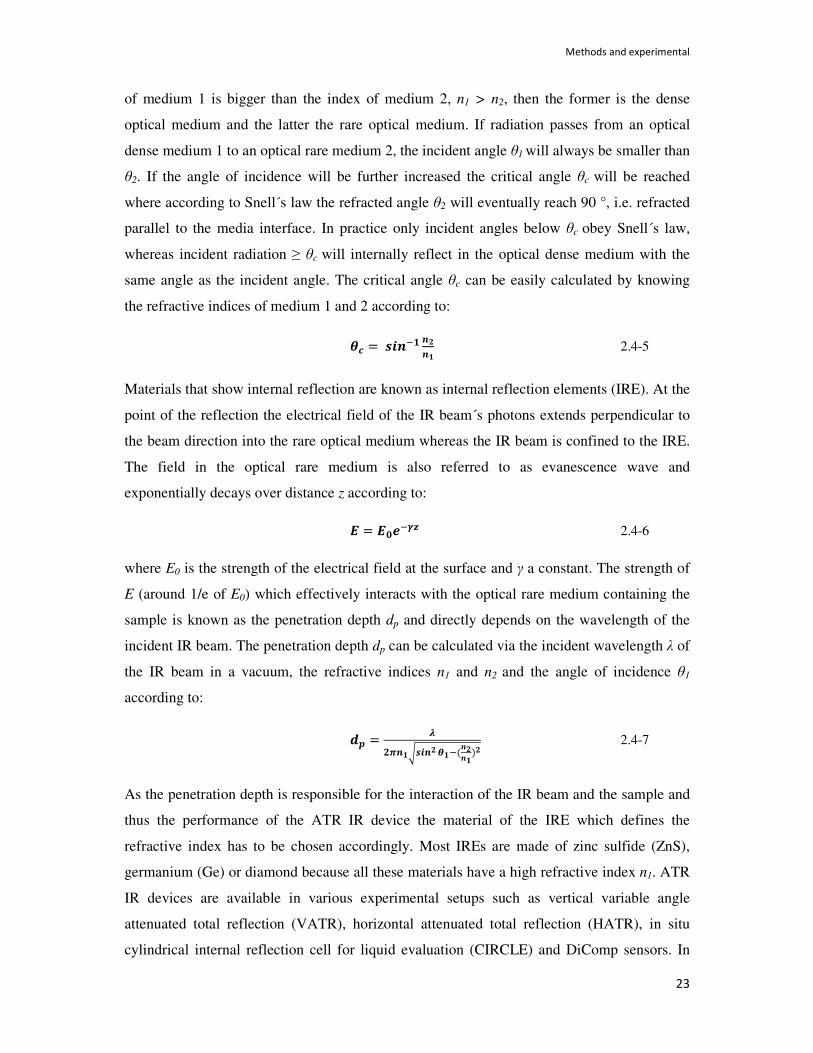
this work a DiComp probe connected to the spectrometer via a fiber optic was used as this
setup can be operated remotely (from spectrometer) under in situ conditions at high pressure,
temperature and realistic reaction conditions in the liquid phase as the IRE is made of
diamond. Figure 2.6 shows a vertical cut of a DiComp probe.
Figure 2.6 Vertical cut through a DiComp probe: The IR beam is channeled from the spectrometer
via fiber optics and a supporting ZnS crystal towards the diamond IRE. The beam is multiple reflected
in the diamond crystal and then guided back to the detector. The ZnS and diamond crystals are
contained in a stainless steel case. Adapted from 67.
The beam is channeled through a fiber optic from the detector through a ZnSe crystal to the
diamond IRE. As both materials have similar refractive indices (ZnS :2.2, diamond: 2.4) the
transmission from ZnS to the diamond IRE works with minimal refractive losses. The IR
beam is multiple reflected in the diamond IRE which is in direct contact with the sample. At
each point of reflection an evanescent wave interacts with the sample (red waves). The
advantage of multiple reflections is that the absorbance of the sample is much higher
compared to a single reflection and is employed for most commercial ATR IR devices.
Multiple reflections are achieved via the geometry of the IRE (e.g. parallelpiped or vertical
truncated triangular crystals). After passing the diamond IRE the IR beam is guided through
the ZnS crystal and via the fiber optic back to the detector. Directly below the diamond
crystal is a cavity filled with air, achieved via a cut in the ZnS crystal, so that the IR beam is
reflected only in the IRE.
In this work ATR IR was used in combination with a custom made in situ cell for pressurized
liquid phase reaction (see Chapter 3)68 in Chapters 3 and 4 to monitor the conversion of
nitrobenzene in situ by using a commercial ATR IR system from Mettler Toledo with a

Methods and experimental
25
DiComp optical fiber immersion probe attached to a ReactIR 45 spectrometer. One spectrum
per minute (average of 16 scans) was recorded, with a resolution of 2 cm-1 from ν = 2000 to
750 cm-1. Background spectra of the catalyst suspension were collected in toluene at
respective temperatures and subtracted via the ICIR software.
2.5. X-ray absorption spectroscopy
X-ray absorption spectroscopy (XAS) is a well established technique that allows to collect
electronic and structural properties in situ of catalytic reactions under working conditions.69
The combination of using hard X-rays (> 2500 eV) with suitable in situ cells is a powerful
tool to establish structure-performance relationships and help to identify active sites of a
heterogeneous catalyst. In X-ray absorption, a photon is absorbed by an atom initiating an
electron transition from the core state to empty states above the Fermi level. The core state
energy is unique for each element making XAS an element specific-method. By passing
through a material the incident energy I of the X-ray photons will decrease according to the
absorption properties of the material. The decrease dI of the photon intensity for a certain
path length dl through the material is given by
�� � �@�;���� 2.5-1
Where µ(E) resembles the linear absorption coefficient as a function of photon energy. By
integration of that one obtains the Lambert´s law (compare 2.4-1):
� � �!� @�;�� 2.5-2
A sharp rise in the absorption intensity will occur upon the absorption of the photon and the
excitation of the core electron. This sharp rise in intensity is referred to as the absorption edge
(Figure 2.7). The edges are named after the core state from where the electrons are excited.
Thus the K-edge reflects the excitation of a 1s core electron, the LIII, LII and LI edge the
excitation from 2p3/2, 2p1/2 and 2s core levels respectively. All excitations and transitions
obey the quantum mechanical selection rules, whereas transitions for which the orbital
quantum number of the final state differs from the initial state by 1 (∆L= ±1) and 2 (∆L= ±2)
are called dipole respectively quadrupole transitions. In general the dipole transitions are
more intense than quadrupole transitions. Thus p density of states (DOS) are probed at the K
and LI edges and d density of states can be probed at the LII and LIII edges. Figure 2.7 shows a
XAS spectrum of the Pt LIII edge.
Chapter 2
26
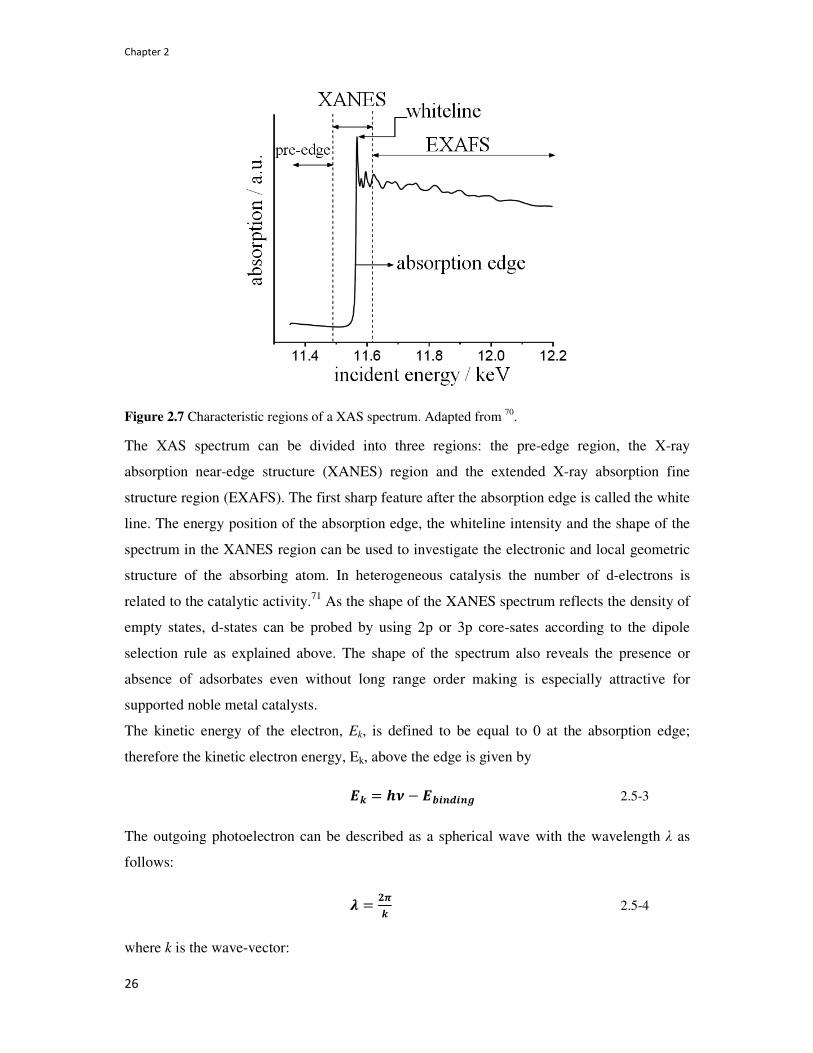
Figure 2.7 Characteristic regions of a XAS spectrum. Adapted from 70.
The XAS spectrum can be divided into three regions: the pre-edge region, the X-ray
absorption near-edge structure (XANES) region and the extended X-ray absorption fine
structure region (EXAFS). The first sharp feature after the absorption edge is called the white
line. The energy position of the absorption edge, the whiteline intensity and the shape of the
spectrum in the XANES region can be used to investigate the electronic and local geometric
structure of the absorbing atom. In heterogeneous catalysis the number of d-electrons is
related to the catalytic activity.71 As the shape of the XANES spectrum reflects the density of
empty states, d-states can be probed by using 2p or 3p core-sates according to the dipole
selection rule as explained above. The shape of the spectrum also reveals the presence or
absence of adsorbates even without long range order making is especially attractive for
supported noble metal catalysts.
The kinetic energy of the electron, Ek, is defined to be equal to 0 at the absorption edge;
therefore the kinetic electron energy, Ek, above the edge is given by
;A � B4 � ;������& 2.5-3
The outgoing photoelectron can be described as a spherical wave with the wavelength λ as
follows:
> � �6A 2.5-4
where k is the wave-vector:

Methods and experimental
27
A � ?�C6�B� " DB4 5 ;! � ;��&�E 2.5-5
with m the electron mass and h Planck´s constant. The transition probability of the
photoelectric effect is proportional to the linear absorption coefficient µ(E) and according to
Fermi´s Golden Rule a function of the initial- and finale-state wave function72
@�;� � �FG�H|�J�|KG�F�L�;� � ;� � B4� 2.5-6
where ê is the electric field polarization vector of the photon and r the coordinate vector of
the electron. This dipole approximation is only valid when the wavelength of the photons is
larger than the size of the absorbing atom.69 Two main parts the outgoing electron wave,
ψoutgoing, and the backscattered electron wave ψbackscattered contribute to the final wave function
ψf
G� � G� �&���& 5G���A%�������� 2.5-7
The fine structure in the XANES and EXAFS region are due to variation in the transition
probability as function of energy that arise from the interference between these final-state
wave functions.
2.5.1. High-energy resolution fluorescence detected X-ray absorption near edge
spectroscopy (HERFD XANES)
XAS is still an emerging field and new approaches lead to new applications in the field of
synchrotron based measurements. In conventional XAS, the transmitted photons or the
radiative and/or non-radiative decay of the sample is monitored as function of energy of the
incident photons. A disadvantage of conventional XAS is that the energy resolution is limited
to the life-time broadening of the core hole in the exited state resulting in broad features in
the spectra. This limitation can be circumvented by selectively detecting a fluorescence decay
channel. The fluorescence decay results in a final state that has a longer life-time and thus
less broadening, which leads to spectra with a higher energy resolution and sharper
features.73,74 Figure 2.8 shows a schematic representation of the life time broadening and the
HERFD XAS principle.
Chapter 2
28
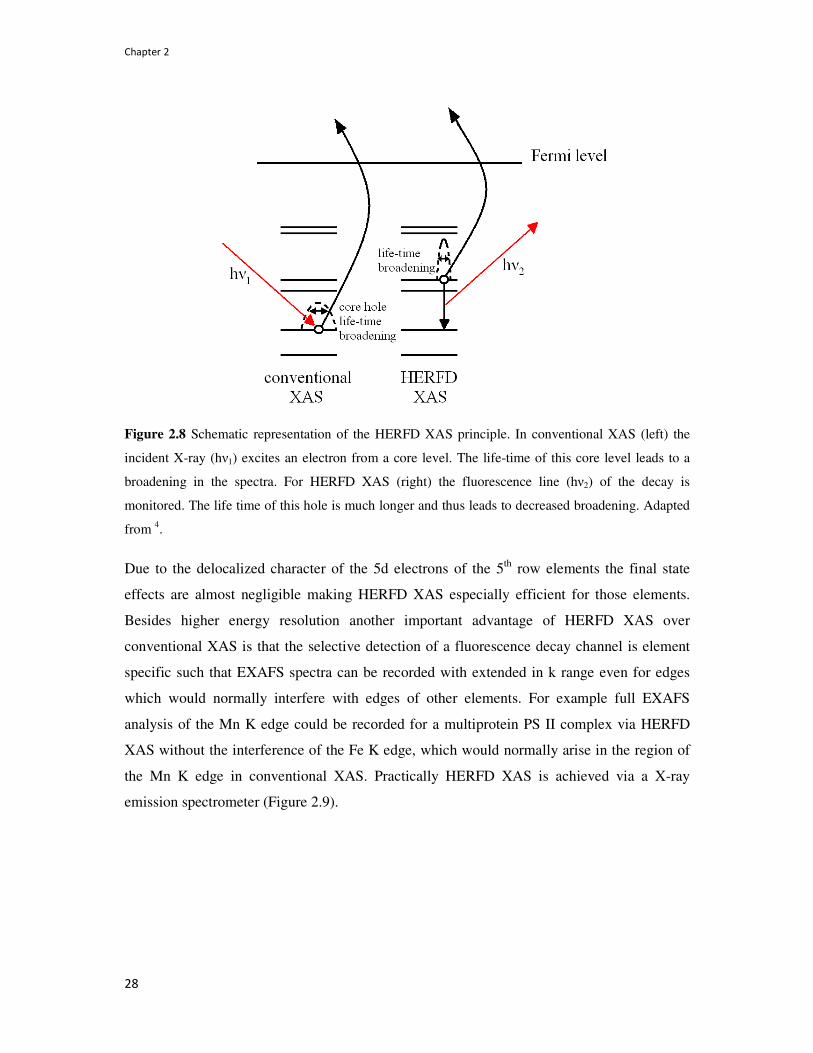
Figure 2.8 Schematic representation of the HERFD XAS principle. In conventional XAS (left) the
incident X-ray (hν1) excites an electron from a core level. The life-time of this core level leads to a
broadening in the spectra. For HERFD XAS (right) the fluorescence line (hν2) of the decay is
monitored. The life time of this hole is much longer and thus leads to decreased broadening. Adapted
from 4.
Due to the delocalized character of the 5d electrons of the 5th row elements the final state
effects are almost negligible making HERFD XAS especially efficient for those elements.
Besides higher energy resolution another important advantage of HERFD XAS over
conventional XAS is that the selective detection of a fluorescence decay channel is element
specific such that EXAFS spectra can be recorded with extended in k range even for edges
which would normally interfere with edges of other elements. For example full EXAFS
analysis of the Mn K edge could be recorded for a multiprotein PS II complex via HERFD
XAS without the interference of the Fe K edge, which would normally arise in the region of
the Mn K edge in conventional XAS. Practically HERFD XAS is achieved via a X-ray
emission spectrometer (Figure 2.9).
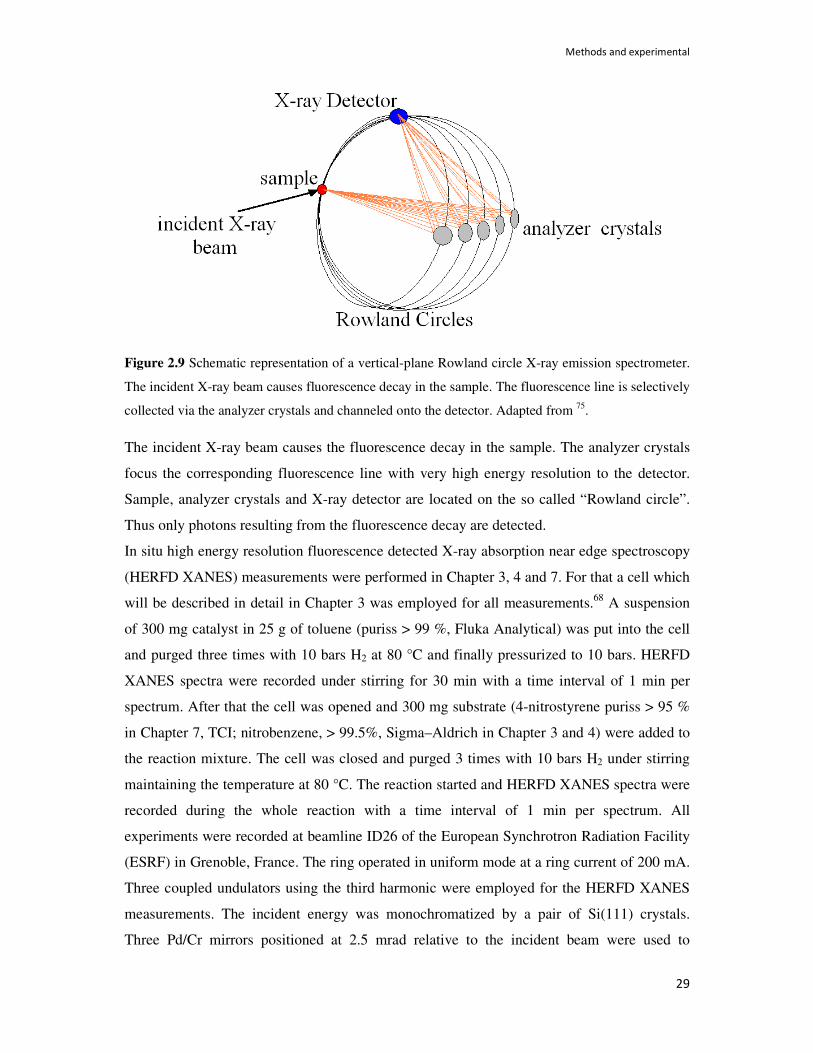
Methods and experimental
29
Figure 2.9 Schematic representation of a vertical-plane Rowland circle X-ray emission spectrometer.
The incident X-ray beam causes fluorescence decay in the sample. The fluorescence line is selectively
collected via the analyzer crystals and channeled onto the detector. Adapted from 75.
The incident X-ray beam causes the fluorescence decay in the sample. The analyzer crystals
focus the corresponding fluorescence line with very high energy resolution to the detector.
Sample, analyzer crystals and X-ray detector are located on the so called “Rowland circle”.
Thus only photons resulting from the fluorescence decay are detected.
In situ high energy resolution fluorescence detected X-ray absorption near edge spectroscopy
(HERFD XANES) measurements were performed in Chapter 3, 4 and 7. For that a cell which
will be described in detail in Chapter 3 was employed for all measurements.68 A suspension
of 300 mg catalyst in 25 g of toluene (puriss > 99 %, Fluka Analytical) was put into the cell
and purged three times with 10 bars H2 at 80 °C and finally pressurized to 10 bars. HERFD
XANES spectra were recorded under stirring for 30 min with a time interval of 1 min per
spectrum. After that the cell was opened and 300 mg substrate (4-nitrostyrene puriss > 95 %
in Chapter 7, TCI; nitrobenzene, > 99.5%, Sigma–Aldrich in Chapter 3 and 4) were added to
the reaction mixture. The cell was closed and purged 3 times with 10 bars H2 under stirring
maintaining the temperature at 80 °C. The reaction started and HERFD XANES spectra were
recorded during the whole reaction with a time interval of 1 min per spectrum. All
experiments were recorded at beamline ID26 of the European Synchrotron Radiation Facility
(ESRF) in Grenoble, France. The ring operated in uniform mode at a ring current of 200 mA.
Three coupled undulators using the third harmonic were employed for the HERFD XANES
measurements. The incident energy was monochromatized by a pair of Si(111) crystals.
Three Pd/Cr mirrors positioned at 2.5 mrad relative to the incident beam were used to

Chapter 2
30
suppress higher harmonics and focus the beam on the sample with a size of 600 µm
horizontal by 200 µm vertical. The estimated flux was 8x10¹³ photons s-1. HERFD XANES
spectra were measured by using a vertical-plane Rowland circle X-ray emission spectrometer
in combination with an avalanche photodiode (APD, Perkin Elmer).76 The scattering angle in
the horizontal plane was about 130°. The spectrometer was tuned to the Au Lα1 fluorescence
line (9713 eV) respectively the Pt Lα1 fluorescence line (9442 eV) using the [660] reflection
of four spherically bent Ge crystals, that is, working at a Bragg angle of about 80 °. A total
resolution of 2.1 for gold respectively 1.93 eV for Pt (FWHM) was obtained. The raw
HERFD XANES spectra were treated with the Athena software.77 After background
subtraction the raw data were normalized to the last point of each spectrum and 30 spectra
were averaged. Exposure of the slurry to X-rays did not cause any changes to the spectra and
thus beam damage did not occur. Special pretreatments or variations of the parameters
described above will be described in detail in the experimental section of the corresponding
chapter.

Chapter 3
Design and application of HERFD XAS/ATR FT-IR
batch reactor cell
(Makosch, M.; Kartusch, C.; Sa, J.; Duarte, R. B.; van Bokhoven, J. A.; Kvashnina, K.; Glatzel, P.; Fernandes, D. L. A.; Nachtegaal, M.; Kleymenov, E.; Szlachetko, J.; Neuhold, B.; Hungerbühler, K. Phys. Chem. Chem.
Phys. 2012, 14, 2164 - Reproduced by permission of the PCCP Owner Societies) [Martin Makosch performed the experiments, did the data analysis and wrote the manuscript]
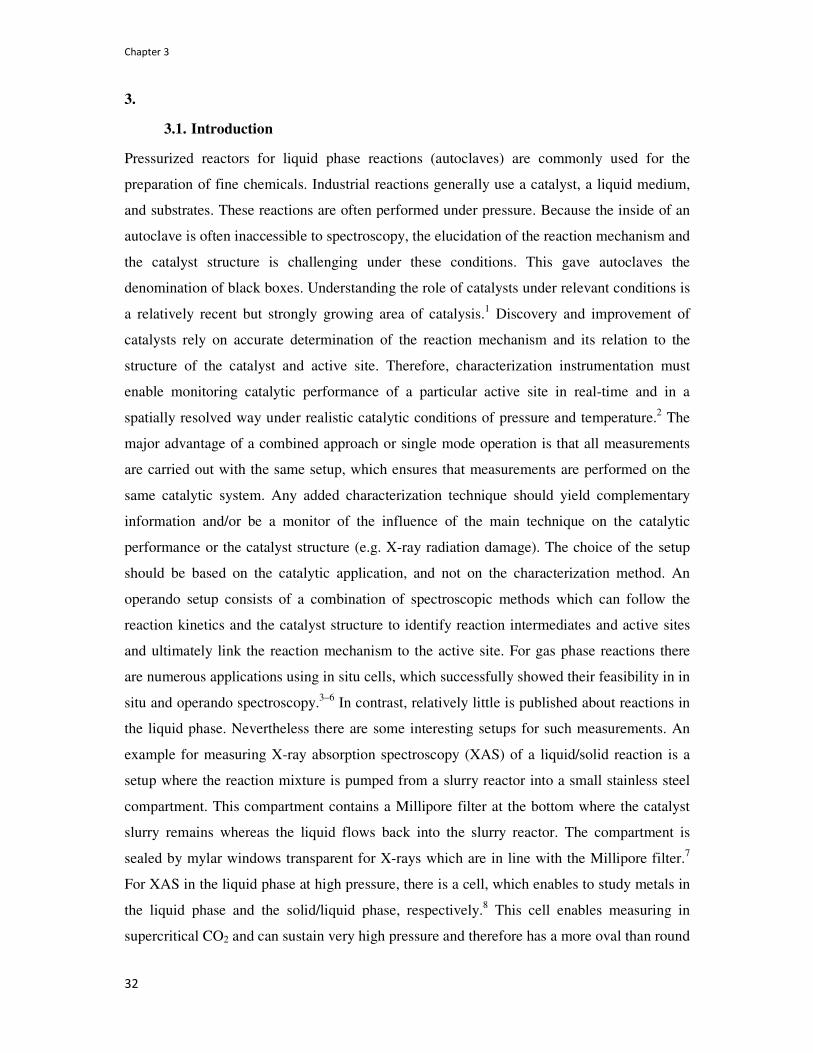
Chapter 3
32
3.
3.1. Introduction
Pressurized reactors for liquid phase reactions (autoclaves) are commonly used for the
preparation of fine chemicals. Industrial reactions generally use a catalyst, a liquid medium,
and substrates. These reactions are often performed under pressure. Because the inside of an
autoclave is often inaccessible to spectroscopy, the elucidation of the reaction mechanism and
the catalyst structure is challenging under these conditions. This gave autoclaves the
denomination of black boxes. Understanding the role of catalysts under relevant conditions is
a relatively recent but strongly growing area of catalysis.1 Discovery and improvement of
catalysts rely on accurate determination of the reaction mechanism and its relation to the
structure of the catalyst and active site. Therefore, characterization instrumentation must
enable monitoring catalytic performance of a particular active site in real-time and in a
spatially resolved way under realistic catalytic conditions of pressure and temperature.2 The
major advantage of a combined approach or single mode operation is that all measurements
are carried out with the same setup, which ensures that measurements are performed on the
same catalytic system. Any added characterization technique should yield complementary
information and/or be a monitor of the influence of the main technique on the catalytic
performance or the catalyst structure (e.g. X-ray radiation damage). The choice of the setup
should be based on the catalytic application, and not on the characterization method. An
operando setup consists of a combination of spectroscopic methods which can follow the
reaction kinetics and the catalyst structure to identify reaction intermediates and active sites
and ultimately link the reaction mechanism to the active site. For gas phase reactions there
are numerous applications using in situ cells, which successfully showed their feasibility in in
situ and operando spectroscopy.3–6 In contrast, relatively little is published about reactions in
the liquid phase. Nevertheless there are some interesting setups for such measurements. An
example for measuring X-ray absorption spectroscopy (XAS) of a liquid/solid reaction is a
setup where the reaction mixture is pumped from a slurry reactor into a small stainless steel
compartment. This compartment contains a Millipore filter at the bottom where the catalyst
slurry remains whereas the liquid flows back into the slurry reactor. The compartment is
sealed by mylar windows transparent for X-rays which are in line with the Millipore filter.7
For XAS in the liquid phase at high pressure, there is a cell, which enables to study metals in
the liquid phase and the solid/liquid phase, respectively.8 This cell enables measuring in
supercritical CO2 and can sustain very high pressure and therefore has a more oval than round

Design and application of HERFD XAS/ATR FT-IR batch reactor cell
33
shape characteristic of autoclave reactors. Another cell has been constructed for
measurements in supercritical media.9 The fixed bed reactor of the continuous flow cell lies
in a sapphire capillary which can sustain high pressures (400 bars) and temperatures (400 °C)
and is transparent for X-rays. Another example is an in situ infrared (IR) cell for
measurements in the liquid phase, where the reaction solution is forced through an IR
transparent capillary, which subsequently flows back into the mixing chamber.10 Recently, a
similar example of a recirculation reactor setup for operando fluorescence XAS was
presented.11 The reaction mixture is pumped from a stirred reactor vessel via a peristaltic
pump and a capillary through a small PTFE cell with Kapton windows and back into the
stirring vessel. All these approaches are however very different to working conditions of a
stirred slurry in an autoclave. Despite the importance of time-resolved studies in catalysis
(seconds or minutes timescale), XAS measurements in the liquid phase are often performed at
the steady-state or under differential kinetic conditions and relatively large amounts of
catalysts are used to increase the signal to noise ratio. To the best of our knowledge there is
no cell available that allows studying reactions in autoclaves with fluorescence XAS and
attenuated total reflectance Fourier transform infrared (ATR FT-IR) spectroscopy. We
describe a cell that combines XAS and ATR FT-IR for simultaneously measuring the catalyst
structure and the reaction mechanism in real time. The cell enables the determination of the
catalysts oxidation state, structure and catalytic performance under exact catalytic conditions
of pressure, temperature, and medium without interfering with the reaction itself and without
altering the basic reactor design. Via ATR FT-IR, which is well established to monitor
reactions in the liquid phase,12 we are able to follow the conversion of the educts to the
products and the occurrence of possible reaction intermediates in the liquid phase. Also,
modification of the setup will enable determining surface adsorbed intermediates at the
liquid/solid interphase, which provides information about the reaction kinetics and
mechanism.13 The cell is designed such that high energy resolution fluorescence detection
(HERFD XAS) is possible. Fluorescence detected absorption spectroscopy is used for dilute
samples.14 By detecting a fluorescence line with an instrumental energy bandwidth on the
order of the core hole lifetime broadening HERFD XAS spectra are obtained with a good
signal to background ratio with line sharpened absorption features.15–18 The combination of
HERFD XAS and ATR FT-IR is a powerful combination to establish structure–performance
relationships in liquid phase reactions. Both techniques allow performing time resolved
studies at a sub-minute timescale, which is crucial to understand dynamic changes in a
catalyst structure during pretreatment and reaction. The hydrogenation of nitrobenzene over

Chapter 3
34
gold catalysts, which will be used to show the feasibility of our cell, has drawn increased
attention since its discovery in 2006.19 Gold catalysts are an environmental friendly
alternative to common catalysts used for this reaction such as Pd and Pt supported on active
carbon or CaCO3, 20 because they do not require environmental harmful additives to achieve
high selectivity or low phenylhydroxylamine concentrations.21 The mechanism of this
reaction and the active site of the gold catalysts are still under debate. In this study we show
that during the hydrogenation of nitrobenzene over Au/CeO2 catalysts the main oxidation
state of the active metal is Au0.
3.2. Experimental section
For all experiments a 1 wt% Au/CeO2 catalyst was used, which was prepared via deposition
precipitation with urea.22 In a Teflon container, 3 g of the support (CeO2 MicroCoating
Technology) was dissolved in 300 ml of deionised water containing 0.9 g of urea. To this
solution 50.97 mg of HAuCl4.3H2O (Au: 49 %, 99.9 % metal basis, ABCR-Chemicals) was
added. Subsequently, the mixture was stirred for 16 h at 80 °C under the exclusion of light.
The precipitate was filtered, washed 3 times with water to prevent chloride contamination and
dried under vacuum overnight. The resulting catalysts are referred to as ‘‘as-prepared’’.
Reduction experiments were performed in toluene, isopropanol, cyclohexane, and
tetrahydrofuran. For each experiment, 300 mg of the ‘‘as-prepared’’ catalyst was put into the
reactor in 25 g of solvent. After that, the reactor was flushed 3 times with 5 bars helium and
finally pressurized to 5 bars helium. Subsequently the mixture was heated to 60 °C under
mechanical stirring at 1500 rpm. After reaching that temperature, the cell was flushed 3 times
with 10 bars H2 under mechanical stirring at 1500 rpm and finally pressurized to
10 bars H2. After introducing H2, HERFD XAS scans were recorded for 1 h with a time
interval of 1 min while heating. Hydrogenation of nitrobenzene was performed in water,
resulting in an emulsion with the substrate. For this experiment, the catalyst was pretreated
only in helium. A total of 300 mg of the ‘‘as-prepared’’ catalyst was heated to 60 °C in 5 bars
of helium and then kept at 60 °C in 5 bars He for 1 h. Subsequently, 300 mg of nitrobenzene
were added. The cell was flushed 3 times with 10 bars H2. After that the reaction mixture was
heated to 120 °C and maintained at that temperature in 10 bars H2 under constant mechanical
stirring at 1500 rpm. An ATR FT-IR DiComp optical fiber immersion probe (Mettler Toledo)
combined with a ReactIR 45 spectrometer was employed to monitor the evolution of the
nitrobenzene conversion. A time resolution of 1 min was achieved by averaging 16 spectra in
the range of 750–2000 cm-1. For background subtraction, spectra at the corresponding
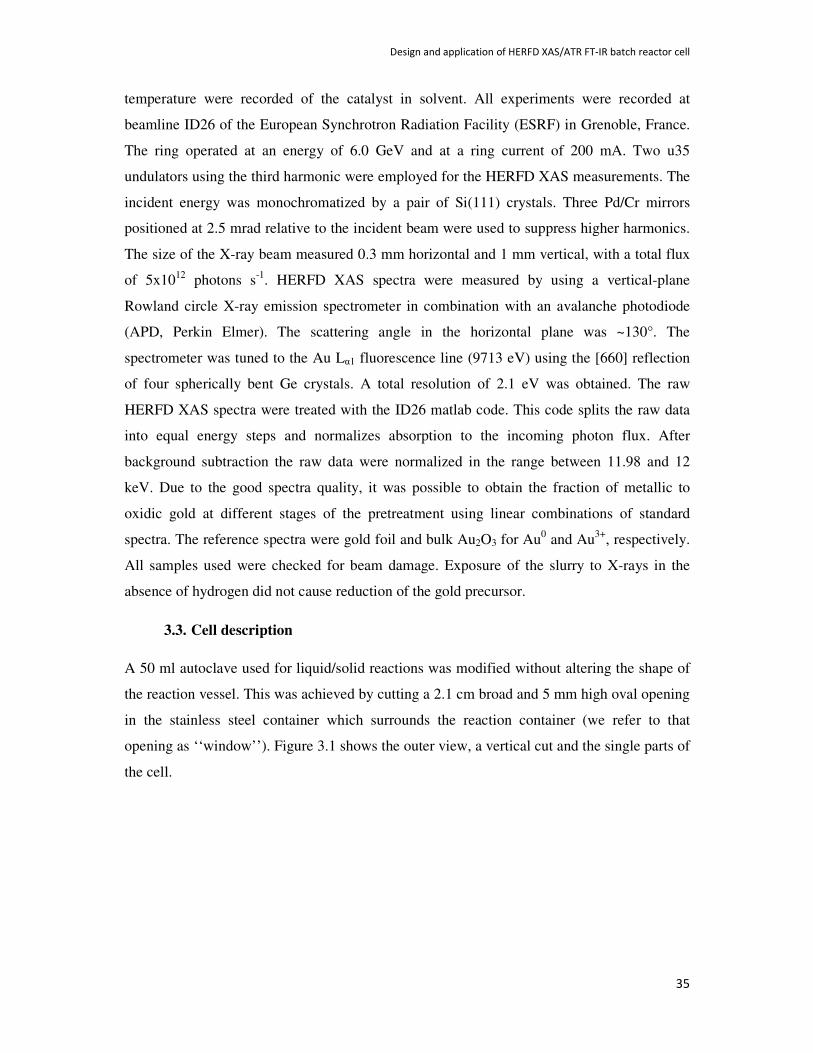
Design and application of HERFD XAS/ATR FT-IR batch reactor cell
35
temperature were recorded of the catalyst in solvent. All experiments were recorded at
beamline ID26 of the European Synchrotron Radiation Facility (ESRF) in Grenoble, France.
The ring operated at an energy of 6.0 GeV and at a ring current of 200 mA. Two u35
undulators using the third harmonic were employed for the HERFD XAS measurements. The
incident energy was monochromatized by a pair of Si(111) crystals. Three Pd/Cr mirrors
positioned at 2.5 mrad relative to the incident beam were used to suppress higher harmonics.
The size of the X-ray beam measured 0.3 mm horizontal and 1 mm vertical, with a total flux
of 5x10¹² photons s-1. HERFD XAS spectra were measured by using a vertical-plane
Rowland circle X-ray emission spectrometer in combination with an avalanche photodiode
(APD, Perkin Elmer). The scattering angle in the horizontal plane was ~130°. The
spectrometer was tuned to the Au Lα1 fluorescence line (9713 eV) using the [660] reflection
of four spherically bent Ge crystals. A total resolution of 2.1 eV was obtained. The raw
HERFD XAS spectra were treated with the ID26 matlab code. This code splits the raw data
into equal energy steps and normalizes absorption to the incoming photon flux. After
background subtraction the raw data were normalized in the range between 11.98 and 12
keV. Due to the good spectra quality, it was possible to obtain the fraction of metallic to
oxidic gold at different stages of the pretreatment using linear combinations of standard
spectra. The reference spectra were gold foil and bulk Au2O3 for Au0 and Au3+, respectively.
All samples used were checked for beam damage. Exposure of the slurry to X-rays in the
absence of hydrogen did not cause reduction of the gold precursor.
3.3. Cell description
A 50 ml autoclave used for liquid/solid reactions was modified without altering the shape of
the reaction vessel. This was achieved by cutting a 2.1 cm broad and 5 mm high oval opening
in the stainless steel container which surrounds the reaction container (we refer to that
opening as ‘‘window’’). Figure 3.1 shows the outer view, a vertical cut and the single parts of
the cell.

Chapter 3
36
Figure 3.1 Schematic drawing of the HERFD XAS/ATR FT-IR cell. Outer view of the cell (a),
vertical cut view of the cell (b), detail drawing of the cell parts (c).
The reaction container consists of polyetheretherketon (PEEK), which has a density of 1.3 g
cm-3, a wall thickness of 1.5 mm, and is pressure proof up to at least 20 bars, which was
determined via pressurizing to 20 bars for 24 hours. No pressure loss was detected during this
period. PEEK is attractive, because it has a high chemical resistance against acids, organic
solvents, and alkaline media; 1.5 mm PEEK transmits about 45 % of incident X-ray flux at
energies above 9 keV. The same is true for emitted fluorescence X-rays. The window allows
X-rays to enter and exit the reaction mixture through the PEEK. Via the closure head on top
of the cell, two ATR FT-IR probes (Mettler-Toledo DiComp immersion probe connected via
a flexible AgX fibre conduit to a ReactIR 45m spectrometer) can be inserted and sealed via
Swagelok connections. The stainless steel container can be heated by two heating rods up to
250 °C. The heat is transferred from the stainless steel container via the PEEK insert to the
liquid. The temperature of the steel container is controlled according to the real temperature
inside the
reaction mixture, which is measured with NiCr/Ni thermocouples. Due to absorption of X-
rays by solvents used in chemical reactions, a relatively large pathway through the reaction
mixture and the low concentration of the catalyst in solution, the cell can only be used in
fluorescence mode when measuring XAS at the Au LIII edge. The cell is sealed via a closure
head which contains Kalrez O-rings above and below the PEEK sealing plate. This sealing
plate acts both as a sealer as well as a thermal isolator. The closure head contains two tubes,
one to pressurize the cell and the other to measure the pressure via a Keller Mano 2000 LEO
3 manometer with a range of 0 to 30 bars. In the center, a mechanical stirrer is attached which
reaches up to 3000 rpm. One ATR FT-IR probe can be exchanged with a sample tube, which

Design and application of HERFD XAS/ATR FT-IR batch reactor cell
37
allows taking aliquots of the liquid phase during the reaction for GC analysis. The whole cell
can be fixed onto a carrier connected to a xyz sample stage for alignment at the beamline. All
parameters such as pressure, temperature of the steel container, temperature of the reaction
mixture, and stirring speed are remotely controlled.
3.4. Results and discussion
3.4.1. Reduction of as-prepared Au/CeO2 catalysts in different solvents
Heterogeneous metal catalysts used in organic synthesis are often reduced in situ before
reaction. The reduction temperature is generally based on gas-phase temperature-
programmed reduction, which does not take into account any influence of solvent. Recently,
we showed that the extend of reduction of a Pt–Re catalyst is dependent on the media used.23
At a moderate temperature, complete reduction of the metals was only achieved when the
reduction was performed in the gas phase. In the liquid phase the reduction was incomplete.
To illustrate the relevance of monitoring catalysts during pretreatment, the as-prepared
Au/CeO2 catalyst was reduced for 1 h in 10 bars of hydrogen at 60 °C in various solvents.
Figure 3.2 shows the evolution of the Au LIII edge HERFD XAS signal collected in situ
during the reduction.
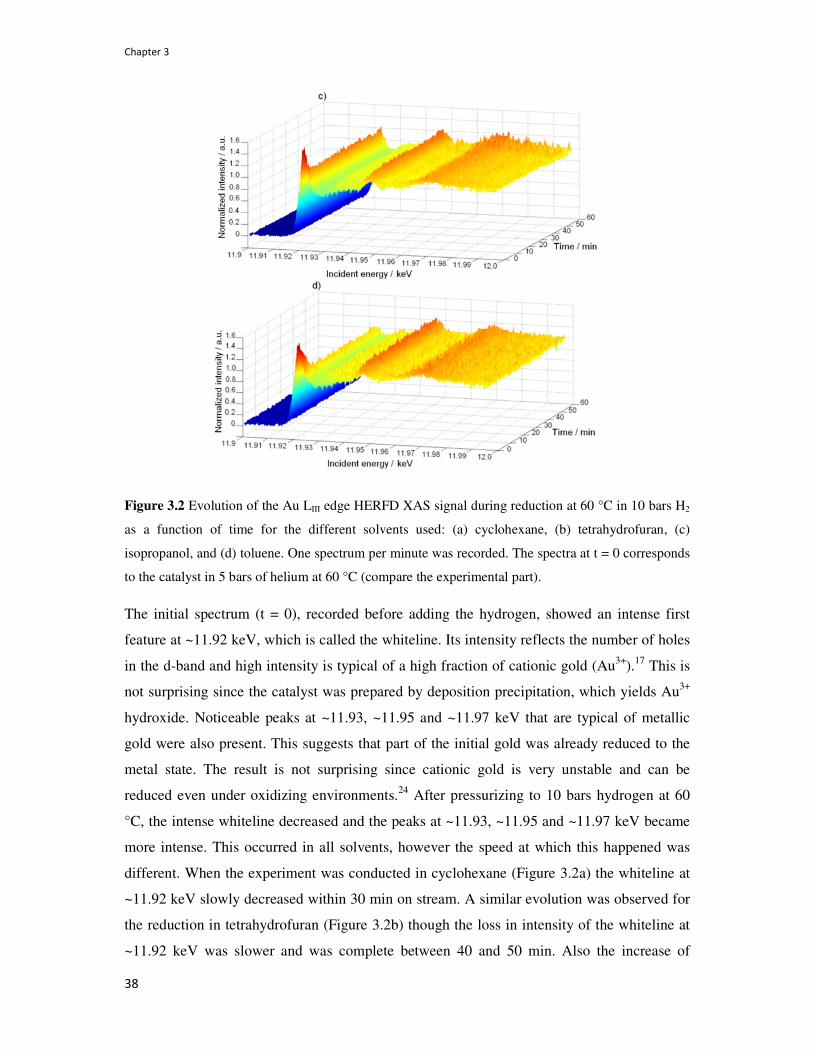
Chapter 3
38
Figure 3.2 Evolution of the Au LIII edge HERFD XAS signal during reduction at 60 °C in 10 bars H2
as a function of time for the different solvents used: (a) cyclohexane, (b) tetrahydrofuran, (c)
isopropanol, and (d) toluene. One spectrum per minute was recorded. The spectra at t = 0 corresponds
to the catalyst in 5 bars of helium at 60 °C (compare the experimental part).
The initial spectrum (t = 0), recorded before adding the hydrogen, showed an intense first
feature at ~11.92 keV, which is called the whiteline. Its intensity reflects the number of holes
in the d-band and high intensity is typical of a high fraction of cationic gold (Au3+).17 This is
not surprising since the catalyst was prepared by deposition precipitation, which yields Au3+
hydroxide. Noticeable peaks at ~11.93, ~11.95 and ~11.97 keV that are typical of metallic
gold were also present. This suggests that part of the initial gold was already reduced to the
metal state. The result is not surprising since cationic gold is very unstable and can be
reduced even under oxidizing environments.24 After pressurizing to 10 bars hydrogen at 60
°C, the intense whiteline decreased and the peaks at ~11.93, ~11.95 and ~11.97 keV became
more intense. This occurred in all solvents, however the speed at which this happened was
different. When the experiment was conducted in cyclohexane (Figure 3.2a) the whiteline at
~11.92 keV slowly decreased within 30 min on stream. A similar evolution was observed for
the reduction in tetrahydrofuran (Figure 3.2b) though the loss in intensity of the whiteline at
~11.92 keV was slower and was complete between 40 and 50 min. Also the increase of

Design and application of HERFD XAS/ATR FT-IR batch reactor cell
39
intensity at ~11.95 keV was not as fast as in cyclohexane. A different behaviour was
observed when the reduction was performed in isopropanol and toluene (Figure 3.2 c and d).
The signal for the whiteline at ~11.92 keV diminished during the reduction in isopropanol as
well as in toluene within 10 min on stream. Compared to the reduction in cyclohexane and
tetrahydrofuran the signals at ~11.95 and ~11.97 keV in isopropanol and toluene remained
more or less constant from the beginning of the reduction. As expected, the percentage of
Au3+ diminished during reduction yielding metallic gold. Quantification of gold species was
carried out by linear combination fitting using Au foil (Au0) and Au2O3 (Au3+) as reference
spectra. Figure 3.3 shows an example of a linear fit for one spectrum recorded during the
reduction in tetrahydrofuran.
Figure 3.3 Linear fitting of a Au LIII edge HERFD XAS spectrum of Au/CeO2 after reduction in
tetrahydrofuran in 10 bars of pure H2 at 60 °C after 37 min on stream. (●) original data; (—) overall
fitting; (…) Au foil reference and (---) Au2O3 reference spectra.
The two components reproduced the measured spectra well (R2 = 0.993). This was valid for
the large majority of the data, with some exceptions where small residues could not be
accurately fitted. The small discrepancies were detected during less abrupt transitions of Au3+
to Au0, which might suggest that some Au+ might be present as an intermediate, however, its
amount was too small to be quantified. Figure 3.4 shows the evolution of the percentages of
cationic and metallic gold during 1 h reduction in different solvents at 60 °C.

Chapter 3
40
Figure 3.4 Evolution of a Au3+ signal during the reduction at 60 °C in 10 bars H2 as a function of
solvent: (●) toluene; (■) isopropanol; (▲) tetrahydrofuran; and ( ) cyclohexane.
Each profile contains ca. 60 spectra, corresponding to 1 spectra per minute. The initial ratio
of Au3+/Au0 at the beginning of the reduction at 60 °C in 10 bars of hydrogen was about 1,
meaning that half of the gold in the catalyst was metallic after heating the reaction mixture to
60 °C in 5 bars of helium. Gold reduced extensively and rather easily in all solvents even at
60 °C.25 During the reduction in toluene and isopropanol, the percentage of Au3+ decreased
below 15 % after 15 min. After that the fraction of Au3+ was more or less stable until the end
of the measurement. Gold reduced at a much slower rate when the reduction was carried out
in tetrahydrofuran and cyclohexane. Only after 45 min for both solvents the percentage of
Au3+ was below 15 %. It is not clear at the moment which solvent parameters affect the
reduction of gold, since the differences cannot be assigned to a single contribution, such as
H2 solubility and polarity. A possible reason for the different reduction rates could be that the
degree of suspension of the Au/CeO2 catalyst differed in various solvents. The results
highlight the importance of examining the state of the catalyst under reaction conditions. At
the end of the pretreatment gold was found to be more than 90 % in the metallic phase in all
solvents. When reduction was carried out in the gas phase, 100 % metallic gold is achieved
within 5–10 min as the hydrogen is not diluted in the solvent.26
3.4.2. Hydrogenation of nitrobenzene over Au/CeO2
We operated the setup in operando mode by coupling the HERFD XAS with the ATR FT-IR
probe, which enabled us to monitor simultaneously the gold oxidation state and catalytic

Design and application of HERFD XAS/ATR FT-IR batch reactor cell
41
reactivity. We monitored the system from pretreatment to reaction. Figure 3.5 shows the
evolution of the Au LIII edge HERFD XAS signal during the pretreatment of the as-prepared
Au/CeO2 catalyst in water at 60 °C in 5 bars of He.
Figure 3.5 Evolution of the Au LIII edge HERFD XAS signal during reduction in water at 60 °C in 5
bars of He.
Once again the initial spectrum showed an intense whiteline and some peak characteristics of
Au3+ and Au0, respectively. Time on stream revealed a fast disappearance of the whiteline
and increase of the peaks, which reached a plateau after 10 min in 5 bars of helium at 60 °C.
Linear fitting (not shown) revealed that all gold was present in the metallic state after 10 min
of pretreatment. Hence in water the as-prepared Au/CeO2 fully reduced to Au0 (via the
production of O2 and H2O) without the presence of H2. As expected, no noticeable changes
were observed in the ATR FT-IR spectra. After the helium pretreatment, nitrobenzene and 10
bars of pure hydrogen were added to the mixture to evaluate the catalytic performance of the
catalyst in the reduction of nitrobenzene. In this reaction, nitrobenzene reacts to form short
lived intermediates, which in the case of Au/CeO2 condense to form azoxybenzene.27 The
azoxybenzene is reduced in consecutive steps to azobenzene and hydrazobenzene and finally
to aniline. The condensation route is one of the routes proposed by Haber in 1898.28,29 The
unusual reactivity of gold catalysts is commonly assigned to the size of its particles and to its
oxidation state. In terms of particle size, the literature is consensual that to be active, gold
must be present in small clusters30 or as nanoparticles31 and the interface with the support is
often suggested to be the active site. The active oxidation state of gold during the reaction
however has been a topic of extensive discussion and to date no consensus has been achieved.
Cationic gold has been often assigned to be the active site for several reactions32–34 based on
the observation of its presence at the onset of reaction and pretreatment. Herein, the power of

Chapter 3
42
performing characterization under relevant working conditions is illustrated. The oxidation
state of gold and the concentration of the chemical species in solution were monitored
simultaneously using HERFD XAS and ATR FT-IR, respectively. Figure 3.6 shows the
evolution of the gold signal during the hydrogenation of the emulsion of nitrobenzene in
water over Au/CeO2 at 120 °C in 10 bars of hydrogen.
Figure 3.6 Evolution of the Au LIII edge HERFD XAS signal during the hydrogenation of
nitrobenzene over Au/CeO2 in water at 120 °C in 10 bars of H2.
No visible changes in the whiteline region at ~11.92 keV or in the characteristic nanoparticles
region at ~11.93, ~11.95 and ~11.97 keV occurred throughout the reaction. The spectra
recorded were nearly constant and not affected by the reduction of nitrobenzene. Figure 3.7
shows a characteristic IR spectrum at ~5 min of reaction and the evolution of the chemical
species during the hydrogenation of nitrobenzene recorded by ATR FT-IR simultaneously by
measuring the spectra of Figure 3.6.
Figure 3.7 Characteristic IR spectrum after ~5 min of reaction (left) and evolution of chemical
species (right) during nitrobenzene hydrogenation monitored by ATR FT-IR. Reaction was carried out
in water in 10 bars of pure H2 at 120 °C. (■) Nitrobenzene (NB) and (●) azoxybenzene (AOB).
Design and application of HERFD XAS/ATR FT-IR batch reactor cell
43
The evolution of the band at 1531 cm-1 (blue), which is assigned to the asymmetric stretch
vibration of the nitro-group35 of nitrobenzene, linearly decreased with time and only slightly
deviated in the first 15 min of the reaction. After 5 min, a signal at 1477 cm-1 (red) appeared
which is assigned to azoxybenzene.36 The intensity of this band increased strongly to a
maximum at ~20 min after which it stayed constant. After about 40 min the intensity started
to decrease. Thus nitrobenzene was converted to azoxybenzene, which after 40 min on stream
started to react to form azobenzene for which traces were observed by GC analysis. The
amount of catalyst to substrate was too low to observe further consecutive reaction products.
The gold oxidation state (Au0) remained constant during the reaction. Linear fitting revealed
that gold was present only in the metallic form throughout the entire reaction period.
3.5. Conclusions
We showed for the first time that in situ and operand HERFD XAS coupled with ATR FT-IR
can be performed in pressurized liquid batch reactors without changing the reactor geometry.
The combined techniques yield complementary information about the chemical state of the
active center and catalytic performance of the catalyst, which enables the deduction of
structure–reactivity relations without altering the reactor design. These methods are
minimally invasive and have good time resolution (<1 min/full spectrum) to monitor
dynamics of the system as the reaction takes place. Thus conditions outside of the steady-
state can be monitored. We observed that the rate of reduction of gold in Au/CeO2 in
different solvents depends on the solvent and is different from the gas phase. The final
catalyst structure was found to be practically the same. The combination of HERFD XAS/
ATR FT-IR enabled monitoring the evolution of chemical species and the oxidation state of
gold during the hydrogenation of nitrobenzene. ATR FT-IR confirmed that the reaction
follows a stepwise mechanism, indicated by the formation of an azoxybenzene intermediate.
HERFD XAS indicated that gold remained completely metallic throughout the catalytic run.
Our results indicate that within about 1 % accuracy, only metallic gold was present in the
hydrogenation of nitrobenzene over Au/CeO2. No other oxidation state of gold was detected
throughout the reaction.25 The amount of any, if any, active cationic species is below the
instrumentation detection limit (~1%) and/or too short lived to be detected.

Chapter 3
44

Chapter 4
The dynamic structure of gold supported on ceria in
the liquid phase hydrogenation of nitrobenzene
(Reprinted with permission from Kartusch, C., Makosch, M., Sá, J., Hungerbühler, K., van Bokhoven, J. A. ChemCatChem 4 (2012) 236. Copyright 2012 WILEY-VCH Verlag GmbH & Co. KGaA, Weinheim)
[Martin Makosch and Christiane Kartusch performed the experiments and did the data analysis to equal parts.
Christiane Kartusch wrote the manuscript]
Chapter 4
46
4.
4.1. Introduction
Bulk gold is the most inert metal. However, when finely dispersed on a support, it is a very
active catalyst in many reactions,51 and molecules such as hydrogen, oxygen, and carbon
monoxide chemisorb on the gold surface. Examples of such reactions are CO oxidation,78-81
water gas shift reaction,82-84 selective alcohol oxidation,85-87 ethyne hydrochlorination,88,89
propene epoxidation,90,91 and hydrogenation reactions, such as the hydrogenation of
alkenes,92,93 alkadiens, 94-97 alkynes, 98-101 α,β-unsaturated carbonyl compounds, 102-105 and
nitro- compounds. 26,43,48 A unique property of gold is its high chemoselectivity due to the
preferential adsorption of oxygen-containing groups,104 in contrast to conventional
hydrogenation catalysts, such as palladium, platinum, and ruthenium, which must be
modified. Gold is, therefore, a promising catalyst in the development of new, clean, and
sustainable industrial processes with a minimal formation of byproducts. Although many
studies aim to describe the catalytically active sites, there is disagreement on the nature of
catalytically active sites in heterogeneous gold catalysis. Various suggestions have been made
to explain the catalytic activity of supported gold catalysts, for example, the size, structure,
and morphology of the supported gold species; the interface between gold particles and the
support; and the oxidation state(s) of gold in the catalysts. The oxidation state of active gold
species is still unclear. The catalytically active gold species in the well-studied CO oxidation
have been proposed to be cationic,106-110 fully reduced,81,111,112 and negatively polarized
gold.113-116 Aberration-corrected scanning transmission electron microscopy revealed that
gold bilayer clusters, approximately 0.5 nm in size and containing approximately 10 gold
atoms on FeOx supports, are highly active in CO oxidation.117 Cationic gold has been
proposed to be essential to reach high catalytic activity in the water gas shift reaction over
gold supported on nanocrystalline La-doped CeO2.82 Although hydrogenation has not been
studied to the same extent as oxidation, there is still no consensus with regard to the oxidation
state of active gold species. Cationic92-96,118 and reduced97 gold have been associated with
high catalytic activity. In conclusion, the nature of active species in heterogeneous catalysis
by gold is still unclear. In hydrogenation reactions, in situ studies92,93,119 determining the
oxidation state of gold during the process are rare. The aim of our work was to study in situ
the electronic properties of a supported gold catalyst (Au/CeO2) in a liquid phase
hydrogenation reaction, namely, the hydrogenation of nitrobenzene to form aniline. This
reaction has been studied extensively, both mechanistically and kinetically, and is used in

The dynamic structure of gold supported on ceria in the liquid phase hydrogenation of nitrobenzene
47
large-scale industrial processes to produce 90–95 % of the world’s aniline.120 Corma et al.26
discovered that supported gold catalysts catalyze the liquid phase hydrogenation of aromatic
nitrocompounds under mild conditions (100–120 °C, 10 bar H2). By using a newly
constructed in situ cell, we recorded simultaneously and in situ high-resolution X-ray
absorption near-edge structure (XANES) spectra at the Au LIII edge in the fluorescence mode
of the catalyst in the reaction mixture and monitored the reaction by means of attenuated total
reflectance Fourier transform infrared (ATR FT-IR) spectroscopy with a probe dipped into
the slurry.29,121 The cell is an autoclave reactor modified to achieve access of the X-rays to
the inner part of the reactor.68 X-ray absorption spectroscopy (XAS) is a very powerful
technique to determine the structural and electronic properties of catalysts under reaction
conditions.69 The X-ray absorption near-edge structure part of an XAS spectrum gives
information about the oxidation state and the local geometry of the absorbing atom. It reflects
the empty density of states of the electronic transition.3 XANES spectra were measured in the
high-energy-fluorescence detection (HERFD) mode, which gives much better resolution of
the spectra with sharper features than is possible with standard detection methods.4,74,76,119,122
ATR FT-IR spectroscopy is a reliable technique for monitoring online reactions.65,66,123
Molecular vibrations that lead to changes in the molecule’s dipole momentum, induced by
mid-IR radiation (ν = 4000-400 cm-1), enable us to identify and quantify most of the organic
compounds. Thus, we determined the electronic properties of gold supported on ceria and the
changes it undergoes under different pretreatment and reaction conditions and simultaneously
monitored the course of the reaction.
4.2. Experimental section
Au/CeO2 was prepared through deposition-precipitation with urea.55 CeO2 (99.9 %, ABCR
Chemicals) was calcined at 500 °C for 5 h to remove any residual nitrates. To prepare 0.8
wt% Au/CeO2, HAuCl4·3H2O (0.085 g; Au: 49 %, 99.9 % metal basis, ABCR Chemicals)
was dissolved in deionized H2O (500 mL). CeO2 (5.0 g) and urea (1.5 g; Puriss p.a. > 99.5 %,
Riedel-de Haan) were added with continuous stirring. The mixture was heated to 80 °C and
stirred for 16 h in a closed Teflon vessel. After cooling to RT, the solid product was obtained
after filtration and washed five times with deionized water to remove residual chloride ions.
To confirm the removal of chloride, AgNO3 solution (1M) was added to the filtrate.
Precipitation of AgCl was not observed. The product was dried at RT under vacuum in the
dark for 48 h. The gold loading of the catalyst was determined by means of atomic absorption
spectroscopy on a Varian SpectrAA 220FS spectrometer after dissolving an aliquot of the

Chapter 4
48
sample in a mixture of HCl/HNO3/HF (3/1/1 v/v/v). Pretreatment of the catalyst and the
hydrogenation of nitrobenzene were done in a newly constructed autoclave reactor that
enables X-rays to penetrate the reaction mixture. Pretreatment of the catalyst was performed
in toluene, that is, in the solvent of the subsequent reaction, at 10 bar H2. As-prepared
Au/CeO2 (0.30 g) was added to toluene (25 mL), and residual air was removed by flushing
the autoclave thrice with H2. After changing the pressure to 10 bar H2, the suspension was
heated with continuous stirring (1500 rpm) at 4 °C min-1 to the desired pretreatment
temperature (60 or 100 °C), and this temperature was maintained for 30 min. After
pretreatment, the mixture was left to cool to 60 °C and nitrobenzene (2.13 g) was added.
After purging with H2 three times, the autoclave was pressurized with 10 bar H2 and heated
with continuous stirring (1500 rpm) at 4 °C min-1 to 100 °C. The start of heating was set as
reaction time zero. In one experiment, the reaction was rather performed at 60 °C. The
conversion of nitrobenzene was monitored in situ by using an ATR FT-IR system (Mettler
Toledo) with a DiComp optical fiber immersion probe attached to a ReactIR 45 spectrometer.
One spectrum per minute (average of 16 scans) was recorded, with a resolution of 2 cm-1
from ν = 2000 to 750 cm-1. Background spectra of the catalyst suspension were collected in
toluene at respective temperatures. The Au LIII HERFD spectra were continuously collected
during pretreatment of the catalyst and during hydrogenation of nitrobenzene with a time
resolution of one spectrum per minute. The experiments were performed at the XAS-XES
beamline ID26 of the European Synchrotron Radiation Facility, Grenoble, France, which is
operated at an energy of 6.0 GeV and a ring current of 50-90 mA. The measurements were
conducted with use of the third harmonic of two U35 undulators. The incident energy was
monochromatized through a pair of Si(111) single crystals. Three Pd/Cr mirrors at 2.5 mrad
relative to the incident beam suppressed higher harmonics. The X-ray beam was 0.3 mm wide
and 1 mm high, with a total flux of 5x10¹² photons s-1. HERFD was done with a
horizontalplane Rowland circle spectrometer in combination with an avalanche photodiode
(Perkin-Elmer). The spectrometer was tuned to the Au Lα1 fluorescence line (9713 eV)
through four Ge[660] crystals. A total resolution of 2.1 eV was obtained.
4.3. Results
Shown in Figure 4.1 is the evolution of Au LIII HERFD spectra of Au/CeO2 measured in situ
during reduction at 60 °C (Figure 4.1a) and 100 °C (Figure 4.1b).
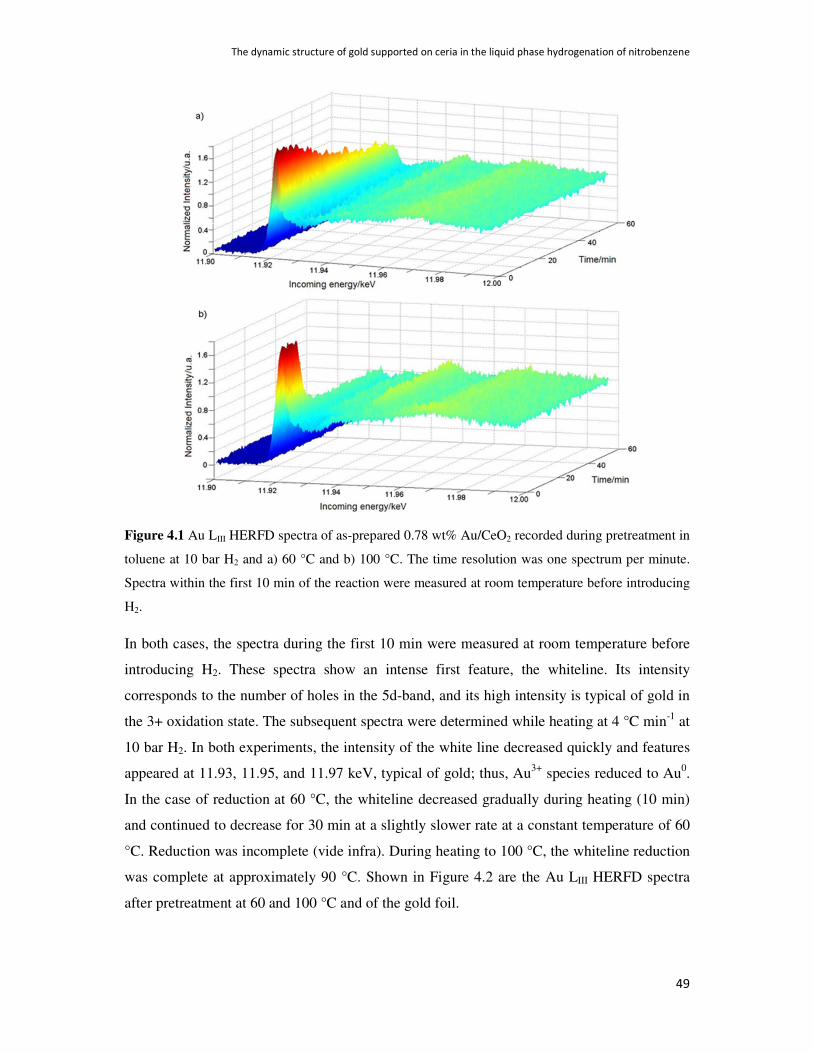
The dynamic structure of gold supported on ceria in the liquid phase hydrogenation of nitrobenzene
49
Figure 4.1 Au LIII HERFD spectra of as-prepared 0.78 wt% Au/CeO2 recorded during pretreatment in
toluene at 10 bar H2 and a) 60 °C and b) 100 °C. The time resolution was one spectrum per minute.
Spectra within the first 10 min of the reaction were measured at room temperature before introducing
H2.
In both cases, the spectra during the first 10 min were measured at room temperature before
introducing H2. These spectra show an intense first feature, the whiteline. Its intensity
corresponds to the number of holes in the 5d-band, and its high intensity is typical of gold in
the 3+ oxidation state. The subsequent spectra were determined while heating at 4 °C min-1 at
10 bar H2. In both experiments, the intensity of the white line decreased quickly and features
appeared at 11.93, 11.95, and 11.97 keV, typical of gold; thus, Au3+ species reduced to Au0.
In the case of reduction at 60 °C, the whiteline decreased gradually during heating (10 min)
and continued to decrease for 30 min at a slightly slower rate at a constant temperature of 60
°C. Reduction was incomplete (vide infra). During heating to 100 °C, the whiteline reduction
was complete at approximately 90 °C. Shown in Figure 4.2 are the Au LIII HERFD spectra
after pretreatment at 60 and 100 °C and of the gold foil.

Chapter 4
50
Figure 4.2 Au LIII HERFD spectra of Au/CeO2 after pretreatment at 60 and 100 °C and of the gold
foil.
The spectrum after pretreatment at 100 °C resembles that of the gold foil, except for a slightly
weaker whiteline intensity, indicative of small clusters.124,125 There was no evidence of
cationic gold. Au/CeO2 pretreated at 60 °C shows a higher whiteline intensity than does the
gold foil and a lower intensity between 11.925 and 11.935 keV, which indicates that a
fraction of gold species was cationic. Assuming that the cationic gold was in the 3+ oxidation
state, the fraction of cationic and reduced gold was determined from linear combinations of
the spectra of Au2O3 and the gold foil, which yielded 28 % Au3+ and 72 % Au0. Given in
Table 4.1 are the Au3+ and Au0 fractions in Au/CeO2 after the respective pretreatment and
after different reaction times under the applied hydrogenation conditions.
Table 4.1 Fraction of Au3+ and Au0 in Au/CeO2 after pretreatment and during hydrogenation of
nitrobenzene as well as reaction rates for hydrogenation at 100 °C after pretreatment of Au/CeO2 at 60
and 100 °C.
Pretreatment temperature
[°C]
Reaction temperature
[°C]
Reaction time [min]
Fraction of Au0
[%]
Fraction of Au3+
[%]
Reaction rate [mmol gAu
-1 s-1]
100 100 0
10
30
60
100
100
100
100
0
0
0
0
0.19[a]
0.08[b]
11.91 11.92 11.93 11.94 11.95 11.96 11.97 11.980.0
0.2
0.4
0.6
0.8
1.0
1.2
1.4
Norm
aliz
ed inte
nsity / a
.u.
Incident energy / keV
after pretreatment at 60 °C
after pretreatment at 100 °C
gold foil

The dynamic structure of gold supported on ceria in the liquid phase hydrogenation of nitrobenzene
51
60 100 0
3
6
10
30
60
72
85
91
100
100
100
28
15
9
0
0
0
0.14[a]
0.06[b]
60 60 0
10
30
60
76
80
90
100
24
20
10
0
[a] Rate between 0 and 10 min; [b] Rate between 10 and 30 min.
The initial catalytic activity and after 10 min reaction time are given for the reaction at 100
°C over Au/CeO2 pretreated at 60 and 100 °C. The hydrogenation of nitrobenzene was
performed immediately after the respective pretreatment, and the Au LIII HERFD spectra
were recorded in situ throughout the whole reaction. Figure 4.3 shows the Au LIII HERFD
spectra after pretreatment at 100 °C and after 10, 30, and 60 min of the reaction at 100 °C.
Figure 4.3 Au LIII HERFD spectra of Au/CeO2 after pretreatment at 100 °C and during the
hydrogenation of nitrobenzene at 100 °C after 10, 30, and 60 min of the reaction.
It shows that gold is fully reduced at the beginning of the reaction, that is, after pretreatment
at 100 °C, and remained in the reduced state throughout the reaction. Shown in Figure 4.4 are
the Au LIII HERFD spectra measured during the first 10 min of the hydrogenation of
nitrobenzene at 100 °C after pretreatment of Au/CeO2 at 60 °C.
11.91 11.92 11.93 11.94 11.95 11.96 11.97 11.980.0
0.2
0.4
0.6
0.8
1.0
1.2
1.4
Norm
aliz
ed in
ten
sity / a
.u.
Incident energy / keV
after pretreatment at 100 °C
10 min
30 min
60 min

Chapter 4
52
Figure 4.4 Au LIII HERFD spectra of Au/CeO2 after pretreatment at 60 °C and during the
hydrogenation of nitrobenzene at 100 °C after 3, 6, and 10 min of the reaction.
Under reaction conditions, the intensity of the whiteline decreased quickly. Starting from 28
% of Au3+ after pretreatment, the Au3+ fraction decreased to 15 % after 3 min and to 9 % after
6 min. After 10 min, the spectra matched the spectrum of the gold foil; no cationic gold was
detected. Thus, Au3+ transformed to Au0 under reaction conditions. Shown in Figure 4.5 are
the Au LIII HERFD spectra after pretreatment of Au/CeO2 at 60 °C and during the
hydrogenation of nitrobenzene at 60 °C.
Figure 4.5 Au LIII HERFD spectra of Au/CeO2 after pretreatment at 60 °C during the hydrogenation
of nitrobenzene at 60 °C after 10, 30, and 60 min of the reaction and of the gold foil.
11.91 11.92 11.93 11.94 11.95 11.96 11.97 11.980.0
0.2
0.4
0.6
0.8
1.0
1.2
1.4
No
rma
lize
d in
ten
sity /
a.u
.
Incident energy / keV
after pretreatment at 60 °C
3 min
6 min
10 min
11.91 11.92 11.93 11.94 11.95 11.96 11.97 11.980.0
0.2
0.4
0.6
0.8
1.0
1.2
1.4
No
rma
lize
d in
ten
sity /
a.u
.
Incident energy / keV
after pretreatment at 60 °C
10 min
30 min
60 min

The dynamic structure of gold supported on ceria in the liquid phase hydrogenation of nitrobenzene
53
At a reaction temperature of 60 °C, the intensity of the whiteline also decreased continuously
as the reaction proceeded, though at a slower rate than that obtained during hydrogenation at
100 °C. Starting from 24 % of Au3+ after pretreatment, the Au3+ fraction was 20 % after 10
min and 10 % after 30 min of the reaction. After 60 min, reduction was complete and the
spectra resembled the spectrum of the gold foil. Shown in Figure 4.6 is the conversion of
nitrobenzene at 100 °C after pretreatment at 60 and 100 °C as determined from the intensity
of the IR band of the asymmetric stretching of the nitro-group at ν = 1530 cm-1.
Figure 4.6 Hydrogenation of nitrobenzene after pretreatment of Au/CeO2 at 60 °C (red triangles) and
100 °C (black squares) at 100 °C and 10 bar H2 as determined by the decreasing amount of
nitrobenzene in the reaction. The corresponding fractions of Au3+ (yellow triangles for Au/CeO2
pretreated at 60 °C and black crossed squares for Au/CeO2 pretreated at 100 °C) are plotted against
the reaction time. For both pretreatments, two straight lines between 0 and 10 min and between 10 and
30 min, respectively, represent the conversion of nitrobenzene over time.
The corresponding fractions of Au3+ are plotted against the reaction time. The conversion
curves after each pretreatment can be divided into two more or less linear segments between
0 and 10 min and between 10 and 30 min reaction time, respectively. The initial activity (0-
10 min) of the catalyst pretreated at 100 °C, at which cationic gold was not detected, was
higher (0.19 mmol gAu-1 s-1) than that of the catalyst reduced at 60 °C, which contained
significant amounts of cationic gold (0.14 mmol gAu -1 s-1). Thus, it is clear that the cationic
gold present after treatment at 60 °C does not lead to high catalytic activity. After
approximately 10 min, the activity of Au/CeO2, pretreated at 60 °C, decreased to 40 % of its
initial activity, which results in 0.06 mmol gAu-1 s-1. Concurrently, the reduction of Au3+ was
complete. However, the catalytic activity of the fully reduced Au/CeO2 after pretreatment at
100 °C showed exactly the same behavior and also decreased to 40 % after approximately 10

Chapter 4
54
min, which results in 0.08 mmol gAu-1 s-1. Thus, no correlation has been found between the
catalytic activity and the amount of cationic gold; the decrease in activity is the same
irrespective of whether the sample contains measurable amounts of cationic gold.
4.4. Discussion
As shown by the intensive whiteline in the Au LIII HERFD spectra, as-prepared Au/CeO2
mainly contained gold in the 3+ oxidation state. During pretreatment at 100 °C, the reduction
of Au3+ was fast and complete. Pretreatment at 60 ° C led to slower reduction, and after
pretreatment, approximately 25–30 % cationic gold was left. The liquid phase hydrogenation
of nitrobenzene was performed at 100 °C and 10 bar H2, which are mild conditions, as
commonly reported in the literature for such catalytic systems.26 The catalyst without
measurable amounts of cationic gold was more active than the catalyst with cationic gold.
Thus, the observed cationic gold does not show high catalytic activity. Moreover, the fraction
of cationic gold present in Au/CeO2 pretreated at 60 °C was not maintained under reaction
conditions; it gets converted to Au0, and after 10 min, reduction was complete. Concurrently,
the activity of this catalyst decreased by 60 %. However, Au/CeO2, pretreated at 100 °C, was
fully reduced from the beginning and showed exactly the same deactivation behavior. After
approximately 10 min, the catalytic activity decreased by 60 %. Thus, the decrease in
catalytic activity is not related to the reduction of cationic gold, which is probably due to
poisoning of the catalyst surface by reaction intermediates and/or deposition of carbonaceous
species.29 After both pretreatments, the reaction eventually proceeded without detectable
amounts of cationic gold. The above results were confirmed by performing an additional
experiment. The hydrogenation of nitrobenzene over Au/CeO2, pretreated at 60 °C, was
performed at 60 °C instead of 100 °C. Reduction of Au3+ also occurred under these
conditions but was slower than that under reaction conditions at 100 °C. Significant amounts
of Au3+ were present for at least 30 min. The conversion of nitrobenzene was low but
constant during this period, although the fraction of Au3+ decreased from 25 to 10 %. Thus,
varying amounts of Au3+ did not influence the catalytic activity. If undetected cationic gold
were responsible for the catalytic reaction, then it would have been located at an undetectable
site and would have been very stable to maintain its oxidation state. We estimate that about 1
% of cationic gold can be found by using HERFD. For hydrogenation reactions over
supported gold catalysts, cationic and reduced gold can be highly active. Our results are in
good agreement with those of Hensen et al.,97 who studied the structure and oxidation state of
gold supported on ceria in the selective gas phase hydrogenation of 1,3-butadiene by means
The dynamic structure of gold supported on ceria in the liquid phase hydrogenation of nitrobenzene
55
of XAS. They found that the catalytic activity of 0.08 wt.% Au/CeO2 obtained after leaching
with use of NaCN, which comprised solely isolated Au3+, increased strongly with the
reduction temperature, that is, the amount of reduced gold. They further observed an
increasing catalytic activity of the as-prepared non-pre-reduced catalyst with time on stream,
which was ascribed to a slow reduction of Au3+ under reaction conditions. Thus, they also
observed changes in the catalyst structure under reaction conditions. Cationic gold prepared
through deposition-precipitation is inactive in the hydrogenation of nitrobenzene and 1,3-
butadiene. Our results contrast with those of Guzman and Gates,92,93 who concluded that
mononuclear Au3+ species supported on MgO were the catalytically active species in the
hydrogenation of ethylene. A cationic gold complex [Au(CH3)2(C5H7O2)] was deposited on
MgO. Extended X-ray absorption fine structure spectroscopy under working conditions did
not show Au–Au contributions; however, the XANES spectra exhibit a decrease in the white-
line intensity during the first 30 min of the reaction. The authors attribute this decrease to
changes in site symmetry of mononuclear gold species rather than to changes in the oxidation
state of gold, such as partial reduction. Homogeneous cationic complexes of gold are active
catalysts.126 This suggests that cationic gold in a heterogeneous catalyst might be active when
prepared from an appropriate cationic gold complex. However, many homogeneous reactions
proceed with both Au0 and Au3+ precatalysts, and the oxidation state of active species has not
yet been identified.126 Zhang et al.94 investigated the nature of active gold species in the
hydrogenation of 1,3-butadiene over Au/ZrO2 catalysts by preparing catalysts with different
fractions of Au3+. They concluded that site-isolated Au3+ ions, which they observed in
Au/ZrO2 catalysts with loadings lower than 0.1 wt.%, were the active sites for the
hydrogenation of 1,3-butadiene. In contrast, the catalysts were characterized only prior to the
reaction (temperature-programmed reduction and X-ray photoelectron spectroscopy), not
during or after the reaction. They further varied the calcination temperature of a 0.8 wt.%
Au/ZrO2 catalyst between 473 and 773 K to obtain catalysts with different Au3+/Au0 ratios,
whereas the fraction of cationic gold decreased with increasing calcination temperature, and
so did the catalytic activity. The decrease in catalytic activity was attributed to the decrease in
the fraction of cationic gold. However, with increasing calcination temperature, the mean
particle size increased significantly from 4 nm at a calcination temperature of 473 K to 7 nm
at 573 K and 12 nm at 773 K. Thus, the decrease in activity might also be a result of the
increasing particle sizes. With regard to the activation of hydrogen on supported gold
catalysts, several studies suggested that the presence of metallic gold particles is essential.
Mohr et al.127,128 identified the edges of single crystalline cubocatahedral gold nanoparticles

Chapter 4
56
with a mean diameter of 9 nm supported on ZnO as active sites for the selective
hydrogenation of the CO group of acrolein to allyl alcohol. Through selective decoration of
the gold faces by indium and leaving the edges uncovered, an increased selectivity to the
desired allyl alcohol was observed. Bus et al.129 investigated the interaction of hydrogen with
Au/Al2O3 and Au/SiO2 catalysts combining XAS, hydrogen chemisorption, and hydrogen–
deuterium (H/D) exchange experiments. They found that with decreasing particle size,
increasing amounts of hydrogen were chemisorbed and an increasing fraction adsorbed
strongly. The Au/Al2O3 catalyst with the smallest particle size of about 1 nm exhibited the
highest hydrogen uptake per surface atom. At this size, most of the surface consists of atoms
at corner and edge positions. Thus, hydrogen atoms may adsorb only at the edges and corners
of the gold particles. Additional H/D exchange experiments showed that hydrogen adsorbed
dissociatively on gold and that the adsorption was activated. By combining isotopic H/D
exchange experiments with IR and DFT results, Boronat et al.130,131 demonstrated that among
the different gold sites identified, only low coordinated, neutral gold atoms located at corner
or edge positions of Au/TiO2 catalysts were able to dissociate H2. Fujitani et al.132 studied the
H2/D2 exchange reaction over Au/TiO2 (110) surfaces with different gold particle sizes. With
decreasing gold particle size, the rate of H/D formation increased. For particle sizes below 2
nm, a marked increase in activity was observed. However, the apparent activation energies
for the H2/D2 exchange reaction were almost identical for all Au/TiO2 (110) model catalysts,
irrespective of the differences in gold particle sizes. Thus, the authors concluded that the
nature of the active sites for the dissociation of H2 over Au/TiO2 (110) was the same
irrespective of gold particle sizes and proposed that the gold atoms at the metal/support
interface were the catalytically active sites. Shimizu and co-workers133 investigated the
influence of the particle size and the nature of the support on the chemoselective
hydrogenation of nitroaromatics over supported gold catalysts. With regard to the gold
particle size, they observed an increasing activity for the OH/D2 exchange reaction with
decreasing particle size. Gold nanoparticles of similar mean particle sizes were found to be
most active when supported on an acid-base bifunctional support (Al2O3) rather than on a
basic (MgO) or acidic (SiO2) support. Thus, the authors concluded that these surface acid-
base pair sites were required for the dissociation of hydrogen and proposed that the gold
atoms at the metal-support interface were the catalytically active sites. We determined in situ
the oxidation state of gold in our highly responsive catalysts and simultaneously monitored
the conversion of nitrobenzene. In our system, when cationic gold remained after
pretreatment, it was reduced under reaction conditions. We found no evidence that the

The dynamic structure of gold supported on ceria in the liquid phase hydrogenation of nitrobenzene
57
detected cationic gold contributed to catalytic activity. However, the fully reduced catalyst
was more active than the partially oxidized catalyst.
4.5. Conclusions
In situ high-energy-fluorescence detection X-ray absorption near-edge structure spectroscopy
at the Au LIII edge during catalyst pretreatment and the liquid phase hydrogenation of
nitrobenzene revealed large changes in the oxidation state of gold in Au/CeO2 catalysts. Ex
situ characterization is not quantitative for the structure under catalytic conditions. The liquid
phase pretreatment of as-prepared Au/CeO2 at 100 °C led to complete reduction of gold
species, whereas pretreatment at 60 °C resulted in the incomplete reduction of gold species.
Reduced Au/CeO2 was more active in the liquid phase hydrogenation of nitrobenzene at 100
°C than was cationic gold containing Au/CeO2. When cationic gold was present at the
beginning of the reaction, it reduced under reaction conditions, which was accompanied by a
loss of 60 % activity. However, deactivation is not related to the amount of cationic gold,
because Au/CeO2 that was fully reduced at the beginning of the reaction became deactivated
in the same manner, probably as a result of blocking of the active surface. We did not find
that cationic gold prepared through deposition-precipitation on ceria is related to catalytic
activity.

Chapter 4
58
Chapter 5
Hydrogenation of nitrobenzene over Au/MeOx
catalysts - a matter of the support
(Reprinted with permission from Makosch, M., Sa, J., Kartusch, C., Richner, G., van Bokhoven, J. A. and Hungerbühler, K. ChemCatChem 4 (2012) 59. Copyright 2012 WILEY-VCH Verlag GmbH & Co. KGaA, Weinheim)
[Martin Makosch performed the experiments, did the data analysis and wrote the manuscript]
Chapter 5
60
5.
5.1. Introduction
The heterogeneous hydrogenation of substituted nitrobenzenes is a reaction of great interest,
because aniline and its derivates are valuable substances in the chemical industry for the
production of polymers, pharmaceuticals, herbicides, and dyes.27 The state-of-the-art
catalysts are mostly active metals, such as Pt, Pd, Ni, Cu, and Ir, which are supported on
various materials, such as activated C, CaCO3, and SiO2, depending on their application.20 To
achieve high selectivity to substituted anilines in the presence of other reducible groups and
to prevent arylhydroxylamine accumulation in the reaction mixture, state-of-the-art catalysts
are often modified with environmentally harmful additives, such as Pb and V promoters and
Fe salts.34 Since the discovery that Au, when present as nanoparticles in the range of 1–3 nm,
catalyzes CO oxidation, more and more reactions have been shown to be catalyzed by Au,104
among them the hydrogenation of nitrobenzene.26 Hydrogenation of nitroaromatics
containing additional unsaturated groups over unmodified Au/TiO2 and Au/Fe2O3 shows a
high selectivity to the nitro-group. Thus, Au/MeOx (Me corresponds to a metal) catalysts
have been presented as a “green” alternative in reactions where a high selectivity under
moderate reaction conditions is required. Haber proposed a reaction scheme (Scheme 5.1) for
the electrochemical hydrogenation of nitrobenzene and its derivates in 1898;28 however, there
is an ongoing debate about the reaction mechanism over heterogeneous catalysts.

Hydrogenation of nitrobenzene over Au/MeOx catalysts – a matter of the support
61
Scheme 5.1 Possible reaction pathways for the hydrogenation of aromatic nitrocompounds to the
corresponding anilines. NB: nitrobenzene, NSB: nitrosobenzene, PHA: phenylhydroxylamine, AN:
aniline, AOB: azoxybenzene, AB: azobenzene, HAB: hydrazobenzene. Adapted from 29.
Haber proposed two main reaction routes, namely the “direct” (left hand side) and the
“condensation” route (right hand side). In the direct route, nitrobenzene is reduced to
nitrosobenzene, then to phenylhydroxylamine, and finally to aniline (Steps I–III). A variation
of the direct route is the “no-nitroso route” (Step IV), in which nitrobenzene directly reacts to
phenylhydroxylamine and then to aniline.30,134 The condensation route occurs when the two
intermediates nitrosobenzene and phenylhydroxylamine condensate to form azoxybenzene
(Step VI). This species is then hydrogenated to aniline in consecutive steps via the
intermediates azobenzene and hydrazobenzene (Steps VII–IX). Another possible step in the
transformation of nitrobenzene to aniline is the decomposition of phenylhydroxylamine into
nitrosobenzene and aniline (Step V). Aniline is produced by the disproportion of
phenylhydroxylamine.31 The nitrosobenzene generated by the disproportion reenters the
catalytic cycle and is subsequently transformed into phenylhydroxylamine. These findings
are based on measurements of nitrobenzene hydrogenations over Ir/C poisoned by Hg.
Azoxybenzene is the first intermediate that is formed in the condensation route, which is
observed when the reactions are performed in the presence of a base. Azoxybenzene can also

Chapter 5
62
be detected at slow reaction rates, for example, over Pd/SiO2 in methanol at 25 °C.135
Recently, the selective catalytic hydrogenation of functionalized nitroarenes has been
reviewed.21 The authors describe precisely the tailoring of selective catalysts by using organic
and inorganic modifiers and their application for different catalytic problems. Also, the effect
of solvent, particle size, and support are discussed. The discussion on the influence of the
support focuses on selectivity, activity, and stabilization of the metal nanoparticles. Other
reports detail the effect of the composition of the reaction mixture,35,36 the noble metal,37,50
and the support on selectivity, activity, or stability. Activity and selectivity of p-
chloronitrobenzene hydrogenation over Pt/MeOx catalysts is affected by the support.38,50
Furthermore, the dehalogenation of halogen-modified nitroaromatics using BaCO3 as support
has been measured.39 Metal oxides, such as TiO2 and Fe2O3, which form a strong metal-
support interaction, perform better in the preferential hydrogenation of nitrobenzene
compared to “inert” supports, such as SiO2 and activated C.40 To the best of our knowledge,
there are no reports on how the support actively influences the mechanism of the reaction. In
this chapter, we show that the support directly influences the reaction route in the
hydrogenation of nitrobenzene in the liquid phase.
5.2. Experimental section
5.2.1. Synthesis of materials
TiO2 (Aeroxide P25) was supplied by Acros, and CeO2 by MicroCoating Technologies. A 1.5
wt% Au/TiO2 (actual Au loading: 1.48 wt%) catalyst was supplied by the World Gold
Council (WGC, reference catalyst Type A: 1.5 wt% Au/TiO2). 1 wt% Au/CeO2 (actual Au
loading: 0.7 wt%) catalyst was synthesized by the deposition/precipitation of Au onto the
surface of CeO2 using urea according to 54. Prior to synthesis, CeO2 was calcined at 500 °C to
remove all residuals remaining from synthesis. In a teflon container, the support (3 g) was
dissolved in water (300 mL) containing urea (0.9 g). HAuCl4·3H2O (50.97 mg; Au: 49 %,
99.9 % metal basis, ABCR-Chemicals) was added to this solution. Subsequently, the mixture
was stirred at 80 °C for 16 h under the exclusion of light. The precipitate was filtered, washed
three times with water to prevent Cl- contamination, and dried in vacuum over night. The
resulting catalysts were referred to as “as-prepared” and were pretreated as described in the
paragraph Kinetic measurements. By using a Varian SpectrAA 220 FS spectrometer, atomic
absorption spectrometry (AAS) analysis was used to determine the loading of Au (wt%) in
each catalyst. To achieve that, the catalyst (100 mg) was dissolved in aqua regia overnight (6

Hydrogenation of nitrobenzene over Au/MeOx catalysts – a matter of the support
63
mL), and then water was added to obtain a total volume of 50 mL. This solution was
compared to a standard calibration series.
5.2.2. Kinetic measurements
All catalysts were pretreated as follows before the reaction was performed. The catalyst (200
mg) was heated to 300 °C (heating rate: 2 °C min-1) in a stream of 5 % (v/v) H2 in He (flow
rate: 100 mL min-1). After reaching 300 °C, the catalyst was kept at that temperature for 60
min and then cooled down to room temperature in the same stream. We refer to this method
as 300H2. Kinetic measurements were performed in 50 mL Premex autoclaves. A typical
reaction composition consisted of toluene (25 g), internal standard (120 mg; mesitylene,
puriss > 99.0 %, Sigma–Aldrich), catalyst (100 mg), and substrate (0.8 mmol: nitrobenzene,
> 99.5 %, Sigma–Aldrich, and n-phenylhydroxylamine, > 98 %, Sigma–Aldrich; 0.4 mmol:
azoxybenzene 97 %, Sigma–Aldrich, and nitrosobenzene 98 %, ABCR-Chemicals). This
mixture was filled into an autoclave and purged three times after sealing by using H2 (5 bar; 1
bar = 105 Pa) and while stirring (1000 rpm). The autoclave was then pressurized to 10 bar by
using H2 and heated up to 100 °C (10 °C min-1) under constant stirring (1000 rpm), during
which the reaction started. Samples were taken at fixed time intervals by means of a sample
tube. The samples were filtered and analyzed by using GC using an Agilent 7820A with an
apolar 30 m HP 5 MS column. The temperature program consisted of 20 °C min-1 heating
steps from 80-300 °C at a split ratio of 10/1.
5.3. Resutls
Figure 5.1 shows the concentration profile during the reaction of nitrobenzene to aniline at
100 °C under 10 bar (1 bar = 105 Pa) of H2 over Au/TiO2 (Figure 5.1a) and Au/CeO2 (Figure
5.1b).

Chapter 5
64
Figure 5.1 Evolution of substrate, intermediates, product, and C-balance in the liquid-phase
hydrogenation of nitrobenzene (0.8 mmol substrate, 10 bar H2, 100 °C) over a) Au/TiO2 and b)
Au/CeO2 (y-axis relative to the stoichiometric coefficient of aniline); (�) nitrobenzene, (�)
azoxybenzene, (�) azobenzene, (■) aniline, and (�) C-balance.
Over Au/TiO2, the profile is dominated by the substrate nitrobenzene and the final product
aniline. Only traces (< 1 %) of the intermediate azoxybenzene were detected, which is in
good agreement to previous results.26,48 The evolution of the nitrobenzene concentration
proceeded as a mirror image of the aniline concentration. A slight variation in the C-balance
was observed at the beginning of the reaction (between 0 and 15 min); however, the C-
balance was always higher than 95 % throughout the reaction. Full conversion was achieved
after 60 min. Hydrogenation of nitrobenzene over the Au/CeO2 catalyst shows a very
different behavior. In addition to the substrate nitrobenzene and the final product aniline, two
intermediates of the condensation route, azoxybenzene and azobenzene, were also detected.
The C-balance dropped within the first 20 min of the reaction and recovered as the formation
of azoxybenzene and aniline was detected, probably because of adsorption of intermediates
and/or product on the surface of the catalyst; the C-balance exceeded 90 % at all times.
Azobenzene was first detected after 30 min of reaction. The concentrations of azoxybenzene,
azobenzene, and aniline increased with reaction time. The azoxybenzene concentration
started to decrease after 120 min, and coinciding with full conversion of nitrobenzene, the
concentration of azoxybenzene was zero at approximately 180 min. At this point, only
azobenzene and aniline were present in the solution, and the first compound was eventually
completely converted into the second. The occurrence of condensation products for Au/CeO2
and their absence for Au/TiO2 catalysts was observed for both, different Au loadings and
different particle sizes (see Table 5.1).
0 20 40 60 800.0
0.1
0.2
0.3
0.4
0.5
0.6
0.7
0.8
0 40 80 120 160 200 240
b)
C-b
ala
nce
/ %
n / m
mol
a)
t / min
0
20
40
60
80
100

Hydrogenation of nitrobenzene over Au/MeOx catalysts – a matter of the support
65
Table 5.1 Dependence of reaction route on particle size and gold loading
Catalyst gold loading (wt%) Mean particle size (nm) Condensation intermediates detected
Au/TiO2 1wt% 2.5 nm no
Au/TiO2 3wt% 0.8 nm no
Au/TiO2 7wt% 1.3 nm no
Au/CeO2 1wt% 2.3 nm yes
Au/CeO2 2wt% 1.8 nm yes
Au/CeO2 3wt% 3.1 nm yes
The evolution of the species in solution for a reaction of azoxybenzene over Au/CeO2, is
shown in Figure 5.2.
Figure 5.2 Evolution of substrate, intermediates, product, and C-balance in the liquid-phase
hydrogenation of azoxybenzene (0.4 mmol substrate, 10 bar H2, 100 °C) over Au/CeO2 (y-axis
relative to the stoichiometric coefficient of aniline); (�) azoxybenzene, (�) azobenzene, (■) aniline,
and (�) C-balance.
The amount of azoxybenzene decreased exponentially until azoxybenzene was fully
converted after 250 min. Azobenzene was the intermediate product in the formation of
aniline. Both azobenzene and aniline were detected in the liquid phase already after 5 min of
reaction. The azobenzene concentration reached a maximum at approximately 90 min, after
which it steadily dropped until the end of the reaction. At 250 min, the azobenzene
concentration was approximately 25 % of its maximum concentration at 90 min. The C-
balance slightly fluctuated in the first 15 min of the reaction and remained above 95 %
throughout the whole reaction. The evolution of the different species detected in the liquid
0 50 100 150 200 2500.0
0.1
0.2
0.3
0.4
0.5
0.6
0.7
0.8
C-b
ala
nce
/ %
n /
mm
ol
t / min
0
20
40
60
80
100
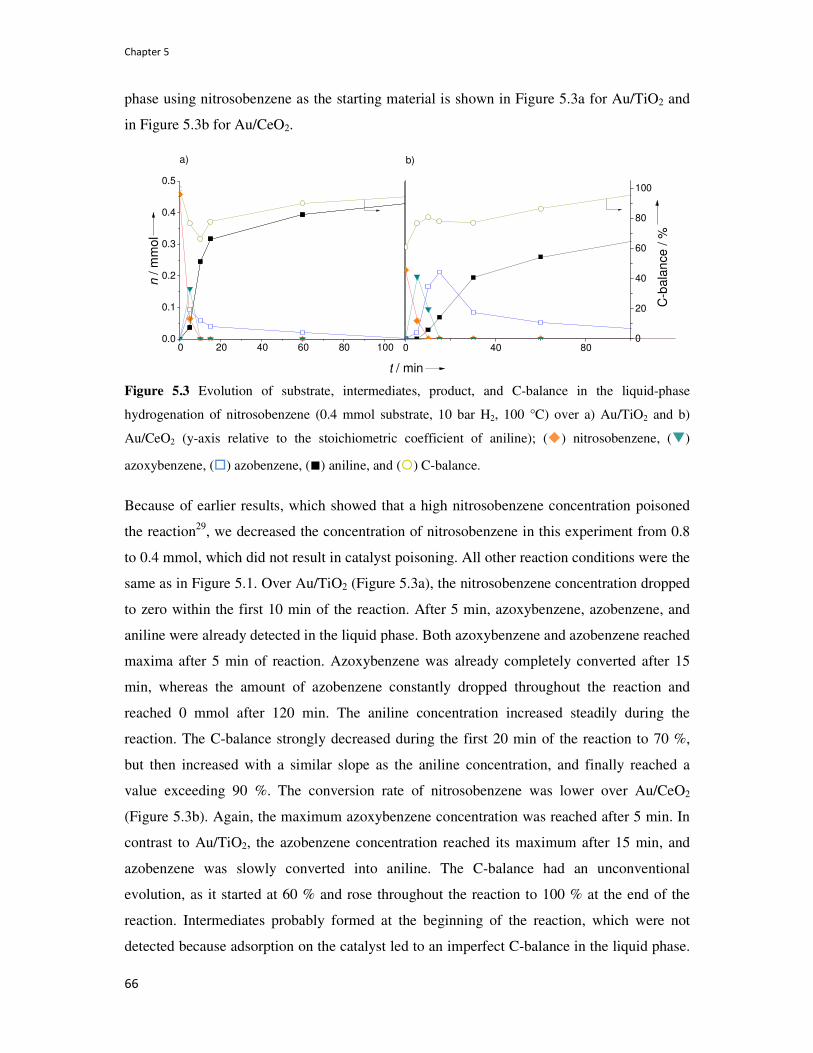
Chapter 5
66
phase using nitrosobenzene as the starting material is shown in Figure 5.3a for Au/TiO2 and
in Figure 5.3b for Au/CeO2.
Figure 5.3 Evolution of substrate, intermediates, product, and C-balance in the liquid-phase
hydrogenation of nitrosobenzene (0.4 mmol substrate, 10 bar H2, 100 °C) over a) Au/TiO2 and b)
Au/CeO2 (y-axis relative to the stoichiometric coefficient of aniline); (�) nitrosobenzene, (�)
azoxybenzene, (�) azobenzene, (■) aniline, and (�) C-balance.
Because of earlier results, which showed that a high nitrosobenzene concentration poisoned
the reaction29, we decreased the concentration of nitrosobenzene in this experiment from 0.8
to 0.4 mmol, which did not result in catalyst poisoning. All other reaction conditions were the
same as in Figure 5.1. Over Au/TiO2 (Figure 5.3a), the nitrosobenzene concentration dropped
to zero within the first 10 min of the reaction. After 5 min, azoxybenzene, azobenzene, and
aniline were already detected in the liquid phase. Both azoxybenzene and azobenzene reached
maxima after 5 min of reaction. Azoxybenzene was already completely converted after 15
min, whereas the amount of azobenzene constantly dropped throughout the reaction and
reached 0 mmol after 120 min. The aniline concentration increased steadily during the
reaction. The C-balance strongly decreased during the first 20 min of the reaction to 70 %,
but then increased with a similar slope as the aniline concentration, and finally reached a
value exceeding 90 %. The conversion rate of nitrosobenzene was lower over Au/CeO2
(Figure 5.3b). Again, the maximum azoxybenzene concentration was reached after 5 min. In
contrast to Au/TiO2, the azobenzene concentration reached its maximum after 15 min, and
azobenzene was slowly converted into aniline. The C-balance had an unconventional
evolution, as it started at 60 % and rose throughout the reaction to 100 % at the end of the
reaction. Intermediates probably formed at the beginning of the reaction, which were not
detected because adsorption on the catalyst led to an imperfect C-balance in the liquid phase.
0 20 40 60 80 1000.0
0.1
0.2
0.3
0.4
0.5
0 40 80
b)
C-b
ala
nce / %
n / m
mol
a)
t / min
0
20
40
60
80
100

Hydrogenation of nitrobenzene over Au/MeOx catalysts – a matter of the support
67
Nitrosobenzene is a candidate for such an adsorbed intermediate. The concentration profile of
the nitrobenzene hydrogenation over Au/TiO2 with addition of CeO2 is shown in Figure 5.4a.
Figure 5.4 a) Evolution of substrate, intermediates, product, and C-balance in the liquid-phase
hydrogenation of nitrobenzene (0.8 mmol substrate, 10 bar H2, 100 °C) on a Au/TiO2 catalyst with the
addition of an equal mass amount of pure CeO2 (y-axis relative to the stoichiometric coefficient of
aniline); (�) nitrobenzene, (�) azoxybenzene, (�) azobenzene, (■) aniline, and (�) C-balance. b)
Evolution of the nitrobenzene concentration in the liquidphase hydrogenation of nitrobenzene (0.8
mmol substrate, 10 bar H2, 100 °C) on a Au/TiO2 catalyst with (����) and without the addition of pure
CeO2 (����).
In contrast to the CeO2 free reaction, azoxybenzene and azobenzene were detected in a
similar time dependence as the reaction of nitrobenzene over Au/CeO2 (Figure 5.1b). The C-
balance was > 95 % throughout the reaction, except after 5 min, when it dropped to
approximately 80 % at the onset of azoxy- and azobenzene production. In contrast to the
reaction over pure Au/TiO2 (Figure 5.1a), the nitrobenzene and aniline concentrations did not
mirror each other, which would be indicative for the formation of reaction intermediates.
Adding TiO2 to Au/CeO2 did not lead to any changes in the concentration profile of pure
Au/CeO2 (not shown). The nitrobenzene concentration profiles of the experiments with
(hexagons) and without (pentagons) the addition of CeO2 are shown in Figure 5.4b. The
nitrobenzene concentration dropped faster in the first 20 min when CeO2 was added to the
mixture. The enhanced conversion of nitrobenzene after addition of CeO2 correlated
quantitatively with the amounts of azo- and azoxybenzene, suggesting that CeO2 initiated an
additional parallel reaction channel in the reaction. Hydrogenation of all the known
intermediates in the direct and condensation route over bare TiO2 and CeO2 were tested to
identify the differences between the two supports. The only difference was found in the
0 20 40 60 800.0
0.1
0.2
0.3
0.4
0.5
0.6
0.7
0.8
0 20 40 60 80 100
C-b
ala
nce / %
b)n
/ m
mol
a)
t / min
0
20
40
60
80
100

Chapter 5
68
reaction of phenylhydroxylamine, which is a rather unstable species and which decomposed
faster into nitrosobenzene and aniline in the presence of CeO2 than in the presence of TiO2.
5.4. Disucssion
For the hydrogenation of nitrobenzene, both direct and condensation routes were observed.
Azoxybenzene could be formed through the condensation of nitrosobenzene and
phenylhydroxylamine. Thus, for the direct route to occur, nitrosobenzene and
phenylhydroxylamine should be present in low concentrations to prevent azoxybenzene
formation. However, the intermediates phenylhydroxylamine and nitrosobenzene can also
form azoxybenzene by themselves. Phenylhydroxylamine easily disproportionates into
nitrosobenzene and aniline.136 The so-formed nitrosobenzene can then condensate with
another molecule of phenylhydroxylamine to form azoxybenzene. In the case of
nitrosobenzene, two molecules can form a dimer and then react with another molecule of
nitrosobenzene to form azoxybenzene and nitrobenzene.137 Thus, for the condensation route
to occur, accumulation of nitrosobenzene and/or phenylhydroxylamine is necessary to form
azoxybenzene according to one of the ways described above, which is subsequently
converted into aniline via azobenzene. The direct route dominates over Au/TiO2,48,136 and
accumulation of phenylhydroxylamine on the surface of the catalyst has been observed.29 We
found that hydrogenation was sufficiently fast over Au/TiO2 to prevent condensation of
phenylhydroxylamine with nitrosobenzene, which was formed either from nitrobenzene or by
phenylhydroxylamine decomposition, but slower than over Au/CeO2. Phenylhydroxylamine
has been found as an intermediate on the surface of the catalyst during the liquid-phase
hydrogenation of nitrobenzene by using liquid-phase attenuated-total-reflectance (ATR FT-
IR) measurements.29 FT-IR measurements have revealed that nitrosobenzene reacts to aniline
via phenylhydroxylamine in the gas phase.48 In contrast, we identified azoxybenzene as the
primary product by using liquid-phase experiments, which was transformed into aniline via
azobenzene over both Au/TiO2 and Au/CeO2. Most likely, the condensation route was
suppressed because the molecules that form azoxybenzene could not condensate in the gas
phase. Thus, the reaction over Au/TiO2 can also proceed through the condensation route
when the concentration of nitrosobenzene is high enough. Au/TiO2 rapidly converts
nitrosobenzene, which is also converted rapidly over Au/CeO2; however, the large loss of C-
balance suggests that initially a large amount adsorbs on CeO2, which leads to a high surface
concentration. Hydrogenation of nitrobenzene over Au/CeO2 (Figure 5.1b) proceeds through
the condensation route and at a considerably slower rate than over Au/TiO2. This lower

Hydrogenation of nitrobenzene over Au/MeOx catalysts – a matter of the support
69
hydrogenation rate and the fast decomposition of phenylhydroxylamine could lead to a
buildup of nitrosobenzene molecules on the surface of CeO2, which allows for the
condensation route to occur. Adsorption of large amounts of nitrosobenzene can be assumed
because the C-balance is reduced directly after exposing CeO2 to nitrosobenzene (Figure
5.3b). Adding CeO2 to Au/TiO2 yields the condensation products azoxybenzene and
azobenzene, which are probably formed through nitrosobenzene accumulation on the CeO2
surface. The nitrobenzene concentration drops faster when CeO2 is added to the reaction
mixture when Au/TiO2 is used as the catalyst. In addition to the direct route that occurs over
Au/TiO2, CeO2 catalyzes the condensation route through accumulation of
phenylhydroxylamine and its decomposition into nitrosobenzene or through accumulation of
nitrosobenzene directly. The result is a reaction that occurs through the condensation route.
The direct route is not strongly affected, probably because the surface concentration of
phenylhydroxylamine on Au/TiO2 remains sufficiently high to poison the reaction.29
5.5. Conclusion
The hydrogenation of nitrobenzene over Au/TiO2 proceeds through the direct route, whereas
the hydrogenation reaction over Au/CeO2 proceeds through the condensation route. For the
condensation route to occur, a high (surface) nitrosobenzene concentration is necessary. In
the case of Au/TiO2, nitrosobenzene is rapidly converted into phenylhydroxylamine, which
accumulates on the surface and is then transformed to aniline. The concentration of
nitrosobenzene is never high enough to form azoxybenzene. For Au/CeO2, the rate of
hydrogenation is considerably lower, and the conversion of nitrobenzene and nitrosobenzene
are slower; as a result, nitrosobenzene can accumulate and form condensation intermediates.
An additional path to nitrosobenzene is the decomposition of phenylhydroxylamine, which is
especially fast over the CeO2 support. Furthermore, the CeO2 support catalyzes the
condensation. The support has a direct impact on the reaction mechanism and actively
changes the reaction route.

Chapter 5
70

Chapter 6
Organic thiol modified Pt/TiO2 catalysts to control
chemoselective hydrogenation of substituted
nitroarenes
(Reprinted with permission from Makosch, M.; Lin, W.-I.; Bumbálek, V.; Sá, J.; Medlin, J. W.; Hungerbühler, K.; van Bokhoven, J. A. ACS Catal. 2012, 2079. Copyright 2012 American Chemical Society.) [Martin Makosch performed the experiments, did the data analysis and wrote the manuscript]

Chapter 6
72
6.
6.1. Introduction
Hydrogenation reactions over heterogeneous catalysts are of industrial as well as of scientific
interest.21 An optimal hydrogenation catalyst combines high activity, selectivity, and stability.
For generally employed supported metals in hydrogenation catalysts such as Pt and Pd,
selectivity control is an issue when more reducible groups are present in the same molecule.
An example for such a reduction is the hydrogenation of substituted nitroarenes to the
corresponding anilines which are important substrates for pharmaceuticals, dyes and
pigments.27 The conventional Pt and Pd catalysts simultaneously reduce the nitro- and all
other reducible groups in the molecule. A way to circumvent this problem is to use less active
metals, such as gold26,37,136 or to modify the more active catalysts.20,34,35 There are various
surface modifications reported in the literature for a variety of catalytic challenges.23,138-141
Modification via ligands is a well established method to tune the performance of catalysts.
Recently PVP stabilized Rh nanoparticles were modified via phosphine ligands to tune the
performance during the hydrogenation of substituted aromatics.141 Upon modification with
several different bulky phosphine ligands, the selectivity towards ring hydrogenation could be
increased to values greater than 90 % during the liquid phase hydrogenation of
phenylacetone. In this study, we report a new simple surface modification procedure for
supported Pt particles on TiO2 employing organic thiols to selectively hydrogenate 4-nitro- to
4-aminostyrene in the liquid phase. Scheme 6.1 summarizes the effect of our modification.
Scheme 6.1 Products observed during the liquid phase hydrogenation of 4-nitrostyrene at 80 °C under
10 bars H2 in toluene over an unmodified Pt/TiO2 (left) and an organic thiol modified Pt/TiO2 catalyst
(right).
Performing the hydrogenation over an unmodified Pt/TiO2 catalyst yields 4-
ethylnitrobenzene and 4-ethylaniline simultaneously. Upon modification with organic thiols
the selectivity of the catalyst can be switched so that the primary product of the
hydrogenation reaction is exclusively 4-aminostyrene.

Organic thiol modified Pt/TiO2 catalysts to control chemoselective hydrogenation of substituted nitroarenes
73
6.2. Experimental section
6.2.1. Catalyst preparation and modification
All Pt/TiO2 catalysts used in this work were synthesized via incipient wetness impregnation.
To obtain a nominal 1 wt% Pt-loading, 80.2 mg tetra-amine-platinum (II) nitrate
(Pt(NH3)4(NO3)2, Aldrich Chemicals) were dissolved in 3.7 ml deionized water. This solution
was added dropwise to 4 g of support (TiO2 P25 Acros) under vigorous mixing. The resulting
powder was heated to 200 °C at a rate of 5 °C min-1 and kept at this temperature for 4 hours.
Subsequently, the powder was further heated to 400 °C at a rate of 5 °C min-1 and kept at this
temperature for 4 hours and then cooled down to room temperature. We refer to this catalyst
in the following as “as prepared”. Prior to reaction and modification, the as prepared catalyst
was pretreated in a flow of 100 ml min-1 5 % H2/He (v/v) at 250 °C (heating rate 2 °C min-1)
for 2 h. We refer to this catalyst as Pt/TiO2H250. A total of 600 mg of the freshly reduced
Pt/TiO2H250 catalyst was added to 100 ml of a 30 mM solution of the corresponding thiol in
ethanol (ethanol absolute, analytical grade, Scharlau) to obtain a nominal Pt/thiol ratio of
1:100. Prior to the addition of the catalyst the thiol/ethanol solution was always purged with
nitrogen under magnetic stirring (750 rpm) for 30 min. After the addition of the Pt/TiO2H250
catalyst the suspension was stirred (750 rpm) for 16 h under argon purging at room
temperature, filtered and washed three times with 125 ml ethanol and dried in vacuum
overnight.
6.2.2. Kinetic measurements
All hydrogenation reactions were performed in 50 ml Premex stainless steel autoclaves with
polyetheretherketone (PEEK) inlets. A typical reaction composition consisted of solvent (20
g, toluene, puriss > 99 %, Fluka Analytical), internal standard (1 mmol; mesitylene, puriss >
99 %, Sigma–Aldrich), catalyst (50 mg), and substrate (0.67 mmol, 4-nitrostyrene, purris >
95 %, TCI). This mixture was filled into an autoclave and purged three times after sealing by
using H2 (5 bar) and while stirring (1000 rpm). The autoclave was then pressurized to 10 bars
by using H2 and heated up to 80 °C (10 °C min-1) under constant stirring (1000 rpm), which
resembles the start of the reaction (T = 0 min). Samples were taken at fixed time intervals by
means of a sample tube. The samples were filtered and analyzed by GC using an Agilent

Chapter 6
74
7820A with an apolar 30 m HP 5 MS column. The temperature program consisted of 20 °C
min-1 heating steps from 80 to 300 °C at a split ratio of 60/1.
6.2.3. Transmission electron microscopy measurements
Transmission electron microscopy (TEM) measurements of the Pt/TiO2H250 catalyst, the
Pt/TiO2 catalyst after 1,6-hexanedithiol modification, and the 1,6-hexanedithiol modified
Pt/TiO2 catalyst after 2 h of reaction were performed on a HD2700CS (Hitachie, aberration-
corrected dedicated STEM, cold FEG, 200 kV) and a Tecnai F30 ST (FEI, FEG, 300 kV)
microscope. For that, the catalyst was suspended in ethanol and a drop of the suspension was
supported on a copper grid by evaporation of the solvent. To determine the particle size
distribution, TEM pictures were analyzed with the Image J software and 200 particles were
taken into account for each measurement.
6.2.4. Fourier transform infrared spectroscopy measurements
Fourier transform infrared measurements were recorded on a Bruker Equinox 55 FTIR
spectrometer. For that, pellets of 3 mg catalyst (Pt/TiO2H250 and 1,6-hexanedithiol modified
Pt/TiO2) mixed with 97 mg KBr were pressed at 5 tons for 1 min. Prior to the measurement, a
background spectrum in air was recorded with 50 scans per spectrum. Samples were recorded
between 4500 and 1000 cm-1 with a resolution of 1 cm-1. 1000 scans per spectrum were
averaged. The spectrum of the 1,6-hexanedithiol modified Pt/TiO2 catalyst was background
corrected with the spectrum of the Pt/TiO2H250 catalyst and a constant air background. The
raw data was smoothed by 25 points using the OPUS software.
6.3. Results and discussion
Figure 6.1 shows characteristic TEM images of the Pt/TiO2 catalyst, the Pt/TiO2 catalyst
modified with 1,6-hexanedithiol and the Pt/TiO2 catalyst modified with 1,6-hexanedithiol
after 2 h of hydrogenation of 4-nitrostyrene in toluene at 80 °C under 10 bars H2.

Organic thiol modified Pt/TiO2 catalysts to control chemoselective hydrogenation of substituted nitroarenes
75
Figure 6.1 Particle size distribution (left) and characteristic TEM image (right) of a) Pt/TiO2 catalyst;
b) Pt/TiO2 catalyst modified with 1,6-hexanedithiol c) Pt/TiO2 catalyst modified with 1,6-
hexanedithiol after 2 h of hydrogenation of 4-nitrostyrene in toluene at 80 °C under 10 bars H2.
The unmodified Pt/TiO2 catalyst (Figure 6.1a) showed an averaged particle size of 1.2 nm
with a narrow Gaussian size distribution. The Pt particles were homogeneously dispersed
over the TiO2 support. Modification with 1,6-hexanedithiol (Figure 6.1b) broadened the size
distribution and slightly shifted the maximum of the Pt nanoparticles to 1.4 nm. The Pt
nanoparticles were still highly distributed over the TiO2 crystallites. After the hydrogenation
reaction the size distribution of the Pt crystallites was slightly narrower and the maximum
was again located at 1.2 nm, whereas the nanoparticles were located at the rim of the TiO2
support (Figure 6.1c). Figure 6.2 shows the FT-IR spectrum of the 1,6-hexanedithiol
modified Pt/TiO2 catalyst.
0.6 0.8 1.0 1.2 1.4 1.6 1.8 2.0 2.2 2.40
5
10
15
20
Cou
nt
Diameter / nm
0.6 0.8 1.0 1.2 1.4 1.6 1.8 2.0 2.2 2.40
10
20
30
40
50
60
Cou
nt
Diameter / nm
0.6 0.8 1.0 1.2 1.4 1.6 1.8 2.0 2.2 2.40
10
20
30
40
50
60
Co
un
tDiameter / nm
a)
b)
c)

Chapter 6
76
Figure 6.2 FT-IR spectra of the 1,6-hexanedithiol modified Pt/TiO2 catalyst. Modes: ν-: asymmetric
methylene stretch vibration; ν+: symmetric methylene stretch vibration; O-H ν: O-H stretch vibration;
S-H ν: S-H stretch vibration.
Features at 2926 cm-1 and 2855 cm-1 are characteristic for the asymmetric and symmetric C-H
methylene stretch vibration. The shift of these bands compared to liquid 1,6-hexanedithiole to
higher frequencies indicates less gauche defects in the alkane chains and thus an ordered
structure of the adsorbed 1,6-hexanedithiole due to a high coverage.25 The diminished S-H
vibration at 2520 cm-1 compared to pure 1,6-hexanedithiol is an indication that the 1,6-
hexanedithiole modifier adsorbs via the thiol group on the Pt-nanoparticles.
Figure 6.3 shows the kinetics of the liquid phase hydrogenation of 4-nitrostyrene over a) the
Pt/TiO2 catalyst and b) the 1,6-dithiolhexane-modified Pt/TiO2 catalyst.
Figure 6.3 Evolution of substrate, intermediates, products and C-balance in the liquid phase
hydrogenation of 4-nitrostyrene: (�) 4-nitrostyrene, (�) 4-ethylnitrobenzene, (■) 4-ethylaniline, (�)
4-aminostyrene, and (�) C-balance over a) Pt/TiO2 and b) 1,6-dithiolhexane-modified Pt/TiO2.
Reaction at 80 °C with 50 mg catalyst under 10 bars H2 in 25 ml toluene.
3800 3600 3400 3200 3000 2800 2600 2400
0.94
0.96
0.98
1.00
1.02
tran
sm
issio
n / a
.u.
wavenumber / cm-1
2926 cm-1
ν-
2855 cm-1
ν+
2520 cm-1 S-H ν
3434 cm-1 O-H ν
0 5 10 15 20 25 30
0
20
40
60
80
100
0 5 10 15 20 25 30
norm
aliz
ed q
uantity
/ %
C-b
ala
nce /
%
t / min
0
20
40
60
80
100
a) b)

Organic thiol modified Pt/TiO2 catalysts to control chemoselective hydrogenation of substituted nitroarenes
77
Over Pt/TiO2, the concentration of 4-nitrostyrene decreased exponentially over the reaction
time and was fully converted within about 30 min. The primary product was 4-
ethylnitrobenzene. After 10 min, 4-ethylaniline was observed among the products. The
concentration of both compounds increased with time; the 4-ethylnitrobenzene concentration
increased stronger than that of 4-ethylaniline. After longer reaction times (not shown) 4-
ethylnitrobenzene was fully converted to the final product 4-ethylaniline. The carbon balance
was always in excess of 95 % and thus no side reactions occurred to a significant extent. A
completely different behavior was observed for the thiol-modified catalysts, of which 1,6-
dithiolhexane is shown as example. The modified catalyst converted 4-nitrostyrene to 4-
aminostyrene as the exclusive product. Thus, a complete switch of selectivity was achieved
by the surface modification. This high selectivity could be maintained at all conversion
levels. The yield of 4-aminostyrene was close to 100 %. The evolution of the 4-aminostyrene
proceeded almost as mirror image of the 4-nitrostyrene concentration. At 100 % conversion
traces of 4-ethylaniline were observed among the products. After longer reaction times, (not
shown) 4-aminostyrene fully converted to the completely hydrogenated product 4-
ethylaniline. No phenylhydroxylamine derivates were observed at any point of the reaction,
also indicated by a carbon balance in excess of 95 % during the whole reaction.
We determined the effect of different organic thiols on selectivity and activity during the
liquid phase hydrogenation of 4-nitrosytrene.
Table 6.1 summarizes the selectivity and rate at ~40 % conversion (a) of 4-nitrostyrene as
well as the selectivity at conversion levels close to 100 % (b) for the different modifiers. All
rates were obtained in the (near) linear regime of the 4-nitrostyrene conversion for all
unmodified and modified catalysts. This resembles a 0 order reaction as generally reported in
the literature and is thus concentration independent. The rates reported are therefore in the
absence of mass-transfer limitation as it is concentration dependent.142

Chapter 6
78
Table 6.1 Selectivity and rate of reaction at ~40 % conversion and selectivity at conversion levels
close to 100 % of 4-nitrostyrene during the liquid phase hydrogenation of 4-nitrostyrene with and
without surface modification. Reaction at 80 °C with 50 mg catalyst under 10 bars H2 in 25 ml
toluene.
Pt/TiO2 Selectivity to 4-aminostyrene
(%)a
Rate
(mmolgcat-1s-1)a
Selectivity to 4-aminostyrene
(%)b
No modifier 0 % 0.0647 0 %
thioglycerol 100 % 0.0027 97 %
1,6-dithiolhexane
100 % 0.0100 98 %
α-lipoic acid 100 % 0.0033 100 %
1-dodecanethiol
88 % 0.0096 64 % a about 40 % conversion; b near full conversion
4-aminostyrene was never observed among the products over the unmodified Pt/TiO2 catalyst
(Figure 6.3a). The rate at 40 % conversion for the unmodified Pt/TiO2 catalyst was the
highest observed of all the catalysts. This is not surprising as the thiols block part of the
surface of the Pt nanoparticles and thus also active sites.22 The modifier structure affected the
selectivity: the modifiers containing polar groups (thioglycerol, 1,6-hexanedithiol and α-
lipoic acid) yielded 100 % selectivity towards 4-aminostyrene whereas an unpolar modifier
(1-dodecanethiol) yielded only 88 % selectivity. This trend was obviously also observed at
conversion levels close to 100 %. The best results regarding selectivity gave the catalyst
modified with α-lipoic acid (100 % yield) followed by 1,6-hexanedithiol (98 %) and
thioglycerol (97 %). Compared to other modified catalysts at high conversion levels these
selectivities are outstanding.21 The different modifiers showed an influence on rates for 4-
nitrostyrene conversion. The lowest rates were observed for the thioglycerol modified
catalyst (0.0027 mmolgcat-1s-1) and the α-lipoic acid modified catalyst (0.0033 mmolgcat
-1s-1).
Higher rates were observed for 1-dodecanethiol (0.0096 mmolgcat-1s-1) and 1,6-hexanedithiol
(0.0100 mmolgcat-1s-1). In general the lack of selectivity of unmodified Pt catalysts for the
hydrogenation of substituted aromatics is ascribed to the flat adsorption via the benzene ring
and thus to a simultaneous exposure of the reducible groups towards the active sites.143 As all
modified Pt/TiO2 catalysts were treated with a molar 100-fold thiol modifier excess, likely,
maximum coverage was achieved for all catalysts.144 Thus the adsorbed thiol modifiers
prevent the flat adsorption of the substrate 4-nitrostyrene. A preferential interaction of the
nitro-group compared to the double bond with the TiO2 support thus leads to the observed
switch in selectivity. The difference between the polar and unpolar modifiers could originate

Organic thiol modified Pt/TiO2 catalysts to control chemoselective hydrogenation of substituted nitroarenes
79
from the intermolecular interaction of the functional groups with the neighboring modifier
leading to a denser coverage compared to the unpolar modifier. An outstanding
hydrogenation catalyst should yield excellent activity, selectivity, and stability. Therefore we
tested the 1,6-dithiolhexane modified catalyst in recycle experiments, where we topped up the
substrate and followed selectivity and conversion after 1 h. Figure 6.4 shows the conversion
of 4-nitrostyrene (red column) selectivity towards 4-aminostyrene (blue column), 4-
ethylnitrobenzene (green column) and 4-ethylaniline (orange column) after 3 cycles of
reaction.
Figure 6.4 Top-up recycle experiments over the 1,6-dithiolhexane modified Pt/TiO2 catalyst.
Conversion of 4-nitrostyrene (red column), selectivity towards 4-aminostyrene (blue column), 4-
ethylnitrobenzene (green column) and 4-ethylaniline (orange column) after 1 hour of reaction at 80 °C
with 50 mg catalyst under 10 bars H2 in 25 ml toluene.
For the first cycle 100 % conversion of 4-nitrostyrene was achieved with a selectivity of 95 %
towards 4-aminostyrene and 5 % 4-ethylaniline. In the second cycle, the catalyst converted 4-
nitrostyrene to 92 % conversion with selectivity towards 4-aminostyrene of 94 % and 6 %
towards 4-ethylaniline. In the 3rd cycle conversion and selectivity after 1 h decreased slightly
and 4-ethylnitrobenzene were observed among the reaction products. Conversion and
selectivities towards 4-aminostyrene, 4-ethylnitrobenzene and 4-ethylaniline of 85 %, 92 %, 2
% and 6 % were achieved. Performing more cycles showed a continuous loss in catalyst
performance. This compares favourably to industrial applied catalysts for this reaction as they
are often “one-shot” catalysts. The loss in selectivity towards 4-aminostyrene might be due a
1st cycle 2nd cycle 3rd cycle0
20
40
60
80
100
%

Chapter 6
80
degradation of the thiol-coverage on the Pt nanoparticles and the loss of activity could be due
to leaching or competition of the product with the substrate.
6.4. Conclusion
We showed a simple modification procedure to control the chemoselectivity over supported
Pt nanoparticles on TiO2 employing organic thiols as surface modifiers. A 100 % switch in
selectivity towards 4-aminostyrene was achieved. The variation of the modifier showed that
a polar group adjacent to the chain of the organic thiol revealed higher selectivities. The best
result was achieved with 1,6-dithiolhexane modified Pt/TiO2. This new system adds to the
“heterogeneous tool box” and may find application in other selective hydrogenation
challenges.

Chapter 7
Controlling the chemoselectivity of hydrogenation
reactions via surface modification over supported Pt
catalysts

Chapter 7
82
7.
7.1. Introduction
Hydrogenation reactions are one of the most important catalytic applications in the chemical
industry to produce bulk1 and fine chemicals.2 While bulk compounds are generally reduced
in a continuously working gas phase reactor1, fine chemicals with various functional groups
are hydrogenated in batch mode in the liquid phase2. The general way to produce substituted
anilines, which are valuable substrates for the production of agrochemicals, pharmaceuticals
and dyes, is to hydrogenate the corresponding nitroarenes in the liquid phase. These
hydrogenation reactions are challenging because various undesired side products can occur
when other reducible groups are present in the molecule and thus there is a strong demand for
new active and selective catalysts. Highly active catalysts for hydrogenation reactions, such
as supported Pt and Pd are mostly unselective because their catalytic active sites hydrogenate
all reducible groups present in a molecule. Several methods can be applied to tune selectivity
as well as activity such as modification with organic and inorganic modifiers20,34,35, choice of
solvent145-147, tailoring of metal particle size139,146 and varying the support.38,139,148 A well
known method to tune selectivity via organic surface modifiers is applied for the
heterogeneous asymmetric catalysis, where supported Ni, Pd and Pt catalysts are modified
with cinchonidine or tartaric acid derivatives to enhance the enantiomeric excess for the
hydrogenation of activated ketones.149 There are two main approaches to generate active and
highly selective catalysts; the first is to increase the activity of a very selective catalyst; the
second is to modify an active catalyst to make it more selective. An example for making a
selective catalyst more active is hydrogenation of nitrostyrene over supported gold. Gold
supported on TiO2 or Fe2O3 shows interesting features in the chemoselective reduction of
nitroarenes in the presence of other reducible groups such as aldehyde and alkene groups26.
This catalyst is selective to the nitro-group without any modification and without the
accumulation of phenylhydroxylamine, a toxic and dangerous intermediate in this reaction.
The drawback of this system is these catalysts have low activity compared to other noble
metals such as Pt and Pd, because hydrogen splitting is considered to be the rate-limiting
step.37,48 A way to increase the hydrogen splitting activity is to add small amounts of more
active materials such as Pt to form alloys of the selective and active material.37,143 The
addition of Pt to a Au/TiO2 catalyst has a significant influence on the turn-over-frequency
(TOF) for the selective hydrogenation of 3-nitrostyrene to 3-vinylaniline and in some cases a
higher activity of the catalyst maintaining the selectivity towards the nitro group was found.

Controlling the chemoselectivity of hydrogenation reactions via surface modification over supported Pt catalysts
83
Another experimental proof of this modification method was recently shown for the
hydrogenation of para-chloro-nitrobenzene.150 Here the addition of small amounts of Pt in the
range between 0.01 and 0.03 wt% significantly increased the activity for the hydrogenation
reaction while keeping the selectivity towards reduction of the nitro-group. A plausible
mechanism for the effect of the addition of platinum is that the nitro-group preferential
adsorbs on the Au-Ti boundaries whereas the hydrogen rapidly splits on the Pt atoms and
diffuses to the Au/TiO2 interface.37 A similar approach is used for the hydrogenation of α,β-
unsaturated carbonyl compounds. Fully dispersed Pt entities on Au/SiO2 catalysts improved
the catalytic activity up to 70-fold compared to Au/SiO2.49 Two prominent examples for the
second modification, i.e. making an active catalyst selective in the selective reduction of
nitro-groups are the Pt/C-H3PO2-VO(acac)2 and the PtPb/CaCO3-FeCl2-nBu4NCl catalysts.21
These catalysts are successful for the chemoselective hydrogenation of a chlorinated allyl
nitrobenzoate to the corresponding aniline in excellent yields. The high selectivity of these
catalysts are explained via an electrochemical reduction of the nitro-group135. As the Pt
surface is covered by lead or phosphorous groups, adsorption of the molecule cannot occur
whereas H2 has still access to the Pt surface and is dissociated; the reduction of the nitro- to
the aniline-group occurs subsequently electrochemically at the vicinity of the metal particle.
Recently another interesting example of making an active catalyst more selective was
reported for the gas phase selective hydrogenation of 1-epoxy-3-butene to 1-epoxybutan.23 A
Pd/Al2O3 catalyst was modified with various thiol molecules to form a self assembled
molecule (SAM) structure on the surface of the Pd particles. Due to these SAM coatings the
selectivity towards 1-epoxybutan was increased from 11 % for the uncoated catalyst to 94 %
for the SAM coated Pd/Al2O3 catalyst while keeping 40 % of activity of the bare Pd/Al2O3
catalyst.
We showed in Chapter 6 that a 100 % switch of selectivity during the hydrogenation of 4-
nitrostyrene can be achieved via the modification of supported Pt catalysts with organic
thiols.151 Scheme 7.1 shows the effect of our modification on the platinum catalysts during
the liquid phase hydrogenation of 4-nitrostyrene in toluene at 10 bars H2.

Chapter 7
84
Scheme 7.1 Products observed during the liquid phase hydrogenation of 4-nitrostyrene at 80 °C under
10 bars H2 in toluene over an unmodified Pt/MeOx (left) and an organic thiol modified Pt/MeOx
catalyst (right). (MeOx = Al2O3, TiO2)
We here aim to better understand the observed effect of the surface modification. For our
studies we selected the Pt/Al2O3 catalyst modified with 1-thioglycerol. The catalyst was
characterized by means of transmission electron microscopy (TEM), Fourier transform
infrared spectroscopy (FT-IR), and in situ high energy resolution fluorescence detected X-ray
near edge absorption spectroscopy (HERFD XANES).4,73 IR spectroscopy is an established
method to characterize self assembling monolayer (SAM) coated surfaces and SAM-
stabilized nanoparticles.144,152 FT-IR measurements have been used to establish the degree of
order of the chains adjacent to the bonding group of the SAMs as well as what functional
group is bound to the metal surface. HERFD XANES allows determination of the electronic
and geometric structure of the Pt particles. By detecting a fluorescence line with an
instrumental energy bandwidth on the order of the core hole lifetime broadening HERFD
XANES spectra are obtained with a good signal to background ratio with line-sharpened
absorption features making it sensitive to the chemical environment.74,76,119,153 The effect of
the kind of surface modifier, support, the modifier concentration during modification, the
catalyst structure during reaction and the modification with H2S are discussed. We propose a
model that explains the change in reaction mechanism through the surface modifier.
7.2. Experimental Section
7.2.1. Catalyst preparation and modification
All Pt/Al2O3 catalysts used in this work were synthesized via incipient wetness impregnation.
To obtain a nominal 1 wt% Pt-loading, 80.2 mg tetra-amine-platinum (II) nitrate
(Pt(NH3)4(NO3)2, Aldrich Chemicals) were dissolved in 3.7 ml deionized water. This solution
was added dropwise to 4 g of support (Aluminiumoxid C, Degussa) under vigorous mixing.
The resulting powder was heated to 200 °C at a rate of 5 °C min-1 and kept at this temperature
for 4 hours. Subsequently, the powder was further heated to 400 °C at a rate of 5 °C min-1 and

Controlling the chemoselectivity of hydrogenation reactions via surface modification over supported Pt catalysts
85
kept at this temperature for 4 hours and then cooled down to room temperature. We refer to
this catalyst in the following as “as prepared”. Prior to reaction and modification, the as
prepared catalyst was pretreated in a flow of 100 ml min-1 5 % H2/He (v/v) at 250 °C (heating
rate 2 °C min-1) for 2 h. We refer to this catalyst as Pt/Al2O3H250. A total of 600 mg of the
freshly reduced Pt/Al2O3H250 catalyst was added to 100 ml of a 30 mM solution of the
corresponding thiol in ethanol (ethanol absolute, analytical grade, Scharlau) to obtain a
nominal Pt/thiol ratio of 1:100. For dilution experiments Pt/thiol ratios of 1:100, 1:50, 1:25,
1:10 and 1:1 were employed. The ratio Pt/thiol was varied by changing the molarity of the
solution. Prior to the addition of the catalyst the thiol/ethanol solution was always purged
with argon under magnetic stirring (750 rpm) for 30 min. After the addition of the
Pt/Al2O3H250 catalyst the suspension was stirred (750 rpm) for 16 h under argon purging at
room temperature, filtered and washed three times with 125 ml ethanol and dried in vacuum
overnight. We refer to the 1-thioglycerol modified Pt/Al2O3H250 catalyst as PtGLYC/Al2O3.
All Pt/thiol ratios given throughout the text reflect the ratio during modification.
H2S modification was done in a three necked flask. H2S was produced by treating 270 mg
FeS with HCl to mimic the 1:100 Pt/S ratio used for thiol modification. A total of 600 mg of
the Pt/Al2O3H250 catalyst at the top of the flask were exposed to H2S atmosphere for 16
hours at room temperature.
7.2.2. Kinetic measurements
All hydrogenation reactions were performed in 50 ml Premex stainless steel autoclaves with
polyetheretherketone (PEEK) inlets. A typical reaction composition consisted of solvent (20
g, toluene, puriss > 99 %, Fluka Analytical), internal standard (1 mmol; mesitylene, puriss >
99 %, Sigma–Aldrich), catalyst (50 mg), and substrate (0.67 mmol, 4-nitrostyrene, purris >
95 %, TCI). This mixture was filled into an autoclave and purged three times after sealing by
using H2 (5 bar) and while stirring (1000 rpm). The autoclave was then pressurized to 10 bars
by using H2 and heated up to 80 °C (10 °C min-1) under constant stirring (1000 rpm), which
resembles the start of the reaction (T = 0 min). Samples were taken at fixed time intervals by
means of a sample tube. The samples were filtered and analyzed by GC using an Agilent
7820A with an apolar 30 m HP 5 MS column. The temperature program consisted of 20 °C
min-1 heating steps from 80 to 300 °C at a split ratio of 60/1.
.

Chapter 7
86
7.2.3. Transmission electron microscopy measurements
Transmission electron microscopy (TEM) measurements of the Pt/Al2O3H250 catalyst, the
PtGLYC/Al2O3 catalyst, and the Pt GLYC /Al2O3 catalyst after 4 h of reaction were performed on
a HD2700CS (Hitachie, aberration-corrected dedicated STEM, cold FEG, 200 kV) and a
Tecnai F30 ST (FEI, FEG, 300 kV) microscope. For that, the catalyst was suspended in
ethanol and a drop of the suspension was supported on a copper grid by evaporation of the
solvent. To determine the particle size distribution, TEM pictures were analyzed with the
Image J software and 200 particles were taken into account for each measurement.
7.2.4. Fourier transform infrared spectroscopy measurements
Fourier transform infrared measurements were recorded on a Bruker Equinox 55 FTIR
spectrometer. For that, pellets of 3 mg catalyst (Pt/Al2O3H250 and PtGLYC/Al2O3) mixed with
97 mg KBr were pressed at 5 tons for 1 min. A drop of liquid 1-thioglycerol was measured
between two KBr pellets as reference. Prior to the measurement, a background spectrum in
air was recorded with 50 scans per spectrum. Samples were recorded between 4500 and 500
cm-1 for the liquid 1-thioglycerol and between 4000 and 1000 cm-1 for the Pt/Al2O3H250 and
PtGLYC/Al2O3 catalysts with a resolution of 1 cm-1. 1000 scans per spectrum were averaged.
The spectrum of the PtGLYC/Al2O3 catalyst was background corrected with the spectrum of the
Pt/Al2O3H250 catalyst and a constant air background. The raw data was smoothed by 25
points using the OPUS software.
7.2.5. In situ high energy resolution fluorescence detected X-ray absorption
near edge spectroscopy measurements
In situ high energy resolution fluorescence detected X-ray absorption near edge spectroscopy
(HERFD XANES) measurements were performed in a cell previously described in 68. The
cell consisted of a standard 50 ml autoclave with an opening for irradiation of X-rays. A
suspension of 300 mg catalyst in 25 g of toluene (puriss > 99 %, Fluka Analytical) was put
into the cell and purged three times with 10 bars H2 at 80 °C and finally pressurized to 10
bars. HERFD XANES spectra were recorded under stirring for 30 min with a time interval of
1 min per spectrum. After that the cell was opened and 300 mg 4-nitrostyrene (puriss > 95 %,
TCI) were added to the reaction mixture. The cell was closed and purged 3 times with 10 bars
H2 under stirring (1500 rpm) maintaining the temperature at 80 °C. The reaction started and
HERFD XANES spectra were recorded during the whole reaction with a time interval of 1

Controlling the chemoselectivity of hydrogenation reactions via surface modification over supported Pt catalysts
87
min per spectrum. All experiments were recorded at beamline ID26 of the European
Synchrotron Radiation Facility (ESRF) in Grenoble, France. The ring operated in uniform
mode at a ring current of 200 mA. Three coupled undulators using the third harmonic were
employed for the HERFD XANES measurements. The incident energy was
monochromatized by a pair of Si(111) crystals. Three Pd/Cr mirrors positioned at 2.5 mrad
relative to the incident beam were used to suppress higher harmonics and focus the beam on
the sample with a size of 600 µm horizontal by 200 µm vertical. The estimated flux was
8x10¹³ photons s-1. HERFD XANES spectra were measured by using a vertical-plane
Rowland circle X-ray emission spectrometer in combination with an avalanche photodiode
(APD, Perkin Elmer).76 The scattering angle in the horizontal plane was about 130°. The
spectrometer was tuned to the Pt Lα1 fluorescence line (9442 eV) using the [660] reflection of
four spherically bent Ge crystals, that is, working at a Bragg angle of about 80 °. A total
resolution of 1.93 eV (FWHM) was obtained. The raw HERFD XANES spectra were treated
with the Athena software.77 After background subtraction the raw data were normalized to the
last point of each spectrum and 30 spectra were averaged. Exposure of the slurry to X-rays
did not cause any changes to the spectra and thus beam damage did not occur.
7.3. Results
7.3.1. Kinetic measurements
Figure 7.1 shows the kinetic profile of the hydrogenation of 4-nitrostyrene in toluene at 80 °C
in 10 bars H2 over the Pt/Al2O3H250 catalyst (Figure 7.1a) and the PtGLYC/Al2O3 catalyst
(Figure 7.1b).

Chapter 7
88
Figure 7.1 Evolution of substrate, intermediates, products and C-balance in the liquid phase
hydrogenation of 4-nitrostyrene: (�) 4-nitrostyrene, (�) 4-ethylnitrobenzene, (■) 4-ethylaniline, (�)
4-aminostyrene, and (�) C-balance over a) Pt/Al2O3H250 (10 mg) and b) PtGLYC/Al2O3 (50 mg,
Pt/thiol 1:100). Reaction at 80 °C under 10 bars H2 in toluene.
During the hydrogenation reaction over Pt/Al2O3H250 the amount of 4-nitrostyrene
decreased exponentially over time at an initial rate of reaction of 0.0033 mmol gcat-1 s-1 and
was fully consumed after 120 min. As initial reaction products 4-ethylnitrobenzene and 4-
ethylaniline were detected. The concentration of 4-ethylnitrobenzene linearly increased
during the first 30 min at an initial rate of 4-ethylnitrobenzene formation of 0.0021 mmol
gcat-1 s-1. After that, the slope flattened out. The increase of 4-ethylaniline was not as steep as
the one of 4-ethylnitrobenzene but linearly increased during 60 min of reaction at an initial
rate of 4-ethylaniline formation of 0.0010 mmol gcat-1 s-1. After that the increase flattened out
as well. After longer reaction time (> 4h, not shown) 4-ethylnitrobenzene was fully converted
into 4-ethylaniline. The carbon balance was always greater than 95 % throughout the whole
reaction. The hydrogenation reaction proceeded in a completely different fashion over the
PtGLYC/Al2O3 catalyst. 4-nitrostyrene was converted more slowly at an initial rate of reaction
of 0.0002 mmol gcat-1 s-1 and about 30 % conversion was achieved after 330 min of reaction.
4-aminostyrene was detected in the liquid phase as the only product and its concentration
continuously increased as a mirror image to the 4-nitrostyrene concentration over reaction
time at an initial rate of 4-aminostyrene formation of 0.0002 mmol gcat-1 s-1 respectively. Until
330 min of reaction the selectivity towards 4-aminostyrene was 100 %, and at that point
selectivity dropped slightly to 96 % as small amounts of 4-ethlynitrobenzene were detected.
Even for higher conversions (> 80 %, not shown) the selectivity towards 4-aminostyrene
remained always above 95 %. Below 100 % conversion of 4-nitrostyrene, no 4-ethylaniline
0 50 1000.0
0.1
0.2
0.3
0.4
0.5
0.6
0.7
0 50 100 150 200 250 300
b)
C-b
ala
nce / %
n / m
mol
a)
t / min
0
20
40
60
80
100

Controlling the chemoselectivity of hydrogenation reactions via surface modification over supported Pt catalysts
89
was detected in the liquid phase at any time. After long reaction times and 100 % conversion
of 4-nitrostyrene, 4-aminostyrene started to convert to 4-ethylaniline. No hydroxylamine
derivatives were detected in the liquid phase at any point in the reaction. These species are
undesired and dangerous intermediates often observed in this reaction especially when
platinum is used as active material34,35,136. The carbon balance was always greater than 90 %
throughout the whole reaction.
Table 7.1 summarizes the kinetic results for the Pt/Al2O3H250 catalyst, the different surface
modifiers and H2S modification.
Table 7.1 Selectivity and rate of reaction for 4-nitrostyrene at 20 % conversion of 4-nitrostyrene
during the liquid phase hydrogenation of 4-nitrostyrene before and after surface modification with
different surface modifiers and H2S. For all modifiers a Pt/thiol ratio of 1:100 was used during
preparation. Reaction at 80 °C under 10 bars H2 in toluene.
Surface modifier Selectivity to 4-aminostyrene at
20 % conversion (20 %)
Rate of reaction for 4-
nitrostyrene at 20 % conversion
(mmol gcat-1 s-1)
No modifier 0 0.0033
1-thioglycerol 100 0.0003
1,6-dithiohexane 100 0.0010
α-lipoic-acid 100 0.0002
1-dodecanethiol 95 0.0012
H2S no conversion no conversion
The type of modifier had little effect on the selectivity towards 4-aminostyrene at 20 %
conversion. The presence of a polar group adjacent to the chain of the surface modifier
yielded slightly higher values (100 % selectivity for 1-thioglycerol, 1,6-dithiohexane and α-
lipoic acid versus 95 % for 1-dodecanethiol). A small influence on the rate of reaction for 4-
nitrostyrene at 20 % conversion was observed. The highest rate (0.0012 mmol gcat-1 s-1) was
observed after modification with 1-dodecanethiol. A similar rate was observed after
modification with 1,6-dithiohexane (0.0010 mmol gcat-1 s-1) parallel with a higher selectivity
towards 4-aminostyrene. The same selectivity but a lower rate of reaction for 4-nitrostyrene
was observed for 1-thioglycerol (0.0003 mmol gcat-1 s-1). The lowest rate (0.0002 mmol gcat
-1
s-1) was observed for the α-lipoic acid modified Pt/Al2O3H250 catalyst. Surface modification
of Pt/Al2O3H250 with H2S completely poisoned the catalyst. During the reaction with the

Chapter 7
90
H2S modified Pt/Al2O3 catalyst, carbon balance was greater than 95 % at all time (compare
Figure 7.2).
Figure 7.2 Evolution of substrate, intermediates, products, and C-balance the liquid phase
hydrogenation of 4-nitrostyrene: (�) 4-nitrostyrene, (�) 4-ethylaniline, (■) 4-ethylnitrobenzene, (�)
4-aminostyrene, and (�) C-balance over Pt/Al2O3H250 treated with H2S (Pt/S 1:100). Reaction at 80
°C under 10 bars H2 in toluene.
Figure 7.3 shows the influence of the Pt to 1-thioglycerol ratio during preparation on the
selectivity and activity at 20 % conversion of 4-nitrostyrene.
Figure 7.3 Selectivity and rate dependence of preparation molar Pt/1-thioglycerol ratio; selectivity
towards 4-aminostyrene (red column), selectivity towards 4-ethylnitrobenzene (green column) and
rate of reaction for 4-nitrostyrene (black box) at 20 % conversion of 4-nitrostyrene. Reaction at 80 °C
under 10 bars H2 in toluene.
The highest selectivity towards 4-aminostyrene (100 %) but lowest activity (0.0003 mmol
gcat-1
s-1) at 20 % conversion of 4-aminostyrene was achieved with a 1:100 Pt/1-thioglycerol
0 50 100 150 200
0.0
0.1
0.2
0.3
0.4
0.5
0.6
0.7
C-b
ala
nce
/ %
n / m
mol
t / min
0
20
40
60
80
100
1:100 1:50 1:25 1:10 1:10
20
40
60
80
100
Ra
te / m
mol g
-1 ca
ts-1
Se
lectivity / %
Molar Pt / 1-thioglycerol ratio
0.0000
0.0005
0.0010
0.0015
0.0020

Controlling the chemoselectivity of hydrogenation reactions via surface modification over supported Pt catalysts
91
ratio during preparation. Increasing the Pt/1-thioglycerol ratio to 1:50 lead to higher activity
(0.0012 mmol gcat-1
s-1) and decreased selectivity to 83 % to 4-aminostyrene. Lowering the
Pt/thiol ratio during preparation further increased activity and decreased selectivity. For ratios
of 1:25, 1:10, 1:1 selectivity, respectively activity of 80 %, 72 %, 50 % and 0.0015 mmol gcat-
1 s
-1, 0.0016 mmol gcat-1
s-1 and 0.0020 mmol gcat
-1 s
-1 were found.
7.3.2. Catalyst characterization
Figure 7.4 shows the particle size distribution (left) and a characteristic TEM picture (right)
of a) Pt/Al2O3H250, b) PtGLYC/Al2O3 and c) PtGLYC/Al2O3 catalysts after 4 h of the
hydrogenation reaction.
Figure 7.4 Particle size distribution (left) and characteristic TEM image (right) of a) Pt/Al2O3H250
catalyst before reaction; b) PtGLYC/Al2O3 catalyst (Pt/thiol 1:100) before reaction; c) PtGLYC/Al2O3
catalyst (Pt/thiol 1:100) after 4 h of hydrogenation of 4-nitrostyrene in toluene at 80 °C under 10 bars
H2.
0.5 1.0 1.5 2.0 2.50
10
20
30
40
50
Co
un
t
Diameter / nm
0.5 1.0 1.5 2.0 2.50
10
20
30
40
50
Co
un
t
Diameter / nm
0.5 1.0 1.5 2.0 2.50
10
20
30
40
50
60
Co
un
t
Diameter / nm
a)
b)
c)
30 nm
15 nm
15 nm

Chapter 7
92
The particle size of the Pt/Al2O3H250 catalyst had a narrow size distribution with its
maximum at 0.9 nm, suggesting very small and widely dispersed Pt particles on the Al2O3
support. Only a small fraction of the Pt particles were bigger than 2 nm. Figure 7.4b) shows
the particle size distribution of the PtGLYC/Al2O3 catalyst. Due to the thiol treatment the
maximum particle size was shifted to values higher than 1 nm whereas the fraction of
particles smaller than 0.8 nm strongly diminished compared to Figure 7.4a). A larger fraction
of particles bigger than 1 nm were observed. Similar to Pt/Al2O3H250 only a small fraction of
the Pt nanoparticles were bigger than 2 nm. The PtGLYC/Al2O3 catalyst after the
hydrogenation of 4-nitrostyrene in toluene at 80 °C in 10 bars H2 (Figure 7.4c) did not show
remarkable changes compared to the freshly modified PtGLYC/Al2O3 catalyst. The maximum
of the particle size remained about 1.1 nm and slightly more particles were detected in the
range lower than 0.8 nm and higher than 2 nm. Overall, the reaction did not affect the particle
size to great extend.
Figure 7.5a) compares the FT-IR spectra of the PtGLYC/Al2O3 (I) catalyst and liquid 1-
thioglycerol (II) in the range from 4500 to 500 cm-1, whereas Figure 7.5b) shows a detail of
the same spectra in the range from 3700 cm-1 to 2400 cm-1. Table 7.2 summarizes the relevant
IR vibration features described below for liquid 1-thioglycerol and the PtGLYC/Al2O3 catalyst.
Figure 7.5 FT-IR spectra of the PtGLYC/Al2O3 catalyst (Pt/thiol 1:100) (I) and liquid 1-thioglycerol (II)
in the range of a) 4500 and 500 cm-1 and b) 3700 to 2400 cm-1.
The spectrum of liquid 1-thioglycerol (II) showed several bands characteristic of the O-H
stretch (3360 cm-1) vibration, the asymmetric and symmetric methylene C-H stretching (at
2930 cm-1 and 2880 cm-1 respectively) and the band for the S-H stretch (2550 cm-1). The band
at about 1640 cm-1 resulted from adsorbed water. The bands at 1430 cm-1 were a combination
of the methyl deformation and the methylene scissoring. In the spectrum of PtGLYC/Al2O3 (I),
4500 4000 3500 3000 2500 2000 1500 1000 500
0.4
0.6
0.8
1.0
1.2
Tra
nsm
issio
n / a
.u.
Wavenumber / cm-1
a) (I)
(II)
3500 3000 2500
0.4
0.6
0.8
Tra
nsm
issio
n / a
.u.
Wavenumber / cm-1
b)
(I)
(II)

Controlling the chemoselectivity of hydrogenation reactions via surface modification over supported Pt catalysts
93
the positions of the bands of the 1-thioglycerol were slightly shifted compared to those of
liquid 1-thioglycerol (II). The position of the O-H stretching vibration was shifted to higher
frequency (3400 cm-1). The presence of this band indicates that there is no interaction of the
O-H group with the Pt surface.154 The asymmetric and the symmetric methylen C-H stretch
were shifted to lower frequencies (2926 cm-1 and 2855 cm-1) for the PtGLYC/Al2O3 catalyst,
whereas the symmetric C-H methylene stretch was stronger shifted than the asymmetric one.
This shift of the bands is generally assigned to the more ordered orientation of the alkane
chains of 1-thioglycerol adsorbed on the Pt/Al2O3 catalyst compared to the “free” vibrations
in the liquid 1-thioglycerol due to the dense packing of the adsorbed molecules.155,156 The S-
H stretching vibration at about 2550 cm-1 was completely absent in the spectrum of the
PtGLYC/Al2O3 catalyst which shows that 1-thioglycerol adsorbed to the Pt surface via the S
atom.154,156
Table 7.2 Relevant IR vibration modes and bands for liquid 1-thioglycerol and the PtGLYC/Al2O3
catalyst.
Modea Band for 1-thioglycerol Band for PtGLYC/Al2O3
ν(O-H) 3360 cm-1 3400 cm-1
νas(C-H) 2930 cm-1 2926 cm-1
νs(C-H) 2880 cm-1 2855 cm-1
ν(S-H) 2550 cm-1 absent
δ(O-H) 1640 cm-1 (water) 1640 cm-1 (water)
δ (C-H) 1430 cm-1 1430 cm-1
a ν = stretching (s = symmetric, as = asymmetric), δ = scissoring, assignments according to the Wilson notation.
In situ HERFD XANES measurements were employed to investigate the structure of the Pt
nanoparticles under in situ and actual reaction conditions. Figure 7.6 shows a) the Pt LIII
HERFD XANES spectra in toluene at 80 °C and 10 bars H2 of the Pt/Al2O3H250 catalyst
(black) and the PtGLYC/Al2O3 catalyst (red) and b) the PtGLYC/Al2O3 catalyst at the beginning
(blue) and the end (green) of the hydrogenation reaction.

Chapter 7
94
Figure 7.6 a) Pt LIII HERFD XANES spectra in toluene at 80 °C under 10 bars H2 of Pt/Al2O3H250
(black) and PtGLYC/Al2O3 (Pt/thiol 1:100) (red); b) during the hydrogenation of 4-nitrostyrene of
PtGLYC/Al2O3 at 0 min (blue) and 240 min of reaction (green). Reaction at 80 °C under 10 bars H2 in
toluene.
The spectrum of the Pt/Al2O3H250 catalyst in Figure 7.6a) showed a first intense (whiteline)
feature at about 11566 eV. Additionally peaks were observed at about 11580 eV, about 11593
eV and about 11621 eV. The peak at about 11580 eV was characteristic for adsorbed
hydrogen157, whereas the features at about 11593 eV and about 11621 eV resemble Pt-Pt
scattering and thus identified the Pt nanoparticles. The whiteline of the PtGLYC/Al2O3 catalyst
was more intense and was slightly shifted to higher energies at about 11567 eV compared to
about 11566 eV of the Pt/Al2O3H250 catalyst, which was due to the chemisorption of the
sulfur group of the 1-thioglycerol158. The spectrum of the PtGLYC/Al2O3 catalyst showed a
11540 11560 11580 11600 11620 11640
0.0
0.5
1.0
1.5
2.0
2.5
No
rma
lize
d a
bso
rptio
n / a
.u.
Incident energy / eV
a)
11540 11560 11580 11600 11620 11640
0.0
0.5
1.0
1.5
2.0
2.5
No
rma
lize
d a
bsorp
tio
n / a
.u.
Incident energy / eV
b)
Controlling the chemoselectivity of hydrogenation reactions via surface modification over supported Pt catalysts
95
relatively sharp feature at about 11575 eV. Additionally the peaks at about 11593 eV and
11621 eV of the Pt/Al2O3H250 catalysts were slightly shifted to about 11595 eV and about
11620 eV respectively, for the PtGLYC/Al2O3 catalyst. The shift of these two features indicates
that the Pt nanoparticles remained intact for the PtGLYC/Al2O3 catalyst but that the metal-metal
distance changed compared to the Pt nanoparticles in Pt/Al2O3H250. Chemisorption of 1-
thioglycerol on the surface of the Pt nanoparticels occurred and the electronic structure of the
PtGLYC/Al2O3 catalyst was different than that of the Pt/Al2O3H250. HERFD XANES spectra
at the Pt LIII edge were also recorded during the whole reaction time. Figure 7.6b) shows the
Pt LIII HERFD XANES spectra at the beginning and at the end of the reaction. Both spectra
and all intermediate ones (not shown) were identical and showed the same features as
described above, thus the structure of the PtGLYC/Al2O3 catalyst remained intact over the
complete reaction time. Characterization of PtGLYC/Al2O3 showed that the particle size
slightly increased due to the modification with 1-thioglycerol but was not further increased
under reaction conditions (Figure 7.4a-c). This was also confirmed by the in situ HERFD
XANES measurements. Here the spectra at the Pt LIII edge did not change over the reaction
time (Figure 7.6b). The absence of the S-H vibration at 2550 cm-1 for the PtGLYC/Al2O3
catalyst compared to liquid 1-thioglycerol in the FT-IR measurements showed that 1-
thioglycerol was chemisorbed to the Pt surface via the sulfur atom (Figure 7.5 a and b). This
was also confirmed by in situ HERFD XANES measurements, which showed that the
electronic structure of the PtGLYC/Al2O3 catalyst was different from the Pt/Al2O3 catalyst
(Figure 7.6a) and showed additional features characteristic for Pt-S chemisorption on Pt
nanoparticles158. The surface of the Pt particles was densely packed with 1-thioglycerol as
shown in the FT-IR measurements. The symmetrical and antisymmetrical methylene C-H
stretching vibrations were shifted to lower frequencies (Figure 7.5b), which is interpreted as a
more ordered crystalline phase compared to “free” liquid 1-thioglycerol156 due to the
interactions of the alkane chains adjacent to the sulfur atom. H2S treating of the catalyst
completely poisoned the catalyst most likely due to complete blocking of the Pt surface.22
These results are similar to what has been reported for thiol modification of Pd/Al2O3
catalysts during the gas phase hydrogenation of 1-epoxy-3-butene.23 Here the catalyst was
completely poisoned after exposure to H2S for periods > 100 min. The authors propose that
complete sulfur coverage is restricted when thiol molecules are used for modification due to
SAM layers. We conclude that the PtGLYC/Al2O3 catalyst consists of Pt nanoparticles, which
are stable under reaction conditions, containing Pt-atoms at the surface which are covered
with densely packed 1-thioglycerol molecules, bound strongly only via the sulfur atom.

Chapter 7
96
7.4. Discussion
The catalytic tests showed that the surface modification with 1-thioglycerol lead to the
formation of a new product, 4-aminostyrene, with high selectivity (> 95 %) over the
PtGLYC/Al2O3 catalyst during the hydrogenation of 4-nitrostyrene in the liquid phase (Figure
7.1b). This product was never observed for the Pt/Al2O3H250 catalyst, where only 4-
ethylnitrobenzene and 4-ethylaniline were found in the liquid phase (Figure 7.1a). The loss in
activity by surface modification is because active sites get blocked by the modifying species
and are no longer active for catalysis. In our case the initial activity of the PtGLYC/Al2O3
catalyst drops to 8 % of the initial activity of the Pt/Al2O3H250 catalyst. Nevertheless the
selectivity and activity are strongly dependent on the modification procedure and already
small changes have a significant impact on the catalyst performance (Figure 7.3) and thus
improvement of the activity is possible via fine tuning of the modification procedure,
changing the surface modifier and/or the support. A near 100 % yield with higher activity
compared to the unmodified Pt/Al2O3H250 catalyst was achieved via the modification with
1,6-hexandithiol on Pt/TiO2.151 In literature it was reported that the addition of small traces of
Pt to a Au/TiO2 catalyst improved the TOF (mols converted by mol metal-1 s-1) from 70 to
550 for the hydrogenation of 3-nitrostyrene by decreasing the selectivity from 96.2 % to 93.4
% at high conversions.143 As reaction conditions are different from ours direct comparison of
activity is impossible. Regarding the selectivity at high conversion, our modification
procedure shows outstanding performance. Selectivity to 4-aminostyrene of 97 % at 85 %
conversion was observed for the PtGLYC/Al2O3 catalyst and even 98 % selectivity at 100 %
conversion was found for the 1,6-dithiohexane modified Pt/TiO2 catalyst without the
formation of hydroxylamine derivatives.151 Corma et al. showed that the selectivity of Pt, Ni
and Ru metals supported on TiO2 could be drastically increased upon higher pretreatment
temperatures.139 The effect of this treatment was that the (111) and (100) crystal faces were
decorated by TiOx crystallites leaving only low coordinated Pt atoms undecorated. Via this
decoration a similar selectivity to the PtGLYC/Al2O3 or the 1,6-dithiohexane modified Pt/TiO2
towards 3-aminostyrene at 96 % conversion is only observed for the decorated Ru/TiO2
catalyst (96 %) but dangerous phenylhydroxylamine traces were found in the reaction
mixture. For the best Pt/Al2O3 catalyst with low Pt loading only 60 % selectivity towards 3-
aminostyrene at high conversion levels could be achieved and thus this modification via
decoration for improvement of the activity is restricted to the TiO2 support.

Controlling the chemoselectivity of hydrogenation reactions via surface modification over supported Pt catalysts
97
The lack of selectivity in the hydrogenation of substituted nitroarenes for unmodified
supported Pt catalysts is assigned to the strong interaction of the aromatic ring and the nitro-
group with the Pt nanoparticles. Density functional theory (DFT) calculations showed that
preferentially flat adsorption of the aromatic ring on the Pt nanoparticles occurs for
nitrostyrene, regardless of the particle size, and thus both groups can be hydrogenated
simultaneously.143 For the nitro-group it is generally accepted that adsorption has to occur
parallel to the surface in order to hydrogenate it.21 On particles bigger than 4-nitrostyrene this
adsorption mode will lead to an additional exposure of the doublebond to the Pt surface.
From our in situ HERFD XANES measurements we could not directly identify an adsorption
of 4-nitrostyrene on the Pt surface. Several influences of a modifier on the selectivity on
supported catalysts have been discussed in the literature.21 A modifier can lead to the
occurrence of electronically altered sites.24 Although we have experimentally proven that the
electronic structure of our modified Pt/Al2O3 catalyst is much different than the unmodified
catalyst (compare Figure 7.6a), we do not ascribe the high selectivity towards 4-aminostyrene
to altered electronic properties, but to a geometric effect. FT-IR characterization of the
PtGLYC/Al2O3 suggested that the surface modifier is densely packed on the Pt surface. The
shift of the symmetric methylene stretching to 2850 cm-1, which was observed for the
PtGLYC/Al2O3 catalyst, identifies a high coverage of the metal surface with the corresponding
thiol and is observed on Pt(111) surfaces only for alkane-thiols with chains > C12 but was also
observed for Pt nanoparticles capped with 1-thioglycerol.155,156 We assign this finding to the
following: for 3-D Au nanoparticles < 4.4 nm it has been suggested that a higher surface
coverage (about 60 %) with alkanethiols can be achieved compared to 2-D crystals (about 30
%) as alternative binding modes for the alkanethiols are available on the nanoparticles.144 A
coverage of 30 % on Pt (111) electrodes yields a (√3 O √3)R30° adlattice for alkanethiols.159
This adlayer prohibits adsorption of any other molecule bigger than the adlayer molecule. It
is not unlikely to assume that the hydrogen molecule can still be split on the platinum surface
atoms that are not directly bonded to sulfur. For gold nanoparticles supported on TiO2 the
high chemoselectivity towards the nitro-group in 3-nitrostyrene hydrogenation was assigned
to a preferential adsorption of the substrate on the support via the nitro-group and subsequent
hydrogenation at the metal support interface.48 We propose that the coverage on the surface
of the Pt nanoparticles by the surface modifier is the key factor for the changed selectivity as
shown in the dilution experiment in Figure 7.3. Here the selectivity towards 4-aminostyrene
considerably dropped when less surface modifier (1-thioglycerol) was applied during

Chapter 7
98
modification and more 4-ethylnitrobenzene was detected among the products. As more Pt
surface becomes accessible for the substrate, additional reaction sites for the hydrogenation
of the double bond on the Pt surface get accessible besides the sites at the outer rim where the
nitro-group which interacts with the support is hydrogenated, as indicated by a higher
reaction rate for 4-nitrostyrene. Additionally this finding is supported by the results obtained
during the hydrogenation of 4-nitrostyrene for catalysts modified with different organic
thiols. Modifiers with a polar group adjacent to the thiol-group showed higher selectivity
towards 4-aminostyrene, most likely due to an intramolecular interaction of the polar groups
with each other as indicated by the shift of the O-H stretch vibration in Figure 7.5.
We therefore attribute the change in selectivity due to 1-thioglycerol modification on a
Pt/Al2O3 catalyst in the hydrogenation of 4-nitrostyrene to changed adsorption mode of the
substrate on the catalyst as illustrated in Scheme 7.2. On the bare unmodified Pt/Al2O3
catalyst 4-nitrostyrene adsorbs preferentially flat onto the surface of the Pt nanoparticles and
thus both, the double and the nitro-group can be hydrogenated at the same time (Scheme
7.2a). The fact that 4-ethylnitrobenzene was found as a product besides 4-ethylaniline in the
liquid phase is attributed to a faster rate for double bond hydrogenation in contrast to nitro-
group hydrogenation also found for Pt/TiO2 catalysts.40 For the PtGLYC/Al2O3 catalyst the
reaction proceeds via a “gold-like” mechanism proposed by Corma: as the surface of the Pt-
nanoparticles is blocked for 4-nitrostyrene to adsorb by the strongly bond 1-thioglycerol
species, flat adsorption of the 4-nitrostyrene molecule cannot occur and thus the substrate
adsorbs via the nitro-group on the support and reacts at the metal/support interface (Scheme
7.2b). We assume that metal sites are still available to split hydrogen.
Scheme 7.2 Schematic representation of the proposed reaction model: a) unmodified supported Pt: 4-
nitrostyrene adsorbs and reacts both groups at the same time flat on the surface of the Pt
nanoparticles; b) modified supported Pt: organic thiols form a dense ordered structure on the surface
of the Pt nanoparticles, 4-nitrostyrene adsorbs on the support and reacts at the rim of the Pt
nanoparticles.

Controlling the chemoselectivity of hydrogenation reactions via surface modification over supported Pt catalysts
99
7.5. Conclusions
We propose a reaction mechanism in which changed adsorption mode of the reacting
molecule is responsible for a complete switch in chemoselectivity. The selectivity towards 4-
aminostyrene from 4-nitrostyrene could be increased from 0 % to 100 % at high conversion
due to modification of supported Pt catalysts with organic thiols. The effect of the modifier is
explained by restricted flat adsorption modes of the substrate on top of the Pt nanoparticles.
Chemisorption and high coverage of the organic thiols was confirmed by FT-IR and HERFD
XANES measurements. This new system adds to the “heterogeneous tool box” and could also
be applied for other selective hydrogenation challenges.

Chapter 7
100

Chapter 8
Asymmetric catalysis over thiol modified Pt/TiO2
catalysts

Chapter 8
102
8.
8.1. Introduction
Chapters 6 and 7 showed that the chemoselectivity of hydrogenation of substituted
nitrobenzenes can be controlled by the adsorption of organic thiols. Encouraged by these
results, we applied this concept to asymmetric hydrogenation of unfunctionalized double
bonds and acetophenone. Performing enantioselective hydrogenations over heterogeneous
catalysts is still a great challenge and only few successful systems exist for the hydrogenation
of unsaturated compounds, which only work for specific substrate/catalyst/modifier
combinations.160 The most prominent and efficient enantioselective heterogeneous
hydrogenation systems are supported Ni, Pd, Pt catalysts modified with the naturally
occurring cinchona alkaloids and tartaric acids. Very high enantiomeric excess (e.e.) (> 90 %)
is reported for the hydrogenation of various activated ketones. Most scientists are consensual
that the origin of the enantioselectivity observed for these catalysts is a result of a direct
modifier-substrate interaction. Figure 8.1 shows a schematic illustration of the most plausible
configuration which leads to the high enantioselectivity, representative for activated α-
ketoesters. Similar interactions are assumed for other substrates and/or modifiers and can be
found in 160 and references therein.
Figure 8.1 Interaction of cinchona (protonated by the Pt-H system) with an α-ketoester.
Adapted from 160.
In the enantioselective hydrogenation of activated ketones the ester-group not only activates
the carbonyl-group, but also directs the substrate to a preferential adsorption towards the
active metal.161 The protonated cinchona alkaloid interacts with the α-ketoester via hydrogen-
bridge bondings and thus directs the substrate in either re or si configuration, whereas the
hydrogen uptake results from the Pt-surface “below”.162 The literature is consensual that one

Asymmetric catalysis over thiol modified Pt/TiO2 catalysts
103
reason for the lack in enantioselectivity for heterogeneous catalysts is because a lot of the
surface sites are not covered by the modifier and thus yield a racemic product. Efforts have
been made to circumvent these problems and new approaches to tune the enantioselectivity
arose over the time. An alternative method how to actively tune enantioselectivity is to adapt
methods from organometallic chemistry.163 Supported Pt catalysts are modified via chiral
organotin compounds and high coverages of the active surface are achieved (Sn/Pt 0.4).
Although the catalyst shows only e.e. of 20 % for the enantioselective hydrogenation of
acetophenone, recycling of the catalyst is possible while keeping the same enantioselectivity
due to the strong interaction of the resulting Pt-Sn alloy. Sulphur containing molecules also
find application in the modification of the surface for asymmetric hydrogenations. Recently
Pd/C catalysts were modified to be effective heterogeneous systems for the enantioselective
catalytic C=C double bond hydrogenation of isophorone.164 For that the Pd surface was
tethered with a sulfide modifier containing a pyrrolidine nitrogen atom which interacts with
the substrate and consequently directs it towards the active surface as illustrated in Figure 8.2.
Figure 8.2 Scheme showing proposed mechanism for the enantioselective hydrogenation of
isophorone via iminium ion/enamine intermediate. Adapted from 164.
The substrate isophorone adsorbs on the Pd surface and diffuses to the surface modifier
which is strongly attached to the surface. Over the loss of water, modifier and substrate form
an iminium ion or enamine. Consequently the double bond of the so-coordinated iminium ion
or enamine gets diastereomerically hydrogenated via hydrogen uptake from the Pd surface.

Chapter 8
104
The resulting enamine/iminium ion gets hydrolyzed and desorption yields the enantiomeric
pure product. This proposed reaction mechanism was confirmed by employing tertiary
amines instead of isophorone, which lead to a racemic product distribution. Variation of
group R (red circle in Figure 8.2) directly impacted the enantiomeric excess of the product:
the bigger an alkyl-group attached to the sulfide modifier the higher was the e.e. The authors
ascribe this effect to an inhibited closed island formation resulting in a high dispersion of
separated modifier molecules and thus in an effective asymmetric induction. New asymmetric
heterogeneous catalysts are not only reported for hydrogenation reactions. A new method for
asymmetric hydroformylation of olefins is demonstrated by adapting strategies from
homogeneous catalysis.165 Upon surface modification with (R)-BINAP modification of
Rh/SiO2 catalysts up to 72 % ee and 100 % selectivity to branched aldehyde were obtained
for the hydroformylation of vinyl acetate.
In this chapter we show the impact of the surface modification of Pt/TiO2 catalysts by
enantiomeric pure organic thiols on the liquid phase hydrogenation of unfunctionalized
double bonds and acetophenone. We aim to transform the supported Pt particles into an “all
chiral” environment so that the substrate can only react in a certain configuration.
8.2. Experimental section
8.2.1. Catalyst preparation and modification
All Pt/TiO2 catalysts used in this work were synthesized via incipient wetness impregnation.
To obtain a nominal 1 wt% Pt-loading, 80.2 mg tetra-amine-platinum (II) nitrate
(Pt(NH3)4(NO3)2, Aldrich Chemicals) were dissolved in 3.7 ml deionized water. This solution
was added dropwise to 4 g of support (TiO2 P25 Acros) under vigorous mixing. The resulting
powder was heated to 200 °C at a rate of 5 °C min-1 in air and kept at this temperature for 4
hours. Subsequently, the powder was further heated to 400 °C at a rate of 5 °C min-1 in air
and kept at this temperature for 4 hours and then cooled down to room temperature. We refer
to this catalyst in the following as “as prepared”. Prior to reaction and modification, the as
prepared catalyst was pretreated in a flow of 100 ml min-1 5 % H2/He (v/v) at 250 °C for 2 h
using a heating rate 2 °C min-1. We refer to this catalyst as Pt/TiO2H250. A total of 600 mg of
the freshly reduced Pt/TiO2H250 catalyst was added to 100 ml of a 30 mM solution of the
corresponding thiol in ethanol (ethanol absolute, analytical grade, Scharlau) for the α-lipoic
acid modifier or demin water for the L-cysteine modifier, to obtain a nominal Pt/thiol ratio of
1:100. Prior to the addition of the catalyst the thiol/ethanol solution (thiol/water respectively)
Asymmetric catalysis over thiol modified Pt/TiO2 catalysts
105
was always purged with nitrogen under magnetic stirring (750 rpm) for 30 min. Pt/thiol ratios
of 1:1, 1:10 and 1:25 were achieved by varying the molarity of the initial 1:100 solution.
After the addition of the Pt/TiO2H250 catalyst the suspension was stirred (750 rpm) for 16 h
under argon purging at room temperature, filtered and washed three times with 125 ml
ethanol and the resulting catalyst was dried in vacuum overnight.
8.2.2. Kinetic measurements
All hydrogenation reactions were performed in 50 ml Premex stainless steel autoclaves with
polyetheretherketone (PEEK) inlets. A typical reaction composition consisted of solvent (20
g, toluene, puriss > 99 %, Fluka Analytical), internal standard (1 mmol; mesitylene, puriss >
99 %, Sigma–Aldrich), catalyst (50 mg), and substrate (0.67 mmol). This mixture was filled
into an autoclave and purged three times after sealing by using H2 (5 bar) and while stirring
(1000 rpm). The autoclave was then pressurized to 10 bars by using H2 and heated up to 60
°C (10 °C min-1) under stirring (1000 rpm), which resembles the start of the reaction (T = 0
min). Samples were taken at fixed time intervals by means of a sample tube. The samples
were filtered and analyzed by GC using an Agilent 7820A with an apolar 30 m HP 5 MS
column. The temperature program consisted of 20 °C min-1 heating steps from 80 to 300 °C
at a split ratio of 60/1. The enantiomeres were separated over a chiral Cyclosyl-B column
using a Agilent 7890A GC at an 40 °C isothermal program.
8.3. Results
8.3.1. Hydrogenation of 2-phenyl-1-butene
For the unmodified Pt/TiO2 catalyst 100 % conversion of 2-phenyle1-butene was achieved in
about 400 min, resulting in a racemic mixture. By varying the catalyst/substrate ratio an
influence on the performance of the unmodified Pt/TiO2 catalyst was observed. At
catalyst/substrate ratios of 1/100 (m/m) no conversion of 2-phenyl-1-butene was observed.
For the hydrogenation of 2-phenyl-1-butene the α-lipoic acid modified catalyst (Pt/thiol of
1:100) showed no activity towards the double bond after four days of reaction. Table 8.1
summarizes the conversions and e.e. % for the Pt/modifier ratios after 48 and 96 hours.
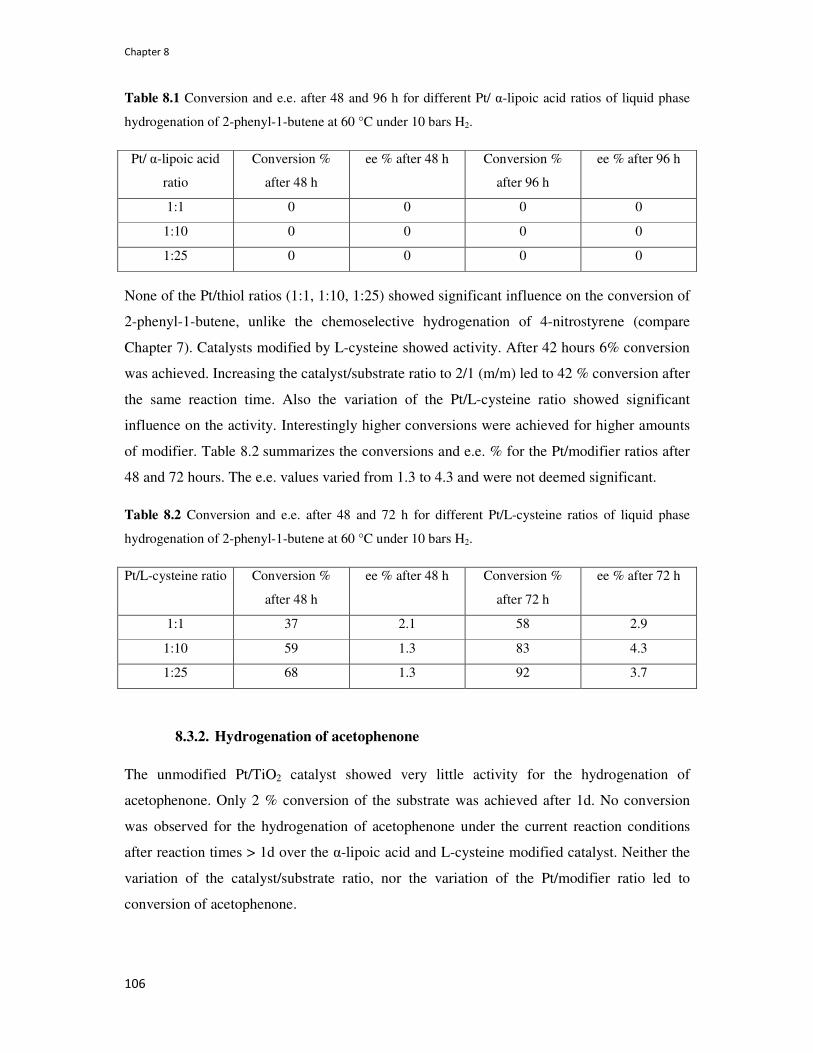
Chapter 8
106
Table 8.1 Conversion and e.e. after 48 and 96 h for different Pt/ α-lipoic acid ratios of liquid phase
hydrogenation of 2-phenyl-1-butene at 60 °C under 10 bars H2.
Pt/ α-lipoic acid
ratio
Conversion %
after 48 h
ee % after 48 h Conversion %
after 96 h
ee % after 96 h
1:1 0 0 0 0
1:10 0 0 0 0
1:25 0 0 0 0
None of the Pt/thiol ratios (1:1, 1:10, 1:25) showed significant influence on the conversion of
2-phenyl-1-butene, unlike the chemoselective hydrogenation of 4-nitrostyrene (compare
Chapter 7). Catalysts modified by L-cysteine showed activity. After 42 hours 6% conversion
was achieved. Increasing the catalyst/substrate ratio to 2/1 (m/m) led to 42 % conversion after
the same reaction time. Also the variation of the Pt/L-cysteine ratio showed significant
influence on the activity. Interestingly higher conversions were achieved for higher amounts
of modifier. Table 8.2 summarizes the conversions and e.e. % for the Pt/modifier ratios after
48 and 72 hours. The e.e. values varied from 1.3 to 4.3 and were not deemed significant.
Table 8.2 Conversion and e.e. after 48 and 72 h for different Pt/L-cysteine ratios of liquid phase
hydrogenation of 2-phenyl-1-butene at 60 °C under 10 bars H2.
Pt/L-cysteine ratio Conversion %
after 48 h
ee % after 48 h Conversion %
after 72 h
ee % after 72 h
1:1 37 2.1 58 2.9
1:10 59 1.3 83 4.3
1:25 68 1.3 92 3.7
8.3.2. Hydrogenation of acetophenone
The unmodified Pt/TiO2 catalyst showed very little activity for the hydrogenation of
acetophenone. Only 2 % conversion of the substrate was achieved after 1d. No conversion
was observed for the hydrogenation of acetophenone under the current reaction conditions
after reaction times > 1d over the α-lipoic acid and L-cysteine modified catalyst. Neither the
variation of the catalyst/substrate ratio, nor the variation of the Pt/modifier ratio led to
conversion of acetophenone.

Asymmetric catalysis over thiol modified Pt/TiO2 catalysts
107
8.4. Discussion
The modifier α-lipoic acid completely suppressed the hydrogenation reaction of 2-phenyl-1-
butene and acetophenone. Most likely the two sulphur atoms of the molecule completely
block the active surface of the Pt nanoparticles22 and either prevent the H2 dissociation or the
consecutive hydrogenation of the substrate. We can exclude the former as hydrogenation
activity of substituted nitroarenes was observed over the α-lipoic acid modified Pt/TiO2. We
thus ascribe the absence of activity to the substrate, as also no activity was observed for the
unmodified catalyst at catalyst/substrate ratios of 1/100 whereas, e.g. styrene was converted
over this catalyst. The modification by L-cysteine showed positive results regarding activity
during the hydrogenation of 2-phenyl-1-butene and almost 90 % conversion was achieved
after 3 d, however no e.e. was detected. The observation that the activity increased with lower
Pt/modifier ratios could be due to an unordered configuration of the modifier for the higher
ratios as here not only the thiol group but also the other functional groups of the L-cysteine
modifier interact with the Pt surface154 and thus poison them additionally. In case of
acetophenone hydrogenation little activity could be observed already for the unmodified
catalyst after reaction times > 1d, whereas no activity was observed for the α-lipoic acid and
L-cysteine modified catalysts. The result that low conversion was observed for the
unmodified catalyst could be due to the small particle size or the low loading of the catalyst.
Consequently the poisoning of the few active sites with the modifier led to full deactivation
of both modifiers.
8.5. Conclusion
Hydrogenation of 2-phenyl-1-butene was only possible over the L-cysteine modified catalyst.
Variation of the Pt/modifier ratio achieved conversions up to 90 % in the best case after 72
hours of reaction. At high conversion levels, very small e.e. were observed, which most
probably resulted from the data treatment. Hydrogenation of acetophenone under the current
reaction conditions did not lead to conversion of either the α-lipoic acid modified catalyst or
the L-cysteine modified catalyst. Modifying supported Pt catalysts by adsorption of
enantioselective pure organic thiols for the asymmetric liquid phase hydrogenation did not
lead to the desired effect. Either the thiol modifier completely poisoned the catalyst or in
cases where activity was achieved no significant e.e. was observed. Clearly the current
reaction conditions are not suitable for this hydrogenation reaction and several parameters
need to be changed to achieve positive results for activity as well as for e.e. Increasing the H2
pressure could solve the lack of activity, whereas a different modifier could increase the e.e..

Chapter 8
108

Chapter 9
Conclusion and outlook

Chapter 9
110
The aim of this work was to obtain the molecular mechanism and the structure of the active
site of the liquid phase hydrogenation of substituted nitrobenzenes over supported gold and
platinum catalysts. With this knowledge, controlled modification of the catalyst was
attempted. The first step was to develop a suitable experimental setup that allowed
characterizing the reaction and the catalysts under actual working conditions. Chapter 3
summarizes the reactor design. The simultaneous recording of HERFD XANES and ATR IR
data revealed that this was the perfect combination of methods to follow liquid phase
heterogeneously catalyzed reactions under pressure. The change of the electronic and
geometric structure of the catalyst could be followed by HERFD XANES, whereas activity
and evolution of substrates, intermediates and products was followed by ATR IR. The reactor
was as close as possible to state of the art autoclaves which enabled us to “see” what is
actually happening in a pressurized autoclave under working conditions. The feasibility and
importance of our new in situ reactor was shown in Chapter 3. In Chapter 4 we employed this
new experimental setup to determine, what is the gold oxidation state and to establish the
structure-performance relationship for the liquid phase hydrogenation of nitrobenzene over
supported gold catalysts. We demonstrated that the dominant active state of supported gold
catalysts is Au0 during the hydrogenation and that any cationic gold which was initially
present did not contribute to the activity. Any cationic gold present at the beginning of the
reaction was reduced under reaction conditions. Thus, to have an active supported gold
catalyst for the hydrogenation of nitrobenzene one should make sure, that the supported gold
nanoparticles are present in fully reduced form at the beginning of the reaction. In Chapter 5
we investigated the reaction mechanism of the hydrogenation of nitrobenzene over different
supported Au catalysts and found that whether the reaction proceeds via the direct route or
the condensation route shows a strong dependence on the support. Whereas Au/TiO2 catalysts
preferentially reacted via the direct route, Au/CeO2 catalysts proceeded via the condensation
route. We identified that the accumulation of nitrosobenzene on the surface of CeO2 was
responsible for the condensation route to occur. The choice of the support in this
hydrogenation reaction is crucial to avoid the undesired condensation route. Additionally,
these results highlighted how important it is to know the different reaction intermediates as
well as their influence on the performance of the hydrogenation mechanism to achieve the
best reaction conditions possible. After understanding the active site and the reaction
mechanism, we tried to directly influence the chemoselectivity of supported noble metal
catalysts for the hydrogenation of substituted nitrobenzenes. For that we employed 4-
nitrostyrene. Supported gold catalysts show high selectivity towards the nitro-group, however
Conclusion and outlook
111
at relatively low rate of reaction. We attempted to increase the selectivity of a very active
catalyst based on platinum. Chapter 6 shows that a 100 % switch in selectivity for the
chemoselective liquid phase hydrogenation of 4-nitrostyrene can be achieved via the
adsorption of organic thiols on the surface of the Pt nanoparticles. In Chapter 7 we tried to
understand the effect of this modification procedure. We ascribed the switch in selectivity to
the changed adsorption mode of the substrate 4-nitrostyrene. It is necessary to prevent flat
adsorption of the substrate on the active platinum surface to inhibit the simultaneous
hydrogenation of both reactive groups. Due to a preferential interaction of the nitro-group
with the support, the reaction proceeded on the low coordinate Pt atoms at the rim of the Pt
nanoparticles. These findings may be important for the development of new chemoselective
hydrogenation reactions. If it would be possible to achieve a stable single active site
heterogeneous catalyst yielding only supported single atoms of Pt, this catalyst could show
high chemoselectivity while demanding less precious noble metal. In Chapter 8 we applied
the selective poisoning principle to perform enantioselective hydrogenation of prochiral
unfunctionalized double bonds, which would be first of its kind. By covering most of the
active supported Pt nanoparticles with chiral organic thiols we aimed to transform the Pt
nanoparticles into an “all-chiral” environment leaving only low coordinated Pt atoms at the
rim available for reaction and thus allowing only a certain configuration of a prochiral
substrate to interact with the active site. However, we found that this modification procedure
did not show the desired effect on enantioselectivity. For certain chiral organic thiol
modifiers no reaction was observed, indicating that the catalyst was poisoned too strong by
the modifier. Varying the Pt/modifier ratio did not increase the activity. For a different chiral
organic modifier, where activity was observed for the hydrogenation of prochiral
unfunctionalized double bonds no significant e.e. was detected. We ascribed these findings to
the sterical isolation of the active site due to the chiral organic modifiers and tried to
circumvent this problem by employing a ketone as substrate for the hydrogenation.
Surprisingly no activity was observed for any of the modified supported Pt catalysts. The
preliminary results gave only negative results, however several things can still be tried to
achieve the desired effect. First of all various chiral organic thiol modifiers must be screened
which show less sterical hindrance of the substrate to facilitate the access to the active site.
Smaller unfunctionalized and functionalized substrates could be employed for the same
reason. Different supports, higher weight loadings and/or particle of the active material could
also have an impact on the performance of the catalyst. Fine tuning of the Pt/modifier ratio
and the reaction conditions might also have a positive effect on the e.e. yield.

Chapter 9
112
In this work we showed that a complete and detailed understanding of a heterogeneously
catalyzed reaction is necessary to enable targeted improvement. Our newly developed
experimental reactor showed the necessity of performing spectroscopy studies in situ under
actual working conditions. Additionally, it was demonstrated that the right combination of
spectroscopic methods is a powerful tool to understand heterogeneous catalysts in action. The
design of our in situ HERFD XAS / ATR IR cell can easily be applied to further understand
homogenously catalyzed reactions as they are preferably performed in the liquid phase under
pressure. We clearly showed how our reactor can aide to identify the active state of a
heterogeneous catalyst. We demonstrated that the support can have a significant effect on the
reaction mechanism and should therefore always be considered when adjusting a
heterogeneously catalyzed reaction. A detailed understanding of the reaction mechanism is
mandatory to rule out which intermediates play a vital role in the overall reaction mechanism
and what needs to be done to prevent accumulation of the former. We showed and understood
that chemoselectivity can be precisely controlled via surface modification of unselective
hydrogenation catalysts to turn them into selective ones. The approach to broaden our
modification procedure to enantioselective hydrogenations showed no positive results but
might however give new ideas to tackle heterogeneously catalyzed asymmetric
hydrogenation challenges.
How to understand and improve heterogeneous catalysts is still a strongly developing
research area in the chemical sciences. Parallel to the improvements of the catalysts, in situ
characterization methods lead to a deeper understanding of the working mode of the modified
active site. Additionally, theoretical methods allow to predict trends and to better interpret
experimental results. A clever combination of modification procedures, improvement of in
situ experimental setups and integration of the theoretical methods could result in fully
adapted catalytic systems. This makes it necessary that the borders between these different
fields disappear and that an interdisciplinary transfer of knowledge may lead to totally new
catalytic systems and applications. The ability to control the structure of an active site at the
atomic level has significantly improved during the past decade. Site isolation, single site
catalysts, synthesis or in situ/ ex situ modification of surfaces has led to improved catalyst
performance. These approaches have not been exhausted. Future research will aim in the
direction of rationally achieving the presence of multiple active sites in the same catalyst
enabling cascade reactions and multiple functions that act simultaneously on the reactant.
Such developments may eventually turn catalytic processes into “molecular assembly lines”.

Publications
113
Publications
• “Controlling the chemoselectivity of hydrogenation reactions via surface modification over
supported Pt catalysts” Martin Makosch, Václav Bumbálek, Jacinto Sá, Wan-Ing Lin, Mauro
Rovezzi, J. Will Medlin, Konrad Hungerbühler and Jeroen A. van Bokhoven under review in J.
Catal.
• "Organic thiol modified Pt/TiO2 catalysts to control chemoselective hydrogenation of substituted
nitroarenes" Martin Makosch, Wan-Ing Lin, Vaclav Bumbalek, Jacinto Sa, James William Medlin,
Konrad Hungerbühler, and Jeroen Anton van Bokhoven ACS Catal. 2 (2012) 2079-2081
• "Redispersion of Gold Multiple-Twinned Particles during Liquid-Phase Hydrogenation" Christiane
Kartusch, Frank Krumeich, Olga Safonova, Urs Hartfelder, Martin Makosch, Jacinto Sá, J. A. van
Bokhoven ACS Catal. 2 (2012) 1394−1403
• "The Dynamic Structure of Gold Supported on Ceria in the Liquid Phase Hydrogenation of
Nitrobenzene" Christiane Kartusch, Martin Makosch, Jacinto Sá, Konrad Hungerbühler, Jeroen A.
van Bokhoven ChemCatChem 4 (2012) 236 – 242
• "Hydrogenation of Nitrobenzene Over Au/MeOx Catalysts—A Matter of the Support" Martin
Makosch, Jacinto Sa, Christiane Kartusch, Gilles Richner, Jeroen A. van Bokhoven and Konrad
Hungerbühler ChemCatChem 4 (2012) 59-63
• "HERFD XAS/ATR-FTIR batch reactor cell" Martin Makosch, Christiane Kartusch, Jacinto Sa,
Renata Bessa Duarte, Jeroen A. van Bokhoven, Kristina Kvashnina, Pieter Glatzel, Daniel L. A.
Fernandes, Maarten Nachtegaal, Evgeny Kleymenov, Jakub Szlachetko, Bobby Neuhold and
Konrad Hungerbühler Phys. Chem. Chem. Phys. 14 (2012) 2164 - 2170
• "In situ infrared monitoring of the solid/liquid catalyst interface during the three-phase
hydrogenation of nitrobenzene over nanosized Au on TiO2" Gilles Richner, Jeroen A. van
Bokhoven, Yorck-Michael Neuhold, Martin Makosch and Konrad Hungerbühler Phys. Chem.
Chem. Phys. 13 (2011) 12463–12471
• "Evaluation of Pt and Re oxidation state in a pressurized reactor: difference in reduction
between gas and liquid phase" Jacinto Sá, Christiane Kartusch, Martin Makosch, Cristina Paun,
Jeroen A. van Bokhoven, Evgeny Kleymenov, Jakub Szlachetko, Maarten Nachtegaal, Haresh G.
Manyar and Christopher Hardacre Chem. Commun. 47 (2011) 6590-6592
• "Molecular approaches towards mixed metal oxides and their behaviour in mixed oxide support
Au catalysts for CO oxidation", Jasmin Geserick, Thomas Fröschl, Nicola Hüsing, Gabriela
Kucerova, Martin Makosch, Thomas Diemant, Stephan Eckle and R. Jürgen Behm Dalton
Transactions 40 (2011) 3269-3286

Publications
114
• “Influence of the modification and surface area of the TiO2 support on the CO oxidation activity
of mesoporous Au/TiO2 catalysts”, Yvonne Denkwitz, Martin Makosch, Jasmin Geserick, Ute
Hörmann, Sören Selve, Ute Kaiser, Nicola Hüsing, R. Jürgen Behm Appl. Catal. B
Enviromental 91 (2009) 470-480
Oral Presentations
• "Combination of HERFD XANES and ATR-IR for in situ investigation of the liquid phase
hydrogenation of nitrobenzene" M. Makosch, G. Richner, J. Sa, C. Kartusch, K. Hungerbühler, J. A.
van Bokhoven, 3rd
CSX12, Zürich, July 4-6, 2012
• "Hydrogenation of nitrobenzene over Au/MeOx catalysts - a matter of the support" M. Makosch,
J. A. van Bokhoven, 1st Swiss Catalysis Meeting, Grindelwald, June 16/17, 2011
Posters
• "Controlling the chemoselectivity via surface modification over supported Pt catalysts", Martin
Makosch, Václav Bumbálek, Jacinto Sá, Will Medlin, Konrad Hungerbühler and Jeroen A. van
Bokhoven, SCS Fall Meeting, Universität Zürich, September 13, 2012
• "Operando characterization of catalyst, surface adsorbates and catalytic conversion: The case of
nitrobenzene hydrogenation over supported gold", M. Makosch, J. Sa, G. Richner, C. Kartusch
and J. A. van Bokhoven, 15th
ICC, Munich, 1-6 July, 2012
• "Influence of reaction conditions on the structure of supported gold nano particles during the
hydrogenation of nitrobenzene" M. Makosch, J. Sa, C. Kartusch and J. A. van Bokhoven, EMRS,
Strasbourg, May 13-18, 2012
• "Control of reaction mechanism of the hydrogenation of nitrobenzene by varying the support"
M. Makosch, J. Sa, J. A. van Bokhoven, EuropaCat X, Glasgow, August 28, 2011
• "In situ ATR-FTIR / HERFD XAS cell for liquid/solid reactions" M. Makosch, J. A. van Bokhoven,
1st Swiss Heterogeneous Catalysis Meeting, Grindelwald, June 16/17, 2011
• “Elucidating the reaction mechanism of the hydrogenation of nitrobenzenes over
Au/MeOx catalysts" M. Makosch, J. A. van Bokhoven, SCS Fall Meeting, Universität Zürich,
September 16, 2010.

Curriculum Vitae
115
Curriculum Vitae
Name Martin Makosch
Date of birth February 18, 1984
City Augsburg
Nationality German
Education
1990-1994 Elementary school Hochzoll Süd, Augsburg
1994-2003 Rudolf-Diesel-Gymnasium, Augsburg
2003-2004 Biochemistry studies at the University of Ulm
2004-2009 Chemistry studies at the University of Ulm
Diploma thesis:
“Catalytic properties of supported Au catalyst based on
nanostructured mixed mesoporous TixSi1-xO2
materials” under
the supervision of Prof. Dr. R. J. Behm
11/2009-11/2012 Doctoral studies at the ETH Zurich
Ph.D. Thesis “Hydrogenation of nitrobenzene: from
characterization to design” under the supervision of Prof. Dr. J.
A. van Bokhoven at the Institute for Chemical and
Bioengineering at the Department of Chemistry and Applied
Biosciences
Acknowledgements
116
Acknowledgements
I would like to use this section of my thesis to express my sincere gratitude to everybody
who supported me throughout my doctoral studies at the ETH Zurich in an indirect or
direct way.
First of all I would like to thank Jeroen, who gave me the opportunity to perform my
doctoral studies in his group. What I liked most about working with you was, that you
always gave me the feeling that our scientifically discussions were like a team-based
partner more than a boss-employee relationship. Your philosophy of leading the group
enabled me to grow and develop myself scientifically but also personally. You once said
“Give responsibility to the people and they will take it”. I think that is very true and a
good philosophy to go on with your future PhD students. I will never forget the nice three
years I had the privilege to work with you in your group.
Second I would like to thank Professor Hungerbühler for being the co-examiner of my
thesis, but also for allowing me to be an additional “security-threat” in his laboratory. I
always felt welcome in your group and I enjoyed our scientific discussions. I am grateful
that you always showed interest and trust in my results but also in me during the progress
of my PhD thesis.
Special thanks go to all the post-docs that helped me to understand what I was actually
doing. Especially to Jacinto Sa: thanks for your friendship and all the support you gave
me during my thesis. I was always impressed by your knowledge and passion about
heterogeneous catalysis. I wish you all the best for your future. Also Christian Lothschütz
for his crazy ideas and all the molecules you prepared for us. Additionally I would like to
thank Sebastien, Gilles and Bobby for introducing me to the ATR-IR system and
everything that is related to it. I owe you guys more than one beer.
What would a PhD thesis be without the assistance of students? Thanks to Marco and
Jonas for doing so much practical work for me. Special thanks to my master students
Vaclav and Wan-Ing who sometimes might have had a hard time under my supervision.
Your hard work helped me a lot in finishing my PhD thesis.
I would also like to thank all the beamline staff for their practical and scientific support
especially to Maarten, Olga, Jakub, Evgeny, Pieter, Christophe, Kristina, Mauro. Sorry
for messing up your beamlines!

Acknowledgements
117
This thesis would have not been possible without the employees of the ETH. I deeply
thank Roland Walker and Max Wohlwend for their input to the design of the in situ
reactor but also for showing so much patience during its realization and improvement. I
also express my gratitude to Jan Kovacovic for his professional support in planning and
performing experiments in the high pressure lab. I would like to thank Andreas Dutly and
his team for all the GC measurements but also for his assistance in any problems
regarding security in our labs. Frank Krumeich, thanks for all the TEM measurements. I
also would like to thank Max Haueter and Doina Sirbu for all the paper work. The Swiss
administration can be quite confusing!
I specially would like to thank Renata, Urs, Sebastien, Idalia, Cristina and Maxime for
their friendship. The discussions about exploding cows, all kind of zombie apocalypses,
white shark vs polar bear and caviar eating bears made the coffee breaks always the
highlight of the day.
A job is only easy if you have nice colleagues! Thanks to all group members: Christiane
for all the support in the beginning and the collaboration, Jags and Tew for all the advice
regarding beamtimes, Nadiya for helping me with all administrational questions, Katya
and Daniel for sharing the office (sorry about the music), Amaia for her piano lessons,
Ma and Flavien for measuring all the GC samples, Evalyn for the advice in XDAP and
Athena, Xiaoying for taking my spot in the SCS, Marco for helping me with the Equinox,
Matthew and Matthäus.
I am very grateful for my loving family. Without their advice, support and love I
wouldn`t even be close to where I am right now. Last but actually most important
(otherwise I would have never moved to Switzerland) I would like to thank my wife
Daniela for sharing all the ups and for getting me through all the downs of my time in
Zürich. I love you.
If there is anybody I forget, I would like to say: THANK YOU

References
118
References
(1) Weissermel, K.; Arpe, H.-J. Industrial Organic Chemistry; Wiley-VCH
Weinheim, 2003.
(2) Blaser, H.-U.; Malan, C.; Pugin, B.; Spindler, F.; Steiner, H.; Studer, M. Adv.
Synth. Catal. 2003, 345, 103.
(3) Weckhuysen, B. M. In-Situ Spectroscopy of Catalysis; American Scientific
Publishers, 2004.
(4) Singh, J.; Lamberti, C.; van Bokhoven, J. A. Chem. Soc. Rev. 2010, 39.
(5) Borodziński, A.; Bond, G. C. Catalysis Reviews 2006, 48, 91.
(6) Borodziński, A.; Bond, G. C. Catalysis Reviews 2008, 50, 379.
(7) Lindlar, H. Helv. Chim. Acta 1952, 35, 446.
(8) Characterization of Catalytic Materials; Wachs, I. E., Ed.; Butterworth-
Heineman: New York, 1992.
(9) Weckhuysen, B. M. Phys. Chem. Chem. Phys. 2003, 5, 4351.
(10) Bligaard, T.; Nørskov, J. K. Electrochim. Acta 2007, 52, 5512.
(11) Hammer, B.; Nørskov, J. K. In Advances in Catalysis; Bruce C. Gates, H. K.,
Ed.; Academic Press: 2000; Vol. Volume 45, p 71.
(12) Tinnemans, S. J.; Mesu, J. G.; Kervinen, K.; Visser, T.; Nijhuis, T. A.; Beale,
A. M.; Keller, D. E.; van der Eerden, A. M. J.; Weckhuysen, B. M. Catal.
Today 2006, 113, 3.
(13) Behrens, M.; Studt, F.; Kasatkin, I.; Kühl, S.; Hävecker, M.; Abild-Pedersen,
F.; Zander, S.; Girgsdies, F.; Kurr, P.; Kniep, B.-L.; Tovar, M.; Fischer, R. W.;
Nørskov, J. K.; Schlögl, R. Science 2012, 336, 893.
(14) Singh, J.; Nachtegaal, M.; Alayon, E. M. C.; Stötzel, J.; van Bokhoven, J. A.
ChemCatChem 2010, 2, 653.
(15) Teschner, D.; Vass, E.; Hävecker, M.; Zafeiratos, S.; Schnörch, P.; Sauer, H.;
Knop-Gericke, A.; Schlögl, R.; Chamam, M.; Wootsch, A.; Canning, A. S.;
Gamman, J. J.; Jackson, S. D.; McGregor, J.; Gladden, L. F. J. Catal. 2006,
242, 26.
(16) Teschner, D.; Borsodi, J.; Wootsch, A.; Révay, Z.; Hävecker, M.; Knop-
Gericke, A.; Jackson, S. D.; Schlögl, R. Science 2008, 320, 86.
(17) Tew, M. W.; Nachtegaal, M.; Janousch, M.; Huthwelker, T.; van Bokhoven, J.
A. Phys. Chem. Chem. Phys. 2012, 14, 5761.
(18) Wolf, D. Pharma Chem 2012, 11, 18.

References
119
(19) Urs, S. P., Baumeister; Hans-Ulrich, Blaser; Martin, Studer Catalysis of
Organic Reactions; Marcel Dekker, INC: New York, 1985.
(20) H. U. Blaser, U. Siegrist, H. Steiner, M. Studer, Ed.; Fine Chemical through
Heterogeneous Catalysis; Wiley-VCH, Weinheim, Germany, 2001.
(21) Blaser, H.-U.; Steiner, H.; Studer, M. ChemCatChem 2009, 1, 210.
(22) Calvin H, B. Appl. Catal. A-Gen 2001, 212, 17.
(23) Marshall, S. T.; O’Brien, M.; Oetter, B.; Corpuz, A.; Richards, R. M.;
Schwartz, D. K.; Medlin, J. W. Nat Mater 2010, 9, 853.
(24) Marshall, S. T.; Schwartz, D. K.; Medlin, J. W. Langmuir 2011, 27, 6731.
(25) Hostetler, M. J.; Stokes, J. J.; Murray, R. W. Langmuir 1996, 12, 3604.
(26) Corma, A.; Serna, P. Science 2006, 313, 332.
(27) Downing, R. S.; Kunkeler, P. J.; van Bekkum, H. Catal. Today 1997, 37, 121.
(28) Haber, F. Z.Elektrochem. 1898, 22, 506.
(29) Richner, G.; van Bokhoven, J. A.; Neuhold, Y.-M.; Makosch, M.;
Hungerbühler, K. Phys. Chem. Chem. Phys. 2011, 13, 12463.
(30) Gelder, E. A.; Jackson, S. D.; Lok, C. M. Chem. Commun. 2005, 522.
(31) Makaryan, J. A.; Savchenko, V. I. In Stud. Surf. Sci. Catal.; L. Guczi, F. S., P,
T., Eds.; Elsevier: 1993; Vol. Volume 75, p 2439.
(32) Smith, G. V.; Notheisz, F. Heterogeneous Catalysis in Organic Chemistry,
1999.
(33) Stoessel, F. Journal of Loss Prevention in the Process Industries 1993, 6, 79.
(34) Baumeister, P.; Blaser, H. U.; Studer, M. Catal. Lett. 1997, 49, 219.
(35) Studer, M.; Neto, S.; Blaser, H. U. Top. Catal. 2000, 13, 205.
(36) Möbus, K.; Wolf, D.; Benischke, H.; Dittmeier, U.; Simon, K.; Packruhn, U.;
Jantke, R.; Weidlich, S.; Weber, C.; Chen, B. Top. Catal. 2010, 53, 1126.
(37) Serna, P.; Concepción, P.; Corma, A. J. Catal. 2009, 265, 19.
(38) Coq, B.; Tijani, A.; Dutartre, R.; Figuéras, F. J. Mol. Catal. 1993, 79, 253.
(39) Rylander, P. N. Annals of the New York Academy of Sciences 1967, 145, 46.
(40) Boronat, M.; Concepción, P.; Corma, A.; González, S.; Illas, F.; Serna, P. J.
Am. Chem. Soc. 2007, 129, 16230.
(41) Corma, A.; Serna, P.; García, H. J. Am. Chem. Soc. 2007, 129, 6358.
(42) Corma, A.; Garcia, H. Chem. Soc. Rev. 2008, 37, 2096.
(43) Cárdenas-Lizana, F.; Gómez-Quero, S.; Perret, N.; Keane, M. A. Gold Bull.
2009, 42, 124.

References
120
(44) Cárdenas-Lizana, F.; Gómez-Quero, S.; Keane, M. A. Catal. Commun. 2008,
9, 475.
(45) Cárdenas-Lizana, F.; Gómez-Quero, S.; Hugon, A.; Delannoy, L.; Louis, C.;
Keane, M. A. J. Catal. 2009, 262, 235.
(46) Blaser, H.-U.; Pugin, B. B.; Spindler, F.; Thommen, M. Acc. Chem. Res. 2007,
40, 1240.
(47) Crook, R.; Deering, J.; Fussell, S. J.; Happe, A. M.; Mulvihill, S. Tetrahedron
Lett. 2010, 51, 5181.
(48) Corma, A.; Concepción, P.; Serna, P. Angew. Chem. Int. Ed. 2007, 46, 7266.
(49) Hong, Y.-C.; Sun, K.-Q.; Zhang, G.-R.; Zhong, R.-Y.; Xu, B.-Q. Chem.
Commun. 2011, 47.
(50) Cárdenas-Lizana, F.; Gómez-Quero, S.; Baddeley, C. J.; Keane, M. A. Appl.
Catal. A-Gen 2010, 387, 155.
(51) G.C. Bond; C. Louis; Thompson, D. T. Catalysis by Gold; Imperial College
Press: London, 2006.
(52) Haruta, M.; Tsubota, S.; Kobayashi, T.; Kageyama, H.; Genet, M. J.; Delmon,
B. J. Catal. 1993, 144, 175.
(53) Haruta, M. CATTECH 2002, 6, 102.
(54) Hugon, A.; Delannoy, L.; Louis, C. Gold Bull. 2008, 41, 127.
(55) Zanella, R.; Giorgio, S.; Henry, C. R.; Louis, C. J. Phys. Chem. B 2002, 106,
7634.
(56) Bond, G. C.; Thompson, D. T. Catalysis Reviews 1999, 41, 319.
(57) Hagen, J. In Catalyst Shapes and Production of Heterogeneous Catalysts;
Second Edition ed.; Wiley-VCH Verlag GmbH & Co. KGaA: Weinheim,
2006.
(58) Supelco; Bulletin 877 ed.; Supelco: 1998, p
http://www.sigmaaldrich.com/etc/medialib/docs/Supelco/Bulletin/6504.Par.00
01.File.tmp/6504.pdf.
(59) Gruehn, R.; Roß, R. Chem. unserer Zeit 1987, 21, 194.
(60) Elektronenmikroskopie in der Festkörperphysik; Springer-Verlag: Berlin -
Heidelberg -New York, 1982.
(61) http://www.microscopy.ethz.ch/.

References
121
(62) Krumeich, F.; Muller, E.; Wepf, R. A.; Nesper, R. The Journal of Physical
Chemistry C 2010, 115, 1080.
(63) Atkins, P. W. Physikalische Chemie; 5th ed.; WILEY-VCH: Weinheim, 2001.
(64) Griffiths, P. R.; de Haseth, J. A. In Fourier Transform Infrared Spectrometry;
John Wiley & Sons, Inc.: 2006, p 19.
(65) Bürgi, T.; Baiker, A. In Advances in Catalysis; Bruce, C. G., Helmut, K., Eds.;
Academic Press: 2006; Vol. Volume 50, p 227.
(66) Andanson, J.-M.; Baiker, A. Chem. Soc. Rev. 2010, 39, 4571.
(67) Griffiths, P. R.; de Haseth, J. A. In Fourier Transform Infrared Spectrometry;
John Wiley & Sons, Inc.: 2006, p 321.
(68) Makosch, M.; Kartusch, C.; Sa, J.; Duarte, R. B.; van Bokhoven, J. A.;
Kvashnina, K.; Glatzel, P.; Fernandes, D. L. A.; Nachtegaal, M.; Kleymenov,
E.; Szlachetko, J.; Neuhold, B.; Hungerbühler, K. Phys. Chem. Chem. Phys.
2012, 14, 2164.
(69) Koningsberger, D. C.; Mojet, B. L.; van Dorssen, G. E.; Ramaker, D. E. Top.
Catal. 2000, 10, 143.
(70) Singh, J. PhD Thesis, ETH Zürich, 2010.
(71) De Groot, F. M. F.; Knop-Gericke, A.; Ressler, T.; van Bokhoven, J. A. In In-
situ Spectroscopy of Catalysts; Weckhuysen, B. M., Ed.; American Scientific
Publishers: 2004, p 107.
(72) Müller, J. E.; Wilkins, J. W. Phys. Rev. B 1984, 29, 4331.
(73) Hämäläinen, K.; Siddons, D. P.; Hastings, J. B.; Berman, L. E. Phys. Rev. Lett.
1991, 67, 2850.
(74) Safonova, O. V.; Tromp, M.; van Bokhoven, J. A.; de Groot, F. M. F.; Evans,
J.; Glatzel, P. J. Phys. Chem. B 2006, 110, 16162.
(75) Glatzel, P.; Sikora, M.; Smolentsev, G.; Fernández-García, M. Catal. Today
2009, 145, 294.
(76) Glatzel, P.; Bergmann, U. Coord. Chem. Rev. 2005, 249, 65.
(77) Ravel, B.; Newville, M. J. Synchrotron Rad. 2005, 12, 537.
(78) Haruta, M. Catal. Today 1997, 36, 153.
(79) Valden, M.; Lai, X.; Goodman, D. W. Science 1998, 281, 1647.
(80) Guzman, J.; Carrettin, S.; Corma, A. J. Am. Chem. Soc. 2005, 127, 3286.

References
122
(81) Weiher, N.; Bus, E.; Delannoy, L.; Louis, C.; Ramaker, D. E.; Miller, J. T.;
van Bokhoven, J. A. J. Catal. 2006, 240, 100.
(82) Fu, Q.; Saltsburg, H.; Flytzani-Stephanopoulos, M. Science 2003, 301, 935.
(83) Guo, N.; Fingland, B. R.; Williams, W. D.; Kispersky, V. F.; Jelic, J.; Delgass,
W. N.; Ribeiro, F. H.; Meyer, R. J.; Miller, J. T. Phys. Chem. Chem. Phys.
2010, 12, 5678.
(84) Rodriguez, J. A. Catal. Today 2011, 160, 3.
(85) Porta, F.; Prati, L.; Rossi, M.; Scari, G. J. Catal. 2002, 211, 464.
(86) Hutchings, G. J. Catal. Today 2005, 100, 55.
(87) Abad, A.; Concepción, P.; Corma, A.; García, H. Angew. Chem. Int. Ed. 2005,
44, 4066.
(88) Hutchings, G. J.; Joffe, R. Applied Catalysis 1986, 20, 215.
(89) Nkosi, B.; Adams, M. D.; Coville, N. J.; Hutchings, G. J. J. Catal. 1991, 128,
378.
(90) Sinha, A. K.; Seelan, S.; Tsubota, S.; Haruta, M. Top. Catal. 2004, 29, 95.
(91) Nijhuis, T. A.; Weckhuysen, B. M. Catal. Today 2006, 117, 84.
(92) Guzman, J.; Gates, B. C. Angew. Chem. Int. Ed. 2003, 42, 690.
(93) Guzman, J.; Gates, B. C. J. Catal. 2004, 226, 111.
(94) Zhang, X.; Shi, H.; Xu, B.-Q. Angew. Chem. Int. Ed. 2005, 44, 7132.
(95) Zhang, X.; Shi, H.; Xu, B.-Q. Catal. Today 2007, 122, 330.
(96) Zhang, X.; Llabrés i Xamena, F. X.; Corma, A. J. Catal. 2009, 265, 155.
(97) Guan, Y.; Hensen, E. J. M. Phys. Chem. Chem. Phys. 2009, 11, 9578.
(98) Choudhary, T. V.; Sivadinarayana, C.; Datye, A. K.; Kumar, D.; Goodman, D.
W. Catal. Lett. 2003, 86, 1.
(99) Lopez-Sanchez, J. A.; Lennon, D. Appl. Catal. A-Gen 2005, 291, 230.
(100) Segura, Y.; López, N.; Pérez-Ramírez, J. J. Catal. 2007, 247, 383.
(101) Nikolaev, S.; Smirnov, V. Gold Bull. 2009, 42, 182.
(102) E. Bailie, J.; J. Hutchings, G. Chem. Commun. 1999, 2151.
(103) Zanella, R.; Louis, C.; Giorgio, S.; Touroude, R. J. Catal. 2004, 223, 328.
(104) Claus, P. Appl. Catal. A-Gen 2005, 291, 222.
(105) Bus, E.; Prins, R.; van Bokhoven, J. A. Catal. Commun. 2007, 8, 1397.
(106) Guzman, J.; Gates, B. C. J. Phys. Chem. B 2002, 106, 7659.
(107) Guzman, J.; Gates, B. C. J. Am. Chem. Soc. 2004, 126, 2672.
(108) Fierro-Gonzalez, J. C.; Gates, B. C. J. Phys. Chem. B 2004, 108, 16999.

References
123
(109) Fierro-Gonzalez, J. C.; Bhirud, V. A.; Gates, B. C. Chem. Commun. 2005,
5275.
(110) Hutchings, G. J.; Hall, M. S.; Carley, A. F.; Landon, P.; Solsona, B. E.; Kiely,
C. J.; Herzing, A.; Makkee, M.; Moulijn, J. A.; Overweg, A.; Fierro-Gonzalez,
J. C.; Guzman, J.; Gates, B. C. J. Catal. 2006, 242, 71.
(111) Hao, Y.; Mihaylov, M.; Ivanova, E.; Hadjiivanov, K.; Knözinger, H.; Gates,
B. C. J. Catal. 2009, 261, 137.
(112) Aguilar-Guerrero, V.; Lobo-Lapidus, R. J.; Gates, B. C. The Journal of
Physical Chemistry C 2009, 113, 3259.
(113) Häkkinen, H.; Abbet, S.; Sanchez, A.; Heiz, U.; Landman, U. Angew. Chem.
Int. Ed. 2003, 42, 1297.
(114) Socaciu, L. D.; Hagen, J.; Bernhardt, T. M.; Wöste, L.; Heiz, U.; Häkkinen,
H.; Landman, U. J. Am. Chem. Soc. 2003, 125, 10437.
(115) Yan, Z.; Chinta, S.; Mohamed, A. A.; Fackler, J. P.; Goodman, D. W. J. Am.
Chem. Soc. 2005, 127, 1604.
(116) Yoon, B.; Häkkinen, H.; Landman, U.; Wörz, A. S.; Antonietti, J.-M.; Abbet,
S.; Judai, K.; Heiz, U. Science 2005, 307, 403.
(117) Herzing, A. A.; Kiely, C. J.; Carley, A. F.; Landon, P.; Hutchings, G. J.
Science 2008, 321, 1331.
(118) Liu, Z.-P.; Wang, C.-M.; Fan, K.-N. Angew. Chem. Int. Ed. 2006, 45, 6865.
(119) van Bokhoven, J. A.; Louis, C.; Miller, J. T.; Tromp, M.; Safonova, O. V.;
Glatzel, P. Angew. Chem. Int. Ed. 2006, 45, 4651.
(120) T. Kahl; K.-W. Schröder; F. R. Lawrence; W. J. Marshall; H. Höke; Jäckh, R.
Aniline. Ullmann‘s Encyclopedia of Industrial Chemistry; Wiley: Weinheim,
2000.
(121) Visentin, F., ETH Zurich, 2005.
(122) Groot, F. d. Coord. Chem. Rev. 2005, 249, 31.
(123) Mirabella, F. M. Internal Reflection Spectroscopy: Theory and Applications
New York, 1993.
(124) Lytle, F. W. Ber. Bunsen-Ges. Phys. Chem. 1987, 91, 1251
(125) Miller, J. T.; Kropf, A. J.; Zha, Y.; Regalbuto, J. R.; Delannoy, L.; Louis, C.;
Bus, E.; van Bokhoven, J. A. J. Catal. 2006, 240, 222.
(126) Stephen, A.; Hashmi, K. Gold Bull. 2004, 37, 51.
(127) Mohr, C.; Hofmeister, H.; Claus, P. J. Catal. 2003, 213, 86.

References
124
(128) Mohr, C.; Hofmeister, H.; Radnik, J.; Claus, P. J. Am. Chem. Soc. 2003, 125,
1905.
(129) Bus, E.; Miller, J. T.; van Bokhoven, J. A. J. Phys. Chem. B 2005, 109, 14581.
(130) Boronat, M.; Illas, F.; Corma, A. J. Phys. Chem. A 2009, 113, 3750.
(131) Boronat, M.; Concepción, P.; Corma, A. The Journal of Physical Chemistry C
2009, 113, 16772.
(132) Fujitani, T.; Nakamura, I.; Akita, T.; Okumura, M.; Haruta, M. Angew. Chem.
Int. Ed. 2009, 48, 9515.
(133) Shimizu, K.-i.; Miyamoto, Y.; Kawasaki, T.; Tanji, T.; Tai, Y.; Satsuma, A.
The Journal of Physical Chemistry C 2009, 113, 17803.
(134) Visentin, F.; Puxty, G.; Kut, O. M.; Hungerbühler, K. Ind. Eng. Chem. Res.
2006, 45, 4544.
(135) Chemical Industries; G. V. Smith; R. Song; M. Gasior; Malz, R. E., Eds. New
York, 1998; Vol. 75.
(136) Blaser, H.-U. Science 2006, 313, 312.
(137) Zuman, P.; Shah, B. Chem. Rev. 1994, 94, 1621.
(138) Mori, A.; Mizusaki, T.; Kawase, M.; Maegawa, T.; Monguchi, Y.; Takao, S.;
Takagi, Y.; Sajiki, H. Adv. Synth. Catal. 2008, 350, 406.
(139) Corma, A.; Serna, P.; Concepción;, P.; Calvino, J. J. J. Am. Chem. Soc. 2008,
130, 8748.
(140) Yuan, X.; Yan, N.; Xiao, C.; Li, C.; Fei, Z.; Cai, Z.; Kou, Y.; Dyson, P. J.
Green Chem. 2010, 12, 228.
(141) Snelders, D. J. M.; Yan, N.; Gan, W.; Laurenczy, G.; Dyson, P. J. ACS
Catalysis 2011, 2, 201.
(142) Margerison, D. In Comprehensive Chemical Kinetics; Bamford, C. H., Tipper,
C. F. H., Eds.; Elsevier: 1969; Vol. Volume 1, p 343.
(143) Boronat, M.; Corma, A. Langmuir 2010, 26, 16607.
(144) Love, J. C.; Estroff, L. A.; Kriebel, J. K.; Nuzzo, R. G.; Whitesides, G. M.
Chem. Rev. 2005, 105, 1103.
(145) Ichikawa, S.; Tada, M.; Iwasawa, Y.; Ikariya, T. Chem. Commun. 2005, 924.
(146) Fujita, S.-i.; Yoshida, H.; Asai, K.; Meng, X.; Arai, M. J. Supercrit. Fluids
2011, 60, 106.
(147) Xu, D.-Q.; Hu, Z.-Y.; Li, W.-W.; Luo, S.-P.; Xu, Z.-Y. J. Mol. Catal. A:
Chem. 2005, 235, 137.

References
125
(148) Xu, K.; Zhang, Y.; Chen, X.; Huang, L.; Zhang, R.; Huang, J. Adv. Synth.
Catal. 2011, 353, 1260.
(149) Studer, M.; Blaser, H.-U.; Exner, C. Adv. Synth. Catal. 2003, 345, 45.
(150) He, D.; Jiao, X.; Jiang, P.; Wang, J.; Xu, B.-Q. Green Chem. 2012, 14.
(151) Makosch, M.; Lin, W.-I.; Bumbálek, V.; Sá, J.; Medlin, J. W.; Hungerbühler,
K.; van Bokhoven, J. A. ACS Catalysis 2012, 2079.
(152) Andrzej, K. Vib. Spectrosc. 2005, 39, 200.
(153) de Groot, F. M. F.; Krisch, M. H.; Vogel, J. Phys. Rev. B 2002, 66, 195112.
(154) Gui, J. Y.; Stern, D. A.; Frank, D. G.; Lu, F.; Zapien, D. C.; Hubbard, A. T.
Langmuir 1991, 7, 955.
(155) Li, Z.; Chang, S.-C.; Williams, R. S. Langmuir 2003, 19, 6744.
(156) Li, D.; Li, J. Chem. Phys. Lett. 2003, 372, 668.
(157) Ankudinov, A. L.; Rehr, J. J.; Low, J.; Bare, S. R. Phys. Rev. Lett. 2001, 86,
1642.
(158) Castro, E. G.; Salvatierra, R. V.; Schreiner, W. H.; Oliveira, M. M.; Zarbin, A.
J. G. Chem. Mater. 2009, 22, 360.
(159) Yang, Y.-C.; Lee, Y.-L.; Yang, L.-Y. O.; Yau, S.-L. Langmuir 2006, 22, 5189.
(160) Mallat, T.; Orglmeister, E.; Baiker, A. Chem. Rev. 2007, 107, 4863.
(161) Diezi, S.; Reimann, S.; Bonalumi, N.; Mallat, T.; Baiker, A. J. Catal. 2006,
239, 255.
(162) Bürgi, T.; Baiker, A. J. Catal. 2000, 194, 445.
(163) Vetere, V.; Faraoni, M. B.; Santori, G. F.; Podestá, J.; Casella, M. L.; Ferretti,
O. A. J. Catal. 2004, 226, 457.
(164) Watson, D. J.; John Jesudason, R. J. B. R.; Beaumont, S. K.; Kyriakou, G.;
Burton, J. W.; Lambert, R. M. J. Am. Chem. Soc. 2009, 131, 14584.
(165) Han, D.; Li, X.; Zhang, H.; Liu, Z.; Li, J.; Li, C. J. Catal. 2006, 243, 318.

![The effect of Fe2O3 crystal phases on CO2 hydrogenation...3 crystal phases on CO 2 hydrogenation [32]. γ-Fe 2O 3 phase in the catalysts was formed by washing FeAl precipitate with](https://img.pdfslide.us/doc/110x75/5f392e2c521dd34bc8016b6a/the-effect-of-fe2o3-crystal-phases-on-co2-hydrogenation-3-crystal-phases-on.jpg)