Embed Size (px)
Citation preview
RIGA TECHNICAL UNIVERSITY
Faculty of Power and Electrical Engineering Institute of Energy Systems and Environment
Darja MARKOVA Environmental Engineering Doctoral Program
RESEARCH OF BIOETHANOL REFORMING AND HYDROGEN PRODUCTION PROCESSES FOR USE IN FUEL CELL EQUIPMENT
Dissertation Summary
Scientific Supervisor Professor Dr. sc. ing.,
G.BAŽBAUERS Scientific Supervisor
Assistant professor, Dr. chem., K.VALTERS
Riga 2009

2
UDK 662.6/.9+620.95](043.2) Ma 634 r
Markova D. Research of bioethanol reforming and hydrogen production processes for use in fuel cell equipment. Dissertation summary.-R.:RTU, 2009.-38 pages. Published in accordance with the resolution of Riga Technical University, Institute of Energy Systems and Environment Protocol No 2, Xth of November, 2009
ISBN …….
3
DISSERTATION NOMINATED FOR SCIENTIFIC DEGREE OF THE DOCTOR OF ENGINEERING SCIENCES AT RIGA TECHNICAL UNIVERSITY
This study will be publicly defended at 2 p.m. on December the 22th, 2009 at the Assembly hall of the Faculty of Power and Electrical Engineering, 1 Kronvalda boulevard, Riga. OFFICIAL OPPONENTS Professor, Dr.hab.sc.ing. Ivars Veidenbergs Riga Technical University Associate professor, Dr.sc.ing. Ivars Kudreņickis University of Latvia Professor, Dr. hab. sc.ing. Gintaras Denafas Kaunas University of Technology, Lithuania
STATEMENT I confirm that I personally developed this dissertation, which I submitted for consideration at Riga Technical University, for attaining the degree of the doctor of engineering sciences. This study has not been submitted to any other university for attaining a scientific degree. Darja Markova …………………………….(Signature) Date: ……………………… This dissertation is written in Latvian and contains an introduction, 4 chapters, conclusions, bibliography, 4 appendixes, 31 tables and 66 figures. The total volume comprises 149 pages. The bibliography contains 107 references.
This work has been supported by the European Social Fund within the project „Support for the implementation of doctoral studies at Riga Technical University”. This work was made with financial support of the German Environmental Fund as well as the Latvian Council of Science research grant No.: 08.2130, Ministry of Education and Science and Riga Technical University research grant No.: 7383.
4
Table of contents Background, current situation and topicality of the work .......................................................... 6 Objective and tasks ..................................................................................................................... 6 Research methodology ............................................................................................................... 6 Scientific significance ................................................................................................................ 7 Practical significance .................................................................................................................. 7 Publications ................................................................................................................................ 8 Structure and size of the thesis ................................................................................................... 9 1. Critical review of the fuel reforming process research .................................................... 10 2. Thermodynamic analysis of ethanol autothermal reforming ........................................... 13 3. Experimental research of ethanol autothermal reforming process, data obtaining and analysis ..................................................................................................................................... 22 4. Experimental data treatment and regression analysis ...................................................... 23 Conclusions .............................................................................................................................. 35 References ................................................................................................................................ 37

The list of terms and abbreviations ATR - autothermal reforming; C2H5OH - ethanol; CH4ATR - methane concentration obtained in the autothermal reforming reactor, % or in dry gas volume parts; COATR - carbon monoxide concentration obtained in the autothermal reforming reactor, % or in dry gas volume parts; DW statistic - Durbin-Watson statistic; GHSVATR - gas space velocity in the autothermal reforming reactor, h-1; H2’ATR - hydrogen yield obtained in autothermal reforming reactor, molH2/molC2H5OH; H2ATR - hydrogen concentration obtained in the autothermal reforming reactor, % or in dry gas volume parts; p - absolute or gauge pressure, bar; PEM KE - proton exchange membrane fuel cell; ppm - parts per million; d.g. - dry gas; S/C - steam to carbon molar ratio; TATR - an average temperature in the autothermal reactor, ºC; TATRie - temperature in the autothermal reactor inlet, ºC; TATRiz - temperature in the outlet of autothermal reactor catalyst, ºC; VIF - variance inflation factor; xi - process factors in the regression equation;
OHHCdzQ
52 - lower heating value of ethanol, kJ/mol;
n& - amount of material, mol;
2HdzQ - lower heating value of hydrogen, kJ/mol;
η - ATR system efficiency; λ - air consumption coefficient, which is calculated as the ratio of actually used oxygen in the process and stoichiometrically needed oxygen amount.
5
6
Background, current situation and topicality of the work One of the most important aims of Latvian energy sector development is to increase the share of renewable energy sources in the state energy balance. One of the methods to achieve this goal is to use bioethanol powered fuel cells in road vehicles, portable and stationary energy plants. However, fuel cell usage possibilities to a great extent are dependent on fuel reforming process efficiency as the fuel used in the fuel cells is hydrogen, which could be obtained from ethanol via thermo-chemical reforming process. Therefore, it is important to optimize the fuel reforming process in the fuel cell systems, in order to get the maximum hydrogen concentration with minimum energy consumption and to eliminate or minimize formation of undesirable reaction products. One of the most promising fuel reforming processes is the autothermal reforming. Currently, ethanol autothermal reforming process is not understood sufficiently and there is a lack of experimental data to carry out the optimization of the reforming process. Therefore, the ethanol autothermal reforming process is investigated in this work theoretically as well as experimentally.
Objective and tasks The objective of this thesis is to analyze the ethanol autothermal reforming (ATR) process, and to determine which factors and how affect the obtained gas composition, the heat amount, required for the process, the reforming process efficiency, and to find the optimum factor values providing the maximum hydrogen concentration as the result. To reach this objective the following tasks have to be solved:
• To develop a bioethanol ATR process thermodynamical analysis model, which helps to define interconnections between process factors as well as the influence of these on the reformed gas composition and on the amount of heat necessary for the process. To estimate the values of process factors, which ensure that no carbon is formed during the process as well as minimum carbon monoxide and methane concentrations and maximum hydrogen concentration are obtained.
• Using a theoretical research model, to make optimization in order to define the optimum values of factors, which are required for achieving the maximum hydrogen concentration and the maximum efficiency.
• Based on the theoretically defined ranges of the optimum values of factors to perform the experimental research of bioethanol ATR process.
• To make regression analysis of the experimental data and to obtain regression equations which allow determining hydrogen, carbon monoxide and methane concentrations depending on the essential bioethanol ATR process factors.
• By means of the regression equations to determine the optimum values of bioethanol ATR process factors at which the maximum concentration of hydrogen can be reached.
Research methodology With the developed model, being based on thermodynamic analysis, theoretical research of the bioethanol ATR process was made. It was defined how the process factors, such as temperature in the reactor, ratios of the input reagents and pressure influenced the reformed gas composition and the amount of heat required for the process in theory. Based on

7
results of the theoretical research, the process experimental research was made using a bioethanol ATR test-stand. The experiments were made in Freiburg, Germany, at the Hydrogen Production group, Energy Technology department, Fraunhofer Institute for Solar Energy Systems [9]. Using the experimental data which characterize dependence of the gas concentration on the process primary factors, regression analysis was made and regression models describing the gas composition were developed. The optimum values of the bioethanol ATR process factors at which it is possible to reach the maximum concentration of hydrogen were obtained by means of the developed regression models.
Scientific significance Results of the theoretical and experimental research obtained during the work expand the knowledge about the influence of process factors on composition of the reformed gas and on the reformer operation. Influence of the process factors on the gas composition and on the amount of heat required for the process are shown with the developed simulation model of ethanol autothermal reforming process. The obtained theoretical dependencies coincide with the results of experimental research of ethanol autothermal reforming process system which were used for developing the regression equations. The obtained regression equations can be used for defining of the gas composition and for the process control. With the help of the regression equations the optimum factor values for obtaining the maximum hydrogen concentration have been defined. These values can be used for analysis of the reforming processes.
Practical significance The theoretical and experimental research results shown in this work can be used to construct and develop fuel reforming systems which are an important part of fuel cell technology. Fuel cell technologies are used as the energy conversion devices in a wide range of power capacities in transport, power plants and other branches; therefore, optimization of the reformers promotes development of the above mentioned technology.
Approbation
The results of the thesis have been used in the following scientific studies: research project No.: 08.2130 funded by Latvian Council of Science „Analysis of fuel reforming process and energy balance of bio-ethanol fuel cell for integration in heating system”; research project No.: 7383 funded by Ministry of Education and Science and Riga Technical University „Integration of bioethanol fuel cell cogeneration systems into Latvian energy supply system”. The results of the thesis have been reported and discussed in:
1. The 50th RTU scientific conference with the paper „Optimization of ethanol autothermal reforming process with chemical equilibrium calculations” in Riga, Latvia, 14-15 October 2009.
2. The 67th LU scientific conference with the paper „Bioethanol autothermal reforming process research” in Riga, Latvia, 28 January - 2 February 2009.
8
3. The RTU annual Innovation and new Technologies conference about MES and RTU project Nr.: 7383 „Integration of bioethanol fuel cell cogeneration systems into Latvian energy supply system” results in Riga, Latvia, 20-21 January 2009.
4. The international scientific conference “Fuel cells. Science&Technology” with the paper „Optimization of bio-ethanol autothermal reforming and carbon monoxide removal processes” in Copenhagen, Denmark, 8-9 October 2008.
5. The 49th RTU scientific conference with the paper „Techno-economical feasibility analysis of bioethanol fuel cell cogeneration system” in Riga, Latvia, 13-15 October 2008.
6. The 49th RTU scientific conference with the paper „Reforming of bioethanol to hydrogen for use in fuel cell cogeneration plants” in Riga, Latvia, 13-15 October 2008.
7. The international conference „Global environmental change: Challenges to science and society in southeastern Europe” with the paper „Integration of bioethanol fuel cell cogeneration systems into Latvian energy supply system” in Sofia, Bulgaria, 19-21 May 2008.
8. The 48th RTU scientific conference with the paper „Comparison of ethanol steam and autothermal reforming processes” in Riga, Latvia, 11-13 October 2007.
9. The 47th RTU scientific conference with the paper „Bio-ethanol powered microreformer for PEM-fuel cell with up to 300 W output capacity” in Riga, Latvia, 13-14 October 2006.
Publications
1. Markova D., Valters K., Bažbauers G., Optimization of ethanol autothermal reforming process with chemical equilibirum calculations. RTU scientific proceedings, 13rd series, Environmental and Climate Technologies, volume 3, RTU Publishing House, Riga, 2009, 79-85 pp.
2. Markova D., Bažbauers G., Valters K., Alhucema Arias R., Weuffen C., Rochlitz L., Optimization of bio-ethanol autothermal reforming and carbon monoxide removal processes// Journal of Power Sources. – Amsterdam: Elsevier B.V., 2009. - No.193. - 9.-16 pp.
3. Porubova J., Markova D., Bažbauers G., Valters K., Techno-economical feasibility analysis of bioethanol fuel cell cogeneration system, RTU scientific proceedings, 13rd series, Environmental and Climate Technologies, volume 1, RTU Publishing House, Riga, 2008, 68-74 pp.
4. Markova D., Valters K., Bažbauers G., Reforming of bioethanol to hydrogen for use in fuel cell cogeneration plants, RTU scientific proceedings, 13rd series, Environmental and Climate Technologies, volume 1, RTU Publishing House, Riga, 2008, 61-67 pp.
5. Markova D., Bažbauers G., Valters K., Rochlitz L. Optimization of bio-ethanol autothermal reforming and carbon monoxide removal processes. Fuel cells. Science&Technology 2008, Delegate Manual, Copenhagen, 2008, 24 p.

9
6. Markova D., Porubova J., Bažbauers G., Integration of bioethanol fuel cell cogeneration systems into Latvian energy supply system, International Conference, Global environmental change: Challenges to science and society in southeastern Europe, Delegate Manual, Sofia, 2008.
7. Markova D., Bažbauers G., Education for sustainable development in the context of international student exchange programs, 2nd International Conference, Environmental Science and Education in Latvia and Europe: Education for sustainable development, Conference proceedings, Riga, 2008, 53 p.
8. Markova D., Bažbauers G., Comparison of ethanol steam and autothermal reforming processes, RTU scientific proceedings, 4th series, Power and Electrical Engineering, Energy systems and Environment, volume 21, RTU Publishing House, Riga, 2007, 23-28 pp.
9. Markova D., Wueffen C., Bažbauers G., Bio-ethanol powered microreformer for PEM-fuel cell with up to 300 W output capacity, RTU scientific proceedings, 4th series, Power and Electrical Engineering, volume 17, RTU Publishing House, Riga, 2006, 144-149 pp.
10. Markova D., Bažbauers G., Kundziņa A., Economic Modelling of CHP Potential in Energy Supply System of Latvia, RTU scientific proceedings, 4th series, Power and Electrical Engineering, volume 14, RTU Publishing House, Riga, 2005, 204-210 pp.
11. Markova D., Bažbauers G., Kundziņa A., Optimization model of CHP potential for provision of sustainable energy supply of Latvia, International conference EcoBalt 2005, conference scientific proceedings, Riga. 2005, 76 p.
12. Markova D., Bažbauers G. un Kundziņa A., Estimation on CHP Potential Contribution to Sustainable Energy Supply of Latvia, RTU scientific proceedings, 4th series, Power and Electrical Engineering, volume 12, RTU Publishing House, Riga, 2004, 111-116 pp.
Structure and size of the thesis The thesis is written in Latvian and it contains an introduction, four chapters, conclusions, appendixes and bibliography. In the introduction the topicality of thesis the aim and methods of research, as well as the significance of the achieved results is discussed, In the first chapter, the theoretical background of fuel cell technologies and the reforming processes as well as developments that have been achieved until now are discussed. At the end of the chapter the aims of the thesis are defined. In the second chapter, the thermodynamic analysis of the ethanol autothermal reforming process is discussed. The analysis was made using a chemical equilibrium calculation model, developed during the research work. With help of the theoretical research models the process factor effect on hydrogen, carbon monoxide and methane concentration, carbon formation and the heat amount input for the process were analyzed. As a result of the theoretical research, the values for the maximum hydrogen concentration and the maximum process efficiency were defined. In the third chapter of the thesis, the experimental ethanol autothermal reforming process research and obtained data analysis are described. In the fourth chapter, the results of statistical treatment of experimental data and regression analysis are shown. As the result of the regression analysis, the necessary regression equations which allow to determine hydrogen, carbon monoxide and methane concentrations depending on the process factor values were obtained. Using the obtained regression equations, the optimization of hydrogen concentration was carried out and the
10
optimum process factor values which are in agreement with the theoretically obtained optimum values were defined.
1. Critical review of the fuel reforming process research The fuel reformer which is studied in the thesis could be successfully used together with a proton exchange membrane fuel cell (PEM FC) which is one of the most promising fuel cell types with a wide application spectrum. PEM FCs with an operating temperature of 50-120°C belongs to low temperature fuel cells, usually used in portable devices, in transport and for the power supply in buildings. As PEM FC disadvantage should be mentioned that it is not desirable that the platinum catalyst get in contact with CO and if the CO concentration exceeds 100 ppm then at certain PEM FC operation temperatures it can influence operation of the fuel cell [5]. If CO concentration increases the PEM FC efficiency decreases [14]. Nowadays, ongoing active PEM FC research enables to anticipate faster cost reduction of this type of fuel cell in comparison with other fuel cell types [16, 19]. The development areas of PEM FC systems currently include optimization and modeling of the reforming processes and systems [4, 34]. An important issue is the choice of the fuel for the reforming process. Alcohol reforming, for example, could take place at lower temperatures as diesel and gasoline reforming, therefore the reformer could be constructed with higher energy efficiency and more compact [34]. One of the most promising fuels, which can be used for hydrogen production, is alcohol - methanol or ethanol [21, 38]. Methanol is toxic and that is the reason why its usage in hospitals, automobiles as well as in ecologically sensitive areas is limited. The advantage of ethanol is its higher heat capacity and less heat is required for the evaporation of the ethanol in comparison with methanol. The most important advantage of ethanol in comparison with other liquid fuels used for hydrogen production is that ethanol is basically non-toxic and there is no need to desulphurize it. Because of the high hydrogen to carbon ratio of ethanol less CO2 and carbon is formed during its thermo-chemical reforming in comparison with other liquid fuels. In comparison to gaseous fuels, for example methane, ethanol is easier to use, store and transport. In 2003 only 5% of the produced ethanol in the world was made from petroleum products and with increasing petroleum price it is expected that this ratio will reduce even more [3]. Review of reforming processes of alcohols Hydrogen production from alcohols via reforming can be carried out in three different ways:
• The steam reforming process, which includes hydrocarbon catalytical cracking with water vapor;
• Using partial oxidation, i.e. understoichiometric combustion; • With help of autohermal reforming (ATR), which combines the two above mentioned
processes [11]. The gas acquired through reforming reactions contains mainly hydrogen, carbon monoxide, carbon dioxide, methane, nitrogen and water. The gas composition is dependent on process factors, which include amongst others, the amounts of reactants as well as the temperature of the process. Quality and quantity of the reformed gas are influenced by the catalyst used and the reactor construction [8, 29]. In the steam reforming process the carbon containing fuel together with water vapor is transformed to hydrogen, carbon monoxide and carbon dioxide. Pressure, water and carbon
amounts in the fuel characterize the reforming process. Ratio of water molar amount to carbon (contained by the supplied fuel) molar amount fed into reactor is called the S/C ratio [36, 31]:
C
OH
nn
CS 2= (1.1)
Where - fed water amount, mol; OHn
2
- fed carbon amount (contained by the supplied fuel), mol. Cn In the partial oxidation process, alcohol is fed with air in the reactor, where oxidation process occurs at understoichiometric conditions. The process is controlled with help of supplied oxygen amount, characterized by the λ value [37].
tricstoichiomeO
actualO
nn
2
2=λ , (1.2)
where - the actual amount of oxygen used in the process, mol; actualOn
2
- the stoichiometrically required oxygen amount, mol. tricstoichiomeOn2
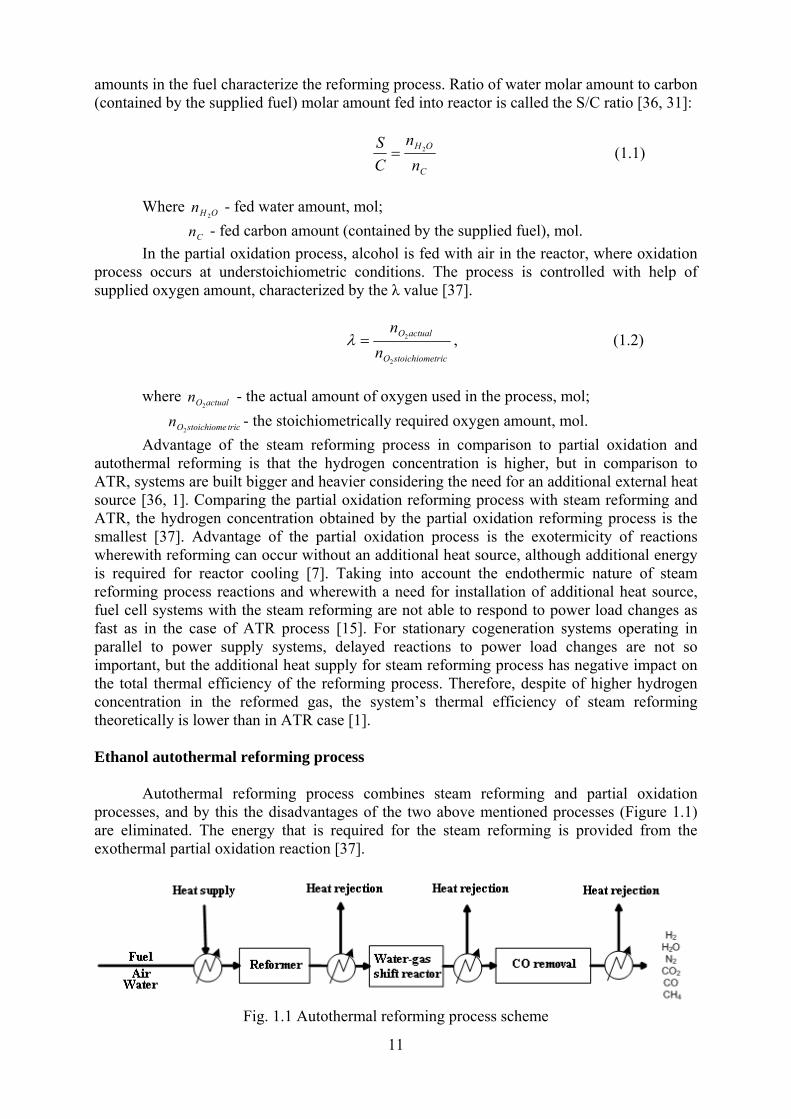
Advantage of the steam reforming process in comparison to partial oxidation and autothermal reforming is that the hydrogen concentration is higher, but in comparison to ATR, systems are built bigger and heavier considering the need for an additional external heat source [36, 1]. Comparing the partial oxidation reforming process with steam reforming and ATR, the hydrogen concentration obtained by the partial oxidation reforming process is the smallest [37]. Advantage of the partial oxidation process is the exotermicity of reactions wherewith reforming can occur without an additional heat source, although additional energy is required for reactor cooling [7]. Taking into account the endothermic nature of steam reforming process reactions and wherewith a need for installation of additional heat source, fuel cell systems with the steam reforming are not able to respond to power load changes as fast as in the case of ATR process [15]. For stationary cogeneration systems operating in parallel to power supply systems, delayed reactions to power load changes are not so important, but the additional heat supply for steam reforming process has negative impact on the total thermal efficiency of the reforming process. Therefore, despite of higher hydrogen concentration in the reformed gas, the system’s thermal efficiency of steam reforming theoretically is lower than in ATR case [1]. Ethanol autothermal reforming process Autothermal reforming process combines steam reforming and partial oxidation processes, and by this the disadvantages of the two above mentioned processes (Figure 1.1) are eliminated. The energy that is required for the steam reforming is provided from the exothermal partial oxidation reaction [37].
Fig. 1.1 Autothermal reforming process scheme
11

Total ethanol autothermal reaction:
( ) 22222252 88,152276,35,0 NHCOOHNOOHHC ++→+++126 −⋅−=Δ molkJH R
(1.3)
From the equation (1.3) it can be concluded that from one mole of ethanol five moles of hydrogen can be obtained theoretically. ATR process is controlled by changing the values of air consumption coefficient λ (1.2) and S/C (1.3). Since values of those factors determine whether the process will proceed exothermically or endothermically, both of these factors should be included in the ATR process heat balance analysis [28]. The aim of the reforming processes is to maximize the amount of obtained hydrogen, to minimize the amount of hydrogen binding and membrane or reforming catalyst harming substances, such as carbon monoxide, methane and carbon in the reformed gas, as well as to maximize efficiency of the reforming process. By carrying out a scientific literature review, a number of theoretical [1, 10, 30, 32] and experimental [2, 25, 37] studies of ethanol ATR process has been analyzed, and deficiencies of those are discussed further. In experimental research works [2, 25], where ethanol ATR processes, CO purification stages and a PEM FC system [2] were examined with an aim to get a stable process, and in studying separately ATR reformer [25], which is able to reform various fuels, and ethanol being among them, no process optimization was reported, and no studies of the impact of process factor values on ATR reactor operation, i.e. carbon formation mechanism, hydrogen yield and efficiency, was made for sufficiently wide range of the factor values. However, process factor optimization is very important for construction and operation of the experimental as well as real plants. Studies of too narrow a range of the examined factor values, which does not allow to define influence of the factors on the reformed gas composition and the required heat amount well enough, is observed in a number of other studies [10, 37, 30, 32]. In the theoretical ethanol ATR process research [10], by examination of the process at different stoichiometric conditions, it was determined that the process efficiency (2.4) rises with increasing S/C values and decreases with increasing TATR values. It was concluded, that the relationships defined in the research are suitable for any size of ATR reactors and these relationships are not dependent on the amounts of supplied reactants. As a disadvantage of the research it should be mentioned that influence of S/C and pressure on the process was not investigated in sufficiently wide range of the factor values. However, the influence of the above mentioned factors on the objectives defined in the current thesis is necessary and important because S/C value defines the amount of reactants in the system, as well as it has an influence on the reformed gas composition. In the theoretical ethanol ATR research [30], impact of the process factors on the reformed gas composition, carbon formation and the amount of heat required for the reforming process are analyzed [30]. The influence of pressure on the reformed gas composition is not analyzed in the above mentioned work. Semelsberger et al. [32] theoretically have studied the ethanol ATR process, and by varying process factor values have determined that the maximum hydrogen concentration, which is about 45%, can be achieved within the range of S/C values from zero to one and within TATR range from 327 to 427°C. It is mentioned in the work that the kinetic research of the process is needed in order to precisely define the optimum process factor values. Methane formation and pressure influence on the reforming process are not analyzed in this work, there are also no optimum values of λ defined, as well as the actual composition of the obtained reformed gas is not examined.
12
The actually obtained composition of the reformed gas is not taken into account and an assumption that all carbon contained by the fuel is converted into CO2 without formation of CO and CH4 is made in the theoretical examination of ethanol autothermal reforming reaction (1.3) [1]. In the study [1], it is found that the maximum thermal efficiency (1.4) equal to 93.7%, can be achieved at the thermoneutral conditions. The experimentally obtained reformed gas contains both carbon monoxide and methane, and if the reforming process is analyzed, the formation of chemical equilibrium conditions should be taken into account, which was not done in the work [1].
%10052
2
52
2 ⋅⋅
⋅=
OHHCdz
Hdz
th QOHHCnQHn
&
&η , (1.4)
Studies of rocess modeling and optimization using empirical1 models [6, 18, 12] are found literature, in the field of chemical reforming. Comparing two mathematical modeling methods for modeling and optimization of the reforming process - empirical and mechanistic2, it was found that the empirical model in most cases is more efficient, simpler and lead to better results than if the mechanistic model is used [18]. The advantage of the empirical models is that with help of these models mutual interrelations of the reforming process factors could be forecasted and defined, which is difficult or even impossible if the mechanistic models are used [22]. As follows from the above research review of the bioethanol ATR reforming process there is a lack of experimental data and empirical models for process modeling and optimization. Therefore, one of the most important objectives of the dissertation was to obtain the empirical model for ethanol ATR process optimization. Undesirable reaction products of reforming processes Additionally to the main reactions other reactions and side reactions, including methane formation, can occur during the reforming process. Methane is not as harmful to fuel cells as carbon monoxide but methane formation reduces hydrogen concentration which is used as the fuel for fuel cells, whereas methane formation is unwanted. Undesirable side effect of the reforming process is also the formation of solid carbon in the form of soot. Soot blocks the catalyst surface, reducing its activity, hindering gas flow and in such way reducing system’s efficiency. If soot accumulates on the catalyst’s surface it can start to burn off, damaging the catalyst. On the basis of incompleteness of the reviewed research works, where influence of the factor values on formation of the undesirable reaction products and process optimization was not done, these objectives were included in the aims of the dissertation.
2. Thermodynamic analysis of ethanol autothermal reforming For the purpose of research the calculation model of the ethanol ATR process system was developed using the chemical process simulation program „ChemCAD” [17]. The developed ethanol ATR model is based on chemical equilibrium calculations and for its development it is necessary to choose the reactants and reaction products that are used in the
1 Empirical model is a model that uses experimental data. It is used if the process is not well enough explained by physical and chemical relationships [23]
13
2 Mechanistic or theoretic model is based on the research of process mechanism, where interconnection between dependent and independent variables are explained by chemical and physical relationships [26]

calculations at the beginning. The following reactants and reaction products were chosen for the development of the ethanol ATR process calculation model:
• Reactants - C2H5OH, N2, O2, H2O. • Reaction products - H2, CO, CO2, CH4, C, N2, O2, H2O.
Selecting the equipment and placing it in the required sequence, an ethanol ATR system calculation model scheme (Figure 2.1) which comply with the actual reforming system, was developed. In the „ChemCAD” simulation program, when defining inlet flow (further in the text represented with serial number in braces - „{}”) composition it is possible to define its amount, temperature and pressure. Pumps, heat exchangers, mixers, reactors, controllers, component separators and other system elements are defined as equipment (further in the text represented with serial number in brackets - „()”). The ethanol ATR process schema (Figure 2.1) shows that ethanol {2}, water {4} and air {1} are supplied to the system with temperature 20˚C and pressure 1 bar. Calculations are made for flow rate of supplied ethanol 1 mol. Amount of supplied water and air is varied depending on the chosen S/C and λ values by using the corresponding regulators – S/C regulator (9) and λ regulator (10). For supply of the reactants to the ATR system the pumps are used (4, 5, 6). It is assumed in the calculations that the pressure loss in the system is zero and efficiency of the pumps is 1. Mixer (7) is used for the mixing of streams of ethanol and water in the model and heat exchanger (8) - for vaporization of the mixture. After mixing of ethanol water mixture with air in the mixer (3) the heat exchanger (12) is used for heating up of the gaseous reactants to the temperature of ATR reactor. Heated reactant flow is supplied to the ATR reactor (2) which is used for simulation of the ATR reactions. It is foreseen in the calculations that in the heat exchanger (11) the reformed gas is cooled down from the temperature of ATR reactor to the average temperature required by water gas shift reactor, which is 350°C. In order to determine dry gas composition of the products {11}, water {12} is separated from the stream of the reaction products in the separator (1).
Figure 2.1 Schematics of ethanol ATR process simulation model
All elements, that were included in the ethanol ATR system, were used for Gibb’s free energy minimization and these were in the gaseous phase excluding carbon which was defined as solid compound in the ATR reactor effluent. In the calculation, air was used as oxidant and nitrogen contained by the air was defined as an inert compound not involved in the reactions. Isothermal operation was chosen for the reforming reactor calculations, as it allows to vary the ATR process temperature. In order to determine the optimum values of the ethanol ATR process, the ranges of values of S/C, λ, TATR and p chosen for chemical equilibrium calculations were the following:
• S/C = 0.5 – 5; • λ = 0.1 – 0.7; • TATR = 200 – 900ºC;
14
• P = 1 - 5 bar (absolute pressure).
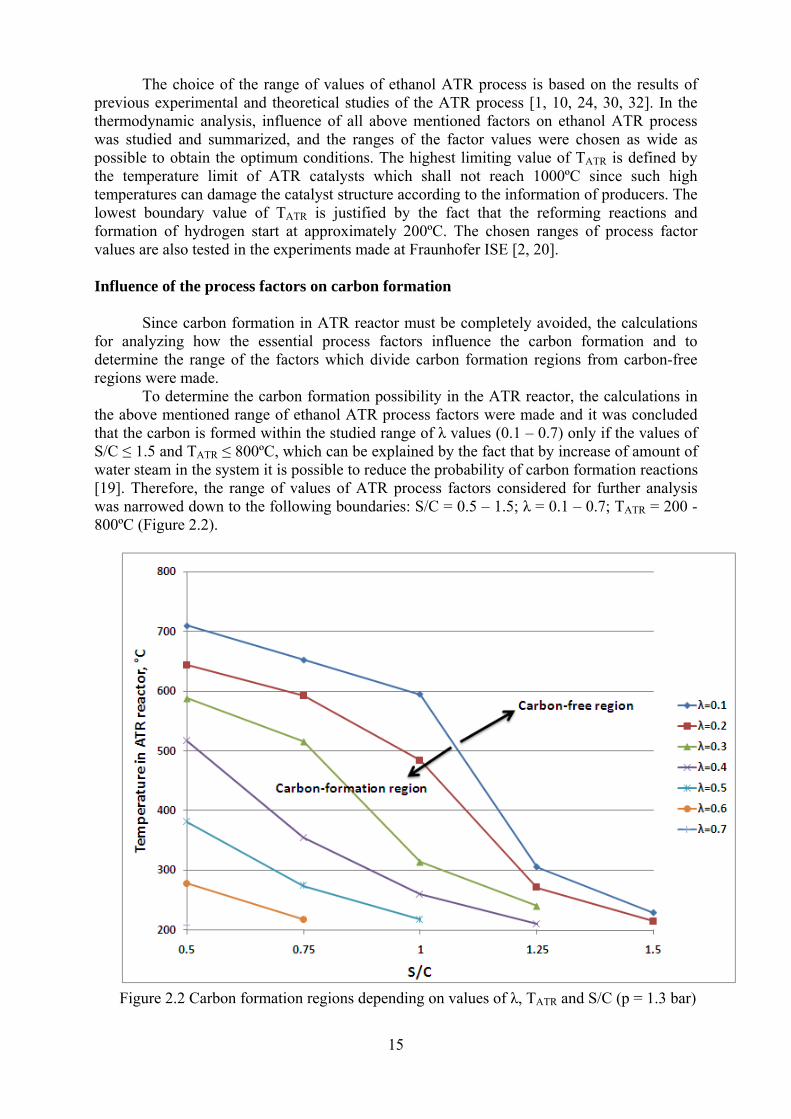
The choice of the range of values of ethanol ATR process is based on the results of previous experimental and theoretical studies of the ATR process [1, 10, 24, 30, 32]. In the thermodynamic analysis, influence of all above mentioned factors on ethanol ATR process was studied and summarized, and the ranges of the factor values were chosen as wide as possible to obtain the optimum conditions. The highest limiting value of TATR is defined by the temperature limit of ATR catalysts which shall not reach 1000ºC since such high temperatures can damage the catalyst structure according to the information of producers. The lowest boundary value of TATR is justified by the fact that the reforming reactions and formation of hydrogen start at approximately 200ºC. The chosen ranges of process factor values are also tested in the experiments made at Fraunhofer ISE [2, 20]. Influence of the process factors on carbon formation Since carbon formation in ATR reactor must be completely avoided, the calculations for analyzing how the essential process factors influence the carbon formation and to determine the range of the factors which divide carbon formation regions from carbon-free regions were made. To determine the carbon formation possibility in the ATR reactor, the calculations in the above mentioned range of ethanol ATR process factors were made and it was concluded that the carbon is formed within the studied range of λ values (0.1 – 0.7) only if the values of S/C ≤ 1.5 and TATR ≤ 800ºC, which can be explained by the fact that by increase of amount of water steam in the system it is possible to reduce the probability of carbon formation reactions [19]. Therefore, the range of values of ATR process factors considered for further analysis was narrowed down to the following boundaries: S/C = 0.5 – 1.5; λ = 0.1 – 0.7; TATR = 200 - 800ºC (Figure 2.2).
Figure 2.2 Carbon formation regions depending on values of λ, TATR and S/C (p = 1.3 bar)
15

The curves in Figure 2.2 correspond to various values of λ and separate the carbon formation regions from the regions where carbon is not formed. Results of the calculations show that reduction of λ value facilitates carbon formation. To escape carbon formation in the ethanol ATR reactor at S/C ≤ 1 the temperatures TATR ≥ 600ºC and air-to-fuel ratio λ ≥ 0.3 should be used. If S/C ≥ 1 and TATR ≥ 300ºC are used, than the λ value should be ≥ 0.2. From the results it can be seen that in order to avoid carbon formation at certain λ value, S/C value should be increased if decreasing TATR. In general, it can be concluded that in order to avoid carbon formation it is necessary to increase S/C value, λ value or TATR value. Influence of the temperature and steam to carbon ratio on the composition of reaction products Hydrogen, carbon monoxide and methane concentrations in the reaction products were analyzed theoretically depending on S/C and TATR factor values. Changing S/C value from 0.5 to 5, and TATR value from 200ºC to 900ºC at constant air-to-fuel ratio value λ = 0.3 (which is close to the median value of the studied range of λ values) and at p = 1.3 bar the product composition of ATR process reactions shown in figure 2.3 were obtained.
Figure 2.3 Dependence of the composition of reaction products on TATR and S/C (λ = 0.3;
p = 1.3 bar)
16
The results of chemical equilibrium calculations (see Figure 2.3) show that when S/C value at constant TATR value is increased, H2 concentration also increases. The results (see Figure 2.3) also show that further TATR increase above the optimum value at fixed S/C value favors H2 concentration reduction. CO concentration decreases if S/C values increases at constant TATR, but increases by increasing TATR at fixed S/C values (see Figure 2.3). CO appears in very small amounts at temperatures TATR below 400ºC however H2 concentration is comparatively small but CH4 concentration is relatively high in that temperature range. The calculation results also show that CH4 concentration decreases by increasing S/C and TATR values, because by increased temperature, equilibrium of CH4 formation reactions, which are endothermic, shifts to the product side and consequently more H2 is formed. However, only at TATR value range from 600ºC to 750ºC and S/C value range from 2 to 5 very small CH4

concentration is observed. At TATR values larger than 750ºC CH4 concentration in the obtained gas decreases to zero. It can also be observed from the calculation results that the relative rate of change of the H2, CO and CH4 concentrations decrease if S/C value increases. In the studied range of factor values, the highest H2 value is 0.42 volume parts in dry gas, which can be obtained at S/C = 5 and TATR = 600ºC. Influence of pressure on the composition of reaction products By changing the p value from 1 to 5 bar, and TATR from 200ºC to 900ºC, at constant S/C = 1.5 and λ = 0.3 the composition of ATR process reactions products shown in Figure 2.4 were obtained. In result of calculations was defined, that at fixed TATR increase of pressure leads to decrease of H2 and CO concentrations, and increase of CH4 concentration (see Figure 2.4).
Figure 2.4 Dependence of the composition of reaction products on TATR and p (S/C = 1.5;
λ=0.3)
The results also show that the pressure has a considerable influence on the composition of reaction products only at TATR ≤ 750ºC and the pressure theoretically has little influence on ATR process at the temperatures above 700ºC, where water-gas shift reaction which is almost not influenced by the pressure changes, prevails. To evaluate how the increase of S/C and λ factor values influences the pressure effect on the composition of reaction products depending on the temperature in the reactor, calculations, by changing TATR value from 200°C to 900°C and p values from 1 bar to 5 bar, were made. As a result, it was observed that by increasing S/C value from 1.5 to 3, character of the pressure influence the composition of reaction products remains the same as in the Figure 2.4 but the value of TATR up to which the pressure influences the composition of reaction products decreases from 750°C to 700°C. By increasing the air-to-fuel ratio from 0.3 to 0.5 the value of TATR value up to which the pressure influences the composition of reaction
17

products decreases from 750°C to 550°C, and that allows to conclude that the pressure influence on the composition of reaction products at the TATR value range from 600°C to 750ºC is highly dependent on S/C and λ values. The influence of the pressure on composition of reaction products is relatively small comparing to the influence of S/C, TATR and λ values, therefore the pressure is not included among the factors in the optimization. Optimization of hydrogen yield The optimum points of H2 yield within the range of values of S/C from 0.5 to 5 and λ values from 0.1 to 0.7 are found by using the following objective function:
max),/,(
52
2 →OHHCn
CSTHn ATR
&
& λ , (2.1)
The aim of the calculation is to find the maximum hydrogen yield and the corresponding TATR value, at which it is achieved at each S/C and λ value which are consecutively changed in the above mentioned value range. Values of the objective function (secondary y axis) and the corresponding TATR values (primary y axis) at chosen values of S/C and λ for the whole range of the studies are shown in Figure 2.5. It can be observed that H2 yield increases and the corresponding temperature in the reactor TATR decreases if S/C value is increased and λ value is decreased. The maximum value of hydrogen yield, which is 4.87 mol/mol C2H5OH within the studied range of process factor values is reached at S/C = 5, λ = 0.1 and TATR = 650°C.
Figure 2.5 The optimum values of H2 yield and corresponding TATR, λ and S/C values (p = 1.3
bar)
18

Since along with H2 yield maximization, it is also important to minimize CO and CH4 yields in the reaction products, including of these objectives in the objective function, the following objective function could be defined:
max),/,)((
52
42 →−−
OHHCnCSTCHnCOnHn ATR
&
&&& λ , (2.2)
The maximum values of the objective function (2.2) (secondary y axis) and the corresponding TATR values (primary y axis) at S/C value range from 0.5 to 5 and λ value range from 0.1 to 0.7 are shown in Figure 2.6. It can be observed that similarly to H2 yield maximization, (H2-CO-CH4) yield optimum values increase and the corresponding TATR decrease if S/C value is increased and λ value is decreased. The optimum TATR values are lower than the optimum TATR values in the case of H2 yield optimization because at fixed S/C and λ values, increasing TATR value, increases CO concentration in the reaction products. The maximum value of the objective function is 4.41 mol/molC2H5OH (H2 = 4.86 mol; CO = 0.42 mol; CH4 = 0.03 mol), within the studied range of process factor values and it is reached at TATR = 630°C, S/C = 5 and at λ value of = 0.1, which corresponds to the minimum λ value within the studied range of values.
Figure 2.6 The optimum values of (H2-CO-CH4) yield and corresponding TATR, λ and S/C
values (p = 1.3 bar)
The results of the thermodynamic analysis show that with increase of S/C value at constant TATR, λ and p values, H2 concentration in the reaction products increases but CO and CH4 concentration in the reaction products decreases. Increase of λ factor value at constant S/C, TATR and p values, leads to decrease of H2, CO and CH4 concentrations in the reaction products.
19

Optimization of process efficiency Taking into account that heat consumption of the reforming process plays an important role in the designing of the ATR ethanol reforming systems, and it is known that increase of S/C value promotes hydrogen yield but increases heat amount supplied to the ATR process at the same time, it is important to consider in the optimization also the amount of the heat supplied to the system. Heat consumption of ATR process was calculated using equation(2.3) and system heat balance calculation scheme is shown in the Figure 2.7.
dzesATRuziztv QQQQQ −++= , (2.3)
where Q – heat amount needed for the ATR process, kJ;
iztvQ – heat amount, which is required for heating of ethanol and water from the temperature of surrounding environment to the boiling temperature and evaporation, kJ;
uzQ – heat amount, which is needed for overheating of ethanol and water vapor from the boiling temperature to ATR temperature TATR, and heat amount, necessary for heating of air from the temperature of surrounding environment to TATR, kJ;
ATRQ – heat amount, which is extracted or consumed by ATR reactions, therefore can be both negative and positive, kJ; ATRQ
dzesQ – heat amount, which should be extracted during the cooling down of the reaction products to the required temperature, kJ.
Figure 2.7 Ethanol ATR heat balance calculation scheme
One of the most important parameters which characterize operation of the reforming process is efficiency defined as a ratio of obtained energy of hydrogen and total heat energy supplied to the process. Therefore, the following objective function of process efficiency (η) is used for the optimization:
max),/,(
),/,(
52
2
52
2 →+⋅
⋅=
λλ
ηCSTQQOHHCn
QCSTHn
ATROHHCdz
HdzATR
&
&, (2.4)
Figure 2.8 presents the optimum values of process efficiency (secondary y axis) and the corresponding values of TATR (primary y axis) depending on S/C and λ values for the studied range of values. It can be noticed that the optimum values of efficiency at a certain value of S/C increases, if λ value is decreased. The S/C also influence the efficiency, and the
20
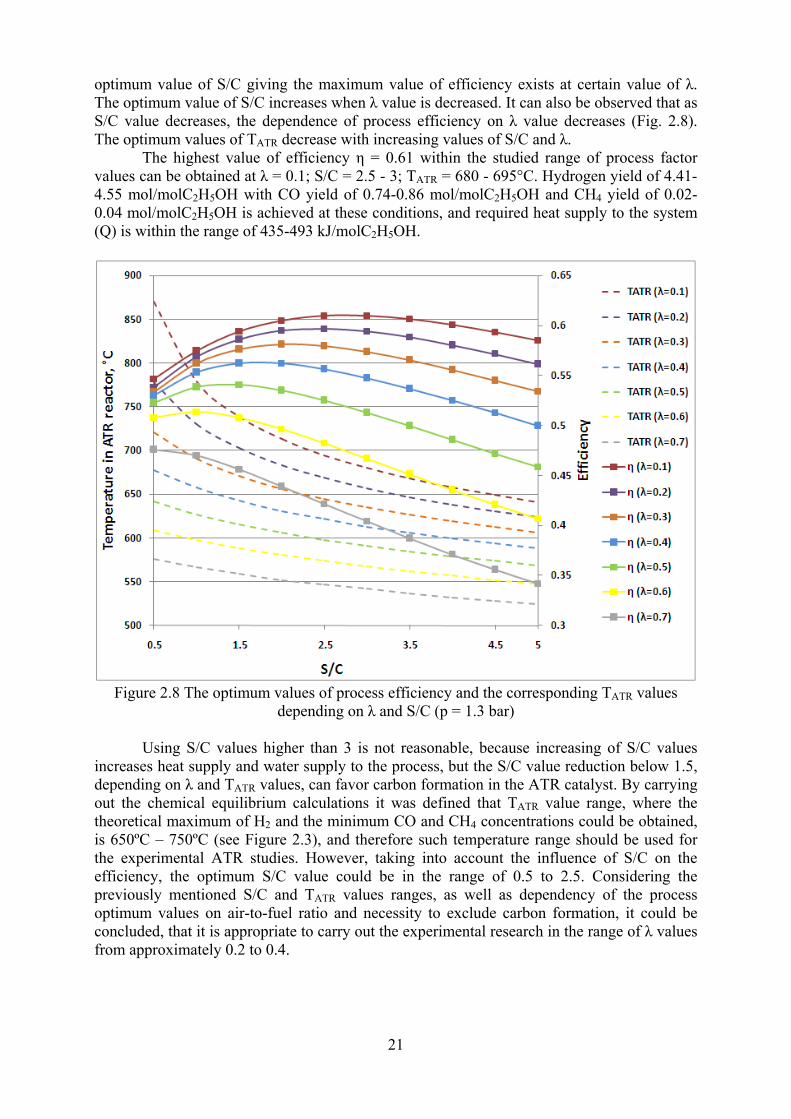
optimum value of S/C giving the maximum value of efficiency exists at certain value of λ. The optimum value of S/C increases when λ value is decreased. It can also be observed that as S/C value decreases, the dependence of process efficiency on λ value decreases (Fig. 2.8). The optimum values of TATR decrease with increasing values of S/C and λ. The highest value of efficiency η = 0.61 within the studied range of process factor values can be obtained at λ = 0.1; S/C = 2.5 - 3; TATR = 680 - 695°C. Hydrogen yield of 4.41-4.55 mol/molC2H5OH with CO yield of 0.74-0.86 mol/molC2H5OH and CH4 yield of 0.02-0.04 mol/molC2H5OH is achieved at these conditions, and required heat supply to the system (Q) is within the range of 435-493 kJ/molC2H5OH.
Figure 2.8 The optimum values of process efficiency and the corresponding TATR values
depending on λ and S/C (p = 1.3 bar)
Using S/C values higher than 3 is not reasonable, because increasing of S/C values increases heat supply and water supply to the process, but the S/C value reduction below 1.5, depending on λ and TATR values, can favor carbon formation in the ATR catalyst. By carrying out the chemical equilibrium calculations it was defined that TATR value range, where the theoretical maximum of H2 and the minimum CO and CH4 concentrations could be obtained, is 650ºC – 750ºC (see Figure 2.3), and therefore such temperature range should be used for the experimental ATR studies. However, taking into account the influence of S/C on the efficiency, the optimum S/C value could be in the range of 0.5 to 2.5. Considering the previously mentioned S/C and TATR values ranges, as well as dependency of the process optimum values on air-to-fuel ratio and necessity to exclude carbon formation, it could be concluded, that it is appropriate to carry out the experimental research in the range of λ values from approximately 0.2 to 0.4.
21
3. Experimental research of ethanol autothermal reforming process, data obtaining and analysis
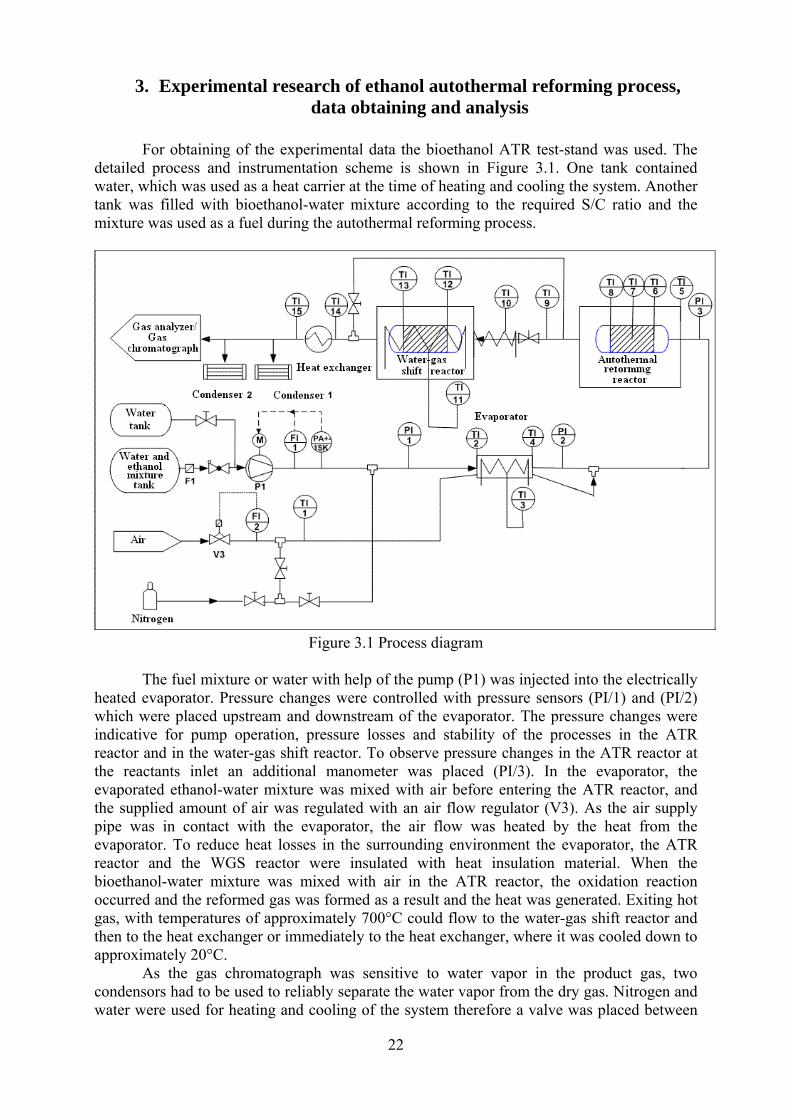
For obtaining of the experimental data the bioethanol ATR test-stand was used. The detailed process and instrumentation scheme is shown in Figure 3.1. One tank contained water, which was used as a heat carrier at the time of heating and cooling the system. Another tank was filled with bioethanol-water mixture according to the required S/C ratio and the mixture was used as a fuel during the autothermal reforming process.
Figure 3.1 Process diagram
The fuel mixture or water with help of the pump (P1) was injected into the electrically heated evaporator. Pressure changes were controlled with pressure sensors (PI/1) and (PI/2) which were placed upstream and downstream of the evaporator. The pressure changes were indicative for pump operation, pressure losses and stability of the processes in the ATR reactor and in the water-gas shift reactor. To observe pressure changes in the ATR reactor at the reactants inlet an additional manometer was placed (PI/3). In the evaporator, the evaporated ethanol-water mixture was mixed with air before entering the ATR reactor, and the supplied amount of air was regulated with an air flow regulator (V3). As the air supply pipe was in contact with the evaporator, the air flow was heated by the heat from the evaporator. To reduce heat losses in the surrounding environment the evaporator, the ATR reactor and the WGS reactor were insulated with heat insulation material. When the bioethanol-water mixture was mixed with air in the ATR reactor, the oxidation reaction occurred and the reformed gas was formed as a result and the heat was generated. Exiting hot gas, with temperatures of approximately 700°C could flow to the water-gas shift reactor and then to the heat exchanger or immediately to the heat exchanger, where it was cooled down to approximately 20°C. As the gas chromatograph was sensitive to water vapor in the product gas, two condensors had to be used to reliably separate the water vapor from the dry gas. Nitrogen and water were used for heating and cooling of the system therefore a valve was placed between
22

23
the water and bioethanol-water mixture tanks. On the fuel inlet downstream of the pump a nitrogen line was connected. Nitrogen was used in the process due to its inert behavior to the processes in the experimental test-stand and also to the materials that were used in the system. Temperature changes were controlled in several places during the experiment and placement of the temperature sensors are shown in Figure 3.1. Results of the experiments The composition of the reformed gas which was obtained experimentally was compared with the gas composition obtained by using a chemical equilibrium calculation model at different S/C and λ values, and results are shown in Table 3.1. Using experimental results, for each S/C value in the range from 0.5 to 2.5 and for each experimental data group, which was obtained during one experimental period (day), the average values of λ and TATRiz were calculated and compared with the values calculated by using a chemical equilibrium calculation model (see Table 2.1).
Table 3.1 Comparison of gas composition values obtained experimentally and with chemical
equilibrium calculation model
S/C=0.5; λ=0.24;
TATRiz=702ºC; p=1.20 bar
S/C=1; λ=0.27; TATRiz=697ºC;
p=1.25 bar
S/C=1.5; λ=0.34;
TATRiz=699ºC; p=1.27 bar
S/C=2; λ=0.29; TATRiz=695ºC;
p=1.26 bar
S/C=2.5; λ=0.30;
TATRiz=700ºC; p=1.15 bar
Exp. Theor. Exp. Theor. Exp. Theor. Exp. Theor. Exp. Theor. H2ATR 36.26 38.59 38.54 39.16 36.42 34.87 37.62 39.34 35.57 39.60 COATR 16.75 17.08 13.08 12.93 8.80 9.08 7.93 8.57 8.39 7.48 CO2ATR 8.01 8.03 10.98 11.03 12.13 13.18 14.39 14.14 13.92 14.95 CH4ATR 0.49 0.78 0.26 0.37 0.32 0.10 0.13 0.10 0.18 0.05 N2ATR 39.35 35.51 38.19 36.52 37.81 42.77 38.63 37.85 42.59 37.93
As can be seen in Table 3.1, the hydrogen concentrations achieved during the experiments were smaller than the values obtained using the chemical equilibrium calculation model for every S/C value except S/C = 1.5. Experimental and theoretical values of COATR and CO2ATR differ less, than it was observed in the case of H2ATR values. The results indicate that the reforming reactions achieve chemical equilibrium or are close to the equilibrium and therefore use of the thermodynamic analysis for the process research is justified. It also shows that use of the experimental data for development of regression equations is reasonable.
4. Experimental data treatment and regression analysis The aim of the chapter is, by using the obtained experimental data, to analyze the impact of independent variables, i.e. factors of ethanol ATR process on the composition of reforming gas and to develop regression equations which describe the functional form of interconnection between H2, CO and CH4 concentrations in the reformed gas and the process factors, and allow to perform analysis of formation of the above mentioned substances. Regression equations were used for optimization to obtain the optimum ethanol ATR process factor values, at which the maximum hydrogen concentration can be achieved.

Development of regression equations In order to consider all the possible factor influences on dependent variables, including also factor interaction effects in the regression analysis, the second order polynomial was used for determination of relations of the experimental data and development of the regression model for all the three dependent variables, ie. H2ATR, COATR and CH4ATR,. In general form, the polynomial can be described by the following equation (4.1) [13]:
, (4.1)
∑∑∑<==
+++=n
jjiij
n
jjjj
n
jjj XXXXY
11
2
10 ββββ
where Y - predicted response of Y estimation; 0β - intercept coefficient; jβ - linear terms; jjβ - squared terms; ijβ - interaction terms; - independent variables. ji XX
Stepwise backward elimination method using full polynomial forms was used in the work for regression model development. Data treatment was made with help of statistical data analysis software „StatgraphicsPlus” [35]. The range of values of H2ATR = f(xi) regression factors is shown in Table 4.1. Summary of regression model coefficients which includes only statistically significant regression parameter estimates for response variable H2ATR, is shown in Table 4.2.
Table 4.1
H2ATR regression factor values range
The process factors Values range S/C 0.5-2.5 λ 0.20-0.34
p, bar 0.13-0.40 TATRie, °C 231-360 TATR, °C 641-782
GHSVATR, h-1 14 830-33 341
Table 4.2 The parameter estimates of the regression of hydrogen concentration (H2ATR) (the model is
fitted with 146 data points; P-values < 0.01 for all terms)
Term Estimate Standard error t-ratio (ttab = 2.61) Constant -72.43 8.18 -8.85
GHSVATR x TATRie -3.92x10⁻⁶ 5.47x10⁻⁷ -7.18 GHSVATR x TATR 1.99x10⁻⁶ 2.34x10⁻⁷ 8.47
λ2 -124.33 13.37 -9.30 λ x S/C 23.85 3.30 7.24
P 22.20 3.84 5.77 p x GHSVATR -8.53x10⁻⁴ 1.46x10⁻⁴ -5.86
S/C2 -1.86 0.26 -7.12 TATRie 0.85 0.06 13.27
24

25
TATRie2 -9.31x10⁻⁴ 7.43x10⁻⁵ -12.53
TATRie x TATR -2.87x10⁻⁴ 2.78x10⁻⁵ -10.32 For testing an adequacy of the developed regression model in description of the experimental data, analysis of variance was made, and the results are shown in ANOVA table (Table 4.3) including several other statistical parameters. Actual F value (Table 4.3) was compared to critical F value at 0.01 significance level. Taking in account that actual F parameter is considerably greater than the critical F value (see Table 4.3), it could be concluded that the developed model adequately describes the experimental data at the 99% confidence level. An adjusted R2 value of 90.7% (see Table 4.3) shows that only 9.3% of response changes are not described with the developed model. Model adequacy to the experimental data was verified also graphically (Figure 4.1), where each experimentally obtained value of H2ATR was visually compared with the value of H2ATR calculated by the model. As it can be seen in Figure 4.1, a sufficiently good conformity between both groups is observed. This means that the developed model could be used for H2ATR concentration calculations and prediction of its changes.
Table 4.3 ANOVA and other diagnostic statistics for H2ATR = f(xi) regression equation
Sum of
squares Degree
of freedom
Mean square
Actual F value
Critical F value (P=0.01)
Adjusted R2, %
DW
Model 358.54 10 35.85 141.89 2.46 90.7 1.44 Residual 34.11 135 0.25
Total 392.65 145 Absence of autocorrelation in the residuals was verified using DW statistic. The value of DW statistics for the model is greater than 1.4 (see Table 4.3), which shows that in the distribution of the residuals no serious autocorrelation is observed. Autocorrelation possibility was verified also graphically (Figure 4.2). Figure 4.2 shows distribution of the residuals versus row number in the data set (the measurement points are placed in chronological order), and it can be observed that it could comply with normal distribution as well as no autocorrelation and heteroscedasticity is observed. From plotting the model residuals versus predicted hydrogen concentration values (Figure 4.3) it was concluded that no heteroscedasticity is observed. Heteroscedasticity was not observed by plotting model residuals versus factors included in the regression model either.
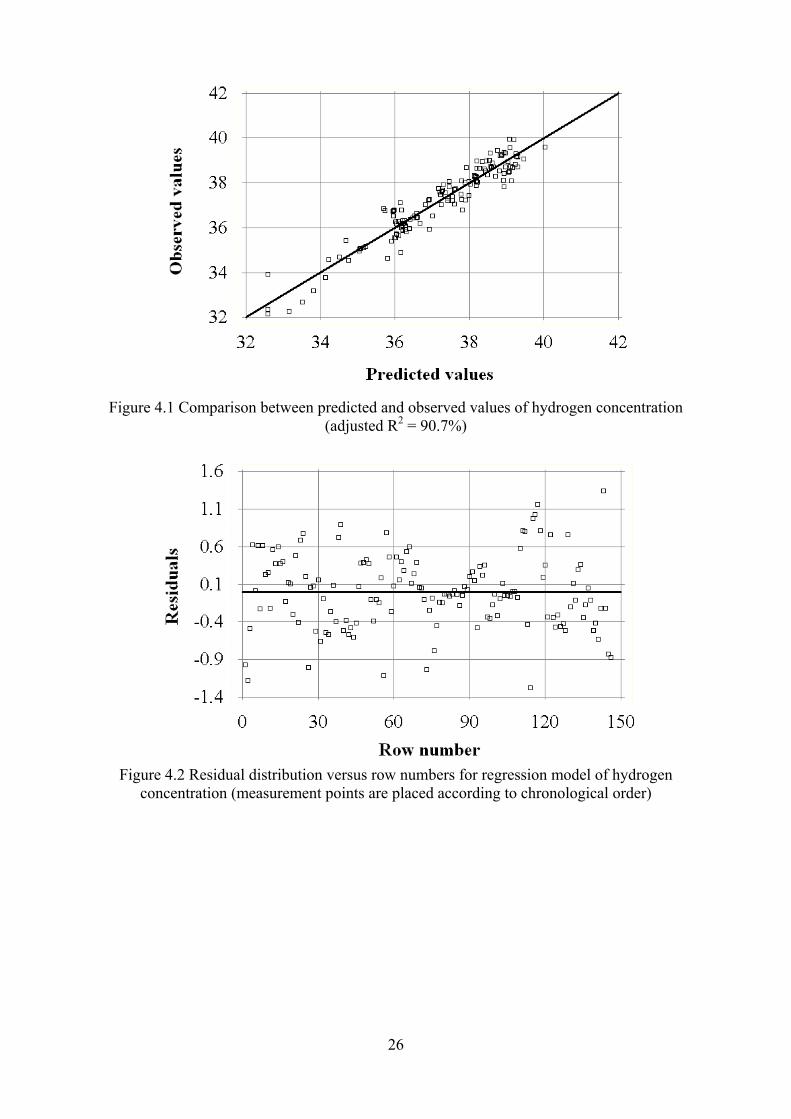
Figure 4.1 Comparison between predicted and observed values of hydrogen concentration
(adjusted R2 = 90.7%)
Figure 4.2 Residual distribution versus row numbers for regression model of hydrogen
concentration (measurement points are placed according to chronological order)
26

Figure 4.3 Residual distribution versus regression model values for the regression model of
hydrogen concentration
The range of COATR = f(xi) regression factor values is shown in Table 4.4. Summary of regression model coefficients which includes only statistically significant regression parameter estimates for response variable COATR, is shown in Table 4.5.
Table 4.4 COATR regression factor values range
The process factors Values range
S/C 0.5-2.5 λ 0.24-0.34
p, bar 0.13-0.40 TATRie, °C 253-360 TATR, °C 706-782
GHSVATR, h-1 14 830-33 341
Table 4.5 The parameter estimates of the regression of carbon monoxide concentration (COATR) (the
model is fitted with 144 data points; P-values < 0.01 for all terms)
Term Estimate Standard error t-ratio (ttab = 2.62) Constant 158.85 10.15 15.65
GHSVATR2 -1.36x10⁻⁸ 2.80x10⁻⁹ -4.85
GHSVATR x TATRie 1.47x10⁻⁶ 3.84x10⁻⁷ 3.82 GHSVATR x TATR -2.63x10⁻⁶ 3.11x10⁻⁷ -8.43
λ -779.62 69.77 -11.17 λ x GHSVATR 0.009 6.47x10⁻⁴ 13.67
λ x S/C 19.90 7.32 2.72 λ x TATRie 0.30 0.07 4.19 λ x TATR 0.65 0.07 9.58
p -260.96 30.52 -8.55 p x GHSVATR 0.001 1.55x10⁻⁴ 9.43
27

p x TATR 0.27 0.04 6.62 S/C -11.94 1.72 -6.93 S/C2 2.13 0.26 8.10
S/C x p 15.76 1.46 10.80 S/C x GHSVATR -3.58x10⁻⁴ 3.22x10⁻⁵ -11.15
TATRie2 7.05x10⁻⁴ 6.37x10⁻⁵ 11.06
TATRie x TATR 6.74x10⁻⁴ 5.44x10⁻⁵ -12.39 Model adequacy was verified using the actual F value, and considering that the actual F value is considerably greater than the critical F value it could be concluded that the developed model is adequate and describes experimental data at 90% confidence level (see Table 4.6). An adjusted R2 value of 99.1% shows (see Table 4.6) that less than 1% of response changes is not described with the developed model. Model adequacy to experimental data was verified also graphically (Figure 4.4), where sufficiently good conformity between both groups is observed. This means that the developed model could be used for COATR concentration calculations as well as for prediction of its changes.
Table 4.6 ANOVA and other diagnostic statistics for COATR = f(xi) regression equation
Sum of
squares Degree
of freedom
Mean square
Actual F value
Critical F value
(P=0.01)
Adjusted R2, %
DW
Model 1045.39 17 61.49 942.35 2.11 99.1 1.68 Residual 8.22 126 0.07
Total 1053.61 143
Figure 4.4 Comparison between the predicted and observed values of carbon monoxide
concentration (adjusted R2 = 99.1%)
The range of CH4ATR = f(xi) regression factor values is shown in Table 4.7. Summary of the regression model coefficients which includes only statistically significant regression parameter estimates for response variable CH4ATR, is shown in Table 4.8.
28

29
Table 4.7 CH4ATR regression factor values range
The process factors Values range
S/C 0.5-2.5 λ 0.20-0.32
p, bar 0.13-0.40 TATRie, °C 231-360 TATR, °C 641-782
GHSVATR, h-1 14 830-33 341
Table 4.8 The parameter estimates of the regression of methane concentration (CH4ATR) (the model is
fitted with 135 data points; P-values < 0.01 for all terms)
Term Estimate Standard error t-ratio (ttab = 2.62) Constant 29.33 2.88 10.18
GHSVATR2 -1.74x10⁻⁹ 3.00x10⁻¹⁰ -5.80
λ 69.29 12.50 5.55 λ x GHSVATR 3.75x10⁻⁴ 5.21x10⁻⁵ 7.21 λ x TATR -0.10 0.02 -6.00
p -34.70 5.67 -6.12 p x GHSVATR 1.08x10⁻⁴ 2.29x10⁻⁵ 4.70
p x TATR 0.04 0.007 5.48 S/C -3.56 0.76 -4.66 S/C2 0.17 0.03 6.43
S/C x p 1.40 0.23 6.07 S/C x GHSVATR -2.82x10⁻⁵ 4.00x10⁻⁶ -7.03
S/C x TATR 0.004 9.40x10⁻⁴ 4.63 TATRie -0.15 0.01 -10.05 TATRie
2 7.81x10⁻⁵ 7.27x10⁻⁶ 10.74 TATRie x TATR 1.36x10⁻⁴ 2.01x10⁻⁵ 6.77
TATR -0.03 0.004 -6.96 The actual F value (Table 4.9) was compared with the critical F value at 0.01 significance level, and since the actual F value is larger than the critical F value, it could be concluded that the obtained model adequately describes the experimental data at 99% confidence level (see Table 4.9). An adjusted R2 value of 92.5% shows (see Table 4.9) that less than 8% of response changes are not described with the developed model. Model adequacy to experimental data was verified also graphically (Figure 4.5), where sufficient good conformity between both groups is observed. This means that the developed model could be used for CH4ATR concentration calculations as well as for prediction of its changes.
Table 4.9 ANOVA and other diagnostic statistics for CH4ATR = f(xi) regression equation
Sum of
squares Degree
of freedom
Mean square
Actual F value
Critical F value
(P=0.01)
Adjusted R2, %
DW
Model 2.09 16 0.13 104.69 2.16 92.5 1.44 Residual 0.15 118 0.001
Total 2.24 134
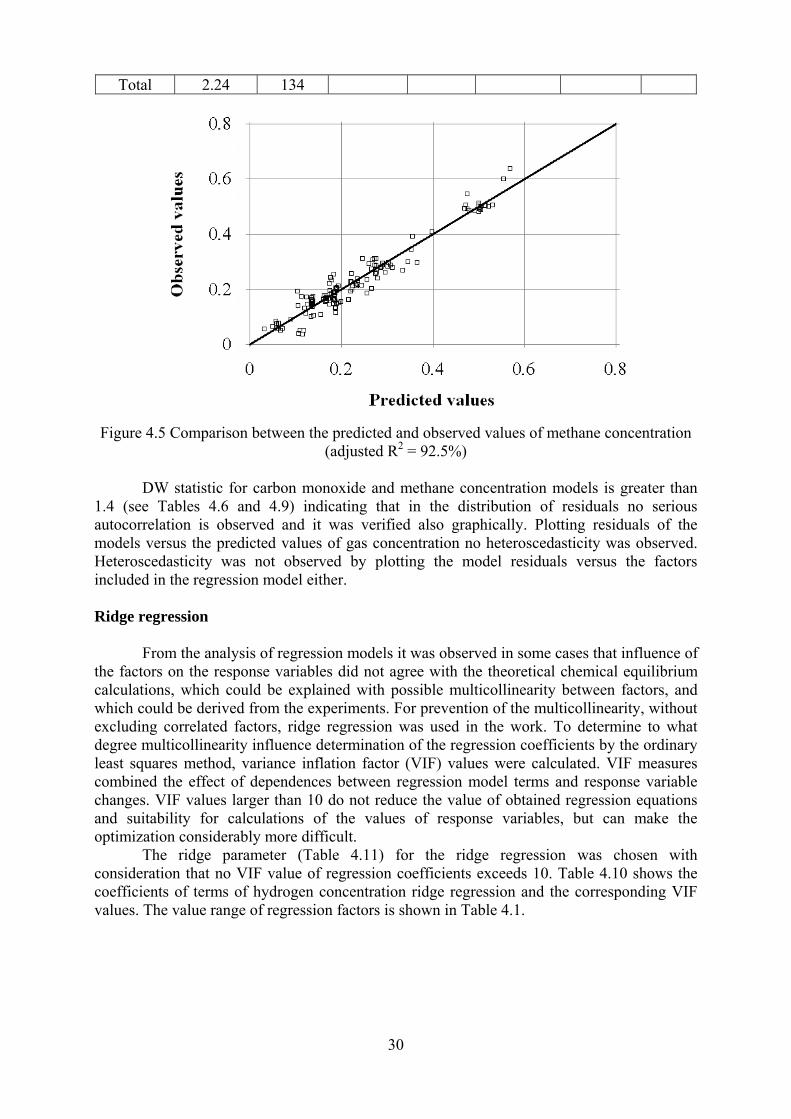
Figure 4.5 Comparison between the predicted and observed values of methane concentration
(adjusted R2 = 92.5%) DW statistic for carbon monoxide and methane concentration models is greater than 1.4 (see Tables 4.6 and 4.9) indicating that in the distribution of residuals no serious autocorrelation is observed and it was verified also graphically. Plotting residuals of the models versus the predicted values of gas concentration no heteroscedasticity was observed. Heteroscedasticity was not observed by plotting the model residuals versus the factors included in the regression model either. Ridge regression From the analysis of regression models it was observed in some cases that influence of the factors on the response variables did not agree with the theoretical chemical equilibrium calculations, which could be explained with possible multicollinearity between factors, and which could be derived from the experiments. For prevention of the multicollinearity, without excluding correlated factors, ridge regression was used in the work. To determine to what degree multicollinearity influence determination of the regression coefficients by the ordinary least squares method, variance inflation factor (VIF) values were calculated. VIF measures combined the effect of dependences between regression model terms and response variable changes. VIF values larger than 10 do not reduce the value of obtained regression equations and suitability for calculations of the values of response variables, but can make the optimization considerably more difficult. The ridge parameter (Table 4.11) for the ridge regression was chosen with consideration that no VIF value of regression coefficients exceeds 10. Table 4.10 shows the coefficients of terms of hydrogen concentration ridge regression and the corresponding VIF values. The value range of regression factors is shown in Table 4.1.
30

31
Table 4.10 The parameter estimates of the ridge regression of hydrogen concentration (H2ATR) (the model
is fitted with 146 data points)
Term
Estimate
VIF
Constant 36.32 GHSVATR x TATRie 2.80x10⁻⁷ 5.4 GHSVATR x TATR 1.13x10⁻⁷ 3.1
λ2 -58.74 2.9 λ x S/C 6.09 5.8
P 15.09 5.0 p x GHSVATR -2.51x10⁻⁴ 9.4
S/C2 -0.18 4.6 TATRie 0.02 2.2 TATRie
2 -4.92x10⁻⁵ 4.7 TATRie x TATR -2.00x10⁻⁵ 9.3
When comparing the coefficients of terms of the ridge regression (see Table 4.10) and initial regression equation (see Table 4.2), it could be concluded that the influence of each factor on the response value does not affect the values of other factors in the ridge regression as it was observed in the initial regression equation (see Table 4.2.). Verifying how the variation of the factors influence the variation of the response values it was found that the character of the influence is in accordance with the theoretical calculations. An adjusted R2 value of 69.7% (see Table 4.11) shows that approximately 30% of the response changes are not described with the developed model. Model adequacy to experimental data was verified also graphically (Figure 4.6), and observed conformity between both groups is sufficiently good for the developed model to be used for H2ATR concentration calculations and prediction of its changes. Ridge regression reduces R2 value, because an error, which is the ridge parameter, is implemented intentionally but it is made to reduce the influence of multicollinearity on accuracy of determination of the coefficient values of the factors, and that is more important in order to obtain the regression equation suitable for the optimization.
Table 4.11 Summary of statistical parameters for H2ATR = f(xi) ridge regression equation
Ridge parameter Mean
absolute errorStandard
deviation of residuals
Adjusted R2, %
DW
Model 0.016 0.65 0.86 69.7 0.79

Figure 4.6 Comparison between the observed values of hydrogen concentration and the values
predicted with the ridge regression (adjusted R2 = 69.7%) In the same way, by using the ridge regression analysis, the regression model which determines the relation between hydrogen yield H2’ATR (2.2) as the response variable and the following factors: GHSVATR, λ, S/C, p, TATR, TATRie was obtained. The values of hydrogen yield for each experimental result were estimated by using atomic balance calculations. Table 4.12 shows the coefficients of terms and the corresponding VIF values for the hydrogen yield ridge regression. The range of regression factor values is shown in Table 4.1.
Table 4.12 The parameter estimates of the ridge regression of hydrogen yield (H2ATR) (the model is fitted
with 146 data points)
Term
Estimate
VIF
Constant 3.06 GHSVATR 1.39x10⁻¹⁰ 2.3 GHSVATR
2 -7.23x10⁻¹¹ 3.5 GHSVATR x TATR -1.14x10⁻¹⁰ 2.1
λ 1.66 3.1 λ2 -8.84 3.7
λ x S/C -0.79 6.0 λ x TATR 7.33x10⁻⁴ 1.3
p 0.87 4.5 p2 -0.70 6.9
p x TATRie 0.004 6.8 p x GHSVATR -1.91x10⁻⁶ 5.8
S/C2 -0.02 4.5 TATRie
2 -6.03x10⁻⁶ 1.6 TATRie x TATR -1.38x10⁻⁶ 1.4
32
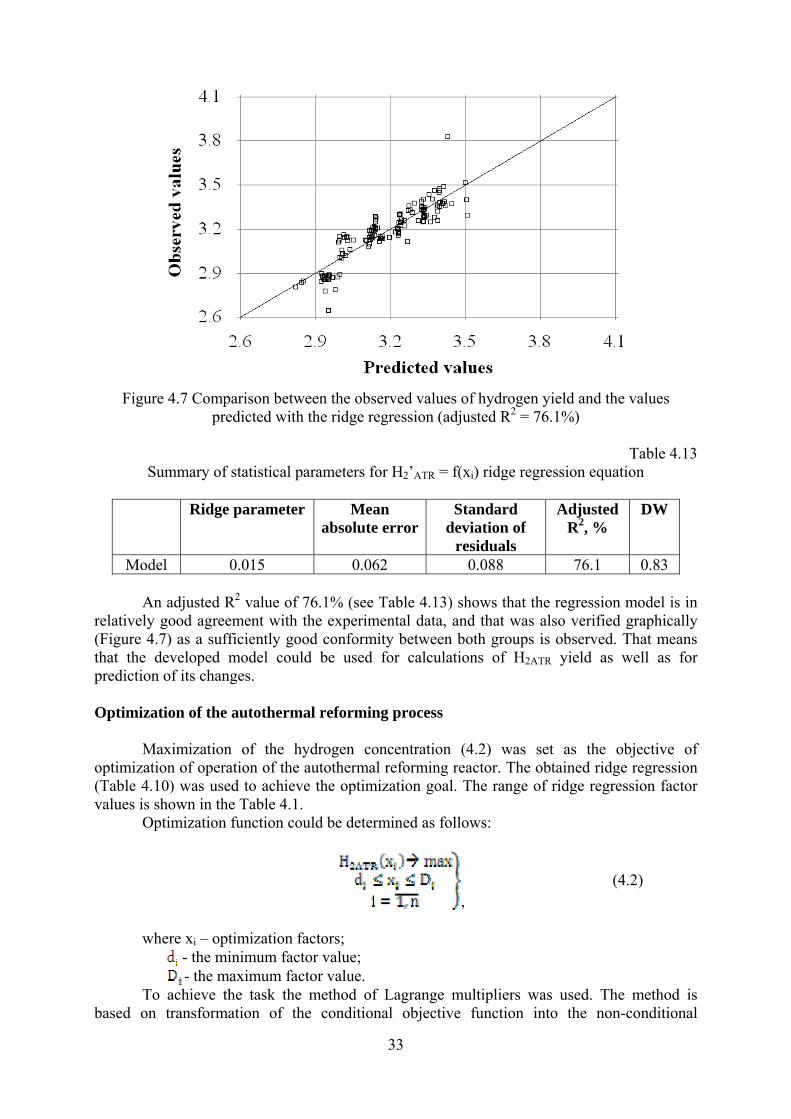
Figure 4.7 Comparison between the observed values of hydrogen yield and the values
predicted with the ridge regression (adjusted R2 = 76.1%)
Table 4.13 Summary of statistical parameters for H2’ATR = f(xi) ridge regression equation
Ridge parameter Mean
absolute errorStandard
deviation of residuals
Adjusted R2, %
DW
Model 0.015 0.062 0.088 76.1 0.83 An adjusted R2 value of 76.1% (see Table 4.13) shows that the regression model is in relatively good agreement with the experimental data, and that was also verified graphically (Figure 4.7) as a sufficiently good conformity between both groups is observed. That means that the developed model could be used for calculations of H2ATR yield as well as for prediction of its changes. Optimization of the autothermal reforming process Maximization of the hydrogen concentration (4.2) was set as the objective of optimization of operation of the autothermal reforming reactor. The obtained ridge regression (Table 4.10) was used to achieve the optimization goal. The range of ridge regression factor values is shown in the Table 4.1. Optimization function could be determined as follows:
, (4.2)
where xi – optimization factors; - the minimum factor value; - the maximum factor value. To achieve the task the method of Lagrange multipliers was used. The method is based on transformation of the conditional objective function into the non-conditional
33
objective function. Optimization calculations were made using the „MS Excel Solver” tool which was fully suitable for the solution of this task. The optimum bioethanol ATR process factors providing the maximum hydrogen concentration within the studied range of the factor values was the outcome of the optimization. A comparison of the obtained optimum factor values with values which are obtained from the chemical equilibrium calculations is shown in Table 4.14. By using the values of S/C, λ and p, obtained in the optimization as input values in the chemical equilibrium calculations, the value of TATR providing the maximum hydrogen concentration was determined (Table 4.14). The maximum hydrogen concentration value of 42% and the maximum hydrogen yield value of 3.8 mol/mol C2H5OH were achieved at S/C = 2.5; λ = 0.20; p = 0.4 bar, TATRie = 231°C, TATR = 641°C, GHSVATR = 33341 h-1. The maximum hydrogen concentration is achieved at the minimum λ value within the studied range of λ factor values, which is expected from the results of chemical equilibrium calculations (see Table 2.6). Increase of S/C value promotes hydrogen concentration increase according to chemical equilibrium calculations (see Tables 2.5 and 2.6) and therefore it is experimentally confirmed that the obtained optimum value of S/C is equal to the maximum value of S/C in the studied S/C value range. The optimum p value, which is the highest p value in the studied range of p factor values, is in contradiction with the results of chemical equilibrium calculations which indicated that it is necessary to keep the pressure values as low as possible to achieve the maximum hydrogen concentrations. The reason for such a discrepancy could be interrelation between values of p and S/C because larger values of p during the experiments corresponded to larger S/C values and greater S/C values resulted in increase of the hydrogen concentration. From analysis of the optimization it can be concluded that the minimum TATRie value, the minimum TATR and the maximum p value correspond to the optimum factor values within the studied range of factor values. The optimum TATR value corresponds to the smallest reactor temperature value in the studied value range which is in agreement with the results of other studies [30, 10] as well as with the chemical equilibrium calculations (see Table 2.6). Correspondence of the optimum TATRie value to the minimum inlet temperature value in the studied range is based on the fact that the minimum TATRie value complies with the minimum TATR value. The values of hydrogen concentration obtained from the chemical equilibrium calculations are larger than the values achieved experimentally at the optimum conditions (Table 4.14), which was expected.
Table 4.14 The comparison of the theoretically and experimentally determined optimums
Source H2’ATR
mol/mol C2H5OH
H2ATR, %
thη , %
The optimum values of bioethanol ATR process factors
S/C λ p TATRie TATR GHSVATROptimization
using the ridge regression
models
3.8 42.24 74 2.5 0.20 0.4 231 641 33341
Chemical equilibrium calculations
with maximization of hydrogen
concentration
3.98 48.33 77 2.5 0.20 0.4 - 684* -
34
35
* - temperature in the ATR reactor under isothermal conditions. From the experimentally obtained value of efficiency, which was calculated as a ratio of the acquired heat amount of hydrogen to the heat amount of supplied ethanol, and is equal to 74% it can be concluded that this value is close to the theoretically determined value of efficiency (see Table 4.14).
Conclusions 1. Using the developed model of ethanol ATR thermodynamic analysis, the following
essential impact of ethanol ATR process factors on the composition of the reformed gas and on the amount of heat needed for the process was determined:
• an increase of S/C factor values at constant TATR, λ and p values, leads to increase of H2 and decrease of CO and CH4 concentrations in reaction products. The amount of heat required for the ethanol ATR process grows with increasing of S/C value.
• an increase of λ factor value at constant S/C, TATR and p values causes decrease of H2, CO and CH4 concentrations in reaction products, and decrease of the heat amount needed for ethanol ATR process.
• with increasing value of pressure, concentration of hydrogen and methane decreases, but that of carbon monoxide - increases. To prevent influence of pressure on the composition of reaction products of ethanol ATR process high values of S/C and λ should be used. An increase of S/C or λ values decreases the upper value of TATR which marks the region where influence of pressure on the composition of reaction products is observed.
• increment of TATR at constant S/C, p and λ values leads to the initial increase of H2 concentration which starts to decrease after reaching the maximum value. The CO concentration increases with increasing TATR values. CH4 concentration values are near the maximum at low TATR and decrease with increasing TATR values. The amount of heat required for the ethanol ATR process grows with increasing TATR values.
2. It is derived from chemical equilibrium calculations that carbon formation is promoted by decrease of λ, S/C and TATR values. To avoid carbon formation, S/C value should be increased if the value of TATR is reduced at the fixed λ value. To avoid carbon formation in the ethanol ATR reactor at S/C values smaller than one, TATR values above 600ºC and λ values above 0.3 should be used. When values of S/C are larger than one and values of TATR are larger than 500ºC values of λ should be at least 0.2.
3. The theoretical maximum hydrogen yield value of 4.87 mol/molC2H5OH was obtained at S/C = 5, λ = 0.1, TATR = 650°C.
4. The theoretically obtained maximum efficiency value equal to 0.61 could be achieved at S/C = 2.5 – 3, TATR = 685 – 690ºC, λ = 0.1. At such conditions yields of H2 = 4.41 – 4.55 mol/molC2H5OH, CO = 0.74 – 0.86 mol/molC2H5OH, CH4 = 0.02 – 0.04 mol/molC2H5OH could be achieved. The maximum theoretical efficiency increases with decreasing λ value at constant S/C value. The optimum value of TATR, providing the maximum efficiency, decreases with increasing S/C and λ values.
5. By using the results of experimental research of the bioethanol ATR system, regression models which show the relations between H2, CO and CH4 concentrations and the most essential ATR process factors were obtained. Analysis of the regression models showed that theoretically determined nature of interactions between the response and independent variables are confirmed also experimentally. The obtained regression

36
equations for concentrations of hydrogen, carbon monoxide and methane can be used for calculation of the response variable values within the studied range of factor values.
6. The regression equations were used for defining the optimum factor values at which the maximum hydrogen concentration and yield can be obtained, and the maximum values are 42% and 3.8 mol/molC2H5OH respectively. The optimum factor values are as follows: S/C = 2.5; λ = 0.20; p = 0.4 bar, TATRie = 231°C; TATR = 641°C; GHSVATR = 33341 h-1. The experimentally acquired optimum points are in good agreement with the result derived from the theoretical analysis.

37
References
1. Ahmed S., Krumpelt M. Hydrogen from hydrocarbon fuels for fuel cells// International Journal of Hydrogen Energy. - 2001. - Nr.26. - 291.-301. p.
2. Aicher T., Full J., Schaadt A. A portable fuel cell processor for hydrogen production from ethanol in a 250 Wel fuel cell system// International Journal of Hydrogen Energy. - 2009. - Nr.34. - 8006.-8015. p..
3. Berg C., Licht F.O. World Fuel Ethanol Analysis and Outlook. 2003 / Internets. - http://www.meti.go.jp/report/downloadfiles/g30819b40j.pdf.
4. Cacciola G., Antonucci V., Freni S. Technology up do date and new strategies on fuel cells// Journal of Power Sources. - 2001. - Nr.100. - 67.-79. p.
5. Das S.K., Reis A., Berry K.J. Experimental evaluation of CO poisoning on the performance of a high temperature proton Exchange membrane fuel cell// Journal of Power Sources. - 2009. - Nr.193. - 691.-698. p.
6. Du G., Yang Y., Qiu W., Lim S., Pfefferle L., Haller G.L. Statistical design and modeling of the process of methane partial oxidation using V-MCM-41 catalysts and the prediction of the formaldehyde production// Applied Catalysis A: General. - 2006. - Nr.313. - 1.–13. p.
7. Ersoz A., Olgun H., Ozdogan S., Gungor C., Akgun F., Tiris M. Autothermal refprming as a hydrocarbon fuel processing option for PEM fuel cell// Journal of Power Sources. - 2003. - Nr.118. - 384.-392. p.
8. Ferreira-Aparicio P., Benito M.J. New Trends in Reforming Technologies: from Hydrogen Industrial Plants to Multifuel Microreformers// Catalysis Reviews. - 2005. - Nr.47. - 491.-588. p.
9. Fraunhofera Saules Enerģijas Sistēmu institūts / Internets. - http://www.ise.fhg.de/ 10. Hagh B.F. Stoichiometric analysis of autothermal fuel processing// Journal of Power
Sources. - 2004. - Nr.130. - 85.-94. p. 11. Hübner P.. Reformierung von Kohlewasserstoffen zur Wasserstofferzeugung für
Brennstoffzellen. - Diploma paper: Vācija, Fraunhofer ISE, 2003. 12. Istadi, Amin N.A.S. Optimization of process parameters and catalyst compositions in
carbon dioxide oxidative coupling of methane over CaO–MnO/CeO2 catalyst using response surface methodology// Fuel Processing Technology. - 2006. - Nr.87. - 449.–459. p.
13. Istadi. Catalytic conversion ofmethane and carbon dioxide in conventional fixed bed and dielectric barrier discharge plazma reactors. - Doctoral thesis: Malāzija, Universiti Teknologi Malaysia, 2006. - 314 p.
14. Joensen F., Rostrup-Nielsen J.R. Conversion of hydrocarbons and alcohols for fuel cells// Journal of Power Sources. – 2002. – Nr.105. – 195.-201. p.
15. Krumpelt M., Krause T.R., Carter J.D., Kopasz J.P., Ahmed S. Fuel processing for fuel cell systems in transportation and portable power applications// Catalysis Today. - 2002. - Nr.77. - 3.-16. p.
16. Kurzweil P. Brennstoffzellen-technik: Grundlagen, Komponenten, Systeme, Anwendungen. - Wiesbaden: Friedr.Vieweg&Sohn Verlag/GWV Fachverlage GmbH, 2003. - 236 p.
17. Ķīmiskā līdzsvara aprēķinu programma / Internets. - http://www.chemstations.net/, Chemstations, Inc., Houston, TX, USA
18. Larentis A.L., de Resende N.S., Salim V.M.M., Pinto J.C., Modeling and optimization of the combined carbon dioxide reforming and partial oxidation of natural gas// Applied Catalysis A: General. - 2001. - Nr.215. - 211.–224. p.
19. Larminie J., Dicks A. Fuel Cell Systems Explained. - West Sussex: John Wiley & Sons Ltd., 2000. - 164 p.
38
20. Markova D., Bažbauers G. Bio-ethanol powered microreformer for PEM-fuel cell with up to 300 W output capacity// Scientific proceedings of Riga Technical University, Energy and Electrical Engineering. - 2006. Nr.17. - 144.-149. p.
21. Melamu R., von Blottniz H. A comparison of environmental benefits of transport and electricity applications of carbonhydrate derived ethanol and hydrogen// International Journal of Hydrogen Energy. - 2009. Nr.32. - 1126.-1134. p.
22. Montgomery D.C., Peck E.A., Vining G.G. Introduction to Linear Regression Analysis. 4th edition. - Wiley Interscience, 2006. - 640 p.
23. Myers R.H., Montgomery D.C. Response surface methodology: process and product optimization using designed experiments. 2nd edition. - Wiley Interscience, 2002. - 793 p.
24. Naidja A., Krishna C.R., Butcher T., Mahajan D. Cool flame partial oxidation and its role in combustion and reforming of fuels for fuel cell systems// Progress in Energy and Combustion Science. – 2003. – Nr.29. – 155.-191. p.
25. Nilsson M., Karatzas X., Lindström B., Petterson L.J. Assessing the adaptability of varying supply of an autothermal reformer// Chemical Engineering Journal. - 2008. - Nr.142. - 309.-17. p.
26. Osipovs L. Ķīmijas tehnoloģijas pamatprocesi un aparāti. - Izdevniecība „Zvaigzne”, Rīga, 1991. -680 lpp.
27. Önsan E. Catalytic Processes for Clean Hydrogen Production from Hydrocarbons// Turkish Journal of Chemistry. 2007. - Nr.31. - 531.-550. p.
28. Pearlman J.B., Bhargav A., Shields E.B., Jackson G.S., Hearn P.L. Modeling efficiency and water balance in PEM fuel cell systems with liquid fuel processing and hydrogen membranes// Journal of Power Sources. - 2008. - Nr.185. - 1056.-1065. p.
29. Qi A., Peppley B., Karan K. Integrated fuel procesors for fuel cell application: A review// Fuel Processing Technology. - 2007. - Nr.88. - 3.-22. p.
30. Rabenstein G., Hacker V. Hydrogen for fuel cells from ethanol by steam-reforming, partial-oxidation and combined auto-thermal reforming: A thermodynamic analysis// Journal of Power Sources. - 2008. - Nr.185. - 1293.-1304. p.
31. Rioche C., Kulkami S., Meunier F.C., Breen J.P., Burch R. Steam reforming of model compounds and fast pyrolysis of bio-oil on supported noble metal catalysts// Applied catalysis B: Environmental. - 2005. - Nr.61. - 130.-139. p.
32. Semelsberger T.A., Brown L.F., Borup R.L., Inbody M.A. Equilibrium products from autothermal processes for generating hydrogen-rich fuel-cell feeds// International Journal of Hydrogen Energy. - 2004. - Nr.29. - 1047.-1064. p.
33. Siegel C. Untersuchung eines Katalysatorssystem auf die Reformiereigenschaften von flüssigen Kohlewasserstoffen mittels Autothermer Reformierung. Diplomdarbs: Vācija, Fraunhofer ISE, 2000. – 73 s.
34. Song C. Fuel processing for low-temperature and high-temperature fuel cells. Challenges, and opportunities fro sustainable development in the 21st century// Catalysis Today. - 2002. - Nr.77. - 17.-49. p.
35. Statgraphics Plus programma. Copyright ® 1994-1996 by Statistical Graphics Corp. 36. Weisser H.-M. Untersuchung eines Mikro-Dampfreformers mit integrierter Shift-
Reaktion und Methanisierung. - Diplomdarbs: Vācija, Fraunhofer ISE, 2006. - 79 s. 37. Wueffen C. Construction and research of the autothermal micro-reformer. - Diploma
paper: Vācija, Fraunhofer ISE, 2006. – 78 p. 38. Xuan J., Leung K.H., Leung D.Y.C., Ni M. A review of biomass-derived fuel procesors
for fuel cell systems// Renewable and Sustainable Energy Reviews. - 2009. - Nr.13. - 1301-1313. p.


![ARTIFICIAL INTELLIGENCE [INTELLIGENT AGENTS PARADIGM] Professor Janis Grundspenkis Riga Technical University Faculty of Computer Science and Information](https://img.pdfslide.us/doc/110x75/56649c755503460f9492916d/artificial-intelligence-intelligent-agents-paradigm-professor-janis-grundspenkis.jpg)