Embed Size (px)
Citation preview

Ricky HarperDirector of Operations PlanningSI Corporation
Creative APO Solutions Power SI Corporation’s Supply Chain Planning

Contents
SI Corporation Overview Operations Planning Project WIN Planning with APO Summary

SI Corporation Overview

SI Corporation
SI Corporation manufactures and markets predominantly polypropylene based woven and needlepunch nonwoven products for a wide variety of uses in many diverse markets.
We are a $400 million privately owned company that started in 1967.
Our Corporate Offices are located in Chattanooga TN.

SI Corporation
The SI supply network consist of: 4 manufacturing plants in Chattanooga/North GA 1 manufacturing plant in Idaho 8 Distribution Centers in North Georgia 14 Regional warehouses throughout the U.S.
SI Corporation
The company is organized into four separate business units: Flooring Systems Group Concrete Systems Group Geosolutions Group
Performance Technology Group

SI Corporation 800 Stock (Core) Products and 3500 Make to
Order (NonCore) 1100 work centers and 80 capacity centers Per standard R3 logic, we have hundreds of
thousands of routers SI actually has 27 routers and 2 versions of object
dependencies
A unique use of variant configuration and rate table logic provides master data simplification and manageability.
This enables SI to take advantage of PP/DS and link shop floor activity to operating plans.

Operations Planning

Supply Chain Control
Three years ago, SI Corporation began implementing supply chain management practices that previously did not exist. Corporate KPI reports were built to replace
business unit propaganda Monthly collaborative demand planning process
was implemented Monthly supply planning process was
implemented Inventory management was given to Operations
Planning SKU rationalization began; complimented by
core/non-core focus (MTS/MTO). Monthly S&OP process was implemented

NonWoven Light Weightperiod 1 2 3 4 5 6 7 8 9 10 11 12 TOTALprod wks 3.6 2.7 2.4 3.6 3.0 3.0 3.6 2.9 3.0 3.6 3.0 2.9 37.1BI 5500.0SALES 3300 2391 1743 2156 2463 3672 4405 3690 4123 4389 4307 4034 40673PRODUCTION 3700 2811 2510 3700 3108 3108 3700 2960 3108 3700 3108 2960 38474INVENTORY (month end) 5900 6319 7087 8630 9276 8712 8007 7277 6262 5574 4374 3300"SLOB" OFF QLTY/DISC. 885 948 1063 1295 1391 1307 1201 1092 939 836 656 495TOTAL TARGET 6785 7267 8150 9925 10667 10018 9207 8369 7202 6410 5031 3795
price/unit 0.25 0.25 0.25 0.25 0.25 0.25 0.25 0.25 0.25 0.25 0.25 0.25TOTAL INVENTORY $ 1091.2 1168.7 1310.7 1596.2 1715.5 1611.2 1480.8 1345.9 1158.2 1030.9 809.0 610.4
Sales, Production, Inventory
The SPI format is: Simple and easy to understand Reflects complete demand and supply outlook Useful for short and long term planning, at
material or group level Grounds users with fact

Sales, Production, Inventory
The SPI format is: Simple and easy to understand Reflects complete demand and supply outlook Useful for short and long term planning, at
material or group level Grounds users with fact

Finished Goods Inventory
$0
$10,000
$20,000
$30,000
$40,000
$50,000
$60,000
$70,000
$80,000
Oct
'00
Nov
Dec
Jan'
01 Feb
Mar
Apr
May Jun
Jul
Aug Sep
Oct
'01
Nov
Dec
Jan'
02 Feb
Mar
Apr
May Jun
Jul
Aug Sep
Misc
PTG
CSG
FSG
GSG

Inventory Turns
2000 2001 2002
FSG 4.3 9.3 11.3CSG 2.2 3.2 3.9GSG 1.8 3.2 4.7PTG 3.1 5.0 6.0SI 2.8 4.9 7.0
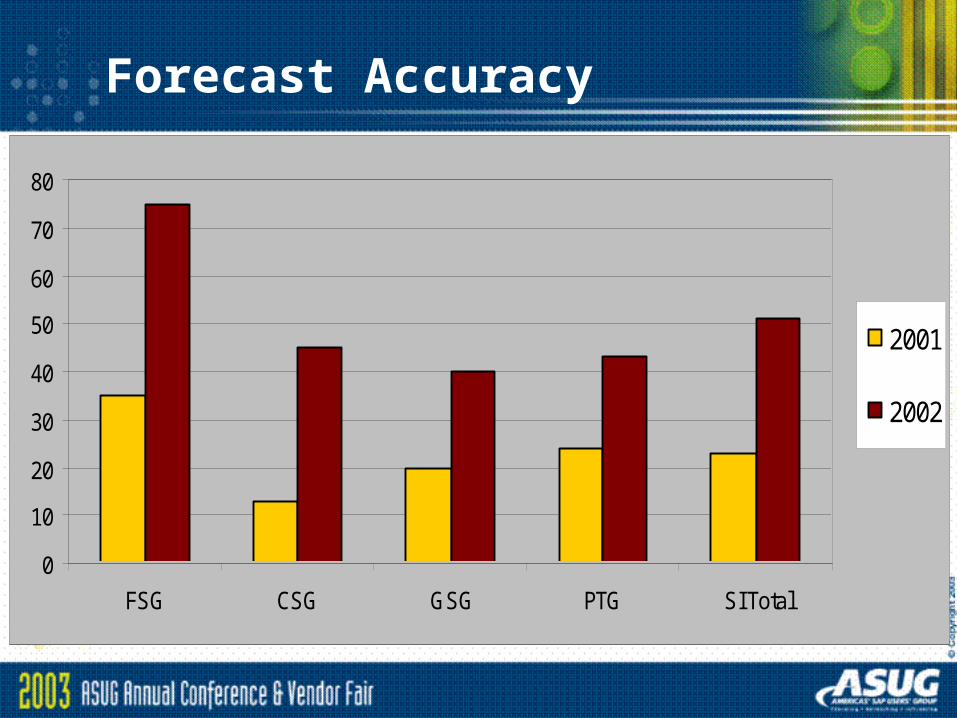
Forecast Accuracy
0
10
20
30
40
50
60
70
80
FSG CSG GSG PTG SI Total
2001
2002

Order Fulfillment
SI Perfect Order
72.00%74.00%76.00%78.00%80.00%82.00%84.00%86.00%88.00%90.00%92.00%
2001 2002 2003
SI
SI Perfect Order
72.00%74.00%76.00%78.00%80.00%82.00%84.00%86.00%88.00%90.00%92.00%
2001 2002 2003
SI
Project WIN

Project WIN
WORKING TO IMPROVE AND INTEGRATEProject WIN is a Business Process Improvement Effort,
designed to contribute to the future success of our company by:
Empowering employees with leading-edge tools & technology (SAP); thereby, providing enterprise-wide visibility through on-line access to real-time information.
Improving company-wide performance by removing barriers, creating & deploying sound business practices.
Strengthening our relationship with customers, vendors, & all other business partners.
This effort along with teamwork, accountability & openness will create an environment where we can all Play to WIN.

A Cause for Change
By 2000, SI Corporation’s growth had reached a plateau and was at risk of decline. Profits were shrinking. It was becoming clear that the same old formula was no longer working: SKUs had proliferated to 27,000 Inventory levels were at an all time high: $86
million/2.8 turns Order fulfillment at lowest levels: company
average ~ 79%, some businesses as low as 74% Despite cheap raw materials many finished
materials had single digit margins. Inventory accuracy was horrible.

WHY?
Business units focused only on revenue, not profitable revenue.
Manufacturing focused only on departmental volume.
Company blindly running toward annual business plan.
FISH warehouse management No marketing presence Nobody managing product lines. Innovation for
the sake of innovation. Manufacturing capacity “owned” by business
units. No Planning!

ERP Process Drivers
Significant Inventory Management Improvements Decrease Investment in Finished Goods Inventories Improve inventory accuracy
Improved Operations Planning Demand Planning Supply Network Planning Production Planning/Detailed Scheduling Capacity Planning

Project WIN
Phase I key focus was on sales and distribution, finance and accounting support. FICO Purchasing Order Entry Warehouse Management BW Reporting
Delivered 10 months, on-time and under budget
Project WIN
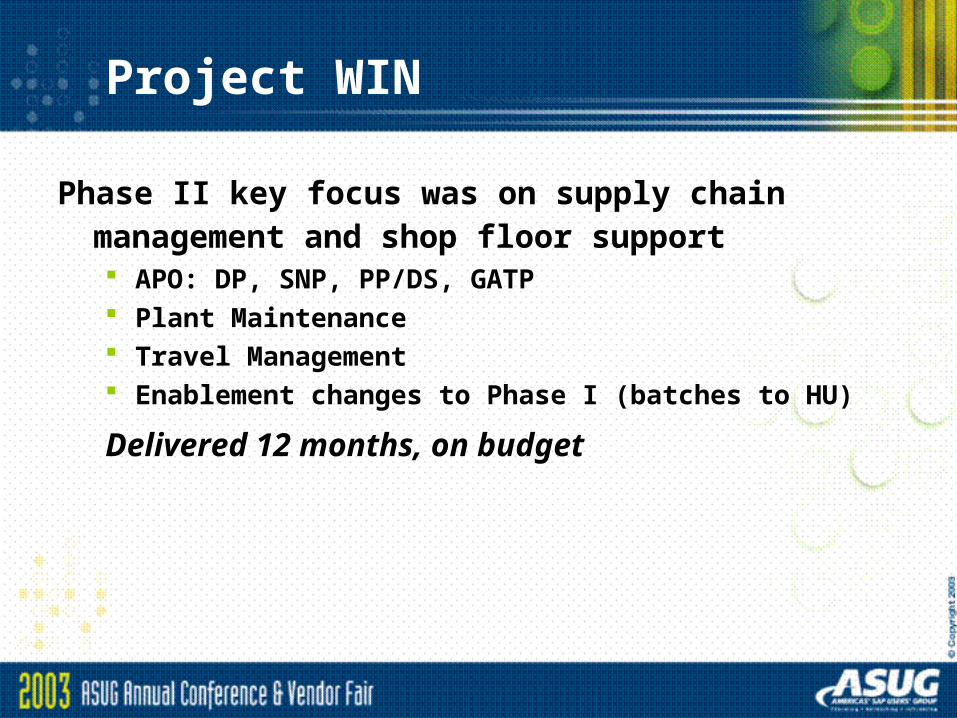
Phase II key focus was on supply chain management and shop floor support APO: DP, SNP, PP/DS, GATP Plant Maintenance Travel Management Enablement changes to Phase I (batches to HU)
Delivered 12 months, on budget

Planning with APO

Demand Planning
Monthly collaborative forecast
One stop shopping Business Plan
Sales history in units and $$
Projected revenue macros
Core material forecast by sku, NonCore by group
Demand and Supply adjustment key figures
Causal groupings by business unit

Demand Planning

Demand Planning

Supply Network Planning
Short to long term planningCapacity Planning via quasi BOMCapacity check that considers all PP/DS
requirementsCapacity check includes machines
available vs requiredCapacity center logic enables hierarchies
and cell manufacturingProduct view for detailsSPI data view for rollupTime dependent target days supplyLong term raw material planning

Supply Network Planning

Supply Network Planning

PP/DS
Directly links shop floor schedule to operating plan via production orders
Enables traceability
Enables manufacturing performance reporting; schedule attainment and first pass quality
Works with resource priority logic, which builds platform for optimization

PP/DS
Boards with 400+ alternate resources Planning boards easily customized to
meet plant specific needsSales order driven requirements visible
from forecast driven requirements Handles multiple orders on single
resource

PP/DS

PP/DS

Summary

Challenges
Change management – getting users to embrace new processes and/or tools
Gathering and cleansing master data Elevating company’s supply chain
management acumen Elevating Planners acumen to leverage APO
capabilities

Lessons Learned
Make sure you start with good, clean master data and centralize its management.
Get a CIF plumber and a backup.Fully understand the integration between
R3 and APO.Operational readiness - Make sure your
users are ready and capable.Educate and train…then do it some more.Safeguard information overload.APO is a planning tool, not a reporting
tool.

Lessons Learned
Do not assume that consultants or programmers understand anything about operations planning or supply chain management.
Make sure your system will support APO.Pry, ask questions and press for answers.Make sure you and your stakeholders
understand your supply chain opportunities.
Do your homework and benchmark other related company solutions…..use ASUG.
Your company must be dedicated to change and prepared to manage it.

Session Code: 4809
Thank you for attending!Please remember to complete and return your evaluation form following this session.