Embed Size (px)
Citation preview
Richmond Public Schools Department of Curriculum and Instruction
Curriculum Pacing and Resource Guide
Course Title/ Course #: Math 7/Course #1570
Start day: 1
Meetings: 180 days
Course Description In this course, students will investigate mathematical ideas within the context of realistic problems, as opposed to looking only at numbers. Some
problems involve real-world applications or unusual situations, while others are purely mathematical. A problem’s context provides a vehicle for
understanding and remembering the mathematical concepts. In the middle grades, the focus of mathematics learning is to:
• build on students’ concrete reasoning experiences developed in the elementary grades;
• construct a more advanced understanding of mathematics through active learning experiences;
• develop deep mathematical understandings required for success in abstract learning experiences; and
• apply mathematics as a tool in solving practical problems.
Students will focus on the following strands:
Number and Number Sense
Measurement
Geometry
Probability and Statistics
Patterns, Functions, and Algebra
Pacing ~ Resources ~ Assessments
MP1
See formative assessment
ideas located at the bottom
of this document
Time
Frame
(days)
Standards
of
Learning
Units/
Topics/
Concepts
Resources Assessments
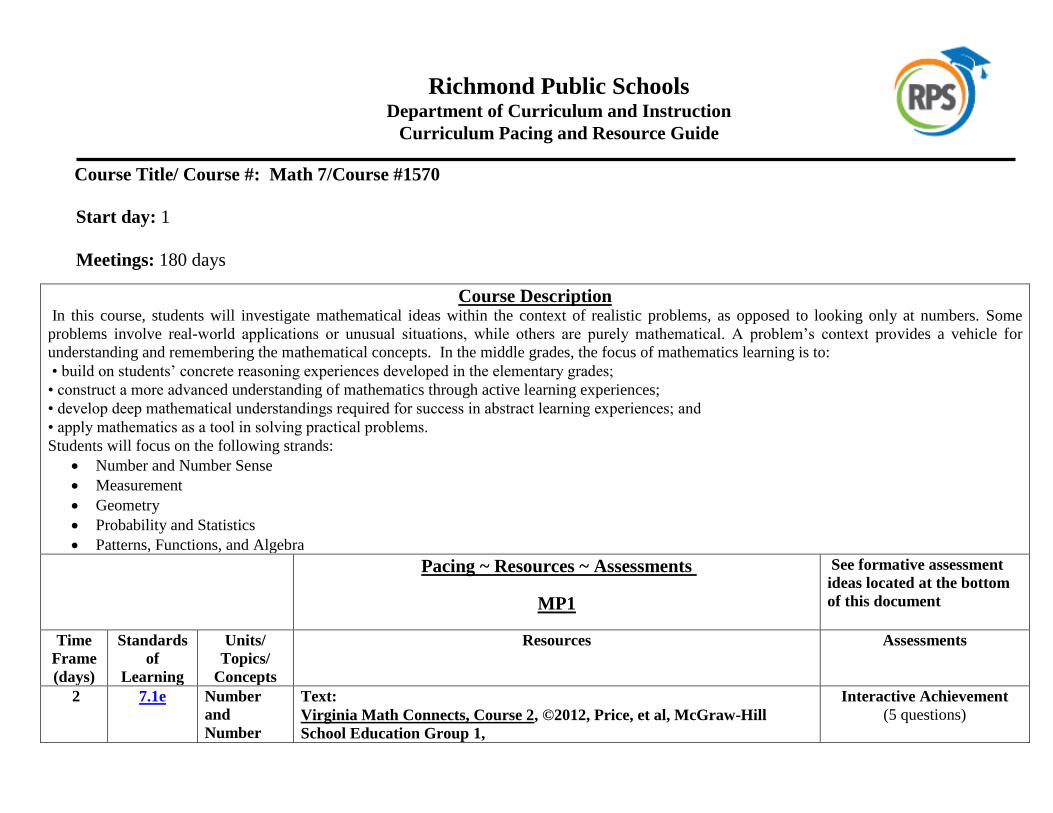
2 7.1e Number
and
Number
Text:
Virginia Math Connects, Course 2, ©2012, Price, et al, McGraw-Hill
School Education Group 1,
Interactive Achievement
(5 questions)
Sense
Absolute
Value
Absolute Value - page(s) 76 – 80; 771
Virginia SOL Coach, New Gold Edition, Mathematics, Grade 7
Absolute Value, page(s) 37 - 42
Mulligan Math in Minutes
7.1e
Interactive Reading and Note taking
SOL - 7.1e
Technology:
BrainPop –
Absolute Value
Virginia Department of Education Lesson Plan(s):
Absolute Value SOL 7.1e
Other Sites:
Lesson Plans and Student Activities:
PBS Learning – Absolute Value
Interactive Skill Practice and Interactive Instructional Resource:
Khan Academy –Absolute Value
Mulligan Check Point
Comprehension questions
SOL Released Items Exit
Tickets Venn Diagrams
Graphic Organizers Plickers
Kahoot.it
12 7.3 Computatio
n and
Estimation
Integer
Operations
and
Order of
Operations
Text:
Virginia Math Connects, Course 2, ©2012, Price, et al, McGraw-Hill
School Education Group 1
Integer Operations: page(s) 86 – 113;
Virginia SOL Coach, New Gold Edition, Mathematics, Grade 7
Add and Subtract Integers, page(s) 54 – 59
Multiply and Divide Integers, page(s) 60 – 65
Order of Operations, page(s) 66 – 70
Interactive Reading and Note taking
SOL 7.3
Technology:
Interactive Achievement
(15 -20 questions)
Gizmo Assessment
BrainPop Assessment
Mulligan Check Point
Comprehension questions
SOL Released Items Exit
Tickets Venn Diagrams
Graphic Organizers Plickers
Kahoot.it
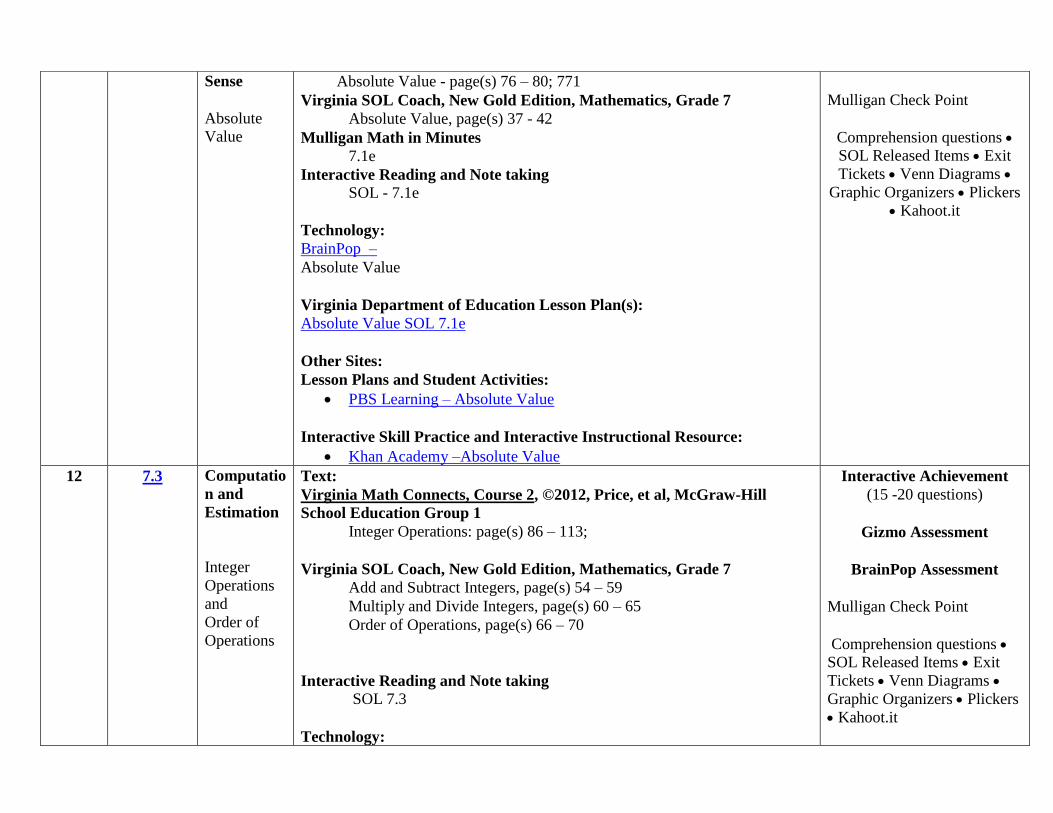
Gizmo Lessons
7.3a -Adding and Subtracting Integers
7.3a - Adding and Subtracting Integers with Chips
7.3b – Or+der of Operations
BrainPop
Adding and Subtracting Integers
Order of Operations
Virginia Department of Education Lesson Plan(s):
Adding and Subtracting Integers
Multiplying and Dividing Integers
Other Sites:
Lesson Plans and Activities:
Integers and Order of Operations
Integer Operations
Integer Operations
Integer Football
Order of Operations
Integer Operations
Teacher Led Instructional Videos:
Subtracting Integers using Counters
Khan Academy Videos:
Subtracting Negative Numbers
Order of Operation
Multiplying and Dividing Integers
Interactive Skills Practice and Interactive Instructional Resource:
Adding Integers on a Number Line
Adding and Subtracting Integers on a number line
Integer
Order of Operation
Integers Mixed Operation
Order of Operations with Integers
Order of Operations
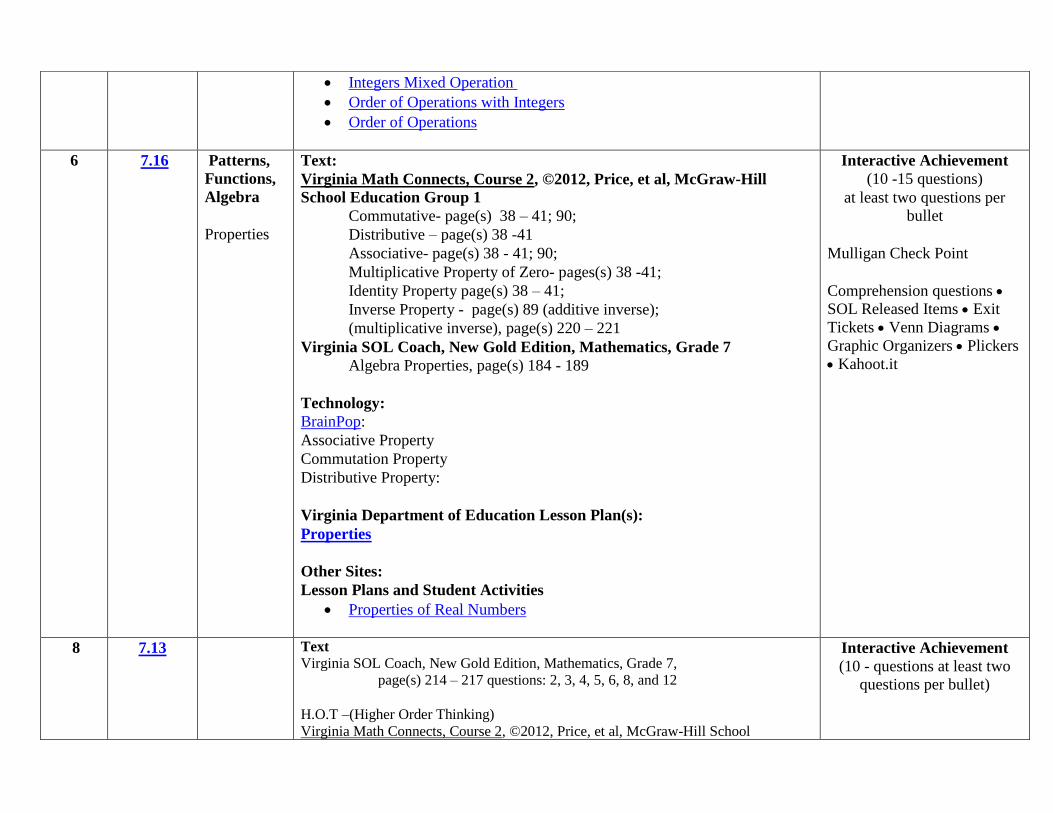
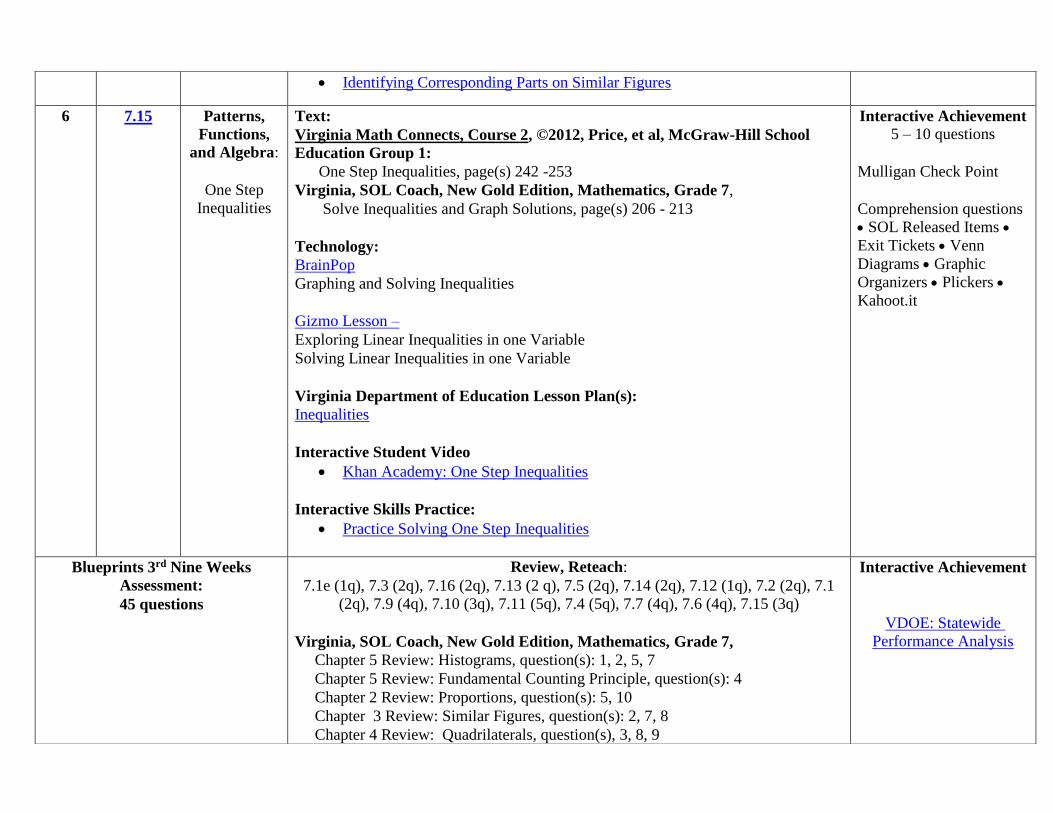
6 7.16 Patterns,
Functions,
Algebra
Properties
Text:
Virginia Math Connects, Course 2, ©2012, Price, et al, McGraw-Hill
School Education Group 1
Commutative- page(s) 38 – 41; 90;
Distributive – page(s) 38 -41
Associative- page(s) 38 - 41; 90;
Multiplicative Property of Zero- pages(s) 38 -41;
Identity Property page(s) 38 – 41;
Inverse Property - page(s) 89 (additive inverse);
(multiplicative inverse), page(s) 220 – 221
Virginia SOL Coach, New Gold Edition, Mathematics, Grade 7
Algebra Properties, page(s) 184 - 189
Technology:
BrainPop:
Associative Property
Commutation Property
Distributive Property:
Virginia Department of Education Lesson Plan(s):
Properties
Other Sites:
Lesson Plans and Student Activities
Properties of Real Numbers
Interactive Achievement
(10 -15 questions)
at least two questions per
bullet
Mulligan Check Point
Comprehension questions
SOL Released Items Exit
Tickets Venn Diagrams
Graphic Organizers Plickers
Kahoot.it
8 7.13 Text
Virginia SOL Coach, New Gold Edition, Mathematics, Grade 7,
page(s) 214 – 217 questions: 2, 3, 4, 5, 6, 8, and 12
H.O.T –(Higher Order Thinking)
Virginia Math Connects, Course 2, ©2012, Price, et al, McGraw-Hill School
Interactive Achievement
(10 - questions at least two
questions per bullet)
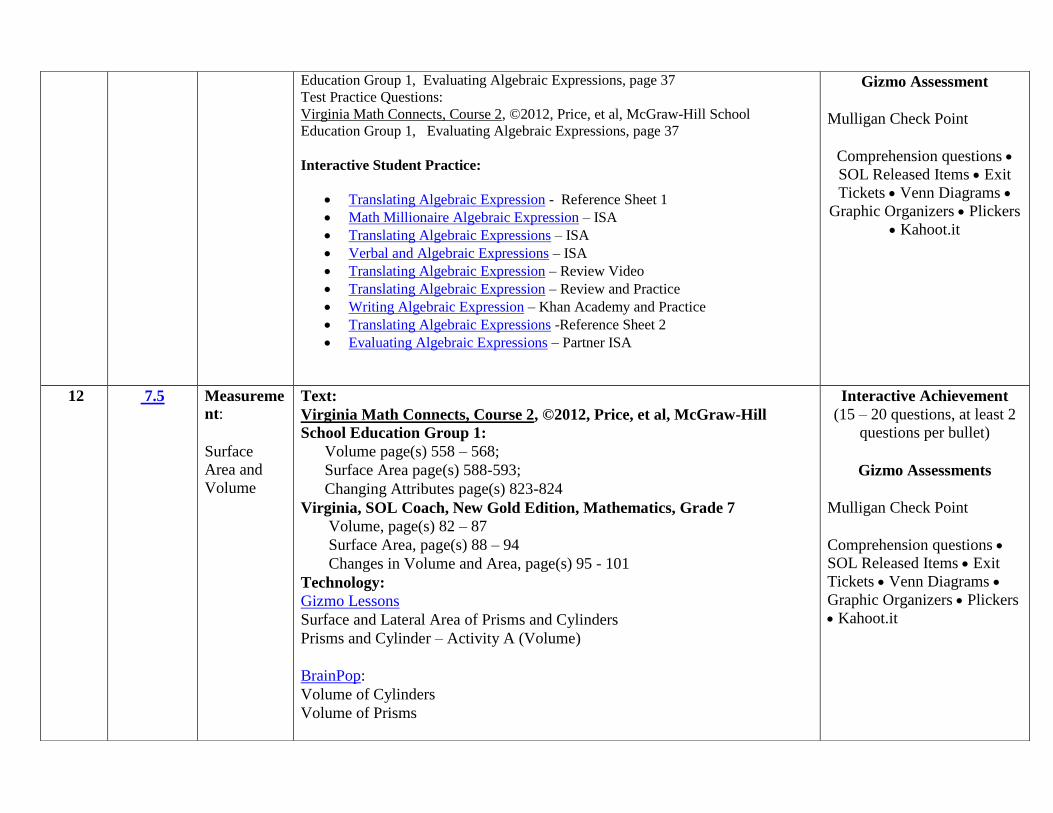
Education Group 1, Evaluating Algebraic Expressions, page 37
Test Practice Questions:
Virginia Math Connects, Course 2, ©2012, Price, et al, McGraw-Hill School
Education Group 1, Evaluating Algebraic Expressions, page 37
Interactive Student Practice:
Translating Algebraic Expression - Reference Sheet 1
Math Millionaire Algebraic Expression – ISA
Translating Algebraic Expressions – ISA
Verbal and Algebraic Expressions – ISA
Translating Algebraic Expression – Review Video
Translating Algebraic Expression – Review and Practice
Writing Algebraic Expression – Khan Academy and Practice
Translating Algebraic Expressions -Reference Sheet 2
Evaluating Algebraic Expressions – Partner ISA
Gizmo Assessment
Mulligan Check Point
Comprehension questions
SOL Released Items Exit
Tickets Venn Diagrams
Graphic Organizers Plickers
Kahoot.it
12 7.5 Measureme
nt:
Surface
Area and
Volume
Text:
Virginia Math Connects, Course 2, ©2012, Price, et al, McGraw-Hill
School Education Group 1:
Volume page(s) 558 – 568;
Surface Area page(s) 588-593;
Changing Attributes page(s) 823-824
Virginia, SOL Coach, New Gold Edition, Mathematics, Grade 7
Volume, page(s) 82 – 87
Surface Area, page(s) 88 – 94
Changes in Volume and Area, page(s) 95 - 101
Technology:
Gizmo Lessons
Surface and Lateral Area of Prisms and Cylinders
Prisms and Cylinder – Activity A (Volume)
BrainPop:
Volume of Cylinders
Volume of Prisms
Interactive Achievement
(15 – 20 questions, at least 2
questions per bullet)
Gizmo Assessments
Mulligan Check Point
Comprehension questions
SOL Released Items Exit
Tickets Venn Diagrams
Graphic Organizers Plickers
Kahoot.it
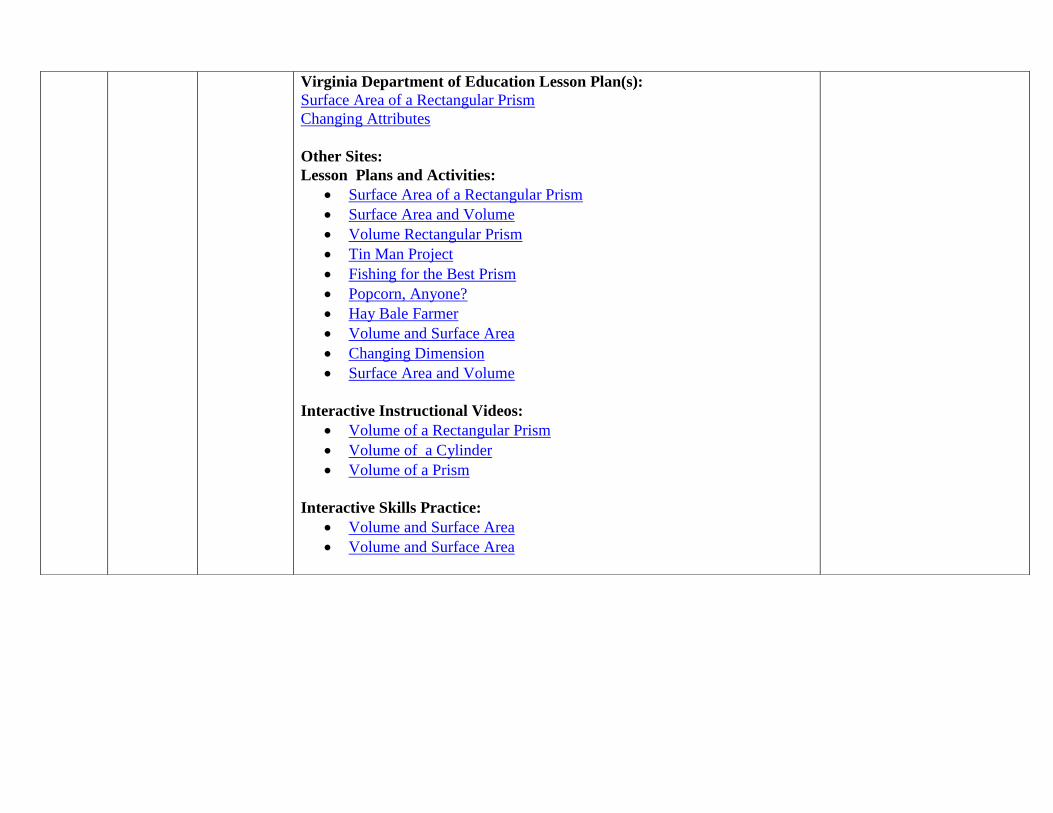
Virginia Department of Education Lesson Plan(s):
Surface Area of a Rectangular Prism
Changing Attributes
Other Sites:
Lesson Plans and Activities:
Surface Area of a Rectangular Prism
Surface Area and Volume
Volume Rectangular Prism
Tin Man Project
Fishing for the Best Prism
Popcorn, Anyone?
Hay Bale Farmer
Volume and Surface Area
Changing Dimension
Surface Area and Volume
Interactive Instructional Videos:
Volume of a Rectangular Prism
Volume of a Cylinder
Volume of a Prism
Interactive Skills Practice:
Volume and Surface Area
Volume and Surface Area
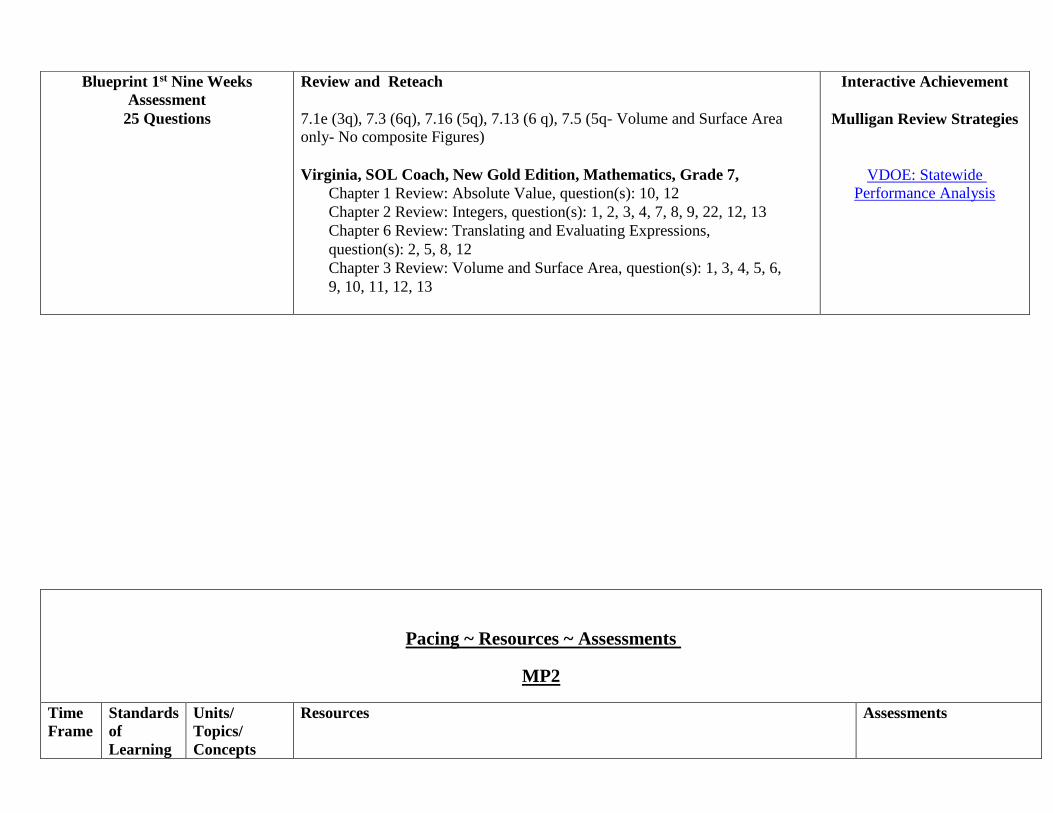
Blueprint 1st Nine Weeks
Assessment
25 Questions
Review and Reteach
7.1e (3q), 7.3 (6q), 7.16 (5q), 7.13 (6 q), 7.5 (5q- Volume and Surface Area
only- No composite Figures)
Virginia, SOL Coach, New Gold Edition, Mathematics, Grade 7,
Chapter 1 Review: Absolute Value, question(s): 10, 12
Chapter 2 Review: Integers, question(s): 1, 2, 3, 4, 7, 8, 9, 22, 12, 13
Chapter 6 Review: Translating and Evaluating Expressions,
question(s): 2, 5, 8, 12
Chapter 3 Review: Volume and Surface Area, question(s): 1, 3, 4, 5, 6,
9, 10, 11, 12, 13
Interactive Achievement
Mulligan Review Strategies
VDOE: Statewide
Performance Analysis
Pacing ~ Resources ~ Assessments
MP2
Time
Frame
Standards
of
Learning
Units/
Topics/
Concepts
Resources Assessments
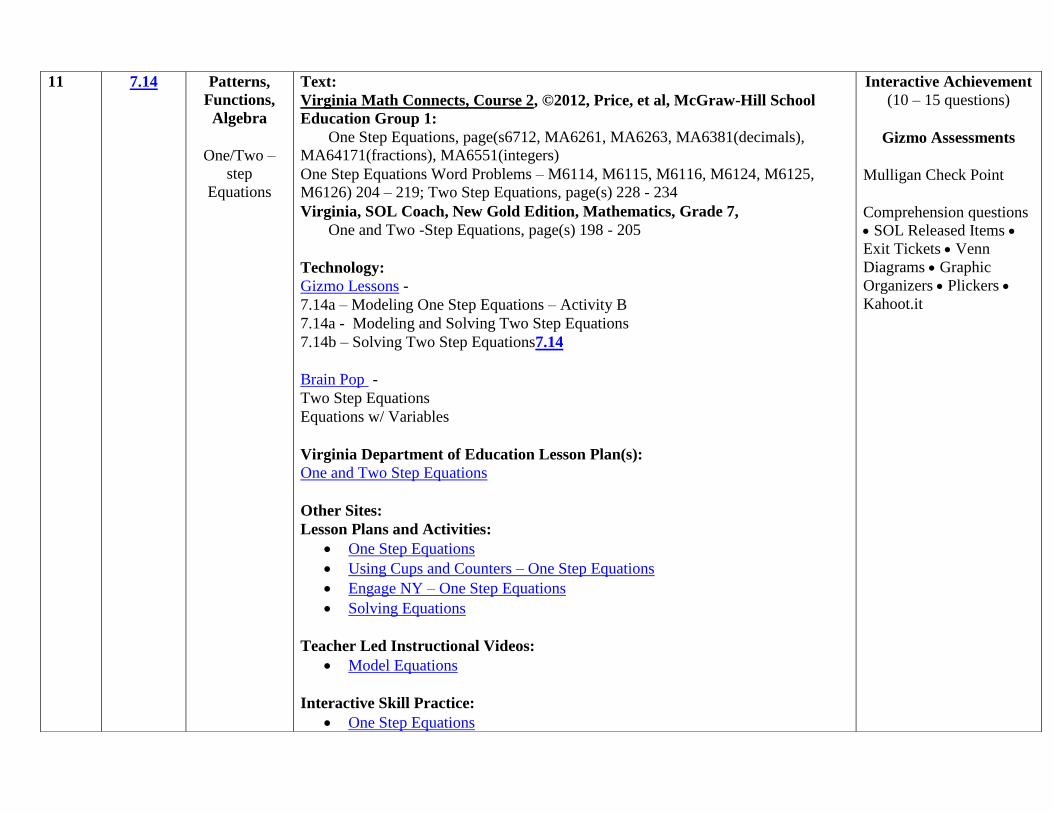
11 7.14 Patterns,
Functions,
Algebra
One/Two –
step
Equations
Text:
Virginia Math Connects, Course 2, ©2012, Price, et al, McGraw-Hill School
Education Group 1:
One Step Equations, page(s6712, MA6261, MA6263, MA6381(decimals),
MA64171(fractions), MA6551(integers)
One Step Equations Word Problems – M6114, M6115, M6116, M6124, M6125,
M6126) 204 – 219; Two Step Equations, page(s) 228 - 234
Virginia, SOL Coach, New Gold Edition, Mathematics, Grade 7,
One and Two -Step Equations, page(s) 198 - 205
Technology:
Gizmo Lessons -
7.14a – Modeling One Step Equations – Activity B
7.14a - Modeling and Solving Two Step Equations
7.14b – Solving Two Step Equations7.14
Brain Pop -
Two Step Equations
Equations w/ Variables
Virginia Department of Education Lesson Plan(s):
One and Two Step Equations
Other Sites:
Lesson Plans and Activities:
One Step Equations
Using Cups and Counters – One Step Equations
Engage NY – One Step Equations
Solving Equations
Teacher Led Instructional Videos:
Model Equations
Interactive Skill Practice:
One Step Equations
Interactive Achievement
(10 – 15 questions)
Gizmo Assessments
Mulligan Check Point
Comprehension questions
SOL Released Items
Exit Tickets Venn
Diagrams Graphic
Organizers Plickers
Kahoot.it
Two Step Equations
Soccer Math – One Step Equations
One Step Equation Ping Pong
One Step Equations Review and Practice
Hoop Shoot Two Step Equations
Interactive Student Video(s):
One Step Equations – Khan Academy Video
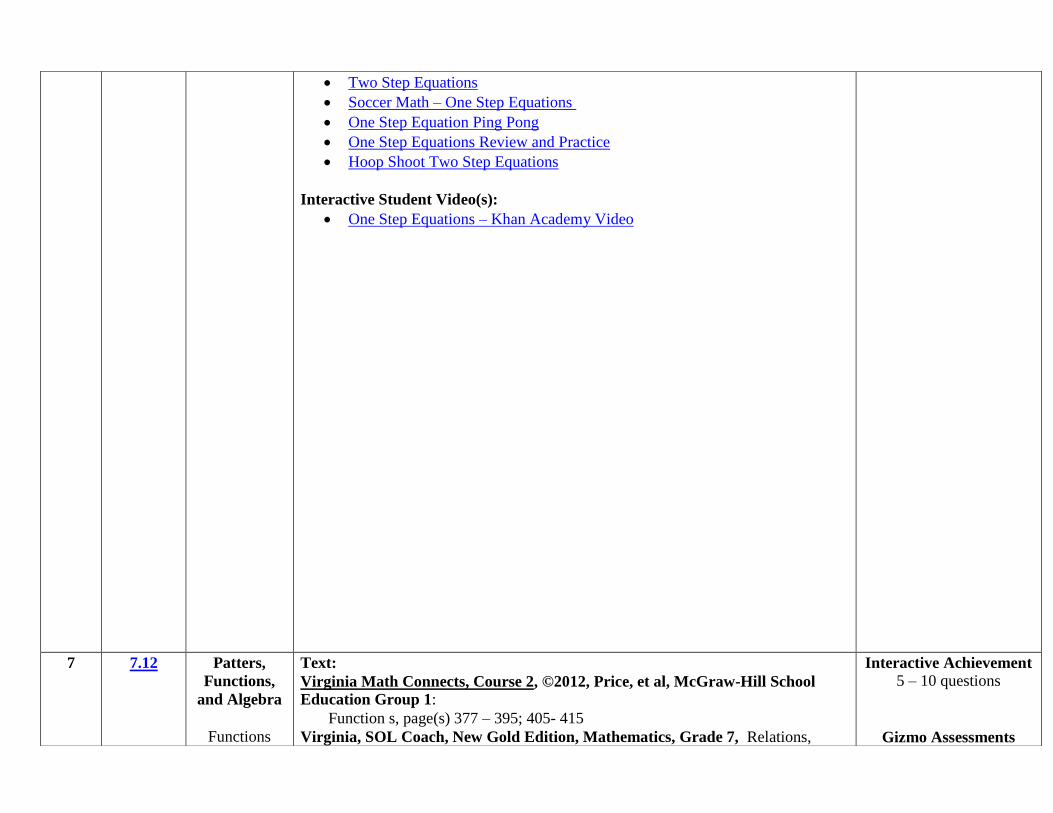
7 7.12 Patters,
Functions,
and Algebra
Functions
Text:
Virginia Math Connects, Course 2, ©2012, Price, et al, McGraw-Hill School
Education Group 1:
Function s, page(s) 377 – 395; 405- 415
Virginia, SOL Coach, New Gold Edition, Mathematics, Grade 7, Relations,
Interactive Achievement 5 – 10 questions
Gizmo Assessments
page(s) 170 – 177
Technology:
Gizmo Lessons:
Function Machine 1
Function Machine 2
Function Machine 3
Introduction to Functions
BrainPop:
Graphing Linear Equations
Coordinate Plane (Review)
Other Sites:
Lesson Plans and Activities:
Investigating Linear Functions
Walking to Class
Function Machines – Interactive Instructional Resource
Vending Machine
Interactive Student Video:
Functions
Interactive Skill Practice:
Function Games
Mulligan Check Point
Comprehension questions
SOL Released Items
Exit Tickets Venn
Diagrams Graphic
Organizers Plickers
Kahoot.it
7 7.2 Number and
Number
Sense
Arithmetic
and
Geometric
Sequence
Text:
Virginia Math Connects, Course 2, ©2012, Price, et al, McGraw-Hill School
Education Group 1:
Sequences, page(s) 44- 50; Geometric Sequences, page(s) 821-822
Virginia, SOL Coach, New Gold Edition, Mathematics, Grade 7,
Arithmetic and Geometric Sequences, page(s) 43-49
Virginia Department of Education Lesson Plan(s):
Interactive Achievement
5 – 10 questions
Mulligan Check Point
Comprehension questions
SOL Released Items
Exit Tickets Venn
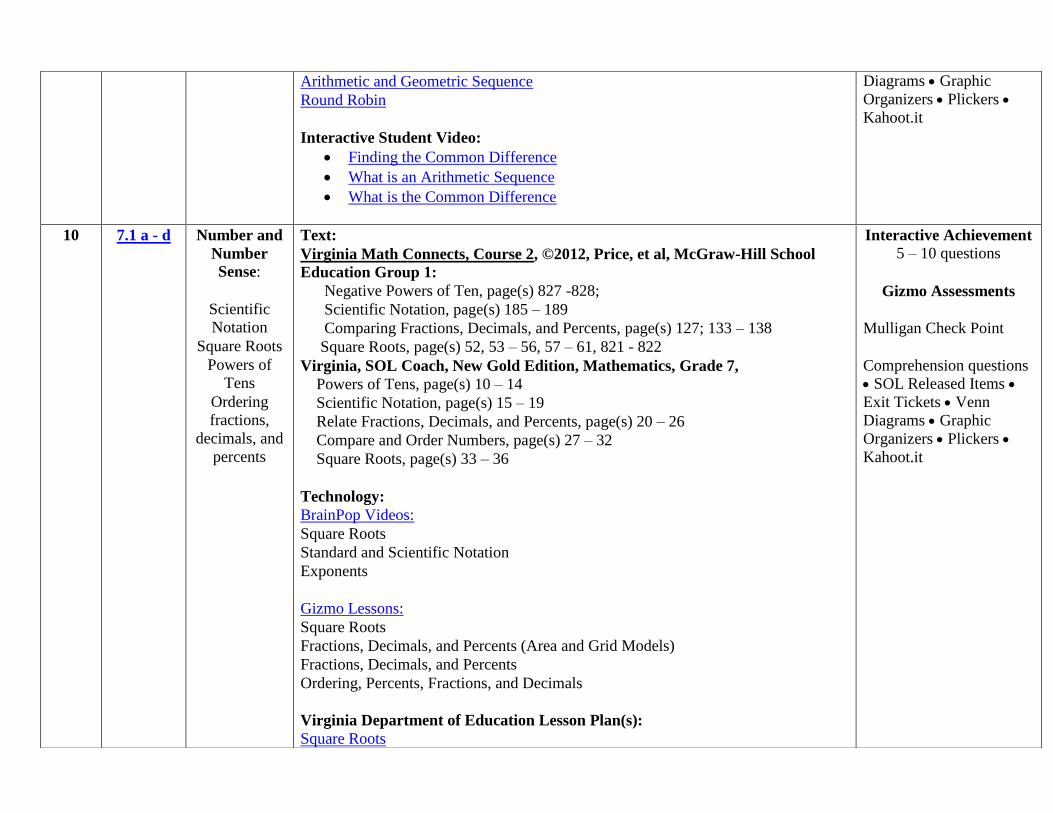
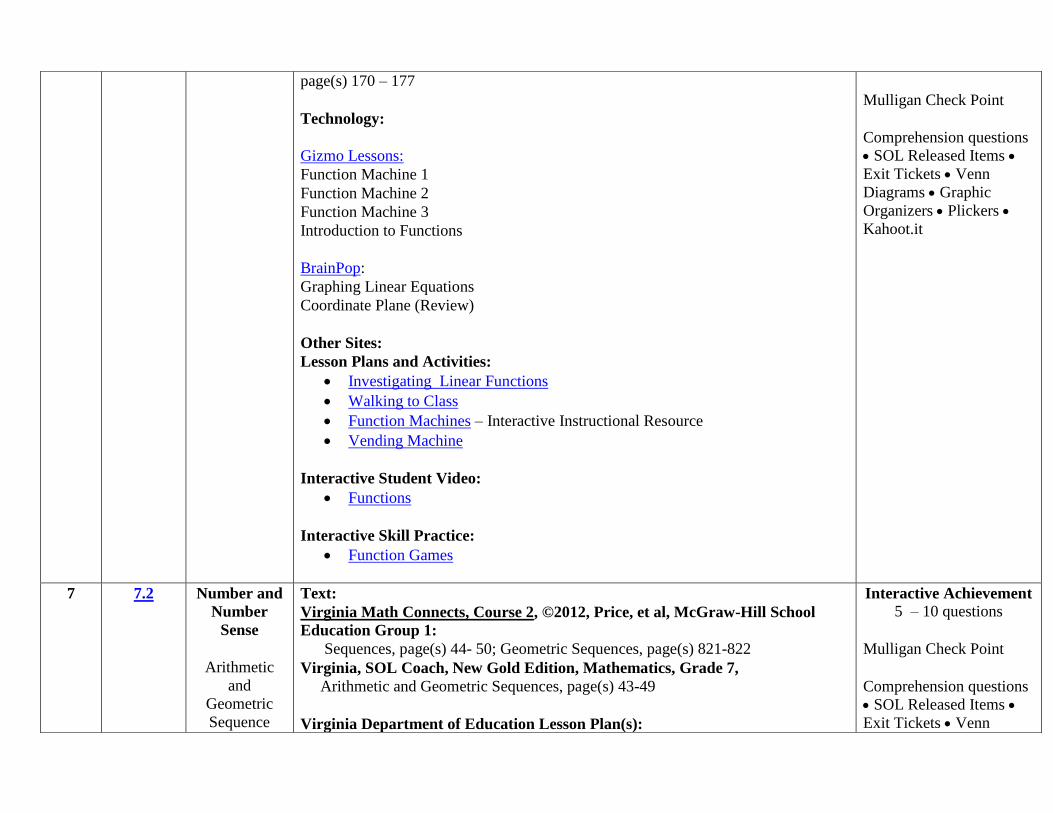
Arithmetic and Geometric Sequence
Round Robin
Interactive Student Video:
Finding the Common Difference
What is an Arithmetic Sequence
What is the Common Difference
Diagrams Graphic
Organizers Plickers
Kahoot.it
10 7.1 a - d Number and
Number
Sense:
Scientific
Notation
Square Roots
Powers of
Tens
Ordering
fractions,
decimals, and
percents
Text:
Virginia Math Connects, Course 2, ©2012, Price, et al, McGraw-Hill School
Education Group 1:
Negative Powers of Ten, page(s) 827 -828;
Scientific Notation, page(s) 185 – 189
Comparing Fractions, Decimals, and Percents, page(s) 127; 133 – 138
Square Roots, page(s) 52, 53 – 56, 57 – 61, 821 - 822
Virginia, SOL Coach, New Gold Edition, Mathematics, Grade 7,
Powers of Tens, page(s) 10 – 14
Scientific Notation, page(s) 15 – 19
Relate Fractions, Decimals, and Percents, page(s) 20 – 26
Compare and Order Numbers, page(s) 27 – 32
Square Roots, page(s) 33 – 36
Technology:
BrainPop Videos:
Square Roots
Standard and Scientific Notation
Exponents
Gizmo Lessons:
Square Roots
Fractions, Decimals, and Percents (Area and Grid Models)
Fractions, Decimals, and Percents
Ordering, Percents, Fractions, and Decimals
Virginia Department of Education Lesson Plan(s):
Square Roots
Interactive Achievement 5 – 10 questions
Gizmo Assessments
Mulligan Check Point
Comprehension questions
SOL Released Items
Exit Tickets Venn
Diagrams Graphic
Organizers Plickers
Kahoot.it
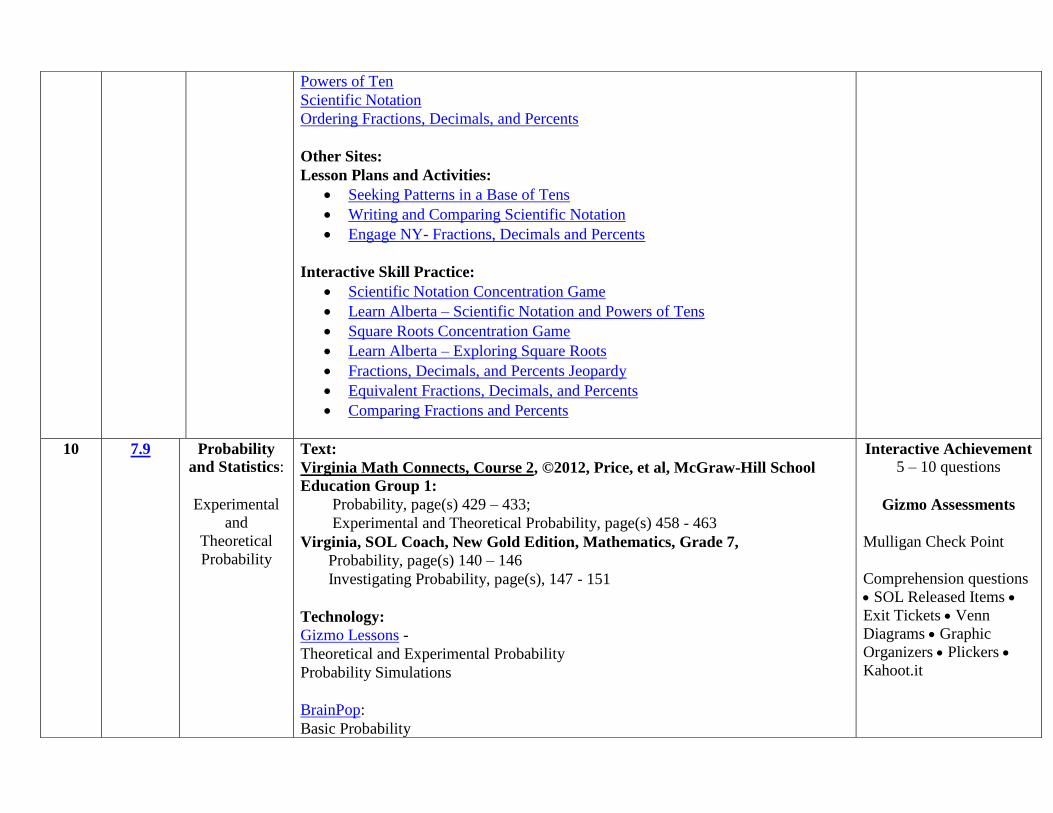
Powers of Ten
Scientific Notation
Ordering Fractions, Decimals, and Percents
Other Sites:
Lesson Plans and Activities:
Seeking Patterns in a Base of Tens
Writing and Comparing Scientific Notation
Engage NY- Fractions, Decimals and Percents
Interactive Skill Practice:
Scientific Notation Concentration Game
Learn Alberta – Scientific Notation and Powers of Tens
Square Roots Concentration Game
Learn Alberta – Exploring Square Roots
Fractions, Decimals, and Percents Jeopardy
Equivalent Fractions, Decimals, and Percents
Comparing Fractions and Percents
10 7.9 Probability
and Statistics:
Experimental
and
Theoretical
Probability
Text:
Virginia Math Connects, Course 2, ©2012, Price, et al, McGraw-Hill School
Education Group 1:
Probability, page(s) 429 – 433;
Experimental and Theoretical Probability, page(s) 458 - 463
Virginia, SOL Coach, New Gold Edition, Mathematics, Grade 7,
Probability, page(s) 140 – 146
Investigating Probability, page(s), 147 - 151
Technology:
Gizmo Lessons -
Theoretical and Experimental Probability
Probability Simulations
BrainPop:
Basic Probability
Interactive Achievement 5 – 10 questions
Gizmo Assessments
Mulligan Check Point
Comprehension questions
SOL Released Items
Exit Tickets Venn
Diagrams Graphic
Organizers Plickers
Kahoot.it
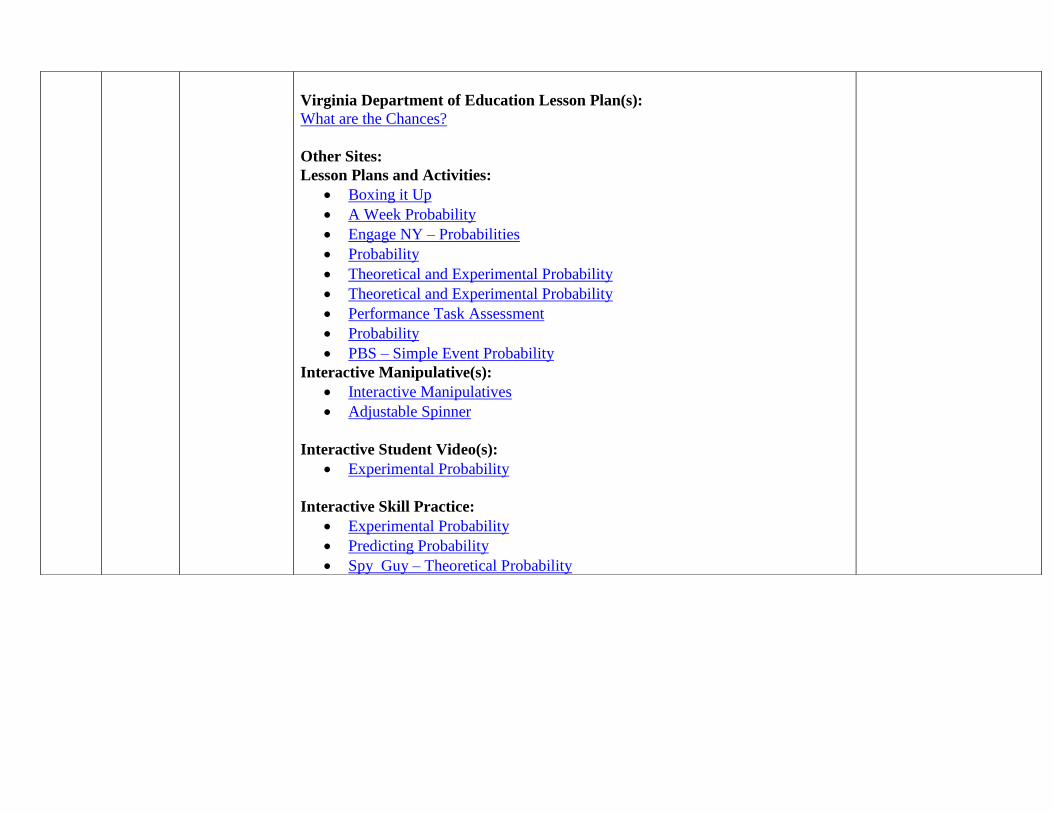
Virginia Department of Education Lesson Plan(s):
What are the Chances?
Other Sites:
Lesson Plans and Activities:
Boxing it Up
A Week Probability
Engage NY – Probabilities
Probability
Theoretical and Experimental Probability
Theoretical and Experimental Probability
Performance Task Assessment
Probability
PBS – Simple Event Probability
Interactive Manipulative(s):
Interactive Manipulatives
Adjustable Spinner
Interactive Student Video(s):
Experimental Probability
Interactive Skill Practice:
Experimental Probability
Predicting Probability
Spy Guy – Theoretical Probability
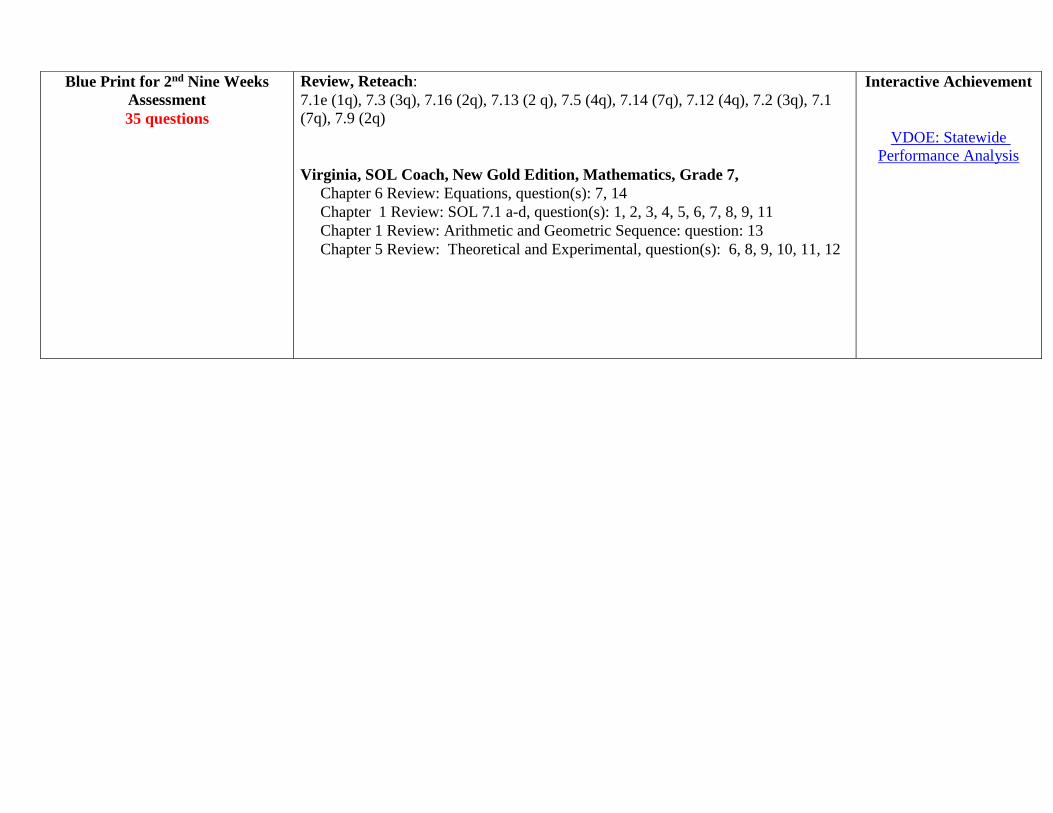
Blue Print for 2nd Nine Weeks
Assessment
35 questions
Review, Reteach:
7.1e (1q), 7.3 (3q), 7.16 (2q), 7.13 (2 q), 7.5 (4q), 7.14 (7q), 7.12 (4q), 7.2 (3q), 7.1
(7q), 7.9 (2q)
Virginia, SOL Coach, New Gold Edition, Mathematics, Grade 7,
Chapter 6 Review: Equations, question(s): 7, 14
Chapter 1 Review: SOL 7.1 a-d, question(s): 1, 2, 3, 4, 5, 6, 7, 8, 9, 11
Chapter 1 Review: Arithmetic and Geometric Sequence: question: 13
Chapter 5 Review: Theoretical and Experimental, question(s): 6, 8, 9, 10, 11, 12
Interactive Achievement
VDOE: Statewide
Performance Analysis
Pacing ~ Resources ~ Assessments
MP3
Time
Frame
Standards
of
Learning
Units/
Topics/
Concepts
Resources Assessments
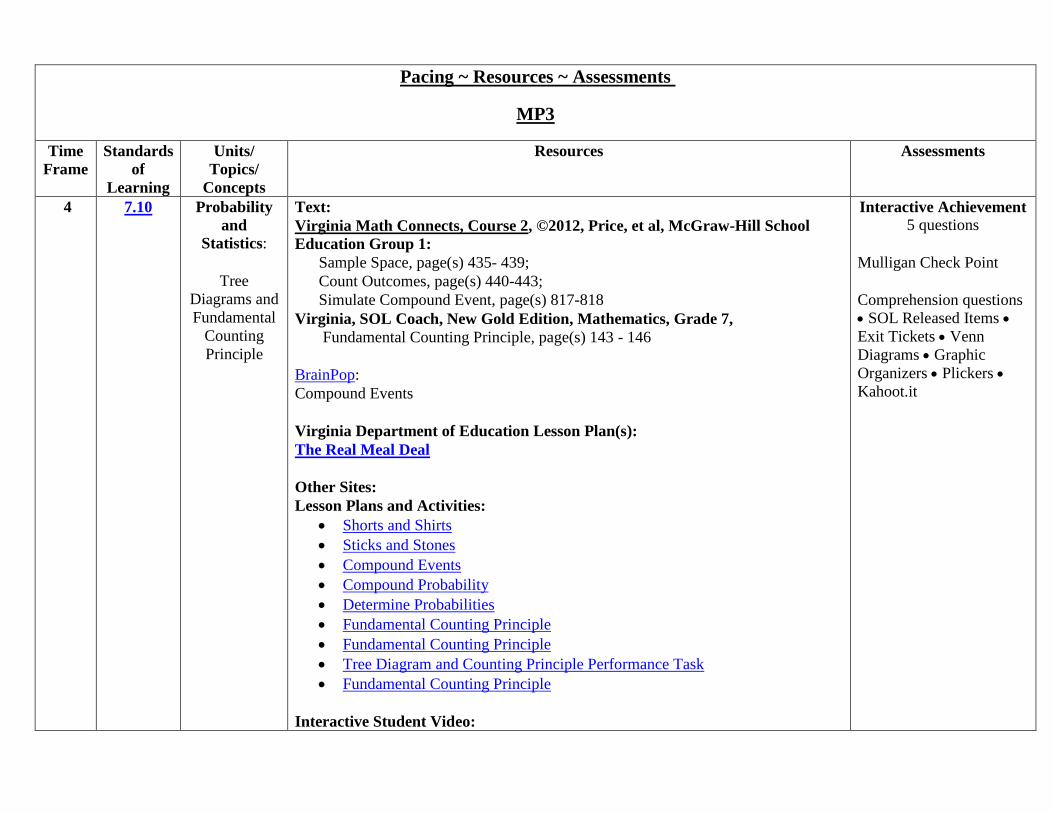
4 7.10 Probability
and
Statistics:
Tree
Diagrams and
Fundamental
Counting
Principle
Text:
Virginia Math Connects, Course 2, ©2012, Price, et al, McGraw-Hill School
Education Group 1:
Sample Space, page(s) 435- 439;
Count Outcomes, page(s) 440-443;
Simulate Compound Event, page(s) 817-818
Virginia, SOL Coach, New Gold Edition, Mathematics, Grade 7,
Fundamental Counting Principle, page(s) 143 - 146
BrainPop:
Compound Events
Virginia Department of Education Lesson Plan(s):
The Real Meal Deal
Other Sites:
Lesson Plans and Activities:
Shorts and Shirts
Sticks and Stones
Compound Events
Compound Probability
Determine Probabilities
Fundamental Counting Principle
Fundamental Counting Principle
Tree Diagram and Counting Principle Performance Task
Fundamental Counting Principle
Interactive Student Video:
Interactive Achievement
5 questions
Mulligan Check Point
Comprehension questions
SOL Released Items
Exit Tickets Venn
Diagrams Graphic
Organizers Plickers
Kahoot.it
Fundamental Counting Principle II
What is the Fundamental Counting Principle
Interactive Skill Practice:
Fundamental Counting Principle I
Fundamental Counting Principle
Interactive Manipulative:
Bobby Bear
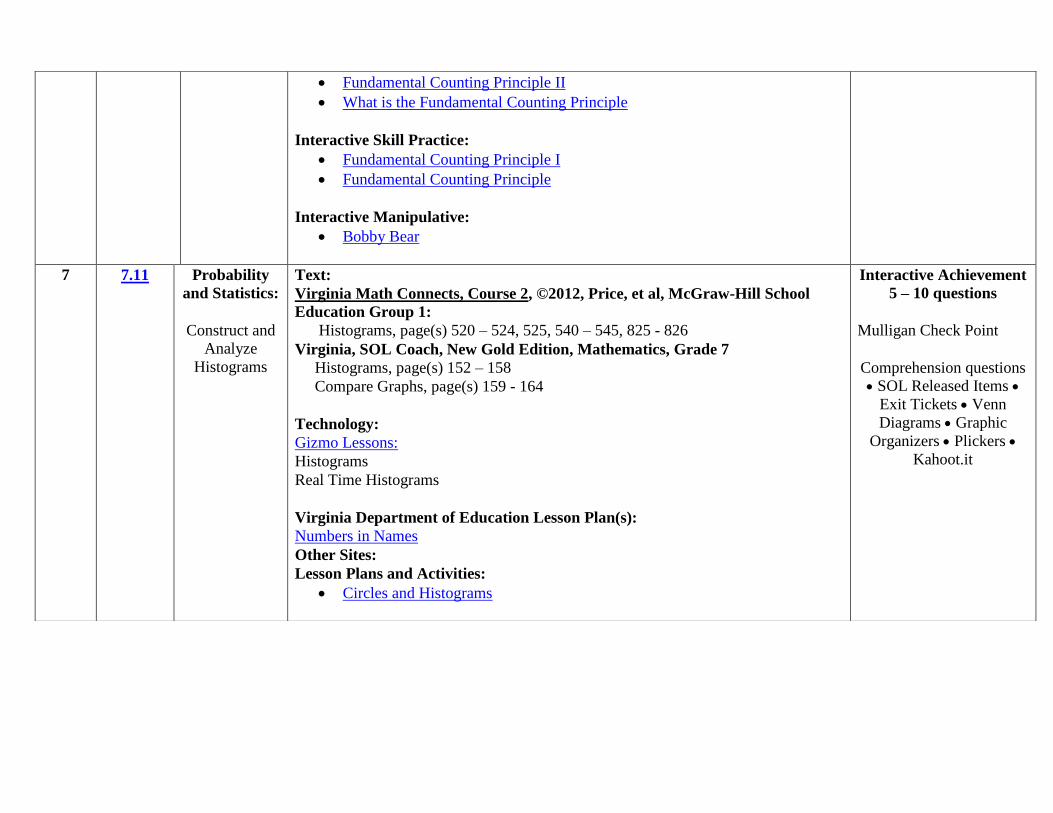
7 7.11 Probability
and Statistics:
Construct and
Analyze
Histograms
Text:
Virginia Math Connects, Course 2, ©2012, Price, et al, McGraw-Hill School
Education Group 1:
Histograms, page(s) 520 – 524, 525, 540 – 545, 825 - 826
Virginia, SOL Coach, New Gold Edition, Mathematics, Grade 7
Histograms, page(s) 152 – 158
Compare Graphs, page(s) 159 - 164
Technology:
Gizmo Lessons:
Histograms
Real Time Histograms
Virginia Department of Education Lesson Plan(s):
Numbers in Names
Other Sites:
Lesson Plans and Activities:
Circles and Histograms
Interactive Achievement
5 – 10 questions
Mulligan Check Point
Comprehension questions
SOL Released Items
Exit Tickets Venn
Diagrams Graphic
Organizers Plickers
Kahoot.it
12 7.4 Computation
and
Estimation:
Proportions
Text:
Virginia Math Connects, Course 2, ©2012, Price, et al, McGraw-Hill School
Education Group 1:
Unit Rates, page(s) 265- 271;
Proportional, page(s) 272- 283;
Scale Drawings, page(s) 284 – 291;
Similar Figures, page(s) 293 – 303;
Real World Application, page(s) 304 - 305
Virginia, SOL Coach, New Gold Edition, Mathematics, Grade 7,
Use Proportions to Solve Problems, page(s) 71 -77
Technology:
BrainPop:
Percents
Proportions
Ratios
Scale Drawings
Taxes
Virginia Department of Education Lesson Plan(s):
Proportions
Sales Tax and Tip
Discounts
Other Sites:
Lesson Plans and Activities:
Fractions, Percents, Ratios, and Proportions
Discovering Proportions
UEN – Proportions
Proportions Applications
Model Building Proportions
Jeopardy Review
Proportion Quiz
Thirsty for Ratios
What’s your Rate?
How Far Can you Go? –
Interactive Achievement
Gizmo Assessments
Mulligan Check Point
Comprehension questions
SOL Released Items
Exit Tickets Venn
Diagrams Graphic
Organizers Plickers
Kahoot.it
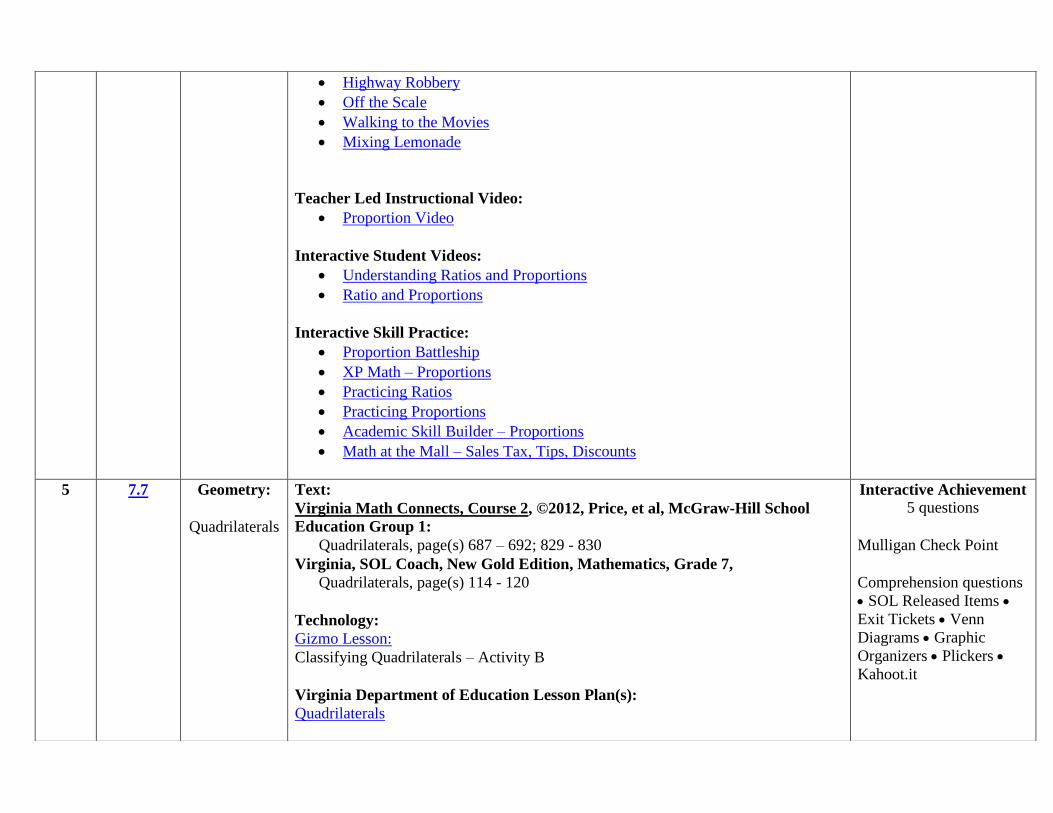
Highway Robbery
Off the Scale
Walking to the Movies
Mixing Lemonade
Teacher Led Instructional Video:
Proportion Video
Interactive Student Videos:
Understanding Ratios and Proportions
Ratio and Proportions
Interactive Skill Practice:
Proportion Battleship
XP Math – Proportions
Practicing Ratios
Practicing Proportions
Academic Skill Builder – Proportions
Math at the Mall – Sales Tax, Tips, Discounts
5 7.7 Geometry:
Quadrilaterals
Text:
Virginia Math Connects, Course 2, ©2012, Price, et al, McGraw-Hill School
Education Group 1:
Quadrilaterals, page(s) 687 – 692; 829 - 830
Virginia, SOL Coach, New Gold Edition, Mathematics, Grade 7,
Quadrilaterals, page(s) 114 - 120
Technology:
Gizmo Lesson:
Classifying Quadrilaterals – Activity B
Virginia Department of Education Lesson Plan(s):
Quadrilaterals
Interactive Achievement
5 questions
Mulligan Check Point
Comprehension questions
SOL Released Items
Exit Tickets Venn
Diagrams Graphic
Organizers Plickers
Kahoot.it
Other Sites:
Lesson Plans and Activities:
Quadrilaterals
Venn Diagrams and Quadrilaterals
PBS – Quadrilaterals
Interactive Student Activities:
Quadrilateral – Learn Alberta
Interactive Student Videos:
Quadrilaterals Properties – Khan Academy,
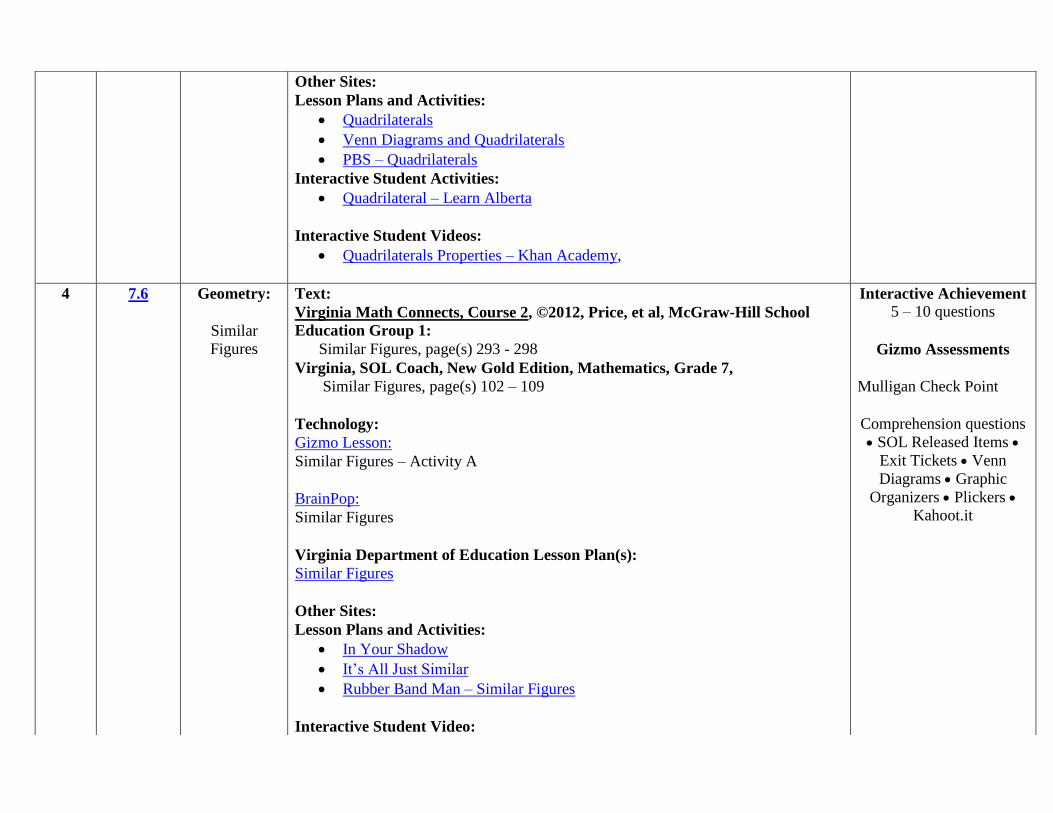
4 7.6 Geometry:
Similar
Figures
Text:
Virginia Math Connects, Course 2, ©2012, Price, et al, McGraw-Hill School
Education Group 1:
Similar Figures, page(s) 293 - 298
Virginia, SOL Coach, New Gold Edition, Mathematics, Grade 7,
Similar Figures, page(s) 102 – 109
Technology:
Gizmo Lesson:
Similar Figures – Activity A
BrainPop:
Similar Figures
Virginia Department of Education Lesson Plan(s):
Similar Figures
Other Sites:
Lesson Plans and Activities:
In Your Shadow
It’s All Just Similar
Rubber Band Man – Similar Figures
Interactive Student Video:
Interactive Achievement 5 – 10 questions
Gizmo Assessments
Mulligan Check Point
Comprehension questions
SOL Released Items
Exit Tickets Venn
Diagrams Graphic
Organizers Plickers
Kahoot.it
Identifying Corresponding Parts on Similar Figures
6 7.15 Patterns,
Functions,
and Algebra:
One Step
Inequalities
Text:
Virginia Math Connects, Course 2, ©2012, Price, et al, McGraw-Hill School
Education Group 1:
One Step Inequalities, page(s) 242 -253
Virginia, SOL Coach, New Gold Edition, Mathematics, Grade 7,
Solve Inequalities and Graph Solutions, page(s) 206 - 213
Technology:
BrainPop
Graphing and Solving Inequalities
Gizmo Lesson –
Exploring Linear Inequalities in one Variable
Solving Linear Inequalities in one Variable
Virginia Department of Education Lesson Plan(s):
Inequalities
Interactive Student Video
Khan Academy: One Step Inequalities
Interactive Skills Practice:
Practice Solving One Step Inequalities
Interactive Achievement 5 – 10 questions
Mulligan Check Point
Comprehension questions
SOL Released Items
Exit Tickets Venn
Diagrams Graphic
Organizers Plickers
Kahoot.it
Blueprints 3rd Nine Weeks
Assessment:
45 questions
Review, Reteach:
7.1e (1q), 7.3 (2q), 7.16 (2q), 7.13 (2 q), 7.5 (2q), 7.14 (2q), 7.12 (1q), 7.2 (2q), 7.1
(2q), 7.9 (4q), 7.10 (3q), 7.11 (5q), 7.4 (5q), 7.7 (4q), 7.6 (4q), 7.15 (3q)
Virginia, SOL Coach, New Gold Edition, Mathematics, Grade 7,
Chapter 5 Review: Histograms, question(s): 1, 2, 5, 7
Chapter 5 Review: Fundamental Counting Principle, question(s): 4
Chapter 2 Review: Proportions, question(s): 5, 10
Chapter 3 Review: Similar Figures, question(s): 2, 7, 8
Chapter 4 Review: Quadrilaterals, question(s), 3, 8, 9
Interactive Achievement
VDOE: Statewide
Performance Analysis
Chapter 6 Review: Inequalities, question(s) 13
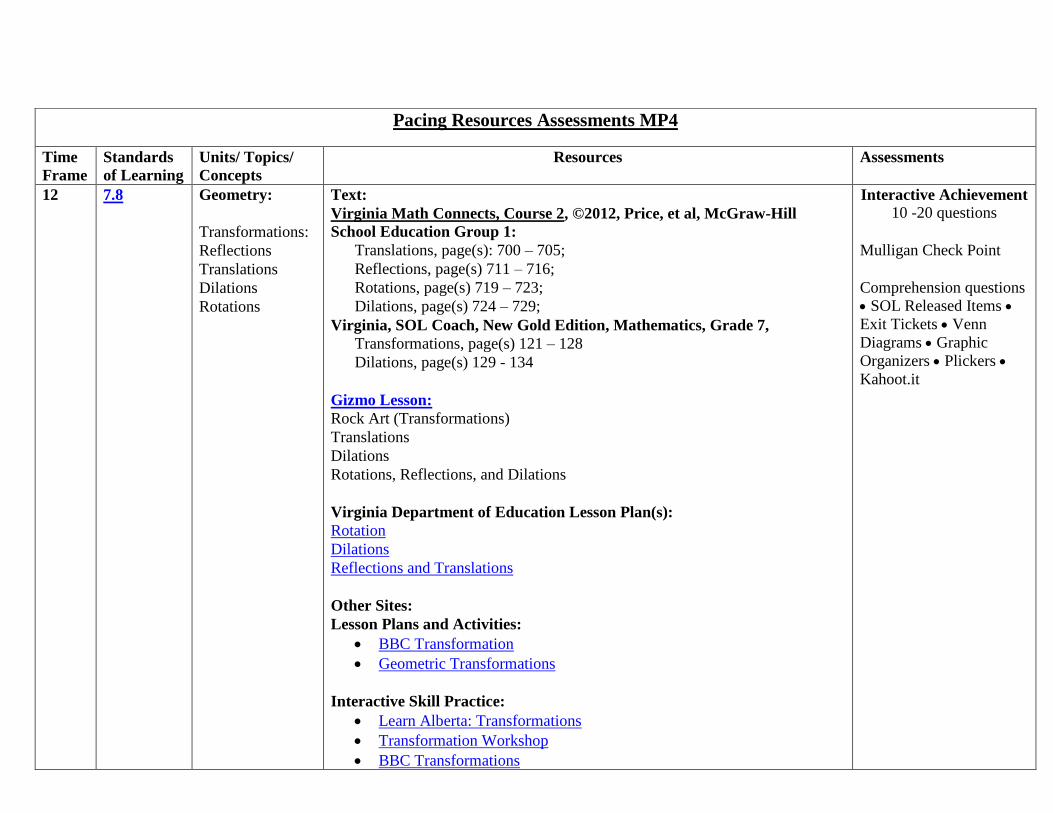
Pacing Resources Assessments MP4
Time
Frame
Standards
of Learning
Units/ Topics/
Concepts
Resources Assessments
12 7.8 Geometry:
Transformations:
Reflections
Translations
Dilations
Rotations
Text:
Virginia Math Connects, Course 2, ©2012, Price, et al, McGraw-Hill
School Education Group 1:
Translations, page(s): 700 – 705;
Reflections, page(s) 711 – 716;
Rotations, page(s) 719 – 723;
Dilations, page(s) 724 – 729;
Virginia, SOL Coach, New Gold Edition, Mathematics, Grade 7,
Transformations, page(s) 121 – 128
Dilations, page(s) 129 - 134
Gizmo Lesson:
Rock Art (Transformations)
Translations
Dilations
Rotations, Reflections, and Dilations
Virginia Department of Education Lesson Plan(s):
Rotation
Dilations
Reflections and Translations
Other Sites:
Lesson Plans and Activities:
BBC Transformation
Geometric Transformations
Interactive Skill Practice:
Learn Alberta: Transformations
Transformation Workshop
BBC Transformations
Interactive Achievement
10 -20 questions
Mulligan Check Point
Comprehension questions
SOL Released Items
Exit Tickets Venn
Diagrams Graphic
Organizers Plickers
Kahoot.it
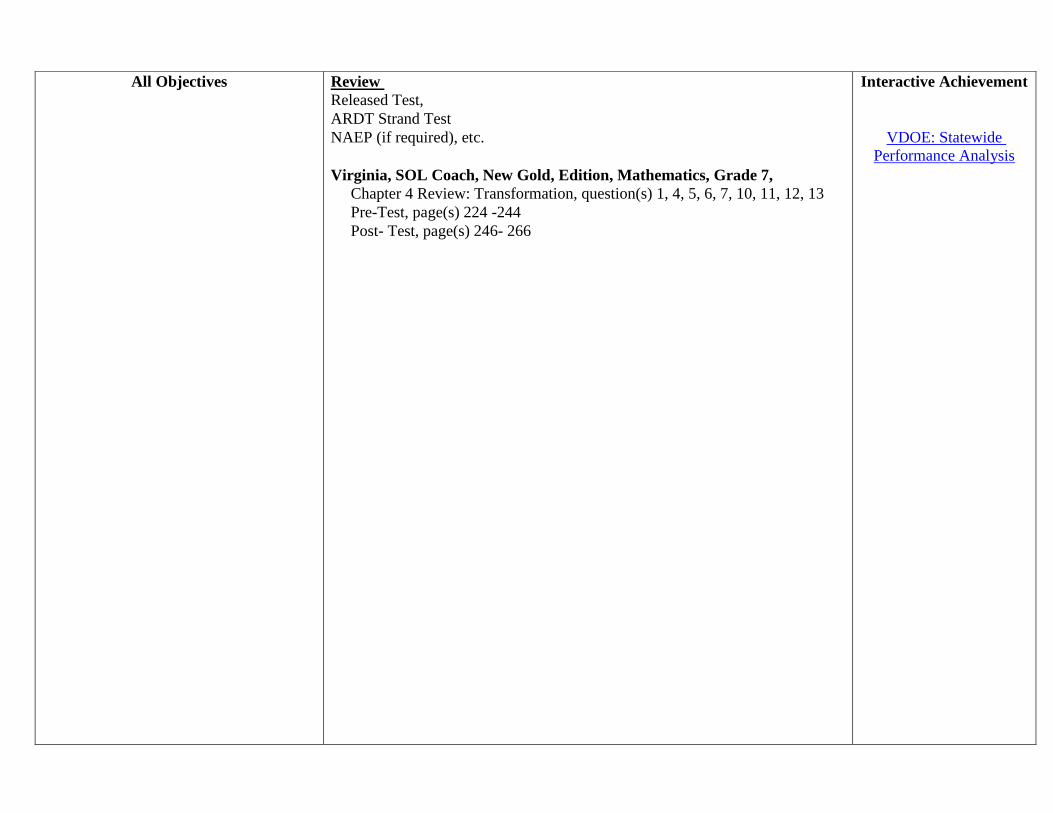
All Objectives
Review
Released Test,
ARDT Strand Test
NAEP (if required), etc.
Virginia, SOL Coach, New Gold, Edition, Mathematics, Grade 7,
Chapter 4 Review: Transformation, question(s) 1, 4, 5, 6, 7, 10, 11, 12, 13
Pre-Test, page(s) 224 -244
Post- Test, page(s) 246- 266
Interactive Achievement
VDOE: Statewide
Performance Analysis
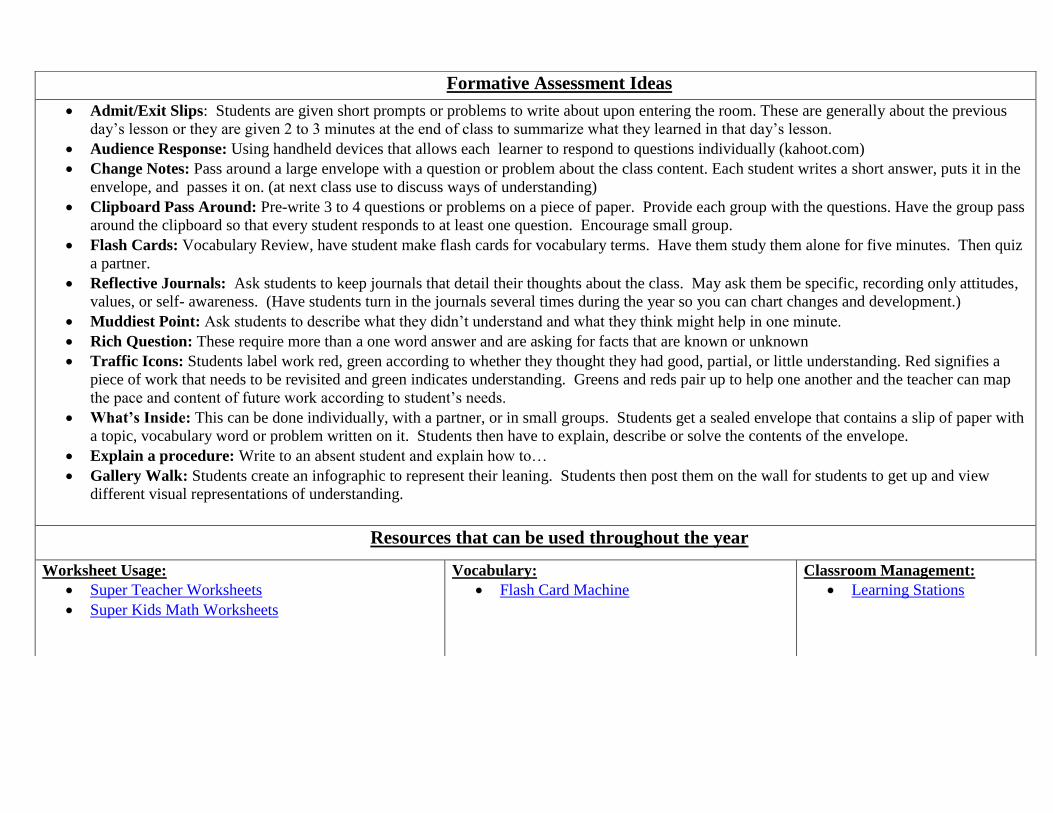
Formative Assessment Ideas
Admit/Exit Slips: Students are given short prompts or problems to write about upon entering the room. These are generally about the previous
day’s lesson or they are given 2 to 3 minutes at the end of class to summarize what they learned in that day’s lesson.
Audience Response: Using handheld devices that allows each learner to respond to questions individually (kahoot.com)
Change Notes: Pass around a large envelope with a question or problem about the class content. Each student writes a short answer, puts it in the
envelope, and passes it on. (at next class use to discuss ways of understanding)
Clipboard Pass Around: Pre-write 3 to 4 questions or problems on a piece of paper. Provide each group with the questions. Have the group pass
around the clipboard so that every student responds to at least one question. Encourage small group.
Flash Cards: Vocabulary Review, have student make flash cards for vocabulary terms. Have them study them alone for five minutes. Then quiz
a partner.
Reflective Journals: Ask students to keep journals that detail their thoughts about the class. May ask them be specific, recording only attitudes,
values, or self- awareness. (Have students turn in the journals several times during the year so you can chart changes and development.)
Muddiest Point: Ask students to describe what they didn’t understand and what they think might help in one minute.
Rich Question: These require more than a one word answer and are asking for facts that are known or unknown
Traffic Icons: Students label work red, green according to whether they thought they had good, partial, or little understanding. Red signifies a
piece of work that needs to be revisited and green indicates understanding. Greens and reds pair up to help one another and the teacher can map
the pace and content of future work according to student’s needs.
What’s Inside: This can be done individually, with a partner, or in small groups. Students get a sealed envelope that contains a slip of paper with
a topic, vocabulary word or problem written on it. Students then have to explain, describe or solve the contents of the envelope.
Explain a procedure: Write to an absent student and explain how to…
Gallery Walk: Students create an infographic to represent their leaning. Students then post them on the wall for students to get up and view
different visual representations of understanding.
Resources that can be used throughout the year
Worksheet Usage:
Super Teacher Worksheets
Super Kids Math Worksheets
Vocabulary:
Flash Card Machine
Classroom Management:
Learning Stations
Grade 7
Copyright © 2009
by the
Virginia Department of Education
P.O. Box 2120
Richmond, Virginia 23218-2120
http://www.doe.virginia.gov
All rights reserved. Reproduction of these materials for instructional purposes in public school classrooms in Virginia is permitted.
Superintendent of Public Instruction
Patricia I. Wright, Ed.D.
Assistant Superintendent for Instruction
Linda M. Wallinger, Ph.D.
Office of Elementary Instruction
Mark R. Allan, Ph.D., Director
Deborah P. Wickham, Ph.D., Mathematics Specialist
Office of Middle and High School Instruction
Michael F. Bolling, Mathematics Coordinator
Acknowledgements
The Virginia Department of Education wishes to express sincere thanks to Deborah Kiger Bliss, Lois A. Williams, Ed.D., and Felicia Dyke, Ph.D.
who assisted in the development of the 2009 Mathematics Standards of Learning Curriculum Framework.
NOTICE
The Virginia Department of Education does not unlawfully discriminate on the basis of race, color, sex, national origin, age, or disability in
employment or in its educational programs or services.
The 2009 Mathematics Curriculum Framework can be found in PDF and Microsoft Word file formats on the Virginia Department of Education’s
Web site at http://www.doe.virginia.gov.
Virginia Mathematics Standards of Learning Curriculum Framework 2009
Introduction
The 2009 Mathematics Standards of Learning Curriculum Framework is a companion document to the 2009 Mathematics Standards of Learning and
amplifies the Mathematics Standards of Learning by defining the content knowledge, skills, and understandings that are measured by the Standards
of Learning assessments. The Curriculum Framework provides additional guidance to school divisions and their teachers as they develop an
instructional program appropriate for their students. It assists teachers in their lesson planning by identifying essential understandings, defining
essential content knowledge, and describing the intellectual skills students need to use. This supplemental framework delineates in greater specificity
the content that all teachers should teach and all students should learn.
Each topic in the Mathematics Standards of Learning Curriculum Framework is developed around the Standards of Learning. The format of the
Curriculum Framework facilitates teacher planning by identifying the key concepts, knowledge and skills that should be the focus of instruction for
each standard. The Curriculum Framework is divided into three columns: Understanding the Standard; Essential Understandings; and Essential
Knowledge and Skills. The purpose of each column is explained below.
Understanding the Standard
This section includes background information for the teacher (K-8). It contains content that may extend the teachers’ knowledge of the standard
beyond the current grade level. This section may also contain suggestions and resources that will help teachers plan lessons focusing on the standard.
Essential Understandings
This section delineates the key concepts, ideas and mathematical relationships that all students should grasp to demonstrate an understanding of the
Standards of Learning. In Grades 6-8, these essential understandings are presented as questions to facilitate teacher planning.
Essential Knowledge and Skills
Each standard is expanded in the Essential Knowledge and Skills column. What each student should know and be able to do in each standard is
outlined. This is not meant to be an exhaustive list nor a list that limits what is taught in the classroom. It is meant to be the key knowledge and skills
that define the standard.
The Curriculum Framework serves as a guide for Standards of Learning assessment development. Assessment items may not and should not be a
verbatim reflection of the information presented in the Curriculum Framework. Students are expected to continue to apply knowledge and skills
from Standards of Learning presented in previous grades as they build mathematical expertise.
FOCUS 6–8 STRAND: NUMBER AND NUMBER SENSE GRADE LEVEL 7
Mathematics Standards of Learning Curriculum Framework 2009: Grade 7 1
In the middle grades, the focus of mathematics learning is to
build on students’ concrete reasoning experiences developed in the elementary grades;
construct a more advanced understanding of mathematics through active learning experiences;
develop deep mathematical understandings required for success in abstract learning experiences; and
apply mathematics as a tool in solving practical problems.
Students in the middle grades use problem solving, mathematical communication, mathematical reasoning, connections, and representations to
integrate understanding within this strand and across all the strands.
Students in the middle grades focus on mastering rational numbers. Rational numbers play a critical role in the development of proportional
reasoning and advanced mathematical thinking. The study of rational numbers builds on the understanding of whole numbers, fractions, and
decimals developed by students in the elementary grades. Proportional reasoning is the key to making connections to most middle school
mathematics topics.
Students develop an understanding of integers and rational numbers by using concrete, pictorial, and abstract representations. They learn how to use
equivalent representations of fractions, decimals, and percents and recognize the advantages and disadvantages of each type of representation.
Flexible thinking about rational number representations is encouraged when students solve problems.
Students develop an understanding of the properties of operations on real numbers through experiences with rational numbers and by applying the
order of operations.
Students use a variety of concrete, pictorial, and abstract representations to develop proportional reasoning skills. Ratios and proportions are a major
focus of mathematics learning in the middle grades.
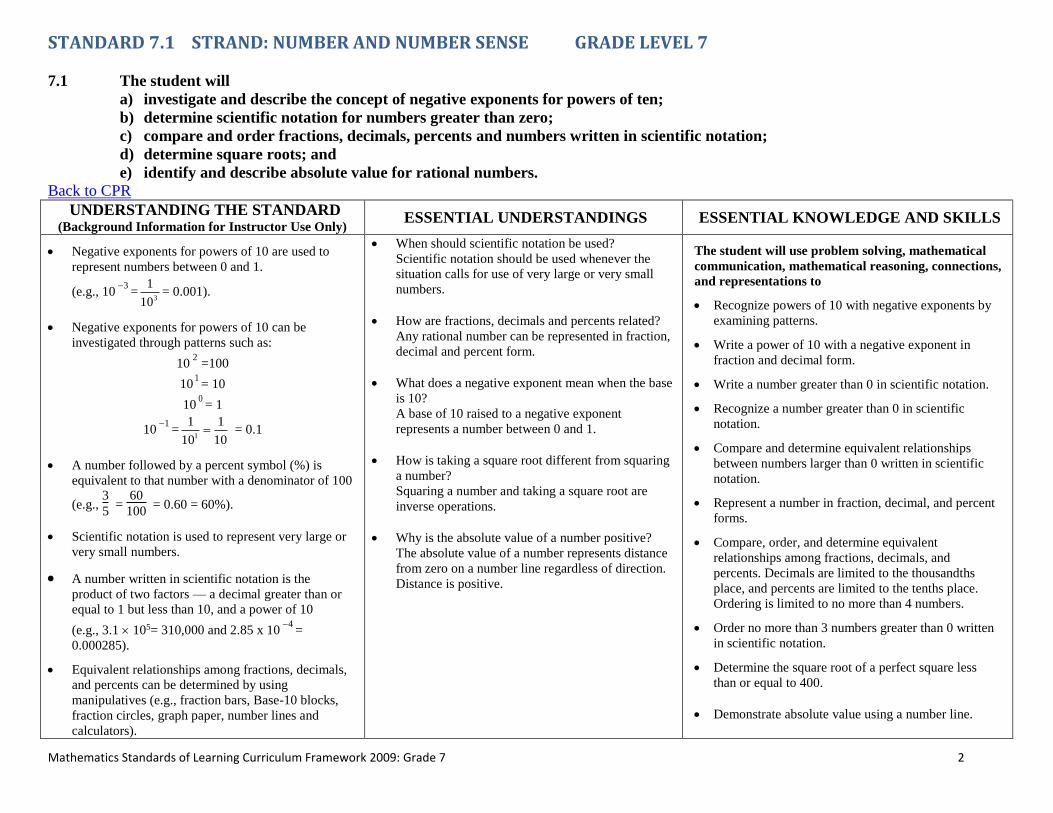
STANDARD 7.1 STRAND: NUMBER AND NUMBER SENSE GRADE LEVEL 7
Mathematics Standards of Learning Curriculum Framework 2009: Grade 7 2
7.1 The student will
a) investigate and describe the concept of negative exponents for powers of ten;
b) determine scientific notation for numbers greater than zero;
c) compare and order fractions, decimals, percents and numbers written in scientific notation;
d) determine square roots; and
e) identify and describe absolute value for rational numbers.
Back to CPR
UNDERSTANDING THE STANDARD (Background Information for Instructor Use Only)
ESSENTIAL UNDERSTANDINGS ESSENTIAL KNOWLEDGE AND SKILLS
Negative exponents for powers of 10 are used to
represent numbers between 0 and 1.
(e.g., 103
=3
1
10= 0.001).
Negative exponents for powers of 10 can be
investigated through patterns such as:
102
=100
101= 10
100= 1
101
=1
1 1
1010 = 0.1
A number followed by a percent symbol (%) is
equivalent to that number with a denominator of 100
(e.g., 3
5 =
60
100 = 0.60 = 60%).
Scientific notation is used to represent very large or
very small numbers.
A number written in scientific notation is the
product of two factors — a decimal greater than or
equal to 1 but less than 10, and a power of 10
(e.g., 3.1 105= 310,000 and 2.85 x 104
=
0.000285).
Equivalent relationships among fractions, decimals,
and percents can be determined by using
manipulatives (e.g., fraction bars, Base-10 blocks,
fraction circles, graph paper, number lines and
calculators).
When should scientific notation be used?
Scientific notation should be used whenever the
situation calls for use of very large or very small
numbers.
How are fractions, decimals and percents related?
Any rational number can be represented in fraction,
decimal and percent form.
What does a negative exponent mean when the base
is 10?
A base of 10 raised to a negative exponent
represents a number between 0 and 1.
How is taking a square root different from squaring
a number?
Squaring a number and taking a square root are
inverse operations.
Why is the absolute value of a number positive?
The absolute value of a number represents distance
from zero on a number line regardless of direction.
Distance is positive.
The student will use problem solving, mathematical
communication, mathematical reasoning, connections,
and representations to
Recognize powers of 10 with negative exponents by
examining patterns.
Write a power of 10 with a negative exponent in
fraction and decimal form.
Write a number greater than 0 in scientific notation.
Recognize a number greater than 0 in scientific
notation.
Compare and determine equivalent relationships
between numbers larger than 0 written in scientific
notation.
Represent a number in fraction, decimal, and percent
forms.
Compare, order, and determine equivalent
relationships among fractions, decimals, and
percents. Decimals are limited to the thousandths
place, and percents are limited to the tenths place.
Ordering is limited to no more than 4 numbers.
Order no more than 3 numbers greater than 0 written
in scientific notation.
Determine the square root of a perfect square less
than or equal to 400.
Demonstrate absolute value using a number line.
STANDARD 7.1 STRAND: NUMBER AND NUMBER SENSE GRADE LEVEL 7
Mathematics Standards of Learning Curriculum Framework 2009: Grade 7 3
7.1 The student will
a) investigate and describe the concept of negative exponents for powers of ten;
b) determine scientific notation for numbers greater than zero;
c) compare and order fractions, decimals, percents and numbers written in scientific notation;
d) determine square roots; and
e) identify and describe absolute value for rational numbers.
Back to CPR
UNDERSTANDING THE STANDARD (Background Information for Instructor Use Only)
ESSENTIAL UNDERSTANDINGS ESSENTIAL KNOWLEDGE AND SKILLS
A square root of a number is a number which, when
multiplied by itself, produces the given number
(e.g., 121 is 11 since 11 x 11 = 121).
The square root of a number can be represented
geometrically as the length of a side of the square.
The absolute value of a number is the distance from
0 on the number line regardless of direction.
(e.g., 1 1
2 2
).
Determine the absolute value of a rational number.
Show that the distance between two rational numbers
on the number line is the absolute value of their
difference, and apply this principle to solve practical
problems.†
†Revised March 2011
Back to top

STANDARD 7.2 STRAND: NUMBER AND NUMBER SENSE GRADE LEVEL 7
Mathematics Standards of Learning Curriculum Framework 2009: Grade 7 4
7.2 The student will describe and represent arithmetic and geometric sequences using variable expressions.
Back to CPR
UNDERSTANDING THE STANDARD (Background Information for Instructor Use Only)
ESSENTIAL UNDERSTANDINGS ESSENTIAL KNOWLEDGE AND SKILLS
In the numeric pattern of an arithmetic sequence,
students must determine the difference, called the
common difference, between each succeeding
number in order to determine what is added to each
previous number to obtain the next number.
In geometric sequences, students must determine
what each number is multiplied by in order to obtain
the next number in the geometric sequence. This
multiplier is called the common ratio. Sample
geometric sequences include
2, 4, 8, 16, 32, …; 1, 5, 25, 125, 625, …; and 80,
20, 5, 1.25, ….
A variable expression can be written to express the
relationship between two consecutive terms of a
sequence
If n represents a number in the sequence
3, 6, 9, 12…, the next term in the sequence can
be determined using the variable expression
n + 3.
If n represents a number in the sequence
1, 5, 25, 125…, the next term in the sequence
can be determined by using the variable
expression 5n.
When are variable expressions used?
Variable expressions can express the relationship
between two consecutive terms in a sequence.
The student will use problem solving, mathematical
communication, mathematical reasoning,
connections, and representations to
Analyze arithmetic and geometric sequences to
discover a variety of patterns.
Identify the common difference in an arithmetic
sequence.
Identify the common ratio in a geometric sequence.
Given an arithmetic or geometric sequence, write a
variable expression to describe the relationship
between two consecutive terms in the sequence.
Back to Top
FOCUS 6–8 STRAND: COMPUTATION AND ESTIMATION GRADE LEVEL 7
Mathematics Standards of Learning Curriculum Framework 2009: Grade 7 5
In the middle grades, the focus of mathematics learning is to
build on students’ concrete reasoning experiences developed in the elementary grades;
construct a more advanced understanding of mathematics through active learning experiences;
develop deep mathematical understandings required for success in abstract learning experiences; and
apply mathematics as a tool in solving practical problems.
Students in the middle grades use problem solving, mathematical communication, mathematical reasoning, connections, and representations to
integrate understanding within this strand and across all the strands.
Students develop conceptual and algorithmic understanding of operations with integers and rational numbers through concrete activities and
discussions that bring meaning to why procedures work and make sense.
Students develop and refine estimation strategies and develop an understanding of when to use algorithms and when to use calculators. Students learn
when exact answers are appropriate and when, as in many life experiences, estimates are equally appropriate.
Students learn to make sense of the mathematical tools they use by making valid judgments of the reasonableness of answers.
Students reinforce skills with operations with whole numbers, fractions, and decimals through problem solving and application activities.
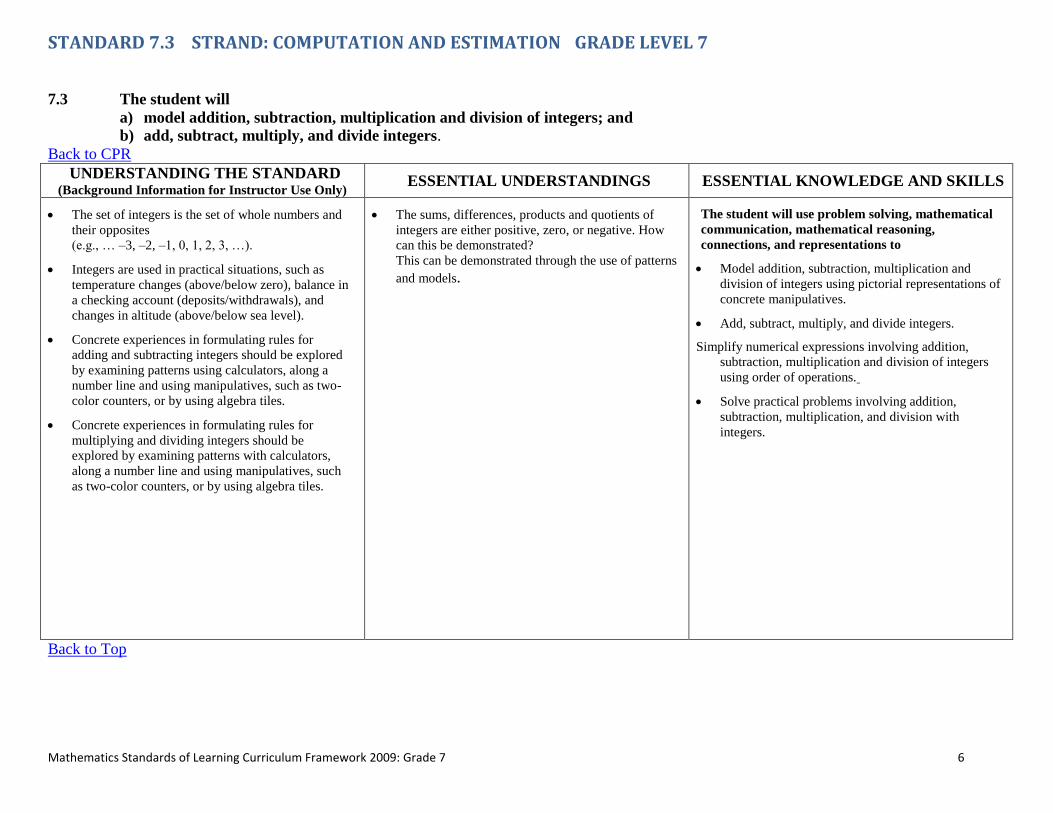
STANDARD 7.3 STRAND: COMPUTATION AND ESTIMATION GRADE LEVEL 7
Mathematics Standards of Learning Curriculum Framework 2009: Grade 7 6
7.3 The student will
a) model addition, subtraction, multiplication and division of integers; and
b) add, subtract, multiply, and divide integers.
Back to CPR
UNDERSTANDING THE STANDARD (Background Information for Instructor Use Only)
ESSENTIAL UNDERSTANDINGS ESSENTIAL KNOWLEDGE AND SKILLS
The set of integers is the set of whole numbers and
their opposites
(e.g., … –3, –2, –1, 0, 1, 2, 3, …).
Integers are used in practical situations, such as
temperature changes (above/below zero), balance in
a checking account (deposits/withdrawals), and
changes in altitude (above/below sea level).
Concrete experiences in formulating rules for
adding and subtracting integers should be explored
by examining patterns using calculators, along a
number line and using manipulatives, such as two-
color counters, or by using algebra tiles.
Concrete experiences in formulating rules for
multiplying and dividing integers should be
explored by examining patterns with calculators,
along a number line and using manipulatives, such
as two-color counters, or by using algebra tiles.
The sums, differences, products and quotients of
integers are either positive, zero, or negative. How
can this be demonstrated?
This can be demonstrated through the use of patterns
and models.
The student will use problem solving, mathematical
communication, mathematical reasoning,
connections, and representations to
Model addition, subtraction, multiplication and
division of integers using pictorial representations of
concrete manipulatives.
Add, subtract, multiply, and divide integers.
Simplify numerical expressions involving addition,
subtraction, multiplication and division of integers
using order of operations.
Solve practical problems involving addition,
subtraction, multiplication, and division with
integers.
Back to Top
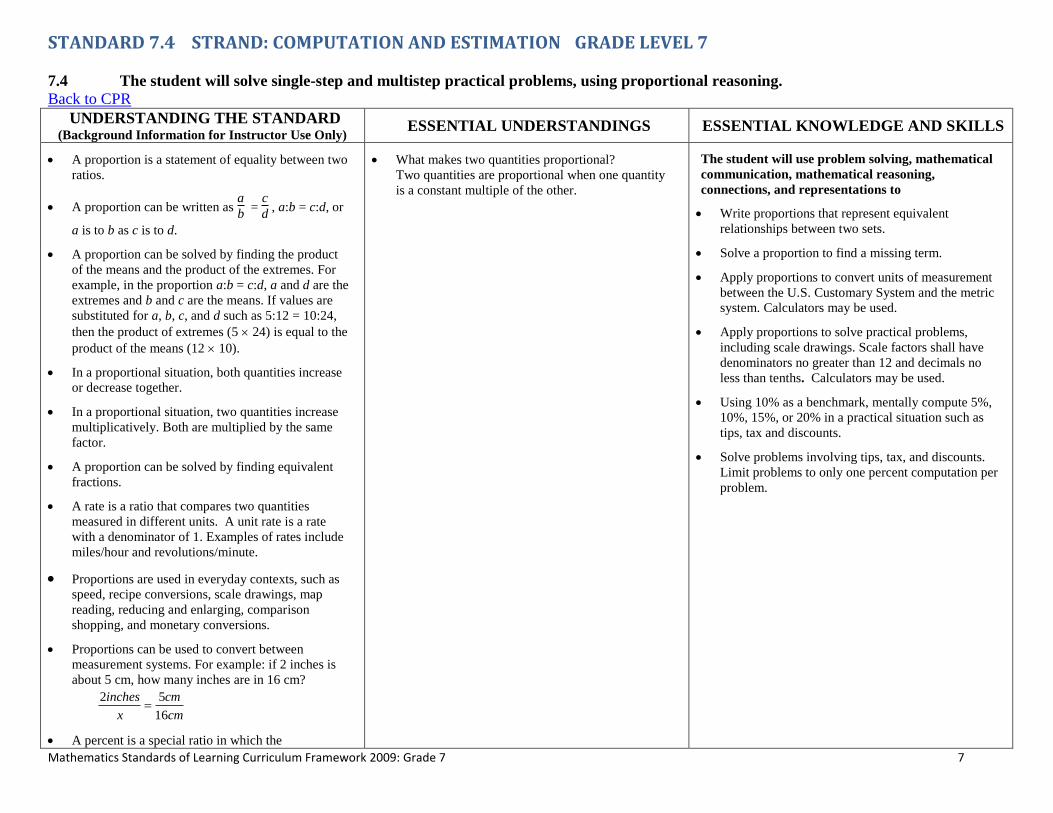
STANDARD 7.4 STRAND: COMPUTATION AND ESTIMATION GRADE LEVEL 7
Mathematics Standards of Learning Curriculum Framework 2009: Grade 7 7
7.4 The student will solve single-step and multistep practical problems, using proportional reasoning.
Back to CPR
UNDERSTANDING THE STANDARD (Background Information for Instructor Use Only)
ESSENTIAL UNDERSTANDINGS ESSENTIAL KNOWLEDGE AND SKILLS
A proportion is a statement of equality between two
ratios.
A proportion can be written as a
b =
c
d , a:b = c:d, or
a is to b as c is to d.
A proportion can be solved by finding the product
of the means and the product of the extremes. For
example, in the proportion a:b = c:d, a and d are the
extremes and b and c are the means. If values are
substituted for a, b, c, and d such as 5:12 = 10:24,
then the product of extremes (5 24) is equal to the
product of the means (12 10).
In a proportional situation, both quantities increase
or decrease together.
In a proportional situation, two quantities increase
multiplicatively. Both are multiplied by the same
factor.
A proportion can be solved by finding equivalent
fractions.
A rate is a ratio that compares two quantities
measured in different units. A unit rate is a rate
with a denominator of 1. Examples of rates include
miles/hour and revolutions/minute.
Proportions are used in everyday contexts, such as
speed, recipe conversions, scale drawings, map
reading, reducing and enlarging, comparison
shopping, and monetary conversions.
Proportions can be used to convert between
measurement systems. For example: if 2 inches is
about 5 cm, how many inches are in 16 cm?
2 5
16
inches cm
x cm
A percent is a special ratio in which the
What makes two quantities proportional?
Two quantities are proportional when one quantity
is a constant multiple of the other.
The student will use problem solving, mathematical
communication, mathematical reasoning,
connections, and representations to
Write proportions that represent equivalent
relationships between two sets.
Solve a proportion to find a missing term.
Apply proportions to convert units of measurement
between the U.S. Customary System and the metric
system. Calculators may be used.
Apply proportions to solve practical problems,
including scale drawings. Scale factors shall have
denominators no greater than 12 and decimals no
less than tenths. Calculators may be used.
Using 10% as a benchmark, mentally compute 5%,
10%, 15%, or 20% in a practical situation such as
tips, tax and discounts.
Solve problems involving tips, tax, and discounts.
Limit problems to only one percent computation per
problem.
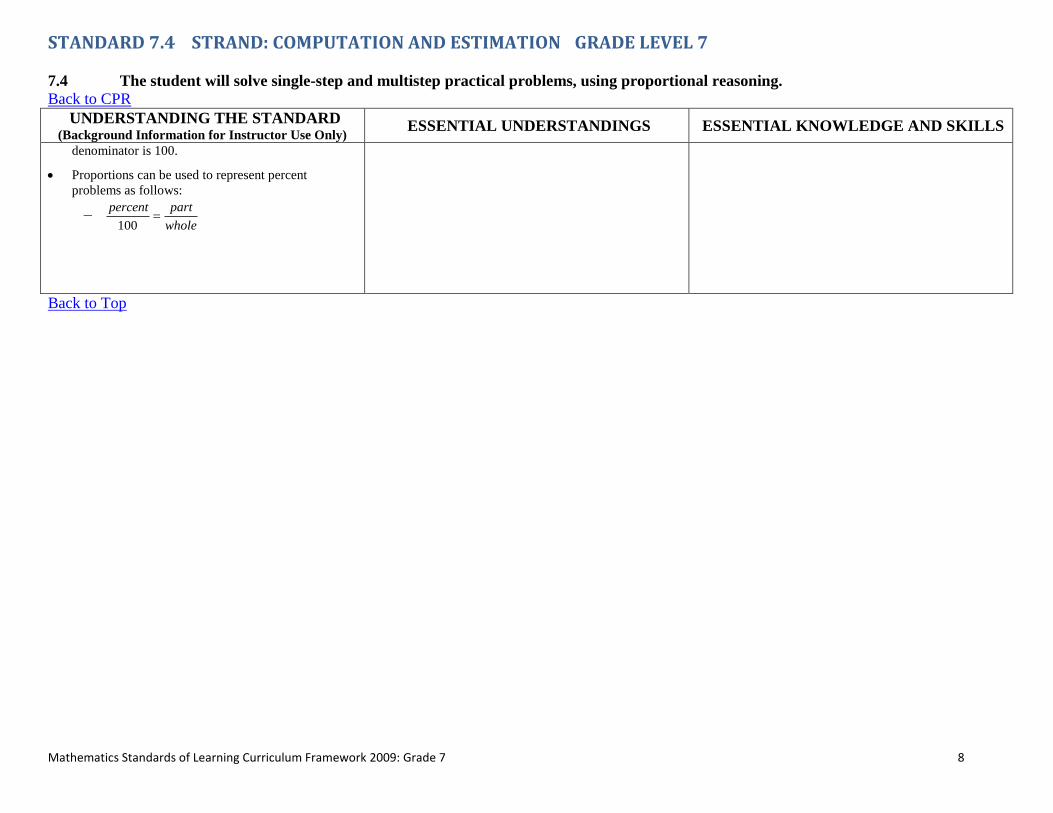
STANDARD 7.4 STRAND: COMPUTATION AND ESTIMATION GRADE LEVEL 7
Mathematics Standards of Learning Curriculum Framework 2009: Grade 7 8
7.4 The student will solve single-step and multistep practical problems, using proportional reasoning.
Back to CPR
UNDERSTANDING THE STANDARD (Background Information for Instructor Use Only)
ESSENTIAL UNDERSTANDINGS ESSENTIAL KNOWLEDGE AND SKILLS
denominator is 100.
Proportions can be used to represent percent
problems as follows:
– 100
percent part
whole
Back to Top
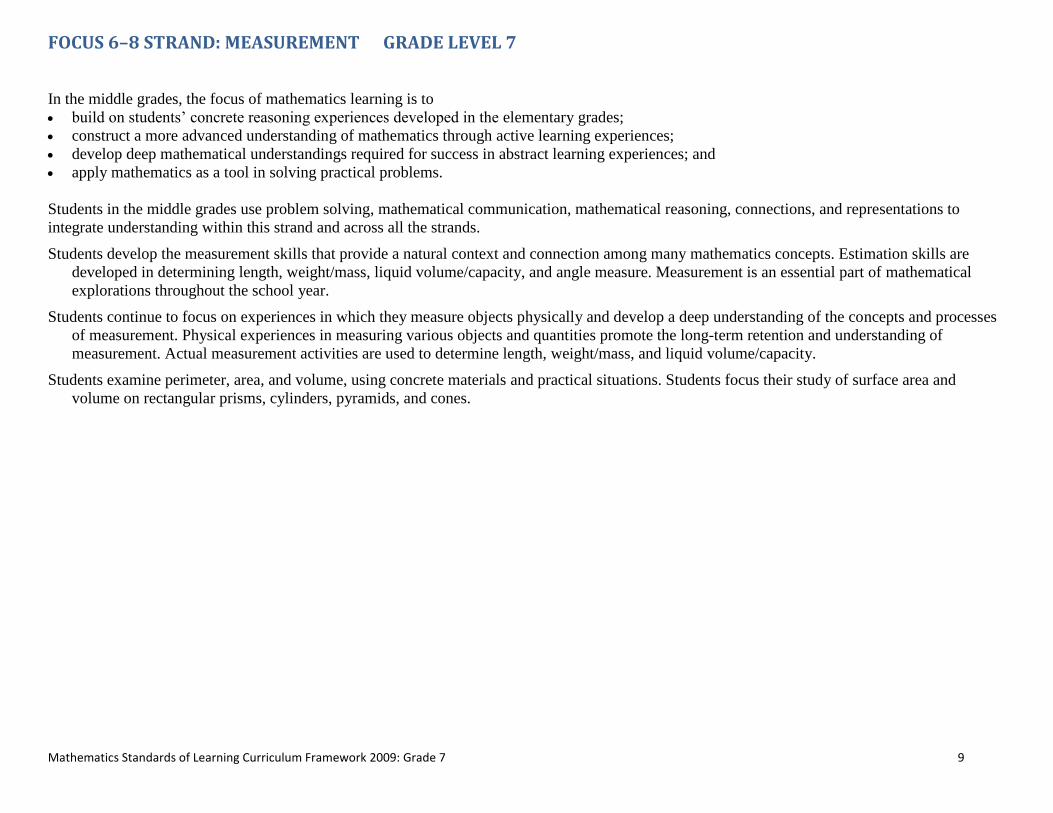
FOCUS 6–8 STRAND: MEASUREMENT GRADE LEVEL 7
Mathematics Standards of Learning Curriculum Framework 2009: Grade 7 9
In the middle grades, the focus of mathematics learning is to
build on students’ concrete reasoning experiences developed in the elementary grades;
construct a more advanced understanding of mathematics through active learning experiences;
develop deep mathematical understandings required for success in abstract learning experiences; and
apply mathematics as a tool in solving practical problems.
Students in the middle grades use problem solving, mathematical communication, mathematical reasoning, connections, and representations to
integrate understanding within this strand and across all the strands.
Students develop the measurement skills that provide a natural context and connection among many mathematics concepts. Estimation skills are
developed in determining length, weight/mass, liquid volume/capacity, and angle measure. Measurement is an essential part of mathematical
explorations throughout the school year.
Students continue to focus on experiences in which they measure objects physically and develop a deep understanding of the concepts and processes
of measurement. Physical experiences in measuring various objects and quantities promote the long-term retention and understanding of
measurement. Actual measurement activities are used to determine length, weight/mass, and liquid volume/capacity.
Students examine perimeter, area, and volume, using concrete materials and practical situations. Students focus their study of surface area and
volume on rectangular prisms, cylinders, pyramids, and cones.
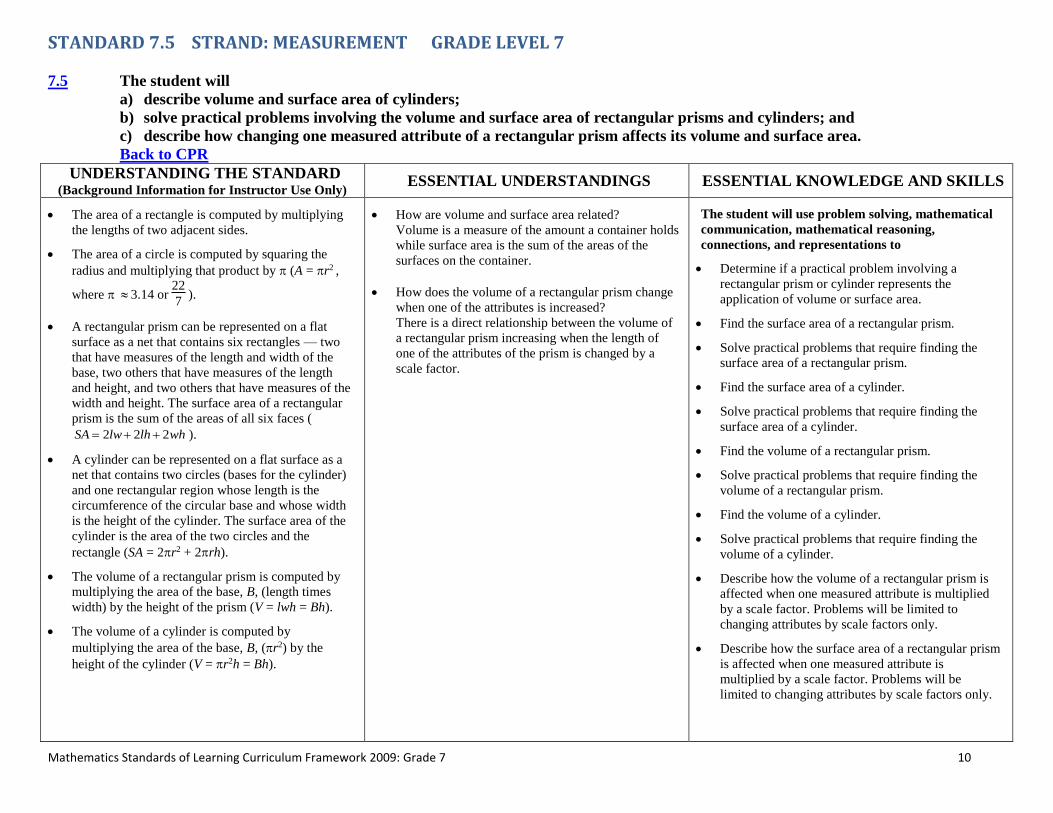
STANDARD 7.5 STRAND: MEASUREMENT GRADE LEVEL 7
Mathematics Standards of Learning Curriculum Framework 2009: Grade 7 10
7.5 The student will
a) describe volume and surface area of cylinders;
b) solve practical problems involving the volume and surface area of rectangular prisms and cylinders; and
c) describe how changing one measured attribute of a rectangular prism affects its volume and surface area.
Back to CPR
UNDERSTANDING THE STANDARD (Background Information for Instructor Use Only)
ESSENTIAL UNDERSTANDINGS ESSENTIAL KNOWLEDGE AND SKILLS
The area of a rectangle is computed by multiplying
the lengths of two adjacent sides.
The area of a circle is computed by squaring the
radius and multiplying that product by (A = r2 ,
where 3.14 or 22
7 ).
A rectangular prism can be represented on a flat
surface as a net that contains six rectangles — two
that have measures of the length and width of the
base, two others that have measures of the length
and height, and two others that have measures of the
width and height. The surface area of a rectangular
prism is the sum of the areas of all six faces (
2 2 2SA lw lh wh ).
A cylinder can be represented on a flat surface as a
net that contains two circles (bases for the cylinder)
and one rectangular region whose length is the
circumference of the circular base and whose width
is the height of the cylinder. The surface area of the
cylinder is the area of the two circles and the
rectangle (SA = 2r2 + 2rh).
The volume of a rectangular prism is computed by
multiplying the area of the base, B, (length times
width) by the height of the prism (V = lwh = Bh).
The volume of a cylinder is computed by
multiplying the area of the base, B, (r2) by the
height of the cylinder (V = r2h = Bh).
How are volume and surface area related?
Volume is a measure of the amount a container holds
while surface area is the sum of the areas of the
surfaces on the container.
How does the volume of a rectangular prism change
when one of the attributes is increased?
There is a direct relationship between the volume of
a rectangular prism increasing when the length of
one of the attributes of the prism is changed by a
scale factor.
The student will use problem solving, mathematical
communication, mathematical reasoning,
connections, and representations to
Determine if a practical problem involving a
rectangular prism or cylinder represents the
application of volume or surface area.
Find the surface area of a rectangular prism.
Solve practical problems that require finding the
surface area of a rectangular prism.
Find the surface area of a cylinder.
Solve practical problems that require finding the
surface area of a cylinder.
Find the volume of a rectangular prism.
Solve practical problems that require finding the
volume of a rectangular prism.
Find the volume of a cylinder.
Solve practical problems that require finding the
volume of a cylinder.
Describe how the volume of a rectangular prism is
affected when one measured attribute is multiplied
by a scale factor. Problems will be limited to
changing attributes by scale factors only.
Describe how the surface area of a rectangular prism
is affected when one measured attribute is
multiplied by a scale factor. Problems will be
limited to changing attributes by scale factors only.
STANDARD 7.5 STRAND: MEASUREMENT GRADE LEVEL 7
Mathematics Standards of Learning Curriculum Framework 2009: Grade 7 11
7.5 The student will
a) describe volume and surface area of cylinders;
b) solve practical problems involving the volume and surface area of rectangular prisms and cylinders; and
c) describe how changing one measured attribute of a rectangular prism affects its volume and surface area.
Back to CPR
UNDERSTANDING THE STANDARD (Background Information for Instructor Use Only)
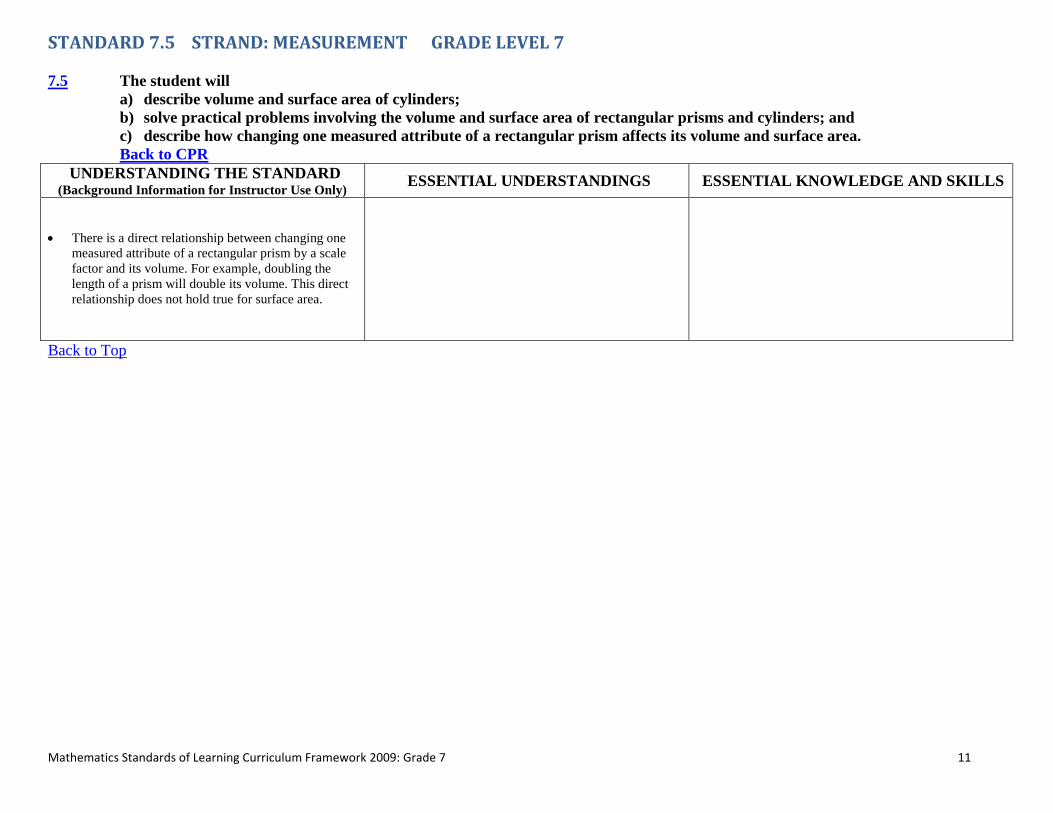
ESSENTIAL UNDERSTANDINGS ESSENTIAL KNOWLEDGE AND SKILLS
There is a direct relationship between changing one
measured attribute of a rectangular prism by a scale
factor and its volume. For example, doubling the
length of a prism will double its volume. This direct
relationship does not hold true for surface area.
Back to Top
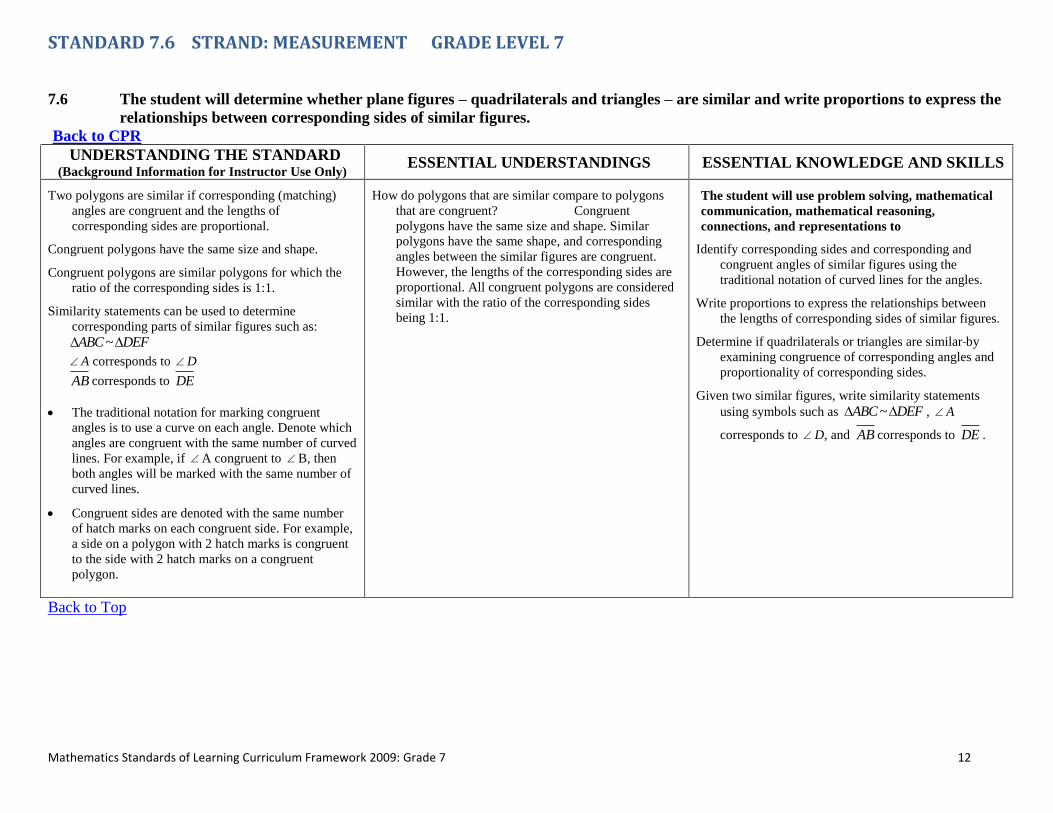
STANDARD 7.6 STRAND: MEASUREMENT GRADE LEVEL 7
Mathematics Standards of Learning Curriculum Framework 2009: Grade 7 12
7.6 The student will determine whether plane figures – quadrilaterals and triangles – are similar and write proportions to express the
relationships between corresponding sides of similar figures.
Back to CPR
UNDERSTANDING THE STANDARD (Background Information for Instructor Use Only)
ESSENTIAL UNDERSTANDINGS ESSENTIAL KNOWLEDGE AND SKILLS
Two polygons are similar if corresponding (matching)
angles are congruent and the lengths of
corresponding sides are proportional.
Congruent polygons have the same size and shape.
Congruent polygons are similar polygons for which the
ratio of the corresponding sides is 1:1.
Similarity statements can be used to determine
corresponding parts of similar figures such as:
~ABC DEF
A corresponds to D
AB corresponds to DE
The traditional notation for marking congruent
angles is to use a curve on each angle. Denote which
angles are congruent with the same number of curved
lines. For example, if A congruent to B, then
both angles will be marked with the same number of
curved lines.
Congruent sides are denoted with the same number
of hatch marks on each congruent side. For example,
a side on a polygon with 2 hatch marks is congruent
to the side with 2 hatch marks on a congruent
polygon.
How do polygons that are similar compare to polygons
that are congruent? Congruent
polygons have the same size and shape. Similar
polygons have the same shape, and corresponding
angles between the similar figures are congruent.
However, the lengths of the corresponding sides are
proportional. All congruent polygons are considered
similar with the ratio of the corresponding sides
being 1:1.
The student will use problem solving, mathematical
communication, mathematical reasoning,
connections, and representations to
Identify corresponding sides and corresponding and
congruent angles of similar figures using the
traditional notation of curved lines for the angles.
Write proportions to express the relationships between
the lengths of corresponding sides of similar figures.
Determine if quadrilaterals or triangles are similar by
examining congruence of corresponding angles and
proportionality of corresponding sides.
Given two similar figures, write similarity statements
using symbols such as ~ABC DEF , A
corresponds to D, and AB corresponds to DE .
Back to Top
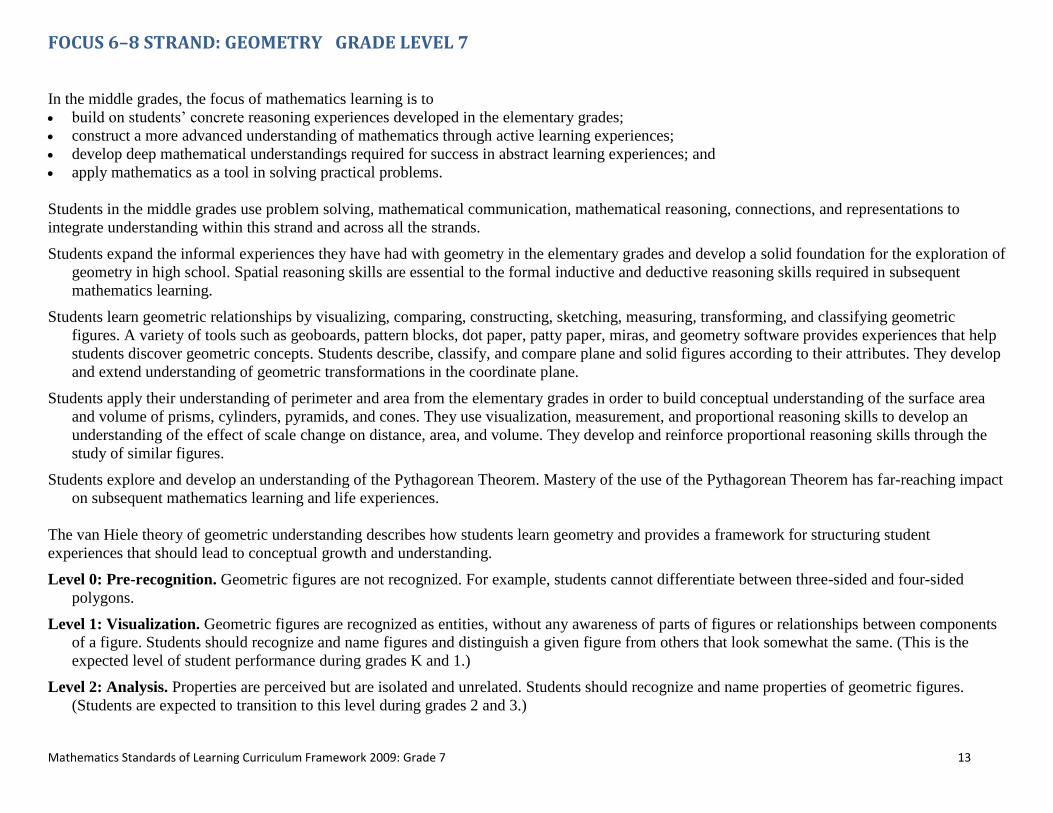
FOCUS 6–8 STRAND: GEOMETRY GRADE LEVEL 7
Mathematics Standards of Learning Curriculum Framework 2009: Grade 7 13
In the middle grades, the focus of mathematics learning is to
build on students’ concrete reasoning experiences developed in the elementary grades;
construct a more advanced understanding of mathematics through active learning experiences;
develop deep mathematical understandings required for success in abstract learning experiences; and
apply mathematics as a tool in solving practical problems.
Students in the middle grades use problem solving, mathematical communication, mathematical reasoning, connections, and representations to
integrate understanding within this strand and across all the strands.
Students expand the informal experiences they have had with geometry in the elementary grades and develop a solid foundation for the exploration of
geometry in high school. Spatial reasoning skills are essential to the formal inductive and deductive reasoning skills required in subsequent
mathematics learning.
Students learn geometric relationships by visualizing, comparing, constructing, sketching, measuring, transforming, and classifying geometric
figures. A variety of tools such as geoboards, pattern blocks, dot paper, patty paper, miras, and geometry software provides experiences that help
students discover geometric concepts. Students describe, classify, and compare plane and solid figures according to their attributes. They develop
and extend understanding of geometric transformations in the coordinate plane.
Students apply their understanding of perimeter and area from the elementary grades in order to build conceptual understanding of the surface area
and volume of prisms, cylinders, pyramids, and cones. They use visualization, measurement, and proportional reasoning skills to develop an
understanding of the effect of scale change on distance, area, and volume. They develop and reinforce proportional reasoning skills through the
study of similar figures.
Students explore and develop an understanding of the Pythagorean Theorem. Mastery of the use of the Pythagorean Theorem has far-reaching impact
on subsequent mathematics learning and life experiences.
The van Hiele theory of geometric understanding describes how students learn geometry and provides a framework for structuring student
experiences that should lead to conceptual growth and understanding.
Level 0: Pre-recognition. Geometric figures are not recognized. For example, students cannot differentiate between three-sided and four-sided
polygons.
Level 1: Visualization. Geometric figures are recognized as entities, without any awareness of parts of figures or relationships between components
of a figure. Students should recognize and name figures and distinguish a given figure from others that look somewhat the same. (This is the
expected level of student performance during grades K and 1.)
Level 2: Analysis. Properties are perceived but are isolated and unrelated. Students should recognize and name properties of geometric figures.
(Students are expected to transition to this level during grades 2 and 3.)
FOCUS 6–8 STRAND: GEOMETRY GRADE LEVEL 7
Mathematics Standards of Learning Curriculum Framework 2009: Grade 7 14
Level 3: Abstraction. Definitions are meaningful, with relationships being perceived between properties and between figures. Logical implications
and class inclusions are understood, but the role and significance of deduction is not understood. (Students should transition to this level during
grades 5 and 6 and fully attain it before taking algebra.)
Level 4: Deduction. Students can construct proofs, understand the role of axioms and definitions, and know the meaning of necessary and sufficient
conditions. Students should be able to supply reasons for steps in a proof. (Students should transition to this level before taking geometry.)
STANDARD 7.7 STRAND: GEOMETRY GRADE LEVEL 7
Mathematics Standards of Learning Curriculum Framework 2009: Grade 7 15
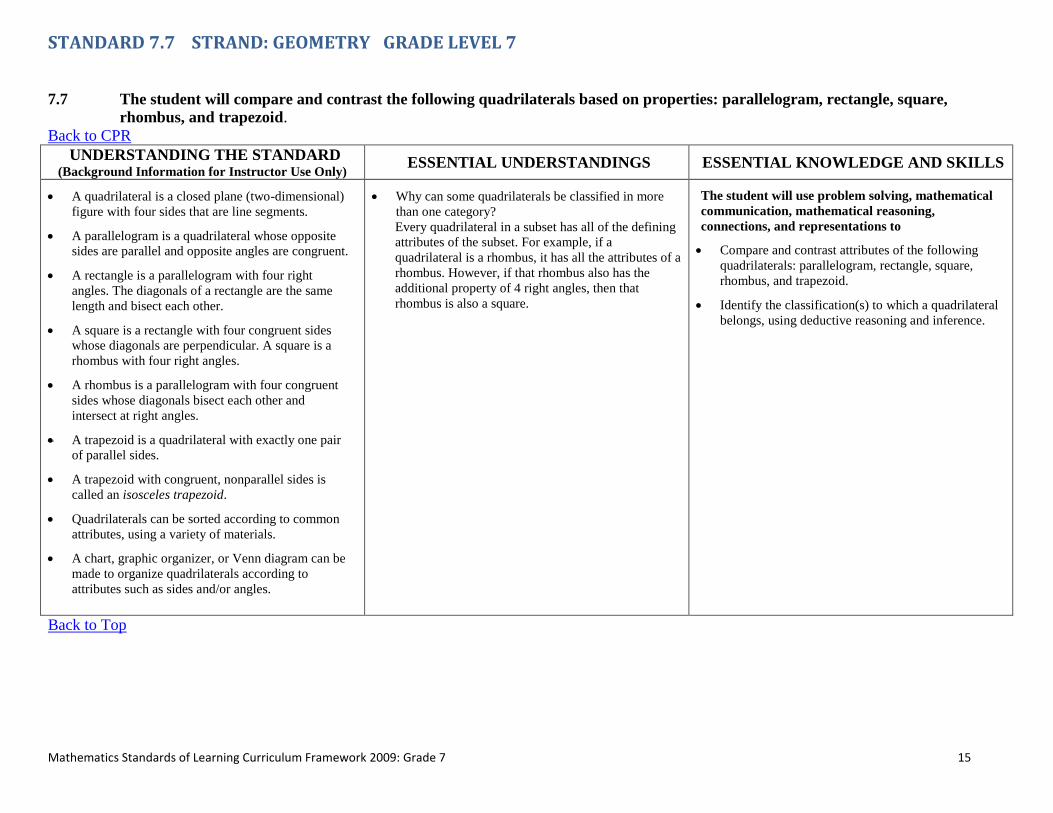
7.7 The student will compare and contrast the following quadrilaterals based on properties: parallelogram, rectangle, square,
rhombus, and trapezoid.
Back to CPR
UNDERSTANDING THE STANDARD (Background Information for Instructor Use Only)
ESSENTIAL UNDERSTANDINGS ESSENTIAL KNOWLEDGE AND SKILLS
A quadrilateral is a closed plane (two-dimensional)
figure with four sides that are line segments.
A parallelogram is a quadrilateral whose opposite
sides are parallel and opposite angles are congruent.
A rectangle is a parallelogram with four right
angles. The diagonals of a rectangle are the same
length and bisect each other.
A square is a rectangle with four congruent sides
whose diagonals are perpendicular. A square is a
rhombus with four right angles.
A rhombus is a parallelogram with four congruent
sides whose diagonals bisect each other and
intersect at right angles.
A trapezoid is a quadrilateral with exactly one pair
of parallel sides.
A trapezoid with congruent, nonparallel sides is
called an isosceles trapezoid.
Quadrilaterals can be sorted according to common
attributes, using a variety of materials.
A chart, graphic organizer, or Venn diagram can be
made to organize quadrilaterals according to
attributes such as sides and/or angles.
Why can some quadrilaterals be classified in more
than one category?
Every quadrilateral in a subset has all of the defining
attributes of the subset. For example, if a
quadrilateral is a rhombus, it has all the attributes of a
rhombus. However, if that rhombus also has the
additional property of 4 right angles, then that
rhombus is also a square.
The student will use problem solving, mathematical
communication, mathematical reasoning,
connections, and representations to
Compare and contrast attributes of the following
quadrilaterals: parallelogram, rectangle, square,
rhombus, and trapezoid.
Identify the classification(s) to which a quadrilateral
belongs, using deductive reasoning and inference.
Back to Top
STANDARD 7.8 STRAND: GEOMETRY GRADE LEVEL 7
Mathematics Standards of Learning Curriculum Framework 2009: Grade 7 16
7.8 The student, given a polygon in the coordinate plane, will represent transformations (reflections, dilations, rotations, and
translations) by graphing in the coordinate plane.
Back to CPR
UNDERSTANDING THE STANDARD (Background Information for Instructor Use Only)
ESSENTIAL UNDERSTANDINGS ESSENTIAL KNOWLEDGE AND SKILLS
A rotation of a geometric figure is a turn of the figure
around a fixed point. The point may or may not be on
the figure. The fixed point is called the center of
rotation.
A translation of a geometric figure is a slide of the
figure in which all the points on the figure move the
same distance in the same direction.
A reflection is a transformation that reflects a figure
across a line in the plane.
A dilation of a geometric figure is a transformation
that changes the size of a figure by scale factor to
create a similar figure.
The image of a polygon is the resulting polygon
after the transformation. The preimage is the
polygon before the transformation.
A transformation of preimage point A can be
denoted as the image A (read as “A prime”).
How does the transformation of a figure affect the
size, shape and position of that figure?
Translations, rotations and reflections do not change
the size or shape of a figure. A dilation of a figure
and the original figure are similar. Reflections,
translations and rotations usually change the position
of the figure.
The student will use problem solving, mathematical
communication, mathematical reasoning,
connections, and representations to
Identify the coordinates of the image of a right triangle
or rectangle that has been translated either
vertically, horizontally, or a combination of a
vertical and horizontal translation.
Identify the coordinates of the image of a right triangle
or rectangle that has been rotated 90° or 180° about
the origin.
Identify the coordinates of the image of a right triangle
or a rectangle that has been reflected over the x- or
y-axis.
Identify the coordinates of a right triangle or rectangle
that has been dilated. The center of the dilation will
be the origin.
Sketch the image of a right triangle or rectangle
translated vertically or horizontally.
Sketch the image of a right triangle or rectangle that has
been rotated 90° or 180° about the origin.
Sketch the image of a right triangle or rectangle that has
been reflected over the x- or y-axis.
Sketch the image of a dilation of a right triangle or
rectangle limited to a scale factor of1
4,
1
2, 2, 3 or 4.
Back to Top
FOCUS 6–8 STRAND: PROBABILITY AND STATISTICS GRADE LEVEL 7
Mathematics Standards of Learning Curriculum Framework 2009: Grade 7 17
In the middle grades, the focus of mathematics learning is to
build on students’ concrete reasoning experiences developed in the elementary grades;
construct a more advanced understanding of mathematics through active learning experiences;
develop deep mathematical understandings required for success in abstract learning experiences; and
apply mathematics as a tool in solving practical problems.
Students in the middle grades use problem solving, mathematical communication, mathematical reasoning, connections, and representations to
integrate understanding within this strand and across all the strands.
Students develop an awareness of the power of data analysis and probability by building on their natural curiosity about data and making predictions.
Students explore methods of data collection and use technology to represent data with various types of graphs. They learn that different types of
graphs represent different types of data effectively. They use measures of center and dispersion to analyze and interpret data.
Students integrate their understanding of rational numbers and proportional reasoning into the study of statistics and probability.
Students explore experimental and theoretical probability through experiments and simulations by using concrete, active learning activities.
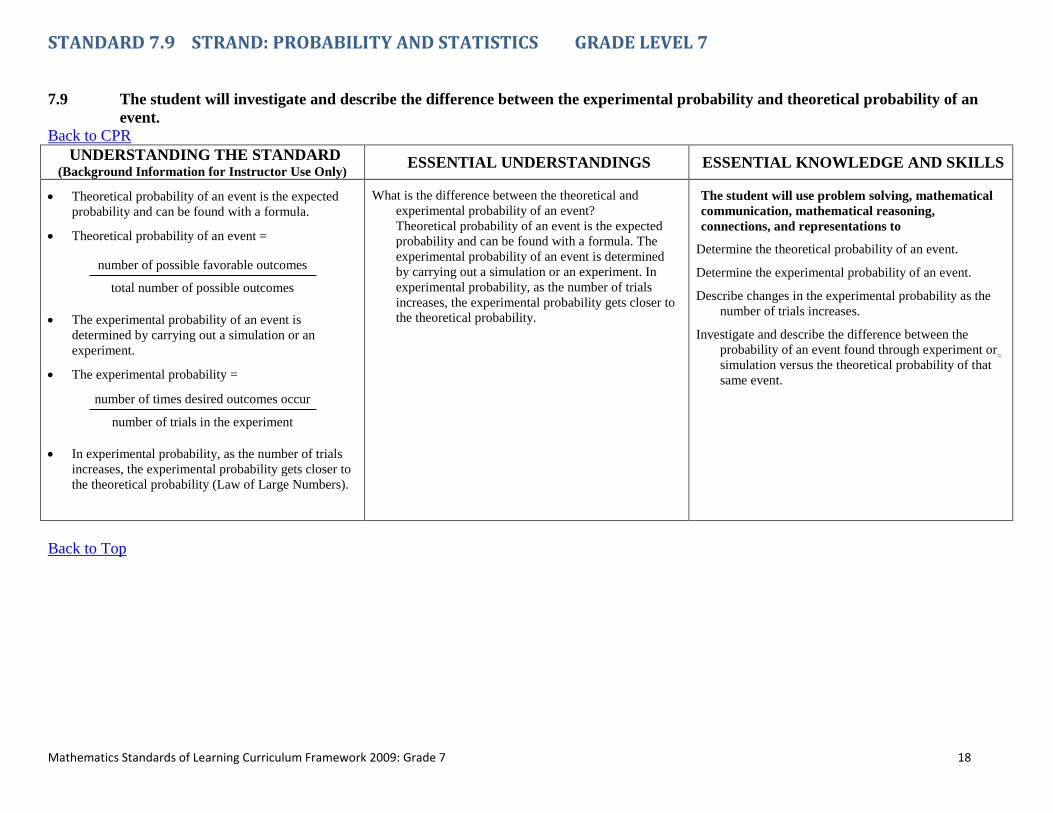
STANDARD 7.9 STRAND: PROBABILITY AND STATISTICS GRADE LEVEL 7
Mathematics Standards of Learning Curriculum Framework 2009: Grade 7 18
7.9 The student will investigate and describe the difference between the experimental probability and theoretical probability of an
event.
Back to CPR
UNDERSTANDING THE STANDARD (Background Information for Instructor Use Only)
ESSENTIAL UNDERSTANDINGS ESSENTIAL KNOWLEDGE AND SKILLS
Theoretical probability of an event is the expected
probability and can be found with a formula.
Theoretical probability of an event =
number of possible favorable outcomes
total number of possible outcomes
The experimental probability of an event is
determined by carrying out a simulation or an
experiment.
The experimental probability =
number of times desired outcomes occur
number of trials in the experiment
In experimental probability, as the number of trials
increases, the experimental probability gets closer to
the theoretical probability (Law of Large Numbers).
What is the difference between the theoretical and
experimental probability of an event?
Theoretical probability of an event is the expected
probability and can be found with a formula. The
experimental probability of an event is determined
by carrying out a simulation or an experiment. In
experimental probability, as the number of trials
increases, the experimental probability gets closer to
the theoretical probability.
The student will use problem solving, mathematical
communication, mathematical reasoning,
connections, and representations to
Determine the theoretical probability of an event.
Determine the experimental probability of an event.
Describe changes in the experimental probability as the
number of trials increases.
Investigate and describe the difference between the
probability of an event found through experiment or
simulation versus the theoretical probability of that
same event.
Back to Top
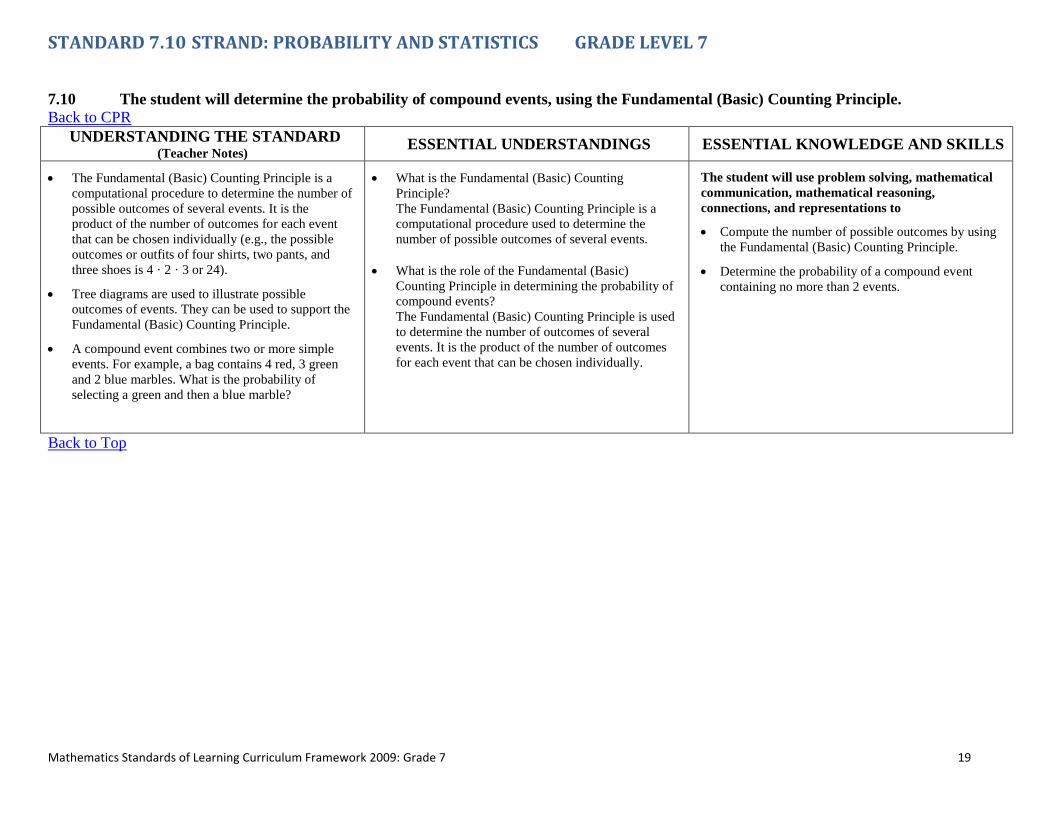
STANDARD 7.10 STRAND: PROBABILITY AND STATISTICS GRADE LEVEL 7
Mathematics Standards of Learning Curriculum Framework 2009: Grade 7 19
7.10 The student will determine the probability of compound events, using the Fundamental (Basic) Counting Principle.
Back to CPR
UNDERSTANDING THE STANDARD (Teacher Notes)
ESSENTIAL UNDERSTANDINGS ESSENTIAL KNOWLEDGE AND SKILLS
The Fundamental (Basic) Counting Principle is a
computational procedure to determine the number of
possible outcomes of several events. It is the
product of the number of outcomes for each event
that can be chosen individually (e.g., the possible
outcomes or outfits of four shirts, two pants, and
three shoes is 4 · 2 · 3 or 24).
Tree diagrams are used to illustrate possible
outcomes of events. They can be used to support the
Fundamental (Basic) Counting Principle.
A compound event combines two or more simple
events. For example, a bag contains 4 red, 3 green
and 2 blue marbles. What is the probability of
selecting a green and then a blue marble?
What is the Fundamental (Basic) Counting
Principle?
The Fundamental (Basic) Counting Principle is a
computational procedure used to determine the
number of possible outcomes of several events.
What is the role of the Fundamental (Basic)
Counting Principle in determining the probability of
compound events?
The Fundamental (Basic) Counting Principle is used
to determine the number of outcomes of several
events. It is the product of the number of outcomes
for each event that can be chosen individually.
The student will use problem solving, mathematical
communication, mathematical reasoning,
connections, and representations to
Compute the number of possible outcomes by using
the Fundamental (Basic) Counting Principle.
Determine the probability of a compound event
containing no more than 2 events.
Back to Top
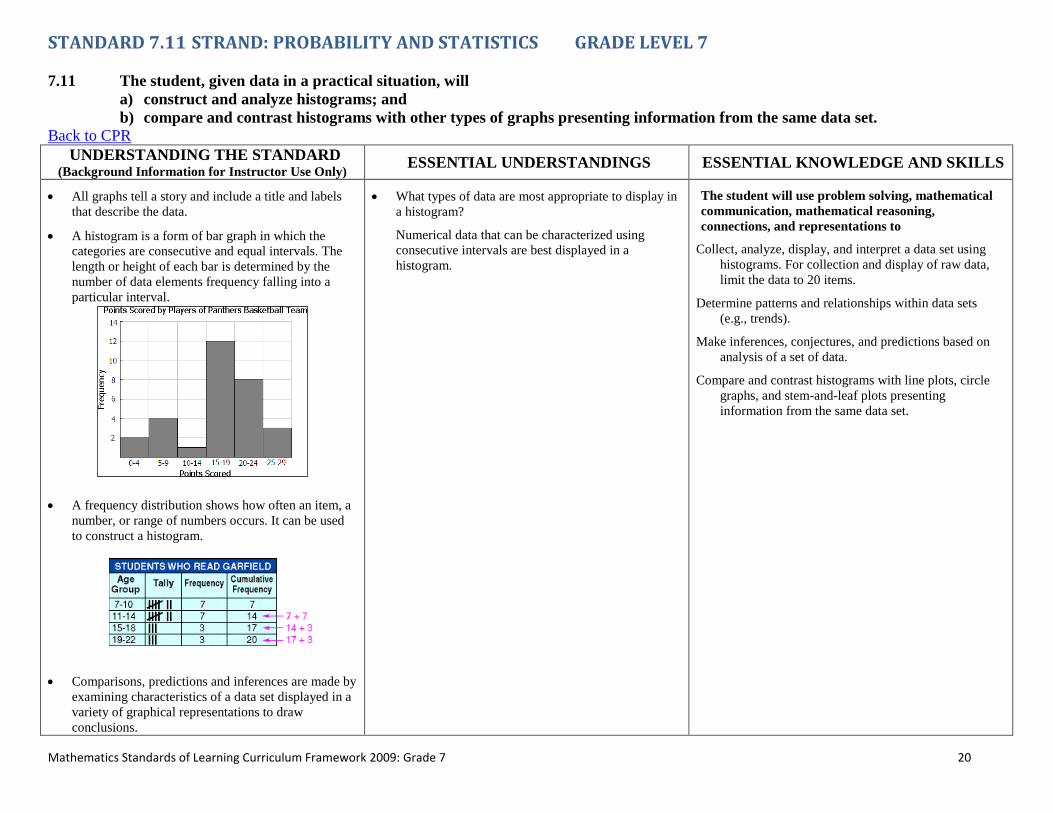
STANDARD 7.11 STRAND: PROBABILITY AND STATISTICS GRADE LEVEL 7
Mathematics Standards of Learning Curriculum Framework 2009: Grade 7 20
7.11 The student, given data in a practical situation, will
a) construct and analyze histograms; and
b) compare and contrast histograms with other types of graphs presenting information from the same data set.
Back to CPR
UNDERSTANDING THE STANDARD (Background Information for Instructor Use Only)
ESSENTIAL UNDERSTANDINGS ESSENTIAL KNOWLEDGE AND SKILLS
All graphs tell a story and include a title and labels
that describe the data.
A histogram is a form of bar graph in which the
categories are consecutive and equal intervals. The
length or height of each bar is determined by the
number of data elements frequency falling into a
particular interval.
A frequency distribution shows how often an item, a
number, or range of numbers occurs. It can be used
to construct a histogram.
Comparisons, predictions and inferences are made by
examining characteristics of a data set displayed in a
variety of graphical representations to draw
conclusions.
What types of data are most appropriate to display in
a histogram?
Numerical data that can be characterized using
consecutive intervals are best displayed in a
histogram.
The student will use problem solving, mathematical
communication, mathematical reasoning,
connections, and representations to
Collect, analyze, display, and interpret a data set using
histograms. For collection and display of raw data,
limit the data to 20 items.
Determine patterns and relationships within data sets
(e.g., trends).
Make inferences, conjectures, and predictions based on
analysis of a set of data.
Compare and contrast histograms with line plots, circle
graphs, and stem-and-leaf plots presenting
information from the same data set.
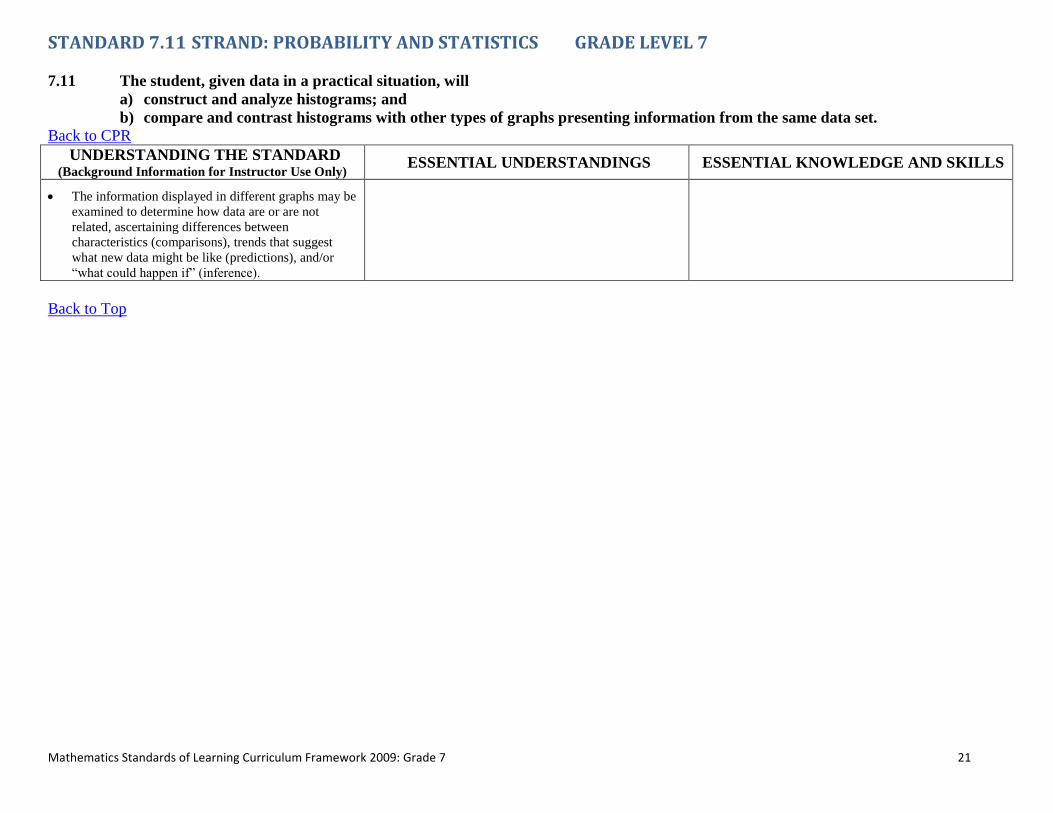
STANDARD 7.11 STRAND: PROBABILITY AND STATISTICS GRADE LEVEL 7
Mathematics Standards of Learning Curriculum Framework 2009: Grade 7 21
7.11 The student, given data in a practical situation, will
a) construct and analyze histograms; and
b) compare and contrast histograms with other types of graphs presenting information from the same data set.
Back to CPR
UNDERSTANDING THE STANDARD (Background Information for Instructor Use Only)
ESSENTIAL UNDERSTANDINGS ESSENTIAL KNOWLEDGE AND SKILLS
The information displayed in different graphs may be
examined to determine how data are or are not
related, ascertaining differences between
characteristics (comparisons), trends that suggest
what new data might be like (predictions), and/or
“what could happen if” (inference).
Back to Top
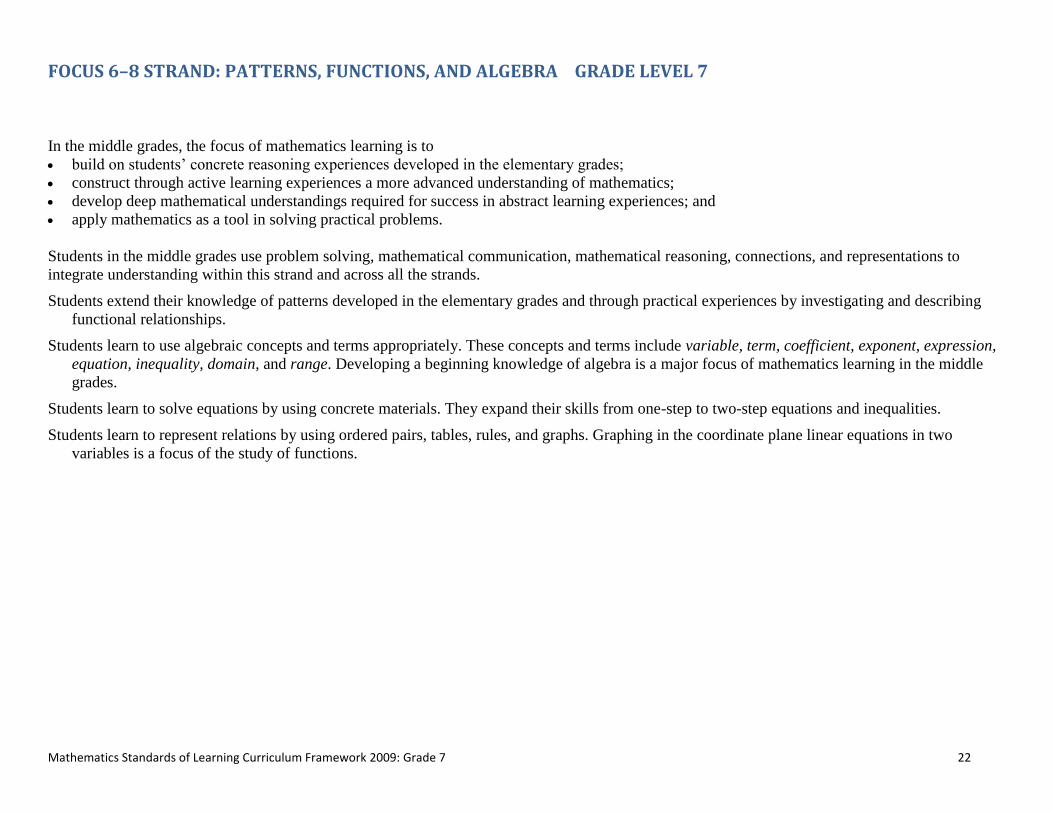
FOCUS 6–8 STRAND: PATTERNS, FUNCTIONS, AND ALGEBRA GRADE LEVEL 7
Mathematics Standards of Learning Curriculum Framework 2009: Grade 7 22
In the middle grades, the focus of mathematics learning is to
build on students’ concrete reasoning experiences developed in the elementary grades;
construct through active learning experiences a more advanced understanding of mathematics;
develop deep mathematical understandings required for success in abstract learning experiences; and
apply mathematics as a tool in solving practical problems.
Students in the middle grades use problem solving, mathematical communication, mathematical reasoning, connections, and representations to
integrate understanding within this strand and across all the strands.
Students extend their knowledge of patterns developed in the elementary grades and through practical experiences by investigating and describing
functional relationships.
Students learn to use algebraic concepts and terms appropriately. These concepts and terms include variable, term, coefficient, exponent, expression,
equation, inequality, domain, and range. Developing a beginning knowledge of algebra is a major focus of mathematics learning in the middle
grades.
Students learn to solve equations by using concrete materials. They expand their skills from one-step to two-step equations and inequalities.
Students learn to represent relations by using ordered pairs, tables, rules, and graphs. Graphing in the coordinate plane linear equations in two
variables is a focus of the study of functions.
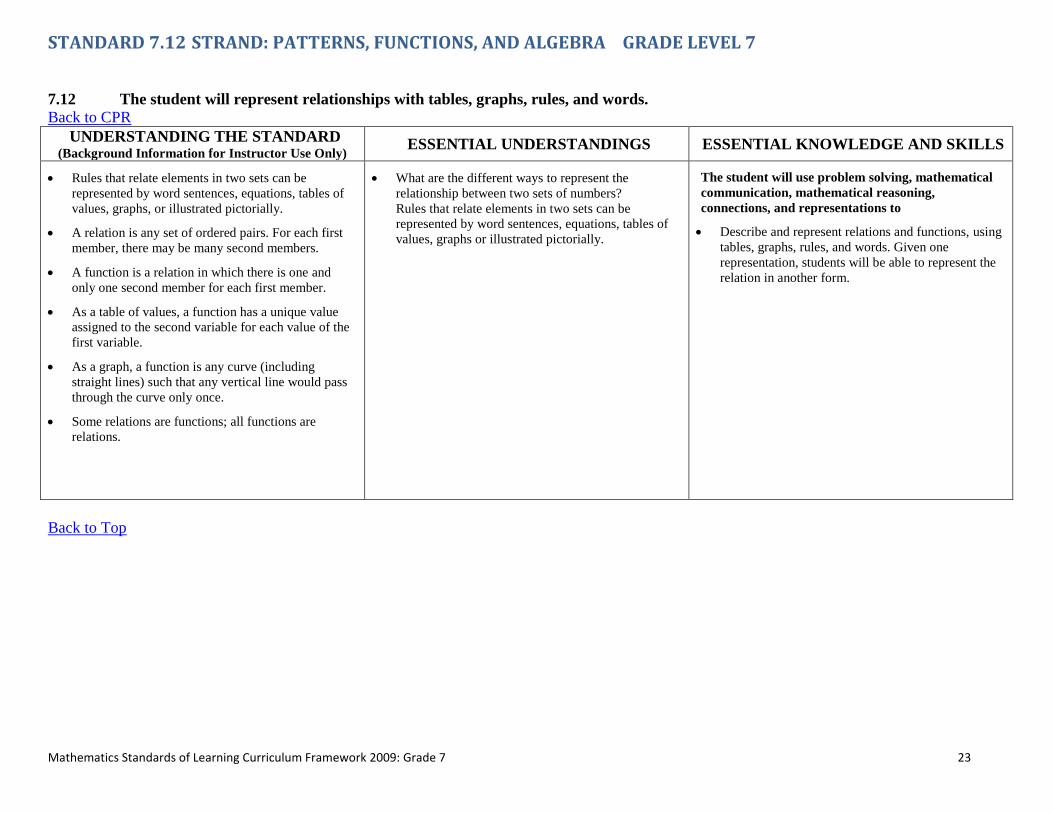
STANDARD 7.12 STRAND: PATTERNS, FUNCTIONS, AND ALGEBRA GRADE LEVEL 7
Mathematics Standards of Learning Curriculum Framework 2009: Grade 7 23
7.12 The student will represent relationships with tables, graphs, rules, and words.
Back to CPR
UNDERSTANDING THE STANDARD (Background Information for Instructor Use Only)
ESSENTIAL UNDERSTANDINGS ESSENTIAL KNOWLEDGE AND SKILLS
Rules that relate elements in two sets can be
represented by word sentences, equations, tables of
values, graphs, or illustrated pictorially.
A relation is any set of ordered pairs. For each first
member, there may be many second members.
A function is a relation in which there is one and
only one second member for each first member.
As a table of values, a function has a unique value
assigned to the second variable for each value of the
first variable.
As a graph, a function is any curve (including
straight lines) such that any vertical line would pass
through the curve only once.
Some relations are functions; all functions are
relations.
What are the different ways to represent the
relationship between two sets of numbers?
Rules that relate elements in two sets can be
represented by word sentences, equations, tables of
values, graphs or illustrated pictorially.
The student will use problem solving, mathematical
communication, mathematical reasoning,
connections, and representations to
Describe and represent relations and functions, using
tables, graphs, rules, and words. Given one
representation, students will be able to represent the
relation in another form.
Back to Top
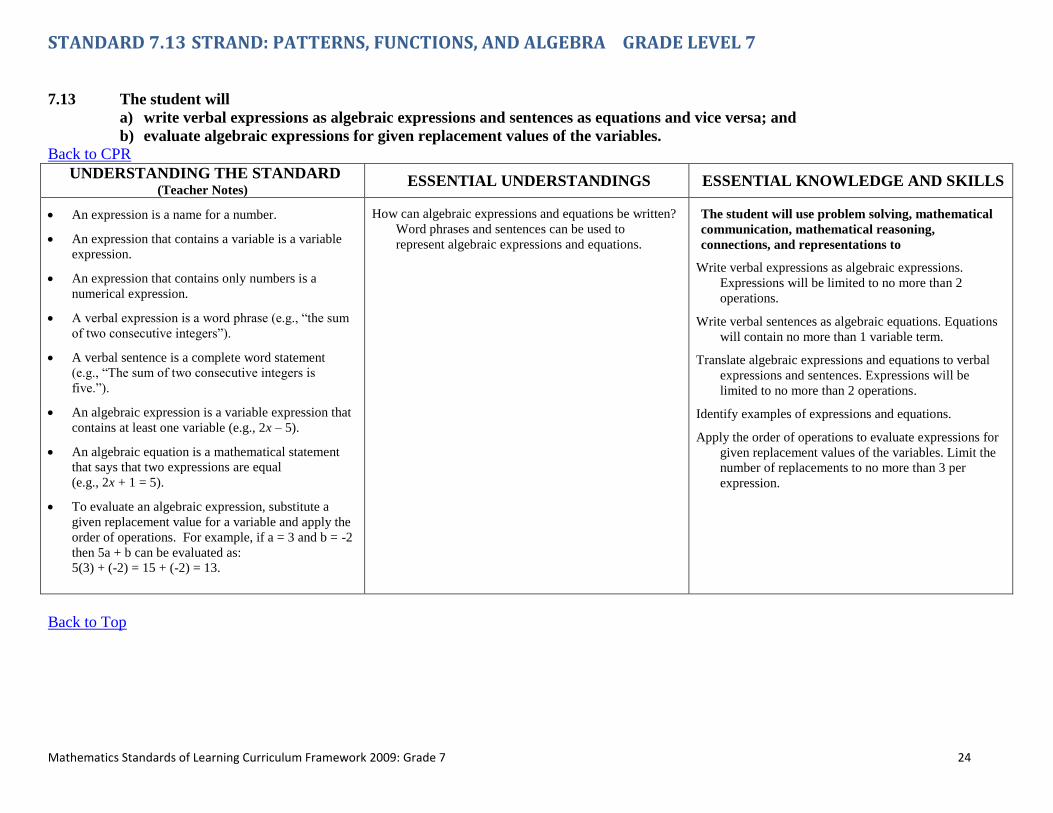
STANDARD 7.13 STRAND: PATTERNS, FUNCTIONS, AND ALGEBRA GRADE LEVEL 7
Mathematics Standards of Learning Curriculum Framework 2009: Grade 7 24
7.13 The student will
a) write verbal expressions as algebraic expressions and sentences as equations and vice versa; and
b) evaluate algebraic expressions for given replacement values of the variables.
Back to CPR
UNDERSTANDING THE STANDARD (Teacher Notes)
ESSENTIAL UNDERSTANDINGS ESSENTIAL KNOWLEDGE AND SKILLS
An expression is a name for a number.
An expression that contains a variable is a variable
expression.
An expression that contains only numbers is a
numerical expression.
A verbal expression is a word phrase (e.g., “the sum
of two consecutive integers”).
A verbal sentence is a complete word statement
(e.g., “The sum of two consecutive integers is
five.”).
An algebraic expression is a variable expression that
contains at least one variable (e.g., 2x – 5).
An algebraic equation is a mathematical statement
that says that two expressions are equal
(e.g., 2x + 1 = 5).
To evaluate an algebraic expression, substitute a
given replacement value for a variable and apply the
order of operations. For example, if a = 3 and b = -2
then 5a + b can be evaluated as:
5(3) + (-2) = 15 + (-2) = 13.
How can algebraic expressions and equations be written?
Word phrases and sentences can be used to
represent algebraic expressions and equations.
The student will use problem solving, mathematical
communication, mathematical reasoning,
connections, and representations to
Write verbal expressions as algebraic expressions.
Expressions will be limited to no more than 2
operations.
Write verbal sentences as algebraic equations. Equations
will contain no more than 1 variable term.
Translate algebraic expressions and equations to verbal
expressions and sentences. Expressions will be
limited to no more than 2 operations.
Identify examples of expressions and equations.
Apply the order of operations to evaluate expressions for
given replacement values of the variables. Limit the
number of replacements to no more than 3 per
expression.
Back to Top
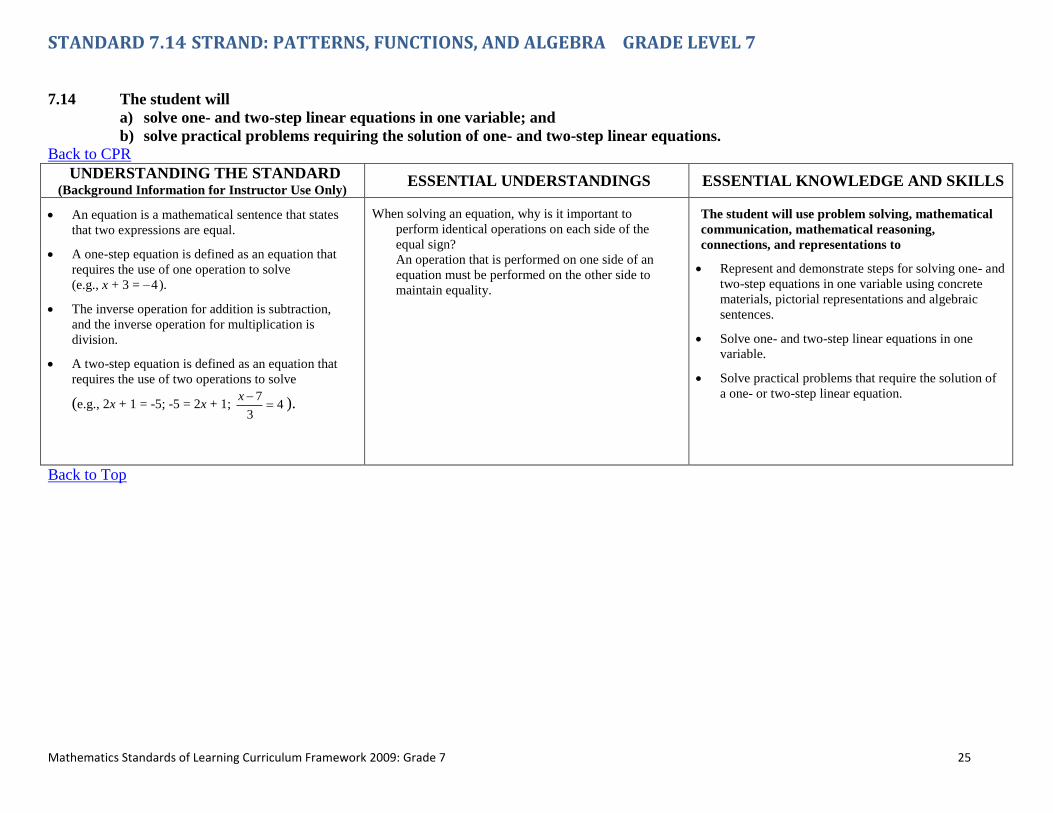
STANDARD 7.14 STRAND: PATTERNS, FUNCTIONS, AND ALGEBRA GRADE LEVEL 7
Mathematics Standards of Learning Curriculum Framework 2009: Grade 7 25
7.14 The student will
a) solve one- and two-step linear equations in one variable; and
b) solve practical problems requiring the solution of one- and two-step linear equations.
Back to CPR
UNDERSTANDING THE STANDARD (Background Information for Instructor Use Only)
ESSENTIAL UNDERSTANDINGS ESSENTIAL KNOWLEDGE AND SKILLS
An equation is a mathematical sentence that states
that two expressions are equal.
A one-step equation is defined as an equation that
requires the use of one operation to solve
(e.g., x + 3 = –4).
The inverse operation for addition is subtraction,
and the inverse operation for multiplication is
division.
A two-step equation is defined as an equation that
requires the use of two operations to solve
(e.g., 2x + 1 = -5; -5 = 2x + 1; 7
43
x ).
When solving an equation, why is it important to
perform identical operations on each side of the
equal sign?
An operation that is performed on one side of an
equation must be performed on the other side to
maintain equality.
The student will use problem solving, mathematical
communication, mathematical reasoning,
connections, and representations to
Represent and demonstrate steps for solving one- and
two-step equations in one variable using concrete
materials, pictorial representations and algebraic
sentences.
Solve one- and two-step linear equations in one
variable.
Solve practical problems that require the solution of
a one- or two-step linear equation.
Back to Top
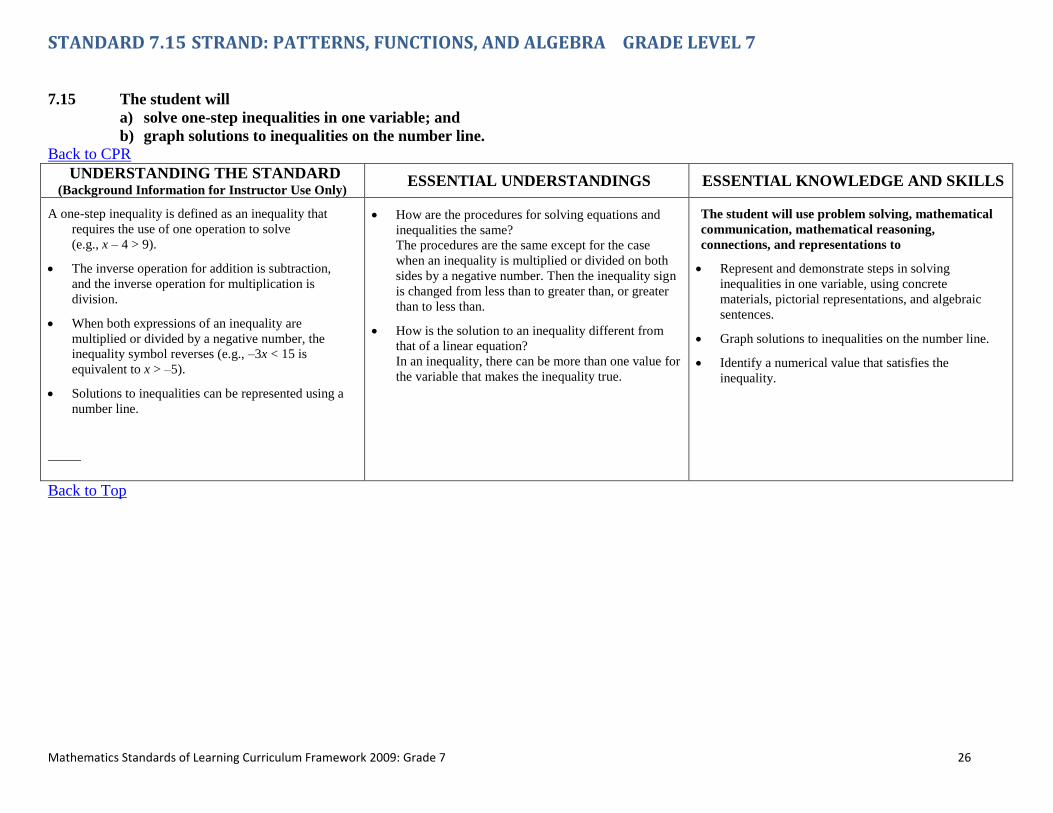
STANDARD 7.15 STRAND: PATTERNS, FUNCTIONS, AND ALGEBRA GRADE LEVEL 7
Mathematics Standards of Learning Curriculum Framework 2009: Grade 7 26
7.15 The student will
a) solve one-step inequalities in one variable; and
b) graph solutions to inequalities on the number line.
Back to CPR
UNDERSTANDING THE STANDARD (Background Information for Instructor Use Only)
ESSENTIAL UNDERSTANDINGS ESSENTIAL KNOWLEDGE AND SKILLS
A one-step inequality is defined as an inequality that
requires the use of one operation to solve
(e.g., x – 4 > 9).
The inverse operation for addition is subtraction,
and the inverse operation for multiplication is
division.
When both expressions of an inequality are
multiplied or divided by a negative number, the
inequality symbol reverses (e.g., –3x < 15 is
equivalent to x > –5).
Solutions to inequalities can be represented using a
number line.
How are the procedures for solving equations and
inequalities the same?
The procedures are the same except for the case
when an inequality is multiplied or divided on both
sides by a negative number. Then the inequality sign
is changed from less than to greater than, or greater
than to less than.
How is the solution to an inequality different from
that of a linear equation?
In an inequality, there can be more than one value for
the variable that makes the inequality true.
The student will use problem solving, mathematical
communication, mathematical reasoning,
connections, and representations to
Represent and demonstrate steps in solving
inequalities in one variable, using concrete
materials, pictorial representations, and algebraic
sentences.
Graph solutions to inequalities on the number line.
Identify a numerical value that satisfies the
inequality.
Back to Top
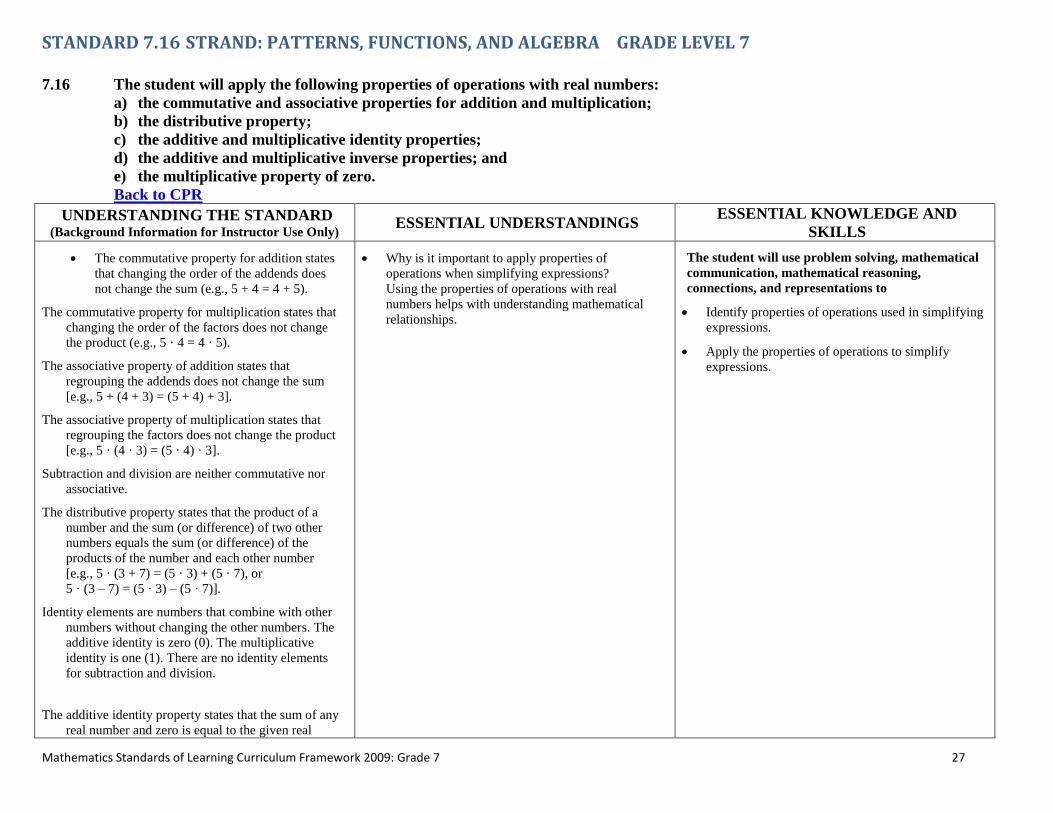
STANDARD 7.16 STRAND: PATTERNS, FUNCTIONS, AND ALGEBRA GRADE LEVEL 7
Mathematics Standards of Learning Curriculum Framework 2009: Grade 7 27
7.16 The student will apply the following properties of operations with real numbers:
a) the commutative and associative properties for addition and multiplication;
b) the distributive property;
c) the additive and multiplicative identity properties;
d) the additive and multiplicative inverse properties; and
e) the multiplicative property of zero.
Back to CPR
UNDERSTANDING THE STANDARD (Background Information for Instructor Use Only)
ESSENTIAL UNDERSTANDINGS ESSENTIAL KNOWLEDGE AND
SKILLS
The commutative property for addition states
that changing the order of the addends does
not change the sum (e.g., 5 + 4 = 4 + 5).
The commutative property for multiplication states that
changing the order of the factors does not change
the product (e.g., 5 · 4 = 4 · 5).
The associative property of addition states that
regrouping the addends does not change the sum
[e.g., 5 + (4 + 3) = (5 + 4) + 3].
The associative property of multiplication states that
regrouping the factors does not change the product
[e.g., 5 · (4 · 3) = (5 · 4) · 3].
Subtraction and division are neither commutative nor
associative.
The distributive property states that the product of a
number and the sum (or difference) of two other
numbers equals the sum (or difference) of the
products of the number and each other number
[e.g., 5 · (3 + 7) = (5 · 3) + (5 · 7), or
5 · (3 – 7) = (5 · 3) – (5 · 7)].
Identity elements are numbers that combine with other
numbers without changing the other numbers. The
additive identity is zero (0). The multiplicative
identity is one (1). There are no identity elements
for subtraction and division.
The additive identity property states that the sum of any
real number and zero is equal to the given real
Why is it important to apply properties of
operations when simplifying expressions?
Using the properties of operations with real
numbers helps with understanding mathematical
relationships.
The student will use problem solving, mathematical
communication, mathematical reasoning,
connections, and representations to
Identify properties of operations used in simplifying
expressions.
Apply the properties of operations to simplify
expressions.
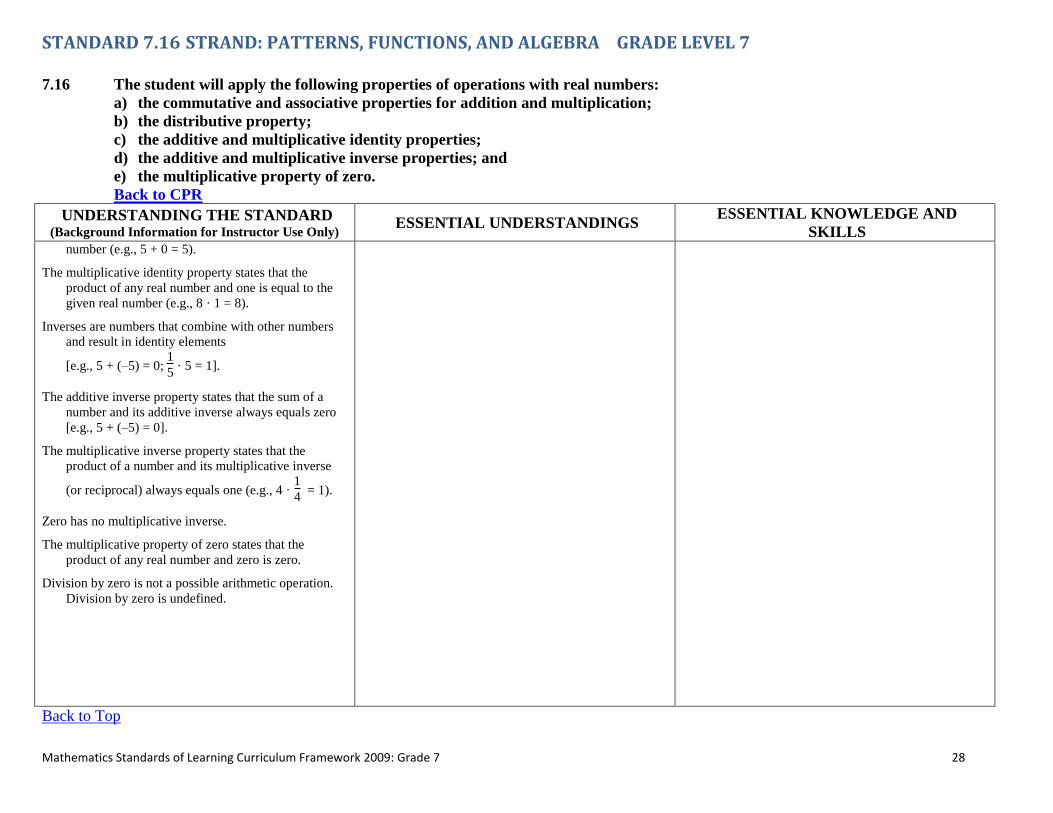
STANDARD 7.16 STRAND: PATTERNS, FUNCTIONS, AND ALGEBRA GRADE LEVEL 7
Mathematics Standards of Learning Curriculum Framework 2009: Grade 7 28
7.16 The student will apply the following properties of operations with real numbers:
a) the commutative and associative properties for addition and multiplication;
b) the distributive property;
c) the additive and multiplicative identity properties;
d) the additive and multiplicative inverse properties; and
e) the multiplicative property of zero.
Back to CPR
UNDERSTANDING THE STANDARD (Background Information for Instructor Use Only)
ESSENTIAL UNDERSTANDINGS ESSENTIAL KNOWLEDGE AND
SKILLS number (e.g., 5 + 0 = 5).
The multiplicative identity property states that the
product of any real number and one is equal to the
given real number (e.g., 8 · 1 = 8).
Inverses are numbers that combine with other numbers
and result in identity elements
[e.g., 5 + (–5) = 0; 1
5 · 5 = 1].
The additive inverse property states that the sum of a
number and its additive inverse always equals zero
[e.g., 5 + (–5) = 0].
The multiplicative inverse property states that the
product of a number and its multiplicative inverse
(or reciprocal) always equals one (e.g., 4 · 1
4 = 1).
Zero has no multiplicative inverse.
The multiplicative property of zero states that the
product of any real number and zero is zero.
Division by zero is not a possible arithmetic operation.
Division by zero is undefined.
Back to Top