Embed Size (px)
Citation preview
RICHLAND COUNTY, OHIO AND INCORPORATED AREAS Community Community Name Number BELLVILLE, VILLAGE OF 390604 BUTLER, VILLAGE OF 390605 LEXINGTON, VILLAGE OF 390618 LUCAS, VILLAGE OF 390661 MANSFIELD, CITY OF 390477 ONTARIO, VILLAGE OF 390478 PLYMOUTH, VILLAGE OF 390287 RICHLAND COUNTY, (UNINCORPORATED AREAS) 390476 SHELBY, CITY OF 390479 *SHILOH, VILLAGE OF 395508 *No Special Flood Hazard Area Identified
April 4, 2011
Federal Emergency Management Agency FLOOD INSURANCE STUDY NUMBER
39139CV000A
i
NOTICE TO FLOOD INSURANCE STUDY USERS
Communities participating in the National Flood Insurance Program have established repositories of flood hazard data for floodplain management and flood insurance purposes. This Flood Insurance Study (FIS) may not contain all data available within the repository. Please contact the Community Map Repository for any additional data. The Federal Emergency Management Agency (FEMA) may revise and republish part or all of this FIS at any time. In addition, part of this FIS report may be revised by the Letter of Map Revision process, which does not involve republication or redistribution of the FIS report. It is, therefore, the responsibility of the user to consult with community officials and to check the community repository to obtain the most current FIS report components.
Initial Countywide FIS Effective Date: April 4, 2011 Selected Flood Insurance Rate Map panels for this community contain information that was previously shown separately on the corresponding Flood Boundary and Floodway Map panels (e.g., floodways, cross-sections). In addition, former flood hazard zone designations have been changed as follows:
Old Zone(s) New Zone A1 through A30 AE B X (shaded) C X
ii
TABLE OF CONTENTS
Page
1.0 INTRODUCTION ........................................................................................................................... 1
1.1 Purpose of Study ................................................................................................................. 1
1.2 Authority and Acknowledgements ..................................................................................... 1
1.3 Coordination ....................................................................................................................... 3
2.0 AREA STUDIED ............................................................................................................................ 4
2.1 Scope of Study .................................................................................................................... 4
2.2 Community Description ...................................................................................................... 7
2.3 Principal Flood Problems .................................................................................................... 9
2.4 Flood Protection Measures ............................................................................................... 11
3.0 ENGINEERING METHODS ........................................................................................................ 11
3.1 Hydrologic Analyses ......................................................................................................... 12
3.2 Hydraulic Analyses ........................................................................................................... 17
3.3 Vertical Datum .................................................................................................................. 22
4.0 FLOODPLAIN MANAGEMENT APPLICATIONS ................................................................... 23
4.1 Floodplain Boundaries ...................................................................................................... 23
4.2 Floodways ......................................................................................................................... 24
5.0 INSURANCE APPLICATION ..................................................................................................... 44
6.0 FLOOD INSURANCE RATE MAP ............................................................................................. 44
7.0 OTHER STUDIES ......................................................................................................................... 45
8.0 LOCATION OF DATA ................................................................................................................. 45
9.0 BIBLIOGRAPHY AND REFERENCES ...................................................................................... 47
iii
TABLE OF CONTENTS (Continued)
LIST OF FIGURES Page
Figure 1 – Floodway Schematic ................................................................................................................. 25
LIST OF TABLES Page
Table 1 – CCO Meeting Dates for Pre-Countywide FISs ............................................................................. 3
Table 2 – Streams Studied by Detailed Methods .......................................................................................... 4
Table 3 – Streams Studied By Approximate Method ................................................................................... 5
Table 4 – Limits of Detailed Studies (from Prior Studies) ........................................................................... 6
Table 5 – Incorporated LOMRs .................................................................................................................... 7
Table 6 – Summary of Discharges for Detailed Studies ............................................................................. 15
Table 7 – Manning’s “n” Values................................................................................................................. 19
Table 8– Roughness Coefficients (Manning’s n-Values) for Approximate Studies ................................... 22
Table 9 – Floodway Data ............................................................................................................................ 26
Table 10 – Community Map History .......................................................................................................... 46
iv
TABLE OF CONTENTS (Continued)
LIST OF EXHIBITS
Exhibit 1 – Flood Profiles Bear Run Panels 01P-04P
Black Fork Mohican River Panels 05P-08P
Clear Fork Mohican River Panels 09P-21P
East Branch Bear Run Panel 22P
Hartman Bargaheiser Ditch Panels 23P-24P
Lower Tuby Tributary Panel 25P
Painters Creek Panels 26P-28P
Rocky Fork Panels 29P-32P
Seltzer Park Creek Panels 33P-36P
Seltzer Park Tributary Panels 37P-38P
Touby Run Panel 39P
Tuby Run Panels 40P-43P
Upper Tuby Tributary Panel 44P
West Branch Panel 45P
West Branch Bear Run Panels 46P-47P
West Branch Tributary Panel 48P
Published Separately - Flood Insurance Rate Map Index
Flood Insurance Rate Map
1
FLOOD INSURANCE STUDY
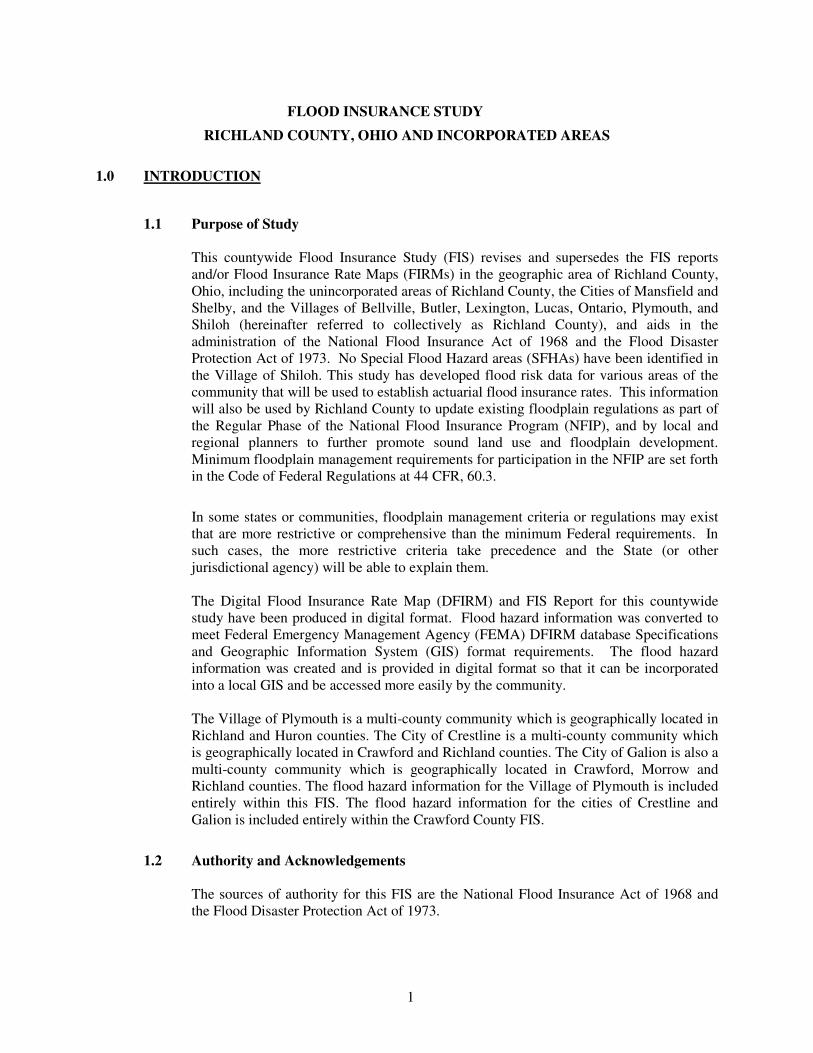
RICHLAND COUNTY, OHIO AND INCORPORATED AREAS 1.0 INTRODUCTION
1.1 Purpose of Study This countywide Flood Insurance Study (FIS) revises and supersedes the FIS reports and/or Flood Insurance Rate Maps (FIRMs) in the geographic area of Richland County, Ohio, including the unincorporated areas of Richland County, the Cities of Mansfield and Shelby, and the Villages of Bellville, Butler, Lexington, Lucas, Ontario, Plymouth, and Shiloh (hereinafter referred to collectively as Richland County), and aids in the administration of the National Flood Insurance Act of 1968 and the Flood Disaster Protection Act of 1973. No Special Flood Hazard areas (SFHAs) have been identified in the Village of Shiloh. This study has developed flood risk data for various areas of the community that will be used to establish actuarial flood insurance rates. This information will also be used by Richland County to update existing floodplain regulations as part of the Regular Phase of the National Flood Insurance Program (NFIP), and by local and regional planners to further promote sound land use and floodplain development. Minimum floodplain management requirements for participation in the NFIP are set forth in the Code of Federal Regulations at 44 CFR, 60.3.
In some states or communities, floodplain management criteria or regulations may exist that are more restrictive or comprehensive than the minimum Federal requirements. In such cases, the more restrictive criteria take precedence and the State (or other jurisdictional agency) will be able to explain them. The Digital Flood Insurance Rate Map (DFIRM) and FIS Report for this countywide study have been produced in digital format. Flood hazard information was converted to meet Federal Emergency Management Agency (FEMA) DFIRM database Specifications and Geographic Information System (GIS) format requirements. The flood hazard information was created and is provided in digital format so that it can be incorporated into a local GIS and be accessed more easily by the community. The Village of Plymouth is a multi-county community which is geographically located in Richland and Huron counties. The City of Crestline is a multi-county community which is geographically located in Crawford and Richland counties. The City of Galion is also a multi-county community which is geographically located in Crawford, Morrow and Richland counties. The flood hazard information for the Village of Plymouth is included entirely within this FIS. The flood hazard information for the cities of Crestline and Galion is included entirely within the Crawford County FIS.
1.2 Authority and Acknowledgements
The sources of authority for this FIS are the National Flood Insurance Act of 1968 and the Flood Disaster Protection Act of 1973.
2
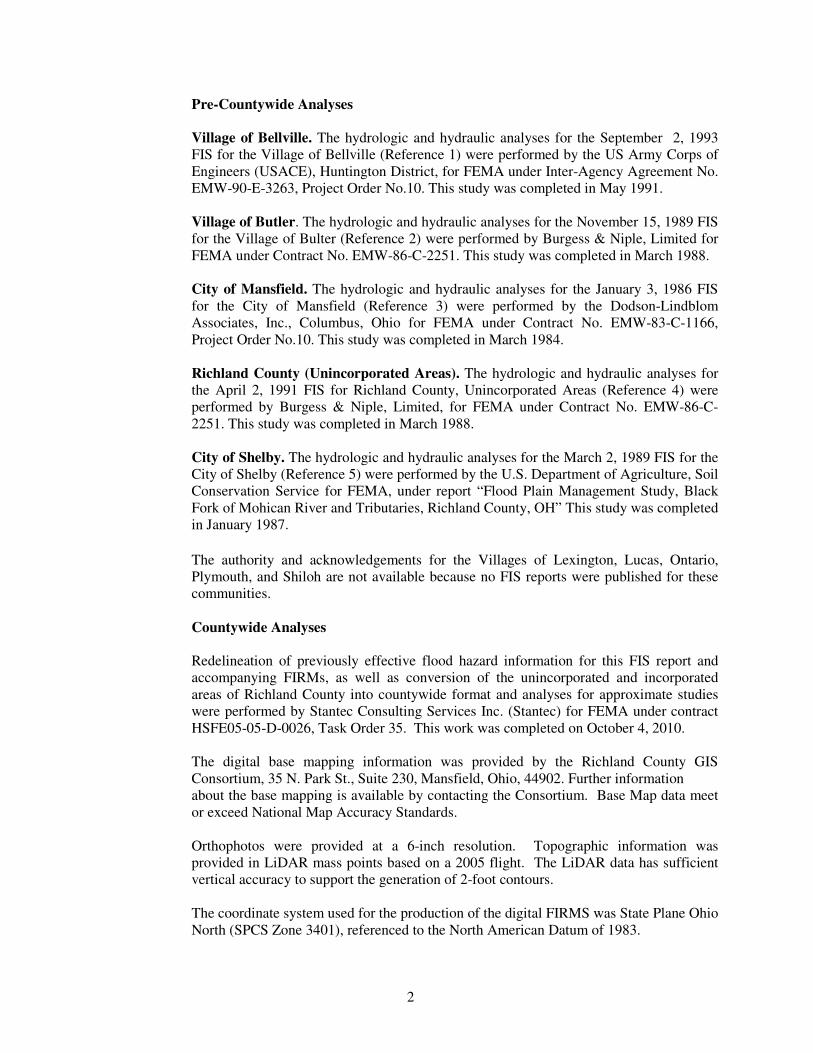
Pre-Countywide Analyses Village of Bellville. The hydrologic and hydraulic analyses for the September 2, 1993 FIS for the Village of Bellville (Reference 1) were performed by the US Army Corps of Engineers (USACE), Huntington District, for FEMA under Inter-Agency Agreement No. EMW-90-E-3263, Project Order No.10. This study was completed in May 1991. Village of Butler. The hydrologic and hydraulic analyses for the November 15, 1989 FIS for the Village of Bulter (Reference 2) were performed by Burgess & Niple, Limited for FEMA under Contract No. EMW-86-C-2251. This study was completed in March 1988. City of Mansfield. The hydrologic and hydraulic analyses for the January 3, 1986 FIS for the City of Mansfield (Reference 3) were performed by the Dodson-Lindblom Associates, Inc., Columbus, Ohio for FEMA under Contract No. EMW-83-C-1166, Project Order No.10. This study was completed in March 1984. Richland County (Unincorporated Areas). The hydrologic and hydraulic analyses for the April 2, 1991 FIS for Richland County, Unincorporated Areas (Reference 4) were performed by Burgess & Niple, Limited, for FEMA under Contract No. EMW-86-C-2251. This study was completed in March 1988. City of Shelby. The hydrologic and hydraulic analyses for the March 2, 1989 FIS for the City of Shelby (Reference 5) were performed by the U.S. Department of Agriculture, Soil Conservation Service for FEMA, under report “Flood Plain Management Study, Black Fork of Mohican River and Tributaries, Richland County, OH” This study was completed in January 1987.
The authority and acknowledgements for the Villages of Lexington, Lucas, Ontario, Plymouth, and Shiloh are not available because no FIS reports were published for these communities. Countywide Analyses Redelineation of previously effective flood hazard information for this FIS report and accompanying FIRMs, as well as conversion of the unincorporated and incorporated areas of Richland County into countywide format and analyses for approximate studies were performed by Stantec Consulting Services Inc. (Stantec) for FEMA under contract HSFE05-05-D-0026, Task Order 35. This work was completed on October 4, 2010. The digital base mapping information was provided by the Richland County GIS Consortium, 35 N. Park St., Suite 230, Mansfield, Ohio, 44902. Further information about the base mapping is available by contacting the Consortium. Base Map data meet or exceed National Map Accuracy Standards. Orthophotos were provided at a 6-inch resolution. Topographic information was provided in LiDAR mass points based on a 2005 flight. The LiDAR data has sufficient vertical accuracy to support the generation of 2-foot contours. The coordinate system used for the production of the digital FIRMS was State Plane Ohio North (SPCS Zone 3401), referenced to the North American Datum of 1983.
3
1.3 Coordination
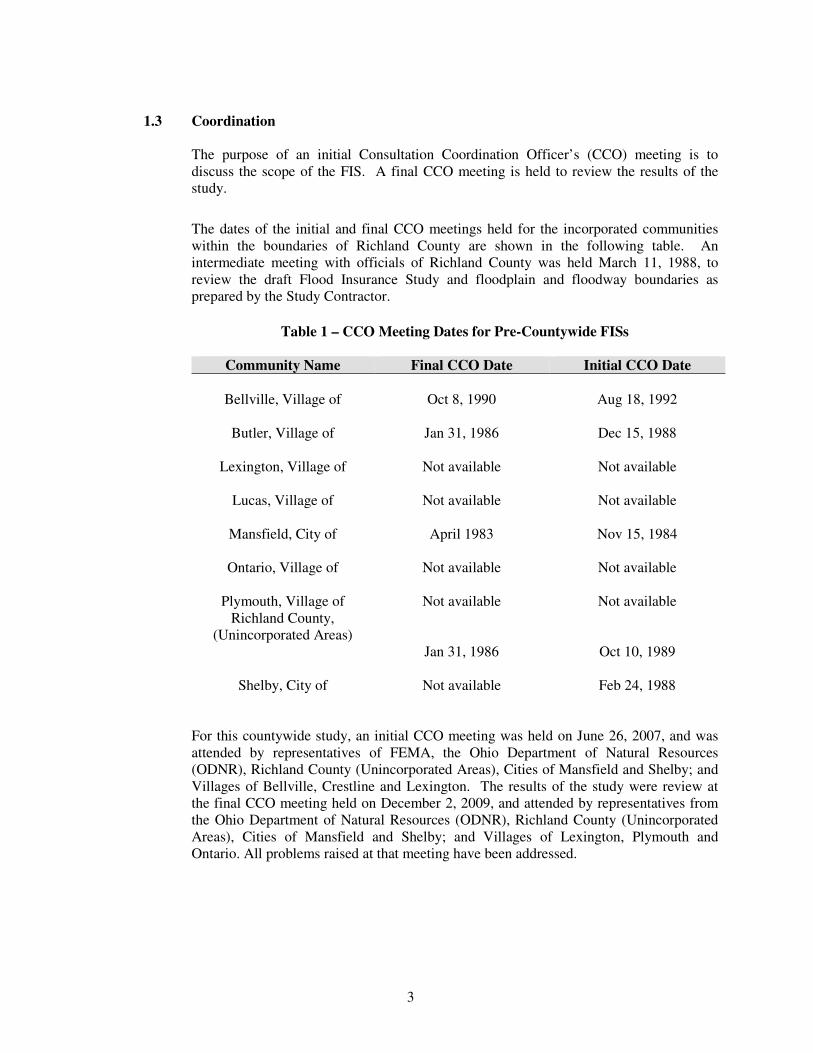
The purpose of an initial Consultation Coordination Officer’s (CCO) meeting is to discuss the scope of the FIS. A final CCO meeting is held to review the results of the study.
The dates of the initial and final CCO meetings held for the incorporated communities within the boundaries of Richland County are shown in the following table. An intermediate meeting with officials of Richland County was held March 11, 1988, to review the draft Flood Insurance Study and floodplain and floodway boundaries as prepared by the Study Contractor.
Table 1 – CCO Meeting Dates for Pre-Countywide FISs
Community Name Final CCO Date Initial CCO Date
Bellville, Village of Oct 8, 1990
Aug 18, 1992
Butler, Village of Jan 31, 1986
Dec 15, 1988
Lexington, Village of Not available
Not available
Lucas, Village of Not available
Not available
Mansfield, City of April 1983
Nov 15, 1984
Ontario, Village of Not available
Not available
Plymouth, Village of Not available
Not available Richland County,
(Unincorporated Areas) Jan 31, 1986 Oct 10, 1989
Shelby, City of Not available
Feb 24, 1988 For this countywide study, an initial CCO meeting was held on June 26, 2007, and was attended by representatives of FEMA, the Ohio Department of Natural Resources (ODNR), Richland County (Unincorporated Areas), Cities of Mansfield and Shelby; and Villages of Bellville, Crestline and Lexington. The results of the study were review at the final CCO meeting held on December 2, 2009, and attended by representatives from the Ohio Department of Natural Resources (ODNR), Richland County (Unincorporated Areas), Cities of Mansfield and Shelby; and Villages of Lexington, Plymouth and Ontario. All problems raised at that meeting have been addressed.
4
The following organizations were contacted to gather information for the pre-countywide FISs: FEMA; Richland County; Ohio Department of Natural Resources (ODNR); US Department of Agriculture - Soil Conservation Service (SCS); U.S. Bureau of Reclamation; Muskingum Watershed Conservancy District; and U.S. Geological Survey (USGS). Flood data was provided by the U.S. Army Corps of Engineers (USCOE), Huntington District pertaining to local protection projects along parts of Rocky Fork and Touby Run. CSX Railroad and the Ohio Department of Transportation (ODOT) were contacted for bridge data used in the hydraulic analyses. Benatec Associates, original designers of the Clear Fork Dam on the Clear Fork Mohican River, were contacted regarding data for the dam and reservoir. Additional flood information was obtained from the 1982 study of flood problems along Rocky Fork above Longview Avenue (Reference 6). Information on past flooding problems was obtained from microfilm copies of the local Mansfield newspaper, the Mansfield New Journal.
2.0 AREA STUDIED
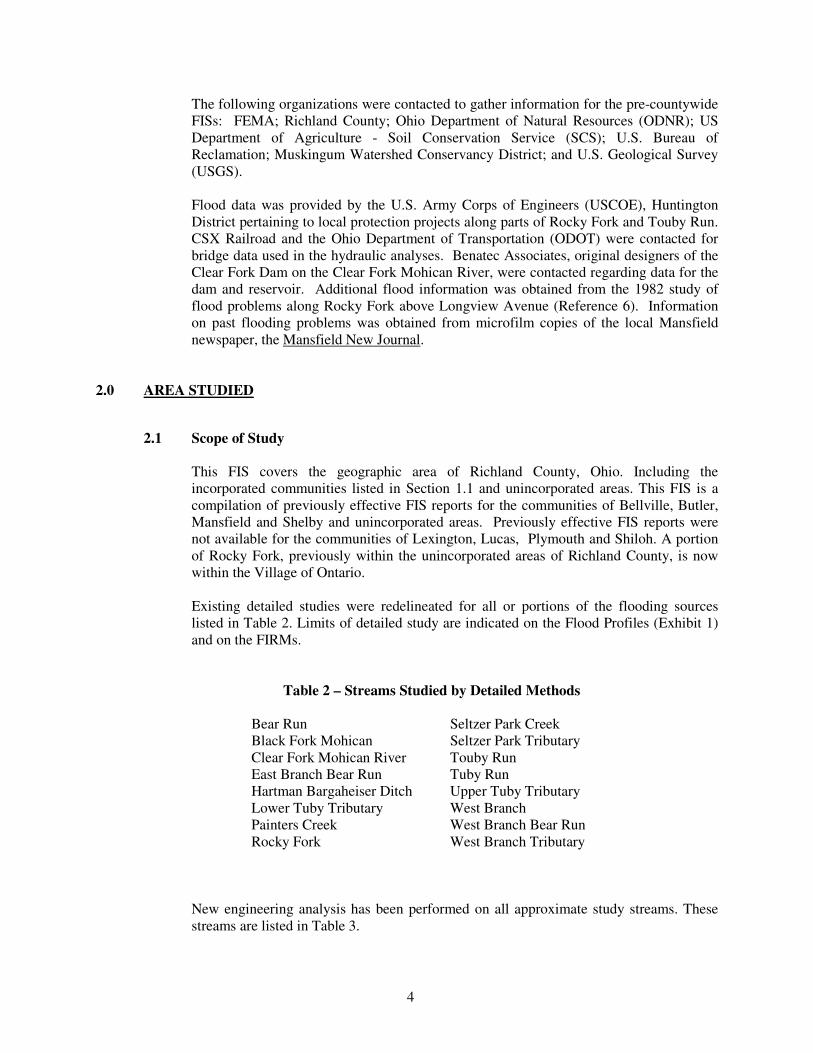
2.1 Scope of Study This FIS covers the geographic area of Richland County, Ohio. Including the incorporated communities listed in Section 1.1 and unincorporated areas. This FIS is a compilation of previously effective FIS reports for the communities of Bellville, Butler, Mansfield and Shelby and unincorporated areas. Previously effective FIS reports were not available for the communities of Lexington, Lucas, Plymouth and Shiloh. A portion of Rocky Fork, previously within the unincorporated areas of Richland County, is now within the Village of Ontario.
Existing detailed studies were redelineated for all or portions of the flooding sources listed in Table 2. Limits of detailed study are indicated on the Flood Profiles (Exhibit 1) and on the FIRMs. Table 2 – Streams Studied by Detailed Methods
Bear Run Seltzer Park Creek Black Fork Mohican Seltzer Park Tributary Clear Fork Mohican River Touby Run East Branch Bear Run Tuby Run Hartman Bargaheiser Ditch Upper Tuby Tributary Lower Tuby Tributary West Branch Painters Creek West Branch Bear Run Rocky Fork West Branch Tributary
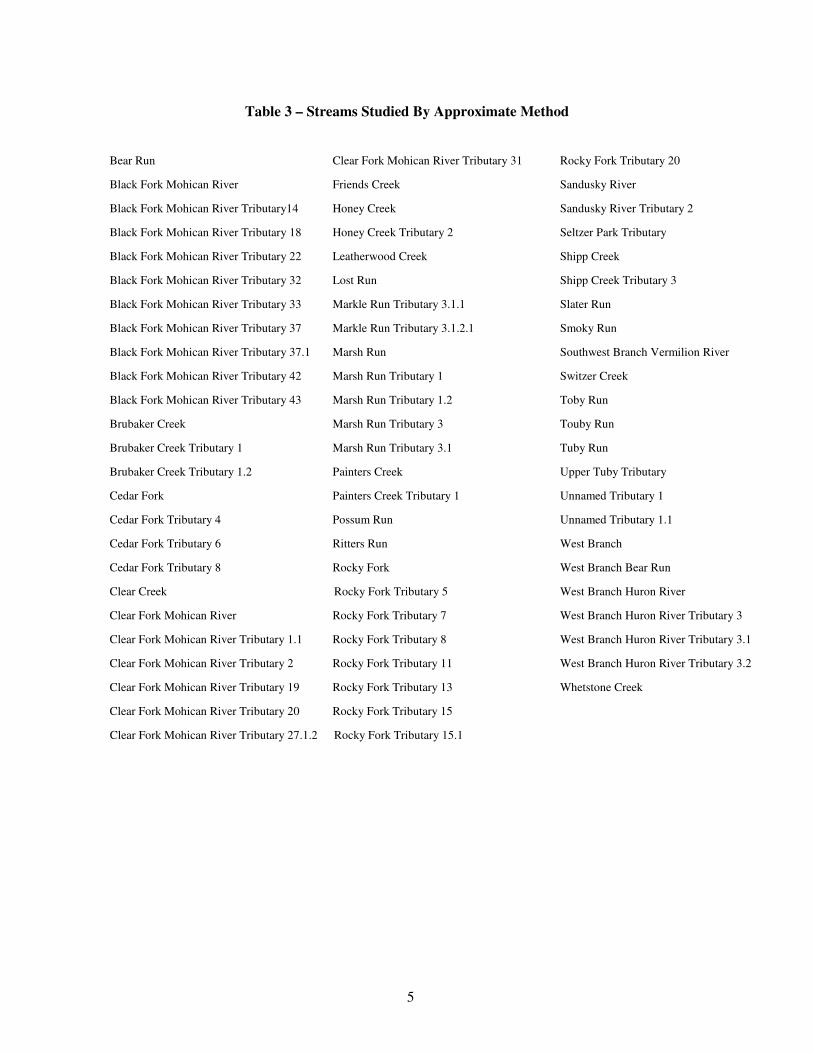
New engineering analysis has been performed on all approximate study streams. These streams are listed in Table 3.
5
Table 3 – Streams Studied By Approximate Method
Bear Run Clear Fork Mohican River Tributary 31 Rocky Fork Tributary 20
Black Fork Mohican River Friends Creek Sandusky River
Black Fork Mohican River Tributary14 Honey Creek Sandusky River Tributary 2
Black Fork Mohican River Tributary 18 Honey Creek Tributary 2 Seltzer Park Tributary
Black Fork Mohican River Tributary 22 Leatherwood Creek Shipp Creek
Black Fork Mohican River Tributary 32 Lost Run Shipp Creek Tributary 3
Black Fork Mohican River Tributary 33 Markle Run Tributary 3.1.1 Slater Run
Black Fork Mohican River Tributary 37 Markle Run Tributary 3.1.2.1 Smoky Run
Black Fork Mohican River Tributary 37.1 Marsh Run Southwest Branch Vermilion River
Black Fork Mohican River Tributary 42 Marsh Run Tributary 1 Switzer Creek
Black Fork Mohican River Tributary 43 Marsh Run Tributary 1.2 Toby Run
Brubaker Creek Marsh Run Tributary 3 Touby Run
Brubaker Creek Tributary 1 Marsh Run Tributary 3.1 Tuby Run
Brubaker Creek Tributary 1.2 Painters Creek Upper Tuby Tributary
Cedar Fork Painters Creek Tributary 1 Unnamed Tributary 1
Cedar Fork Tributary 4 Possum Run Unnamed Tributary 1.1
Cedar Fork Tributary 6 Ritters Run West Branch
Cedar Fork Tributary 8 Rocky Fork West Branch Bear Run
Clear Creek Rocky Fork Tributary 5 West Branch Huron River
Clear Fork Mohican River Rocky Fork Tributary 7 West Branch Huron River Tributary 3
Clear Fork Mohican River Tributary 1.1 Rocky Fork Tributary 8 West Branch Huron River Tributary 3.1
Clear Fork Mohican River Tributary 2 Rocky Fork Tributary 11 West Branch Huron River Tributary 3.2
Clear Fork Mohican River Tributary 19 Rocky Fork Tributary 13 Whetstone Creek
Clear Fork Mohican River Tributary 20 Rocky Fork Tributary 15
Clear Fork Mohican River Tributary 27.1.2 Rocky Fork Tributary 15.1
6
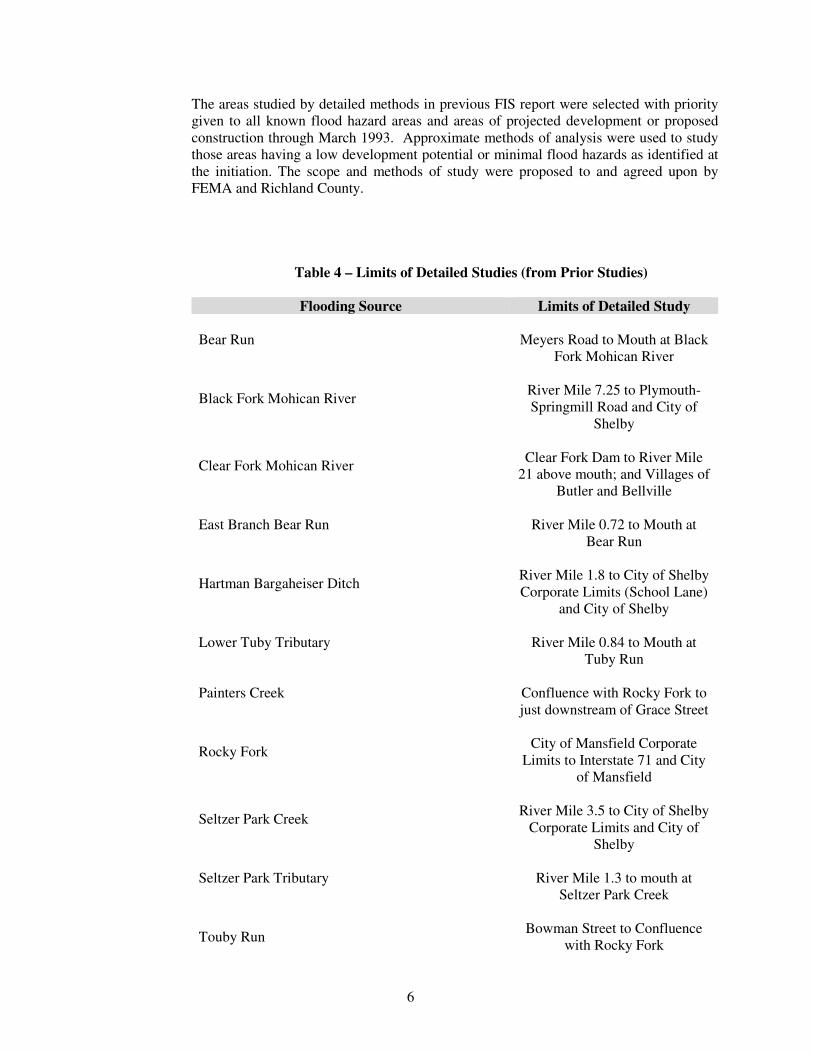
The areas studied by detailed methods in previous FIS report were selected with priority given to all known flood hazard areas and areas of projected development or proposed construction through March 1993. Approximate methods of analysis were used to study those areas having a low development potential or minimal flood hazards as identified at the initiation. The scope and methods of study were proposed to and agreed upon by FEMA and Richland County.
Table 4 – Limits of Detailed Studies (from Prior Studies)
Flooding Source Limits of Detailed Study
Bear Run
Meyers Road to Mouth at Black Fork Mohican River
Black Fork Mohican River
River Mile 7.25 to Plymouth-Springmill Road and City of
Shelby
Clear Fork Mohican River
Clear Fork Dam to River Mile
21 above mouth; and Villages of Butler and Bellville
East Branch Bear Run
River Mile 0.72 to Mouth at Bear Run
Hartman Bargaheiser Ditch
River Mile 1.8 to City of Shelby Corporate Limits (School Lane)
and City of Shelby
Lower Tuby Tributary
River Mile 0.84 to Mouth at Tuby Run
Painters Creek
Confluence with Rocky Fork to just downstream of Grace Street
Rocky Fork
City of Mansfield Corporate
Limits to Interstate 71 and City of Mansfield
Seltzer Park Creek
River Mile 3.5 to City of Shelby
Corporate Limits and City of Shelby
Seltzer Park Tributary
River Mile 1.3 to mouth at Seltzer Park Creek
Touby Run
Bowman Street to Confluence
with Rocky Fork
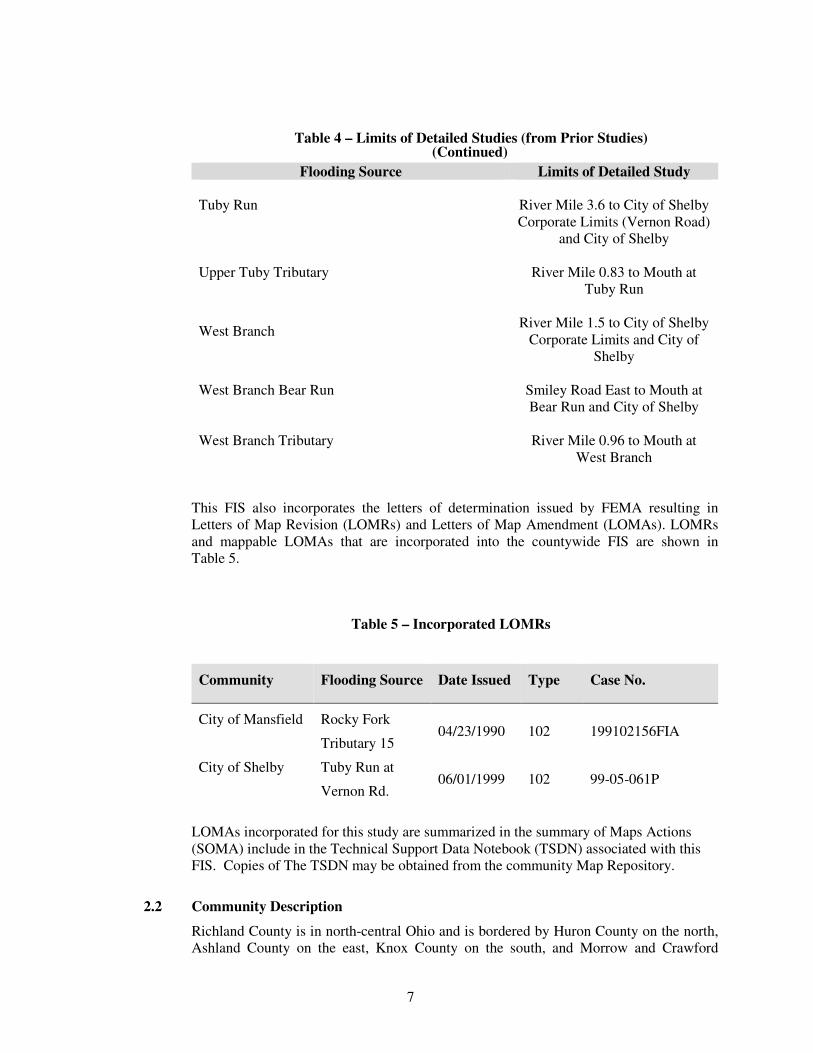
7
(Continued)
Table 4 – Limits of Detailed Studies (from Prior Studies)
Flooding Source Limits of Detailed Study
Tuby Run
River Mile 3.6 to City of Shelby Corporate Limits (Vernon Road)
and City of Shelby
Upper Tuby Tributary
River Mile 0.83 to Mouth at Tuby Run
West Branch
River Mile 1.5 to City of Shelby
Corporate Limits and City of Shelby
West Branch Bear Run
Smiley Road East to Mouth at Bear Run and City of Shelby
West Branch Tributary
River Mile 0.96 to Mouth at West Branch
This FIS also incorporates the letters of determination issued by FEMA resulting in Letters of Map Revision (LOMRs) and Letters of Map Amendment (LOMAs). LOMRs and mappable LOMAs that are incorporated into the countywide FIS are shown in Table 5.
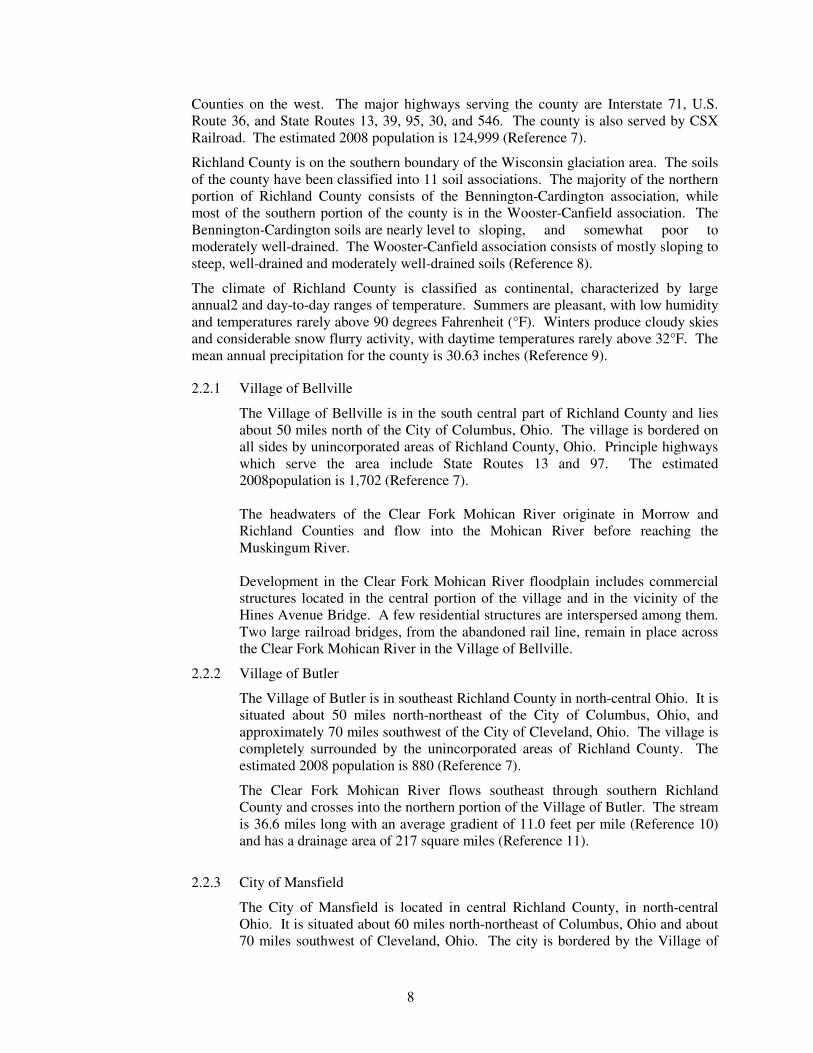
Table 5 – Incorporated LOMRs
Community Flooding Source Date Issued Type Case No.
City of Mansfield Rocky Fork
Tributary 15 04/23/1990 102 199102156FIA
City of Shelby Tuby Run at
Vernon Rd. 06/01/1999 102 99-05-061P
LOMAs incorporated for this study are summarized in the summary of Maps Actions (SOMA) include in the Technical Support Data Notebook (TSDN) associated with this FIS. Copies of The TSDN may be obtained from the community Map Repository.
2.2 Community Description
Richland County is in north-central Ohio and is bordered by Huron County on the north, Ashland County on the east, Knox County on the south, and Morrow and Crawford
(Continued)
8
Counties on the west. The major highways serving the county are Interstate 71, U.S. Route 36, and State Routes 13, 39, 95, 30, and 546. The county is also served by CSX Railroad. The estimated 2008 population is 124,999 (Reference 7).
Richland County is on the southern boundary of the Wisconsin glaciation area. The soils of the county have been classified into 11 soil associations. The majority of the northern portion of Richland County consists of the Bennington-Cardington association, while most of the southern portion of the county is in the Wooster-Canfield association. The Bennington-Cardington soils are nearly level to sloping, and somewhat poor to moderately well-drained. The Wooster-Canfield association consists of mostly sloping to steep, well-drained and moderately well-drained soils (Reference 8).
The climate of Richland County is classified as continental, characterized by large annual2 and day-to-day ranges of temperature. Summers are pleasant, with low humidity and temperatures rarely above 90 degrees Fahrenheit (°F). Winters produce cloudy skies and considerable snow flurry activity, with daytime temperatures rarely above 32°F. The mean annual precipitation for the county is 30.63 inches (Reference 9).
2.2.1 Village of Bellville
The Village of Bellville is in the south central part of Richland County and lies about 50 miles north of the City of Columbus, Ohio. The village is bordered on all sides by unincorporated areas of Richland County, Ohio. Principle highways which serve the area include State Routes 13 and 97. The estimated 2008population is 1,702 (Reference 7).
The headwaters of the Clear Fork Mohican River originate in Morrow and Richland Counties and flow into the Mohican River before reaching the Muskingum River.
Development in the Clear Fork Mohican River floodplain includes commercial structures located in the central portion of the village and in the vicinity of the Hines Avenue Bridge. A few residential structures are interspersed among them. Two large railroad bridges, from the abandoned rail line, remain in place across the Clear Fork Mohican River in the Village of Bellville.
2.2.2 Village of Butler
The Village of Butler is in southeast Richland County in north-central Ohio. It is situated about 50 miles north-northeast of the City of Columbus, Ohio, and approximately 70 miles southwest of the City of Cleveland, Ohio. The village is completely surrounded by the unincorporated areas of Richland County. The estimated 2008 population is 880 (Reference 7).
The Clear Fork Mohican River flows southeast through southern Richland County and crosses into the northern portion of the Village of Butler. The stream is 36.6 miles long with an average gradient of 11.0 feet per mile (Reference 10) and has a drainage area of 217 square miles (Reference 11).
2.2.3 City of Mansfield
The City of Mansfield is located in central Richland County, in north-central Ohio. It is situated about 60 miles north-northeast of Columbus, Ohio and about 70 miles southwest of Cleveland, Ohio. The city is bordered by the Village of
9
Ontario to the west. The rest of the city is completely surrounded by unincorporated areas of Richland County. The estimated 2008 population is 49,579 (Reference 7).
The extent of development within the flood plain of Mansfield is primarily limited to a few residences and private businesses and some redevelopment within the industrial complexes along Touby Run and Rocky Fork.
2.2.4 City of Shelby
The City of Shelby is in northwestern Richland County, which lies in north-central Ohio approximately 65 miles north of Columbus. Shelby is served by State Routes 39, 61, 96, and 314, and CSX railroad. The estimated 2008 population is 9,311 (Reference 7).
The headwaters of the Black Fork Mohican River lie just south of the City of Shelby. The main stem flows directly north through the center of the city with several small tributaries joining it along the way.
Previously effective FIS reports were not available for the communities of Lexington, Lucas, Ontario and Plymouth;, therefore no community description is provided.
2.3 Principal Flood Problems
Past flooding of the streams within Richland County indicates that flooding may occur during any season of the year. Major floods have resulted from both intense summer storms, and winter storms that are worsened when the rain is accompanied by melting snow.
A major flood also occurred on Tuby Run and Rocky Fork in March 1913. This event was estimated to be a 2- to 1-percent-annual-chance flood.
Flooding from the Black Fork Mohican River and its tributaries causes both urban and agricultural damage. Numerous commercial and residential properties would be damaged by a 1-percent-annual-chance flood. 2.3.1 Village of Bellville
Principal flood problems in the Village of Bellville result from overflow of the Clear Fork Mohican River. This flooding affects both sides of the stream from the undeveloped floodplain area in the northwest portion of the village to the moderately developed portions of the floodplain in the central and eastern portions of the village. The massive structures of the two railroad bridges constrict high flows and pose potential hazards during flood events.
The history of flooding within the community indicates that flooding can occur at any time of the year. Major floods have occurred in the village in 1959 and 1987. The July 1, 1987, flood resulted from a severe summer storm sequence from June 29 through July 2, 1987. The most intense part of the storm began on the morning of July 1 at 5:00 a.m. and lasted until 8:00 a.m. the next morning. Rainfall gaging stations at Marion, Galion, and Mansfield, Ohio, approximately 10 to 30 miles from Bellville, indicate at least 3.98 inches of rainfall occurred within a 27-hour period. This storm was preceded by 2.28 inches of rainfall on June 29 and 30. The Mansfield, Ohio, rainfall gage stations recorded 6.26 inches of precipitation for the period preceding July 1987 (References 12 and 13). On
10
February 6, 2008 Bellville schools were closed due to flooding caused by two inches of rain which fell overnight (Reference 14).
2.3.2 Village of Butler
Major floods occurred on the Clear Fork Mohican River in January 1959 and July 1987. The discharges associated with these events recorded at the USGS gage (No. 3-1320) at Butler, Ohio, were 14,300 cubic feet per second (cfs) and 21,300 cfs, respectively. These events were approximately 1- to 0.2-percent-annual-chance floods, respectively, and were based on flood discharge-frequency analyses at the gage (Reference 15).
2.3.3 City of Mansfield
Records of past flooding indicate that flooding may occur at Mansfield during any season of the year, but the more serious floods of this century have occurred during the winter and summer seasons.
A few of these more serious floods occurred in Mansfield in March 1913, June 1947, January 1959, July 1969, June 1981, July 1987 (Reference 16) and August 2007 (Reference 17). No discharges associated with any of these major floods were obtained for Painters Creek, so it is not possible to give an estimate of the return periods for these flood events for that stream. For Touby Run and Rocky Fork, the 1913 event was approximately a 2- to 1-percent-annual-chance flood. The 1959 flood was approximately a 10-percent-annual-chance flood (Reference 18). The ice blockage that occurred during the 1959 flood increased the flooding somewhat above that normally associated with a 10-percent-annual-chance flood event. From gaging station records on Touby Run, it is also estimated that the 1947 event on this stream was a 4-percent-annual-chance flood and the 1969 event was a 10-percent-annual-chance flood. No flood discharge records for the 1981 flood exist in the immediate Mansfield area, but records from adjacent streams indicate that discharges associated with this flood event were lower than those for the 1959 and 1969 flood events.
Past flooding in Mansfield has been primarily in the low-lying overbank areas along Rocky Fork throughout most of the city and along Touby Run from Bowman Street to the confluence with Rocky Fork. Development in these areas substantially decreases the conveyance of the floodplains. The Conrail Bridge over Rocky Fork near the confluence of Touby Run appears to restrict the flow in Rocky Fork and causes substantial backwater flooding upstream. The remaining bridges do not appear to be excessively restrictive.
2.3.4 City of Shelby
Flooding from the Black Fork Mohican River and its tributaries causes both urban and agricultural damage. Numerous commercial and residential properties would be damaged by a 1-percent-annual-chance flood. The City of Shelby encountered major flooding in 1913, 1959, 1987 and 2007 (Reference 19). The 2007 flood resulted in the need to demolish 19 homes (Reference 20).
Previously effective FIS reports were not available for the communities of Lexington, Lucas, Ontario, Plymouth and Shiloh; therefore no principal flood problems are provided.
11
2.4 Flood Protection Measures
The Clear Fork Dam on the Clear Fork Mohican River creates the Clear Fork Reservoir. This facility was not constructed for flood control purposes and therefore does not provide meaningful protection to the county. Nonstructural measures in the form of land use regulations for flood protection are being used to aid in the prevention of future damage.
2.4.1 Village of Bellville
Flood protection measures are not known to exist within the study area.
2.4.2 Village of Butler
Flood protection measures are not known to exist within the study area.
2.4.3 City of Mansfield
A levee exists at the wastewater treatment plant along Rocky Fork, however this levee is not accredited per NFIP requirements. Therefore, the area landward of the levee is mapped as a Special Flood Hazard Area (SFHA), as appropriate. Non-structural measures of flood protection are presently being used to aid in the prevention of future flood damage. These measures include regulations that control development in flood plain areas.
2.4.4 City of Shelby
Flood protection measures are not known to exist within the study area.
Previously effective FIS reports were not available for the communities of Lexington, Lucas, Ontario, Plymouth and Shiloh therefore no flood protection measures are provided.
3.0 ENGINEERING METHODS For the flooding sources studied in detail in the county, standard hydrologic and hydraulic study methods were used to determine the flood hazard data required for this study. Flood events of a magnitude which are expected to be equaled or exceeded once on the average during any 10-, 50-, 100-, or 500-year period (recurrence interval) have been selected as having special significance for floodplain management and for flood insurance premium rates. These events, commonly termed the 10-, 50-, 100-, and 500-year floods, have a 10, 2, 1-, and 0.2- percent chance, respectively, of being equaled or exceeded during any year. Although the recurrence interval represents the long-term, average period between floods of a specific magnitude, rare floods could occur at short intervals or even within the same year. The risk of experiencing a rare flood increases when periods greater than 1 year are considered. For example, the risk of having a flood which equals or exceeds the 100-year flood (1-percent-annual-chance flood) in any 50-year period is approximately 40 percent (4 in 10), and, for any 90-year period, the risk increases to approximately 60 percent (6 in 10). The analyses reported here reflect flooding potentials based on conditions existing in the community at the time of completion of this study. Maps and flood elevations will be amended periodically to reflect future changes.
12
3.1 Hydrologic Analyses
Hydrologic analyses were carried out to establish the peak discharge-frequency relationships for each flooding source studied by detail methods affecting the county.
This countywide FIS report includes information from previously published FIS reports where streams were studied in detail. This countywide FIS also included new information for streams studied by approximate methods.
Pre-Countywide
3.1.1 Detailed Studies
Peak discharge-frequency relationships obtained from the SCS Floodplain Management Study were established by valley flood routings computed using a SCS watershed model (Reference 21. This program uses the Modified Att-kin Reach Routing Method for stream and valley flood routing. The model was calibrated to match previous high-water marks and historical flood data
The 1-percent-annual-chance peak inflow at Clear Fork Dam was initially determined from the recommended estimating equation presented in Bulletin No. 45 (Reference 22. The estimating equation, however, does not reflect the influence of the maximum flood event on the Clear Fork Mohican River observed on July 1, 1987, at the Butler gage, located about 5 miles below the Village of Bellville. The 1-percent-annual-chance discharge from the recent frequency analysis provided by the USGS (Reference 15) at the gage is 19.5 percent greater than that obtained by the estimating equation at the gage. The estimating equation reservoir peak inflow was therefore adjusted by increasing it 19.5 percent to make it more consistent with the recent frequency analysis at the gage.
Peak inflow versus outflow data for Clear Fork Reservoir was obtained from hydrologic analyses made as part of an ODNR dam inspection (Reference 23). Nominal extrapolation of this data provided the 1-percent-annual-chance peak outflow resulting from the adjusted estimating equation derived peak inflow. A log-log plot of discharge versus drainage area was then developed from the peak reservoir outflow and the recent USGS frequency analysis at the gage.
This log-log plot was compared with data for the July 1987 flood event to determine if its results were reasonable. The USGS provided the peak discharge for the event at the gage (Reference 15). The City of Mansfield and the ODNR provided information on the approximate peak stage in Clear Fork Reservoir during the event. Applying this peak stage data to the spillway rating curve from the ODNR dam inspection yielded the estimated peak outflow. The gage flow and reservoir outflow, when added to the log-log plot, gave results generally parallel to the 1-percent-annual-chance plot. The 1-percent-annual-chance peak discharges at intermediate points along the Clear Fork Mohican River were therefore interpolated from the log-log plot.
Flood discharges for Painters Creek were determined using equations presented in Bulletin No. 45 (Reference 22).
Village of Bellville
No stream gaging stations exist in the Clear Fork Mohican River Basin.
13
Therefore, the flood frequency discharges were based on calculations and a series of curves developed for small drainage areas for the Clear Fork Mohican River basin, and the surrounding region. Natural discharge-frequency curves used were developed on a regional basis in accordance with the methods outlined in previous reports (References 24 and 25).
The flood discharge frequency analysis utilized standard computerized methodologies to analyze data from 13 gaging stations in the region. Of these stations, three were located in Richland County. Periods of record ("n") range from 30 to 70 years and represent drainage areas of 5.2 to 1,502 square miles. An "n" value of 60 years was adopted as being representative and was used in the computations.
The flood discharges for detailed streams were derived from generalized curves based on the stream gaging station at Greer, Ohio, and developed for the Mohican River and tributaries. Village of Butler
The stream gage on the Clear Fork Mohican River in the village has a continuous period of record from 1944 through 1975. The 1-percent-annual-chance flood frequency peak discharge (10,500 cfs) given for this gage in ODNR Bulletin 45 (Reference 22) was revised by the USGS following the July 1987 event.
There is some change in drainage area of Clear Fork through the study reach. Transfer techniques recommended in the previously referenced Bulletin 45 were used in conjunction with the updated gage 1-percent-annual-chance peak discharge to determine discharges through the study reach.
City of Mansfield
Flood discharges for the detailed study reaches along Rocky Fork and Touby Run were provided by the USCOE, Huntington District related to a local protection project in the City of Mansfield (Reference 26). The data for Touby Run was developed from annual peak discharges recorded at a gaging station on Touby Run. Those for Rocky Fork were developed from analyses of the annual peak discharges recorded at 11 gaging stations on neighboring watersheds. From these analyses, generalized skew coefficients and relationships between the drainage area and the standard deviations and means of the annual peak discharges were developed. The skew coefficient, standard deviations, and means for the drainage areas of Rocky Fork at Mansfield that were studied were obtained from these generalized relationships. The log-Pearson Type III statistical distribution was then used, as recommended in the Interagency Advisory Committee on Water Data Bulletin No. 17B (Reference 24), to develop the peak discharge-frequency estimates for Rocky Fork.
Flood discharges for the remaining reaches studied were determined using the equations presented in ODNR Bulletin 45 (Reference 22). These equations are regionalized regression equations and, for the Mansfield area, relate the drainage area and channel slope to the peak discharge.
City of Shelby
Flood discharges were established by valley flood routings computed using the SCS watershed model "Project Formulation, Hydrology" (Reference 21). This

14
program uses the Modified Att-kin Reach Routing Method for stream and valley flood routing. The model was calibrated to match previous high-water marks and historical flood data.
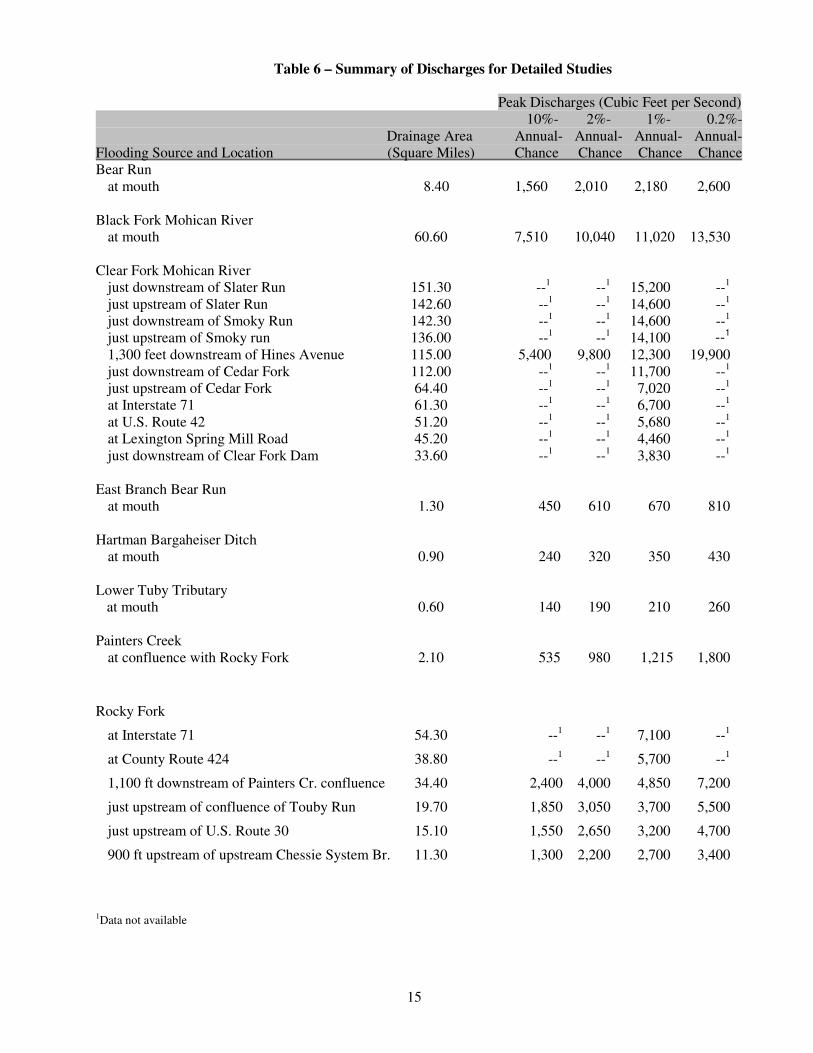
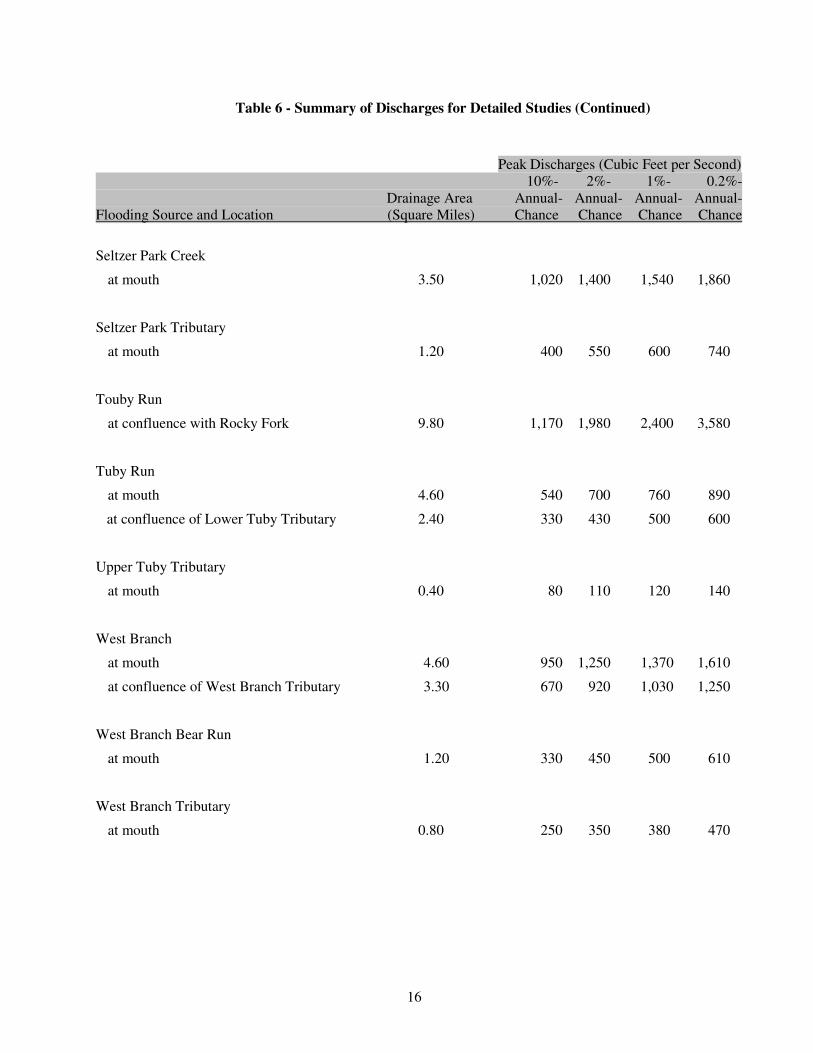
A summary of the peak discharges for the detailed streams is included in the following Table 6.
15
Table 6 – Summary of Discharges for Detailed Studies
Peak Discharges (Cubic Feet per Second) 10%- 2%- 1%- 0.2%- Drainage Area Annual- Annual- Annual- Annual- Flooding Source and Location (Square Miles) Chance Chance Chance Chance Bear Run at mouth 8.40 1,560 2,010 2,180 2,600 Black Fork Mohican River at mouth 60.60 7,510 10,040 11,020 13,530 Clear Fork Mohican River just downstream of Slater Run 151.30 --1 --1 15,200 --1 just upstream of Slater Run 142.60 --1 --1 14,600 --1 just downstream of Smoky Run 142.30 --1 --1 14,600 --1
just upstream of Smoky run 136.00 --1 --1 14,100 --1 1,300 feet downstream of Hines Avenue 115.00 5,400 9,800 12,300 19,900 just downstream of Cedar Fork 112.00 --1 --1 11,700 --1 just upstream of Cedar Fork 64.40 --1 --1 7,020 --1 at Interstate 71 61.30 --1 --1 6,700 --1
at U.S. Route 42 51.20 --1 --1 5,680 --1 at Lexington Spring Mill Road 45.20 --1 --1 4,460 --1 just downstream of Clear Fork Dam 33.60 --1 --1 3,830 --1
East Branch Bear Run at mouth 1.30 450 610 670 810
Hartman Bargaheiser Ditch at mouth 0.90 240 320 350 430 Lower Tuby Tributary at mouth 0.60 140 190 210 260
Painters Creek at confluence with Rocky Fork 2.10 535 980 1,215 1,800
Rocky Fork
at Interstate 71 54.30 --1 --1 7,100 --1
at County Route 424 38.80 --1 --1 5,700 --1
1,100 ft downstream of Painters Cr. confluence 34.40 2,400 4,000 4,850 7,200
just upstream of confluence of Touby Run 19.70 1,850 3,050 3,700 5,500
just upstream of U.S. Route 30 15.10 1,550 2,650 3,200 4,700
900 ft upstream of upstream Chessie System Br. 11.30 1,300 2,200 2,700 3,400
1Data not available
16
Table 6 - Summary of Discharges for Detailed Studies (Continued)
Peak Discharges (Cubic Feet per Second) 10%- 2%- 1%- 0.2%- Drainage Area Annual- Annual- Annual- Annual- Flooding Source and Location (Square Miles) Chance Chance Chance Chance
Seltzer Park Creek
at mouth 3.50 1,020 1,400 1,540 1,860
Seltzer Park Tributary
at mouth 1.20 400 550 600 740
Touby Run
at confluence with Rocky Fork 9.80 1,170 1,980 2,400 3,580
Tuby Run
at mouth 4.60 540 700 760 890
at confluence of Lower Tuby Tributary 2.40 330 430 500 600
Upper Tuby Tributary
at mouth 0.40 80 110 120 140
West Branch
at mouth 4.60 950 1,250 1,370 1,610
at confluence of West Branch Tributary 3.30 670 920 1,030 1,250
West Branch Bear Run
at mouth 1.20 330 450 500 610
West Branch Tributary
at mouth 0.80 250 350 380 470
17
Countywide
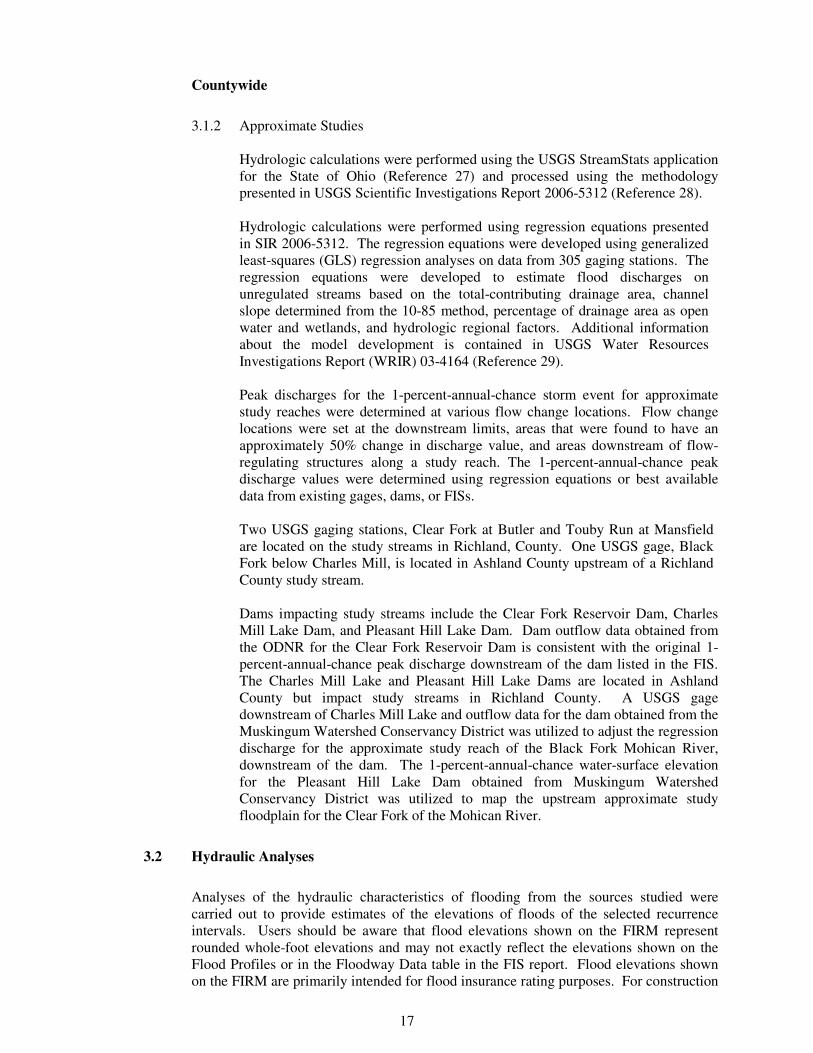
3.1.2 Approximate Studies
Hydrologic calculations were performed using the USGS StreamStats application for the State of Ohio (Reference 27) and processed using the methodology presented in USGS Scientific Investigations Report 2006-5312 (Reference 28).
Hydrologic calculations were performed using regression equations presented in SIR 2006-5312. The regression equations were developed using generalized least-squares (GLS) regression analyses on data from 305 gaging stations. The regression equations were developed to estimate flood discharges on unregulated streams based on the total-contributing drainage area, channel slope determined from the 10-85 method, percentage of drainage area as open water and wetlands, and hydrologic regional factors. Additional information about the model development is contained in USGS Water Resources Investigations Report (WRIR) 03-4164 (Reference 29). Peak discharges for the 1-percent-annual-chance storm event for approximate study reaches were determined at various flow change locations. Flow change locations were set at the downstream limits, areas that were found to have an approximately 50% change in discharge value, and areas downstream of flow-regulating structures along a study reach. The 1-percent-annual-chance peak discharge values were determined using regression equations or best available data from existing gages, dams, or FISs. Two USGS gaging stations, Clear Fork at Butler and Touby Run at Mansfield are located on the study streams in Richland, County. One USGS gage, Black Fork below Charles Mill, is located in Ashland County upstream of a Richland County study stream. Dams impacting study streams include the Clear Fork Reservoir Dam, Charles Mill Lake Dam, and Pleasant Hill Lake Dam. Dam outflow data obtained from the ODNR for the Clear Fork Reservoir Dam is consistent with the original 1-percent-annual-chance peak discharge downstream of the dam listed in the FIS. The Charles Mill Lake and Pleasant Hill Lake Dams are located in Ashland County but impact study streams in Richland County. A USGS gage downstream of Charles Mill Lake and outflow data for the dam obtained from the Muskingum Watershed Conservancy District was utilized to adjust the regression discharge for the approximate study reach of the Black Fork Mohican River, downstream of the dam. The 1-percent-annual-chance water-surface elevation for the Pleasant Hill Lake Dam obtained from Muskingum Watershed Conservancy District was utilized to map the upstream approximate study floodplain for the Clear Fork of the Mohican River.
3.2 Hydraulic Analyses
Analyses of the hydraulic characteristics of flooding from the sources studied were carried out to provide estimates of the elevations of floods of the selected recurrence intervals. Users should be aware that flood elevations shown on the FIRM represent rounded whole-foot elevations and may not exactly reflect the elevations shown on the Flood Profiles or in the Floodway Data table in the FIS report. Flood elevations shown on the FIRM are primarily intended for flood insurance rating purposes. For construction
18
and/or floodplain management purposes, users are cautioned to use the flood elevation data presented in this FIS report in conjunction with the data shown on the FIRM. The hydraulic analyses for this study were based on unobstructed flow. The flood elevations shown on the profiles are thus considered valid only if hydraulic structures remain unobstructed, operate properly, and do not fail. Locations of selected cross sections used in the hydraulic analyses are shown on the Flood Profiles and on the FIRMs. This section includes information form previously published FIS reports where streams were studied in detail. It also includes new information for streams studied by approximate methods. All elevations are referenced to the North American Vertical Datum of 1988 (NAVD). Elevation reference marks used in this study, and their descriptions, are shown on the FIRM.
Pre-Countywide 3.2.1 Detailed Studies
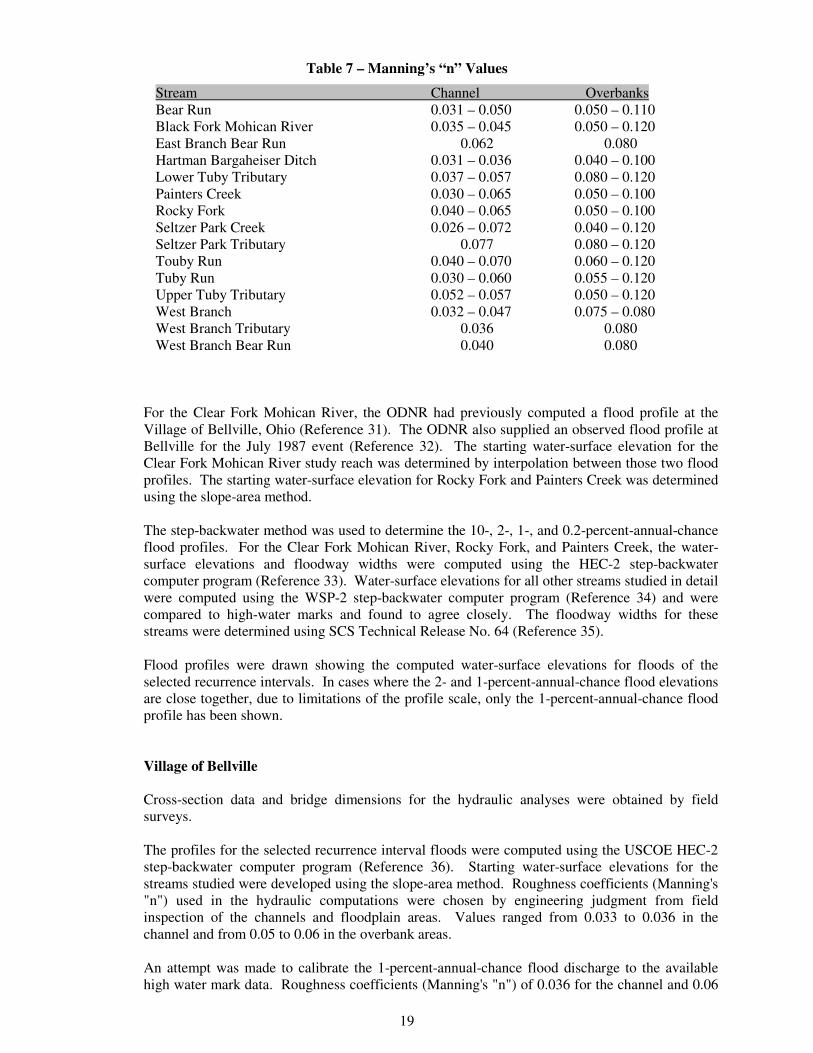
Photogrammetry was employed to obtain floodplain cross sections and pertinent bridge/roadway profiles on the Clear Fork Mohican River and Rocky Fork. The below-water portion of these selected cross sections and waterway openings of pertinent bridges was field measured. In many cases, these waterway openings were taken from available bridge plans. All other cross sections and dimensions of backwater-producing structures were obtained from field survey. Roughness coefficients (Manning's "n") for the Clear Fork Mohican River and Rocky Fork were chosen based upon field observation of the stream and floodplain areas. For Rocky Fork, the channel value equaled 0.028 and the overbank values range from 0.042 to 0.084. The channel values for the Clear Fork Mohican River range from 0.035 to 0.040, and the overbank values range from 0.05 to 0.12. All other roughness coefficients for channel and floodplain areas were based on field observations and developed using SCS guidelines (Reference 30). A summary of the n-values used for the detailed streams is listed in the Table 7.
19
Table 7 – Manning’s “n” Values
Stream Channel Overbanks Bear Run 0.031 – 0.050 0.050 – 0.110 Black Fork Mohican River 0.035 – 0.045 0.050 – 0.120 East Branch Bear Run 0.062 0.080 Hartman Bargaheiser Ditch 0.031 – 0.036 0.040 – 0.100 Lower Tuby Tributary 0.037 – 0.057 0.080 – 0.120 Painters Creek 0.030 – 0.065 0.050 – 0.100 Rocky Fork 0.040 – 0.065 0.050 – 0.100 Seltzer Park Creek 0.026 – 0.072 0.040 – 0.120 Seltzer Park Tributary 0.077 0.080 – 0.120 Touby Run 0.040 – 0.070 0.060 – 0.120 Tuby Run 0.030 – 0.060 0.055 – 0.120 Upper Tuby Tributary 0.052 – 0.057 0.050 – 0.120 West Branch 0.032 – 0.047 0.075 – 0.080 West Branch Tributary 0.036 0.080 West Branch Bear Run 0.040 0.080
For the Clear Fork Mohican River, the ODNR had previously computed a flood profile at the Village of Bellville, Ohio (Reference 31). The ODNR also supplied an observed flood profile at Bellville for the July 1987 event (Reference 32). The starting water-surface elevation for the Clear Fork Mohican River study reach was determined by interpolation between those two flood profiles. The starting water-surface elevation for Rocky Fork and Painters Creek was determined using the slope-area method.
The step-backwater method was used to determine the 10-, 2-, 1-, and 0.2-percent-annual-chance flood profiles. For the Clear Fork Mohican River, Rocky Fork, and Painters Creek, the water-surface elevations and floodway widths were computed using the HEC-2 step-backwater computer program (Reference 33). Water-surface elevations for all other streams studied in detail were computed using the WSP-2 step-backwater computer program (Reference 34) and were compared to high-water marks and found to agree closely. The floodway widths for these streams were determined using SCS Technical Release No. 64 (Reference 35). Flood profiles were drawn showing the computed water-surface elevations for floods of the selected recurrence intervals. In cases where the 2- and 1-percent-annual-chance flood elevations are close together, due to limitations of the profile scale, only the 1-percent-annual-chance flood profile has been shown. Village of Bellville Cross-section data and bridge dimensions for the hydraulic analyses were obtained by field surveys. The profiles for the selected recurrence interval floods were computed using the USCOE HEC-2 step-backwater computer program (Reference 36). Starting water-surface elevations for the streams studied were developed using the slope-area method. Roughness coefficients (Manning's "n") used in the hydraulic computations were chosen by engineering judgment from field inspection of the channels and floodplain areas. Values ranged from 0.033 to 0.036 in the channel and from 0.05 to 0.06 in the overbank areas. An attempt was made to calibrate the 1-percent-annual-chance flood discharge to the available high water mark data. Roughness coefficients (Manning's "n") of 0.036 for the channel and 0.06
20
for the overbank were required to approximate the high water marks. This appears to be reasonable since the storm occurred during the summer when foliage along the stream banks and floodplain had reached the maximum growth state.
Flood profiles were drawn showing the computed water-surface elevations for floods of the selected recurrence intervals. Village of Butler Photogrammetry was employed to obtain floodplain cross sections and the State Route 95 bridge/roadway profile. The below-water portion of selected cross sections and the State Route 95 Bridge was field surveyed. Other aspects of the State Route 95 bridge-waterway opening were taken from available bridge plans. Channel and overbank roughness coefficients (Manning’s "n") for the Clear Fork Mohican River were chosen based on field observation of the stream and floodplain areas. The channel "n" value is 0.052, while the overbank "n" values range from 0.075 to 0.180. Water-surface elevations were computed using the HEC-2 step-backwater computer program (Reference 33). Starting water-surface elevations were determined using the slope-area method. The rating curve for the gage station at Butler was revised by the USGS following the July 1987 flood. The water-surface elevation calculated at that gage for this report agrees with the gage height associated with the 1-percent-annual-chance discharge determined from the rating curve. City of Mansfield Cross sections for the backwater analyses for the detailed studies of Rocky Fork, Touby Run, and Painters Creek were obtained from field surveys and topographic mapping. For Rocky Fork upstream of U.S. Route 30 and for Painters Creek upstream of Ashland Road, all sections were field surveyed. For the remaining segments of Rocky Fork and Painters Creek and for all of Touby Run, representative channel sections were field surveyed and the overbank portion of the cross sections was obtained from 1981 aerial photographs and 1982 topographic mapping based on those photographs (Reference 37). All bridges and culverts were field surveyed to obtain elevation data and structural geometry. The USCOE, Huntington District, provided the cross-section data for Rocky Fork up to U.S. Route 30 and for Touby Run up to Mulberry Street (Reference 18). The USCOE also provided the 1982 topographic mapping and the bridge elevation data and structural geometry for Touby Run from Mulberry Street to Bowman Street (Reference 18).
Roughness factors (Manning's "n") used in the hydraulic computations were chosen by engineering judgment and based on aerial photographs, field observations of the streams and flood plain areas, and published data for roughness factors of natural channels (References 38, 39, and 40). For the detailed study reaches on Rocky Fork, Touby Run, and Painters Creek, water-surface elevations of floods of the selected recurrence intervals were computed through use of the USCOE HEC-2 step-backwater computer program (Reference 33). Flood profiles were drawn showing the computed water-surface elevations for floods of the selected recurrence intervals. Starting water-surface elevations for Rocky Fork and Painters Creek were calculated using the slope-area method. Those for Touby Run were assumed to be equal to the flood elevations for the same flood event on Rocky Fork at the confluence with Touby Run. During a 1-percent-annual-chance flood event, Touby Run overflows its banks downstream of
21
Mulberry Street. A portion of the floodwater cascades over the railroad tracks with 1 to 2 feet of head. City of Shelby Cross sections and dimensions of backwater-producing structures were obtained from field survey. Channel and floodplain roughness factors (Manning's "n") used in the hydraulic computations were developed using the "Guide for Selecting Roughness Coefficient "n" Values for Channels" (Reference 30) and from field observation. The floodway width was computed using the SCS "Floodway Determination Computer Program" (Reference 35). The floodway width was determined by equal conveyance. Flood profiles were drawn showing the computed water-surface elevations for floods of the selected recurrence intervals. In cases where the 2- and 1-percent-annual-chance flood elevations are close together, due to limitations of the profile scale, only the 1-percent-annual-chance profile has been shown. Countywide
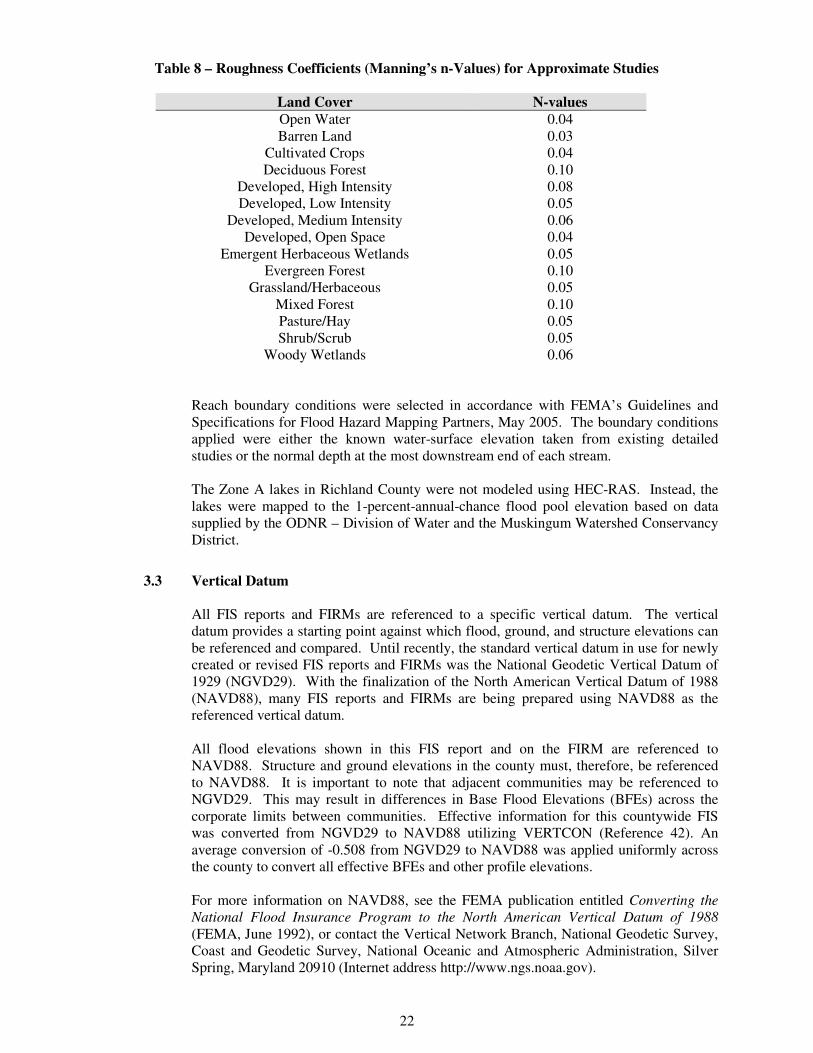
3.2.2 Approximate Studies For this Countywide FIS, hydraulic analyses were performed on the approximate study stream reaches to determine the water surface elevations for the 1-percent-annual-chance flood event. Water surface elevations were computed using the USCOE HEC-RAS 4.0.0. Cross-section geometric data was extracted from a Triangulated Irregular Network (TIN) created from 2005 Light Detection and Ranging (LIDAR) points obtained form the Richland County GIS Consortium. Overbank Manning’s “n” values were estimated from a 2001 National Land Cover Dataset of Ohio prepared by the USGS. Field reconnaissance was not performed. Channel “n” values were assumed to be 0.035. The overbank “n” values were extracted from GIS using HEC-GeoRAS 4.1. Table 8 shows the overbank Manning’s “n” values used for each corresponding land use. These values were taken from Chow (Reference 40) and McCuen (Reference 41).
22
Table 8 – Roughness Coefficients (Manning’s n-Values) for Approximate Studies
Land Cover N-values Open Water 0.04 Barren Land 0.03
Cultivated Crops 0.04 Deciduous Forest 0.10
Developed, High Intensity 0.08 Developed, Low Intensity 0.05
Developed, Medium Intensity 0.06 Developed, Open Space 0.04
Emergent Herbaceous Wetlands 0.05 Evergreen Forest 0.10
Grassland/Herbaceous 0.05 Mixed Forest 0.10 Pasture/Hay 0.05 Shrub/Scrub 0.05
Woody Wetlands 0.06 Reach boundary conditions were selected in accordance with FEMA’s Guidelines and Specifications for Flood Hazard Mapping Partners, May 2005. The boundary conditions applied were either the known water-surface elevation taken from existing detailed studies or the normal depth at the most downstream end of each stream. The Zone A lakes in Richland County were not modeled using HEC-RAS. Instead, the lakes were mapped to the 1-percent-annual-chance flood pool elevation based on data supplied by the ODNR – Division of Water and the Muskingum Watershed Conservancy District.
3.3 Vertical Datum
All FIS reports and FIRMs are referenced to a specific vertical datum. The vertical datum provides a starting point against which flood, ground, and structure elevations can be referenced and compared. Until recently, the standard vertical datum in use for newly created or revised FIS reports and FIRMs was the National Geodetic Vertical Datum of 1929 (NGVD29). With the finalization of the North American Vertical Datum of 1988 (NAVD88), many FIS reports and FIRMs are being prepared using NAVD88 as the referenced vertical datum. All flood elevations shown in this FIS report and on the FIRM are referenced to NAVD88. Structure and ground elevations in the county must, therefore, be referenced to NAVD88. It is important to note that adjacent communities may be referenced to NGVD29. This may result in differences in Base Flood Elevations (BFEs) across the corporate limits between communities. Effective information for this countywide FIS was converted from NGVD29 to NAVD88 utilizing VERTCON (Reference 42). An average conversion of -0.508 from NGVD29 to NAVD88 was applied uniformly across the county to convert all effective BFEs and other profile elevations. For more information on NAVD88, see the FEMA publication entitled Converting the National Flood Insurance Program to the North American Vertical Datum of 1988 (FEMA, June 1992), or contact the Vertical Network Branch, National Geodetic Survey, Coast and Geodetic Survey, National Oceanic and Atmospheric Administration, Silver Spring, Maryland 20910 (Internet address http://www.ngs.noaa.gov).
23
All qualifying bench marks within a given jurisdiction that are cataloged by the Nation Geodetic Survey (NGS) and entered into the National Spatial Reference System (NSRS) as First or Second Order Vertical and have a vertical stability classification of A, B, or C are shown and labeled on the FIRM with their 6-character NSRS Permanent Identifier. Bench marks cataloged by the NGS and entered into the NSRS vary widely in vertical stability classification. NSRS vertical stability classifications are as follows:
• Stability A: Monuments of the most reliable nature, expected to hold position/elevation well (e.g., mounted in bedrock).
• Stability B: Monuments which generally hold their position/elevation will (e.g.,
concrete bridge abutment).
• Stability C: Monuments which may be affected by surface ground movements (e.g. concrete monument blow frost line).
• Stability D: Mark of questionable or unknown vertical stability (e.g., concrete
monument above frost line, or steel witness post).
In addition to NSRS bench marks, the FIRM may also show vertical control monuments established by a local jurisdiction; these monuments will be shown on the FIRM with the appropriate designations. Local monuments will only be place on the FIRM if the community has requested that they be included, and if the monuments meet the aforementioned NSRS inclusion criteria. To obtain current elevation, description, and/or location information for bench marks shown on the FIRM for this jurisdiction, please contact the Information Services Branch of the NGS at (301) 713-3242, or visit their website at www.ngs.noaa.gov. It is important to note that temporary vertical monuments are often established during the preparation of a flood hazard analysis for the purpose of establishing local vertical control. Although these monuments are not shown on the FIRM, they may be found in the TSDN associated with this FIS and FIRM. Interested individuals my contact FEMA to access this data.
4.0 FLOODPLAIN MANAGEMENT APPLICATIONS
The NFIP encourages State and local governments to adopt sound floodplain management programs. Therefore, each FIS provides 1-percent-annual-chance flood elevations and delineations of the 1- and 0.2-percent-annual-chance floodplain boundaries and 1-percent-annual-chance floodway to assist communities in developing floodplain management measures. This information is presented on the FIRM and in many components of the FIS report, including Flood Profiles and Floodway Data table. Users should reference the data presented in the FIS report as well as additional information that may be available at the local map repository before making flood elevation and/or floodplain boundary determinations. 4.1 Floodplain Boundaries
In order to provide a national standard without regional discrimination, the 1-percent-annual-chance flood has been adopted by FEMA as the base flood for floodplain management purposes. The 0.2-percent-annual-chance flood is employed to indicate additional areas of flood risk in the community. For each stream studied by detailed methods, the 1- and 0.2-percent-annual-chance floodplain boundaries have been delineated using the flood elevations determined at each
24
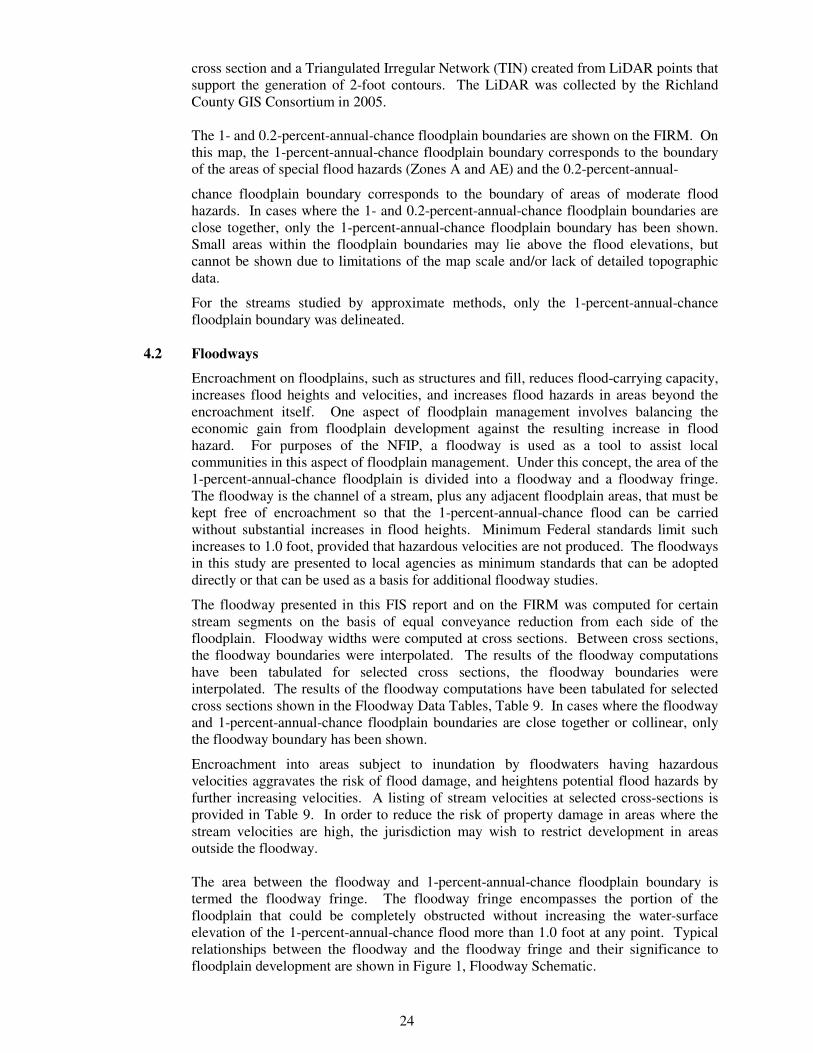
cross section and a Triangulated Irregular Network (TIN) created from LiDAR points that support the generation of 2-foot contours. The LiDAR was collected by the Richland County GIS Consortium in 2005. The 1- and 0.2-percent-annual-chance floodplain boundaries are shown on the FIRM. On this map, the 1-percent-annual-chance floodplain boundary corresponds to the boundary of the areas of special flood hazards (Zones A and AE) and the 0.2-percent-annual-
chance floodplain boundary corresponds to the boundary of areas of moderate flood hazards. In cases where the 1- and 0.2-percent-annual-chance floodplain boundaries are close together, only the 1-percent-annual-chance floodplain boundary has been shown. Small areas within the floodplain boundaries may lie above the flood elevations, but cannot be shown due to limitations of the map scale and/or lack of detailed topographic data.
For the streams studied by approximate methods, only the 1-percent-annual-chance floodplain boundary was delineated.
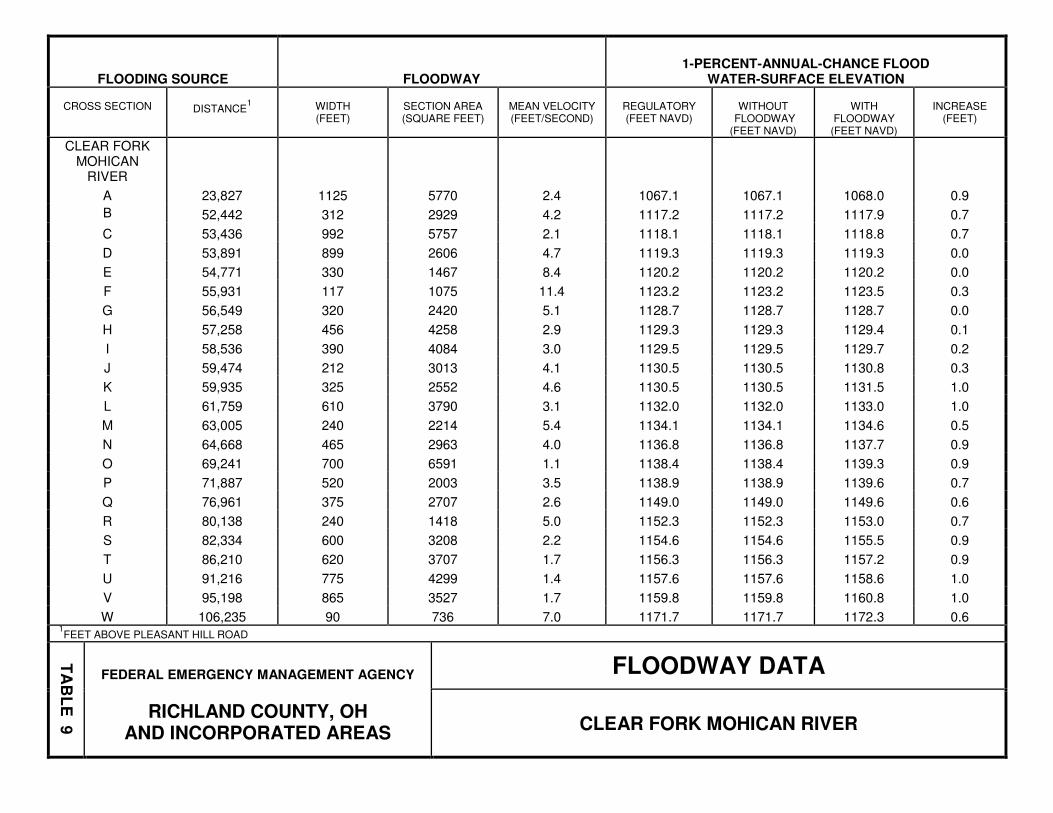
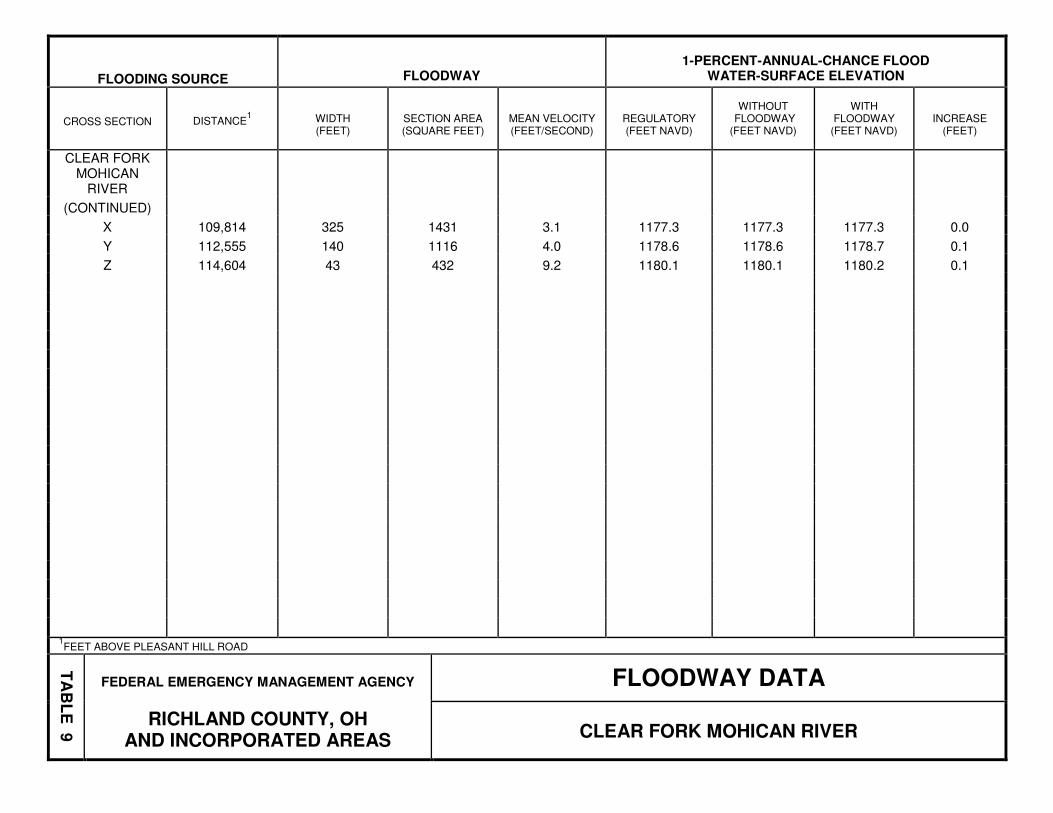
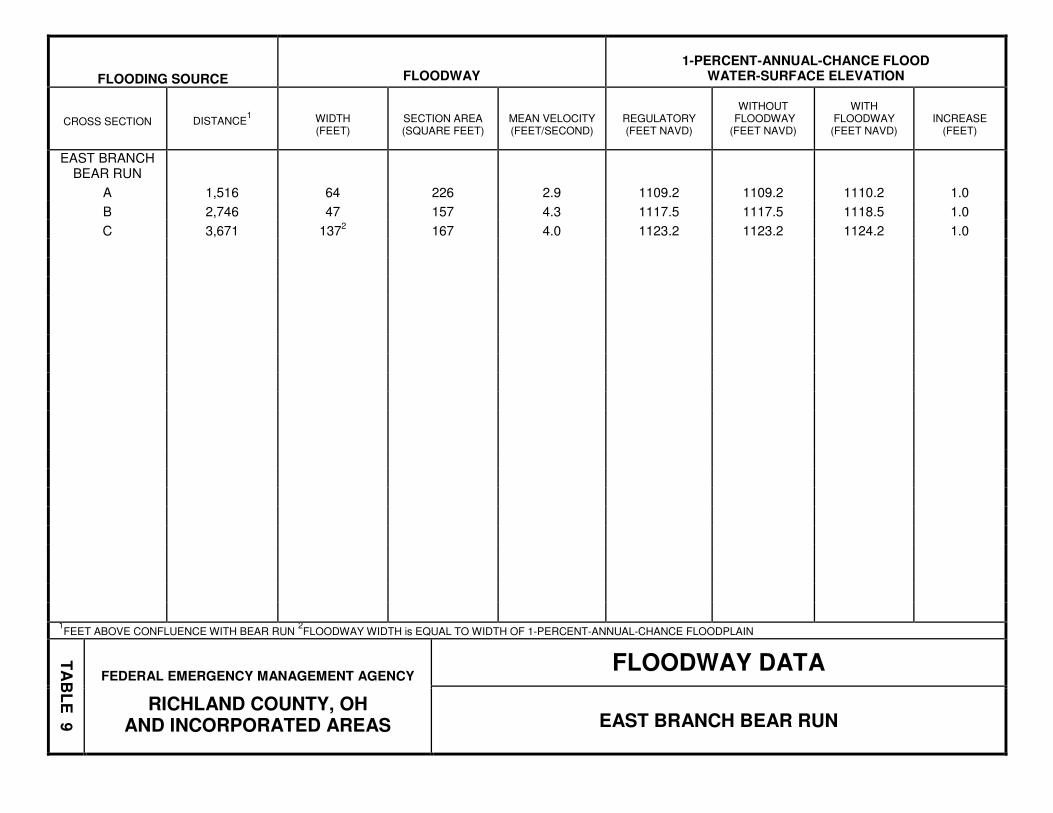
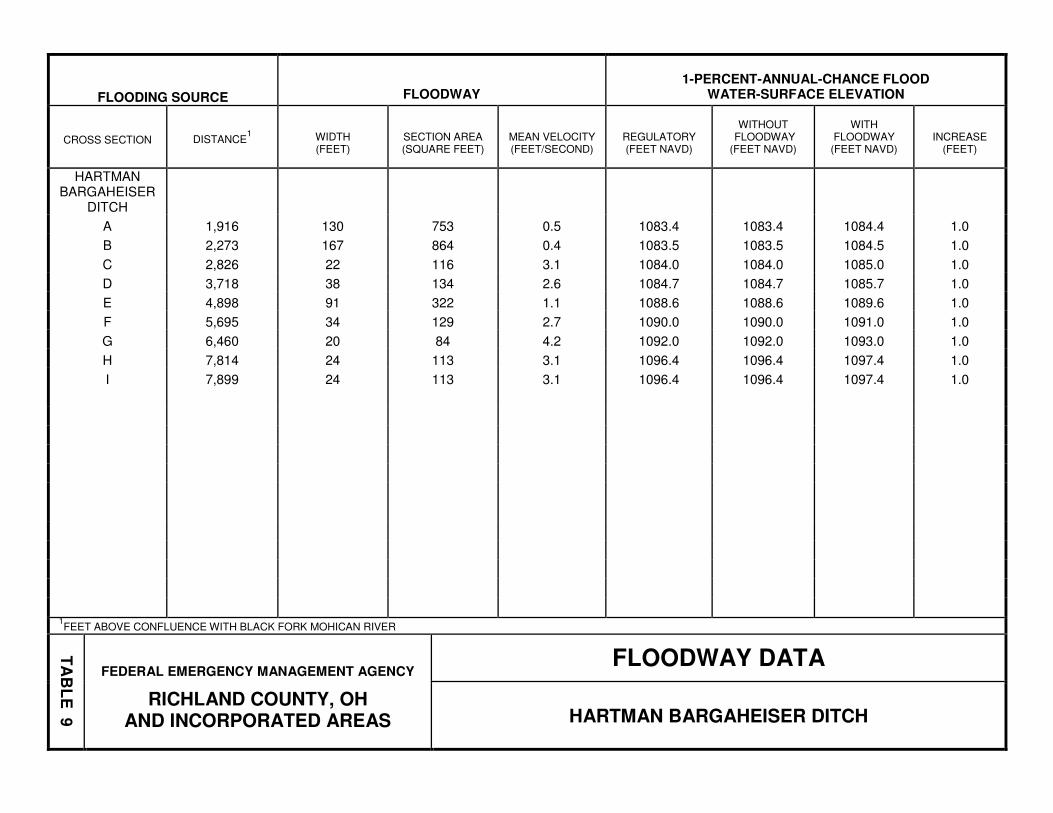
4.2 Floodways
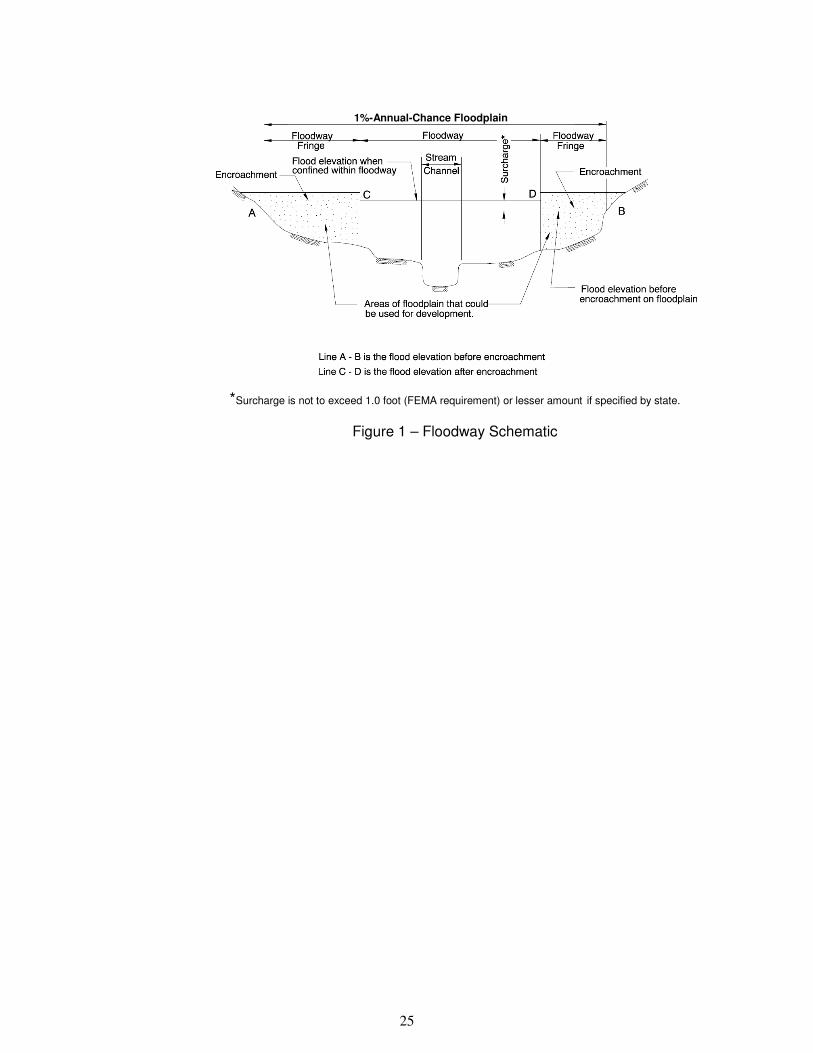
Encroachment on floodplains, such as structures and fill, reduces flood-carrying capacity, increases flood heights and velocities, and increases flood hazards in areas beyond the encroachment itself. One aspect of floodplain management involves balancing the economic gain from floodplain development against the resulting increase in flood hazard. For purposes of the NFIP, a floodway is used as a tool to assist local communities in this aspect of floodplain management. Under this concept, the area of the 1-percent-annual-chance floodplain is divided into a floodway and a floodway fringe. The floodway is the channel of a stream, plus any adjacent floodplain areas, that must be kept free of encroachment so that the 1-percent-annual-chance flood can be carried without substantial increases in flood heights. Minimum Federal standards limit such increases to 1.0 foot, provided that hazardous velocities are not produced. The floodways in this study are presented to local agencies as minimum standards that can be adopted directly or that can be used as a basis for additional floodway studies.
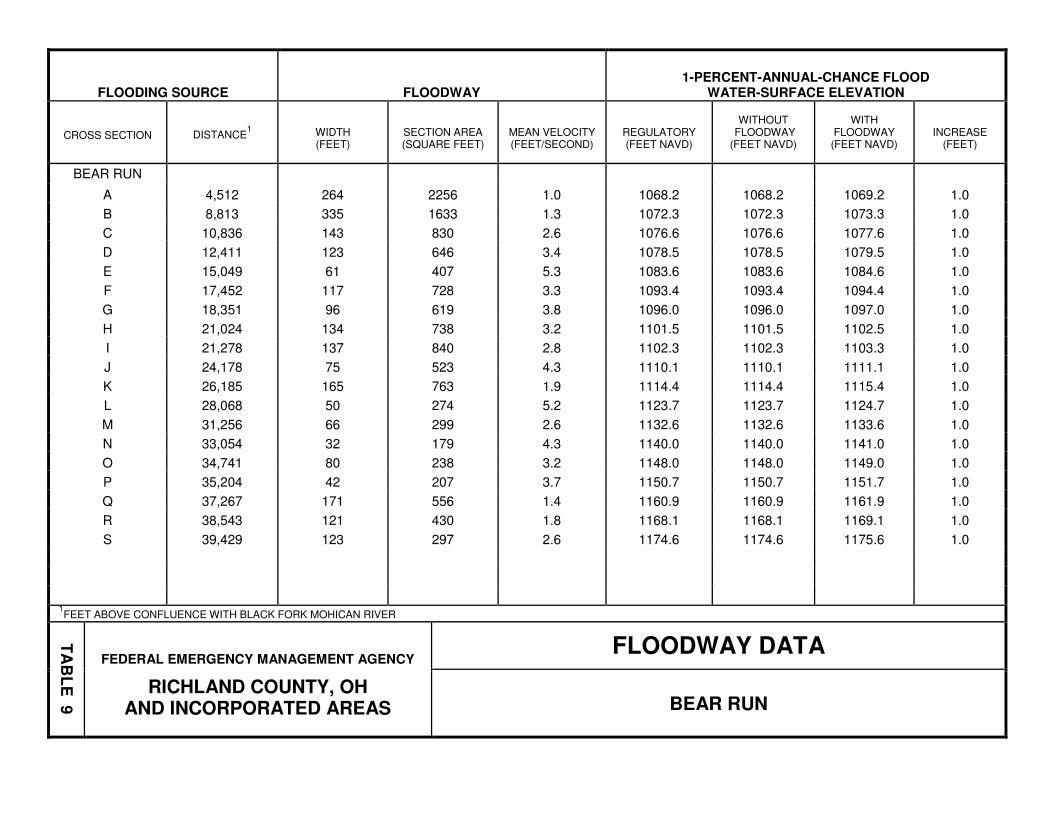
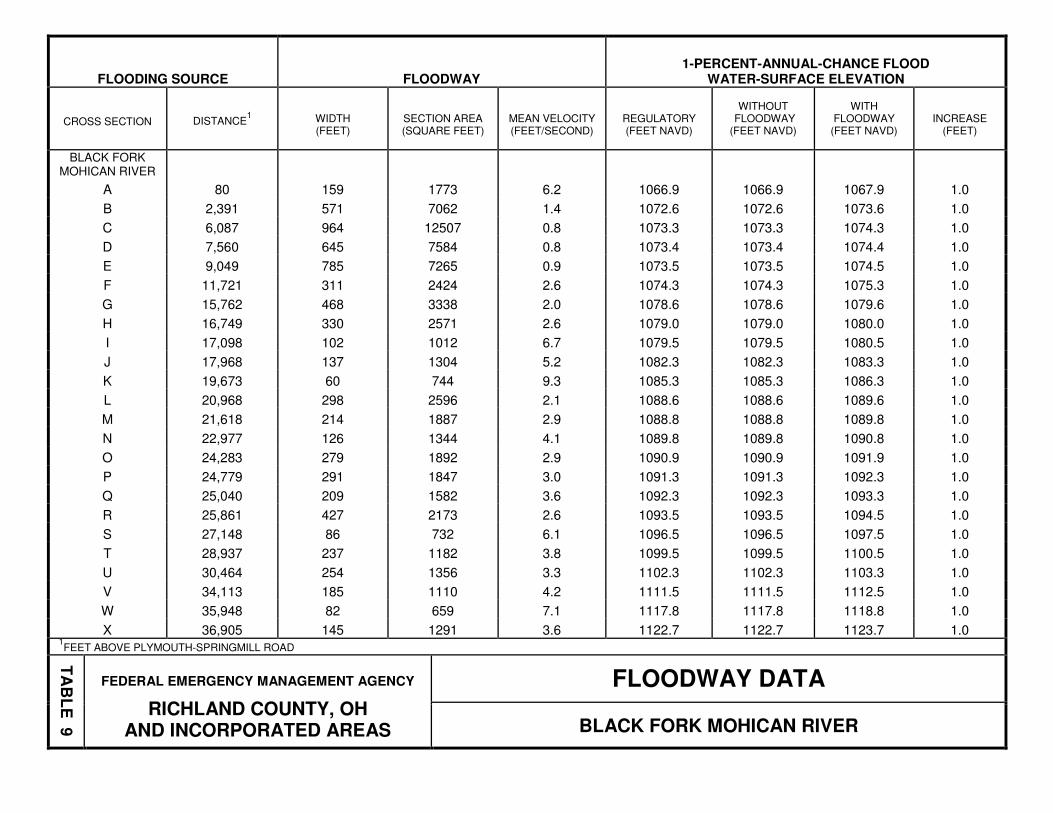
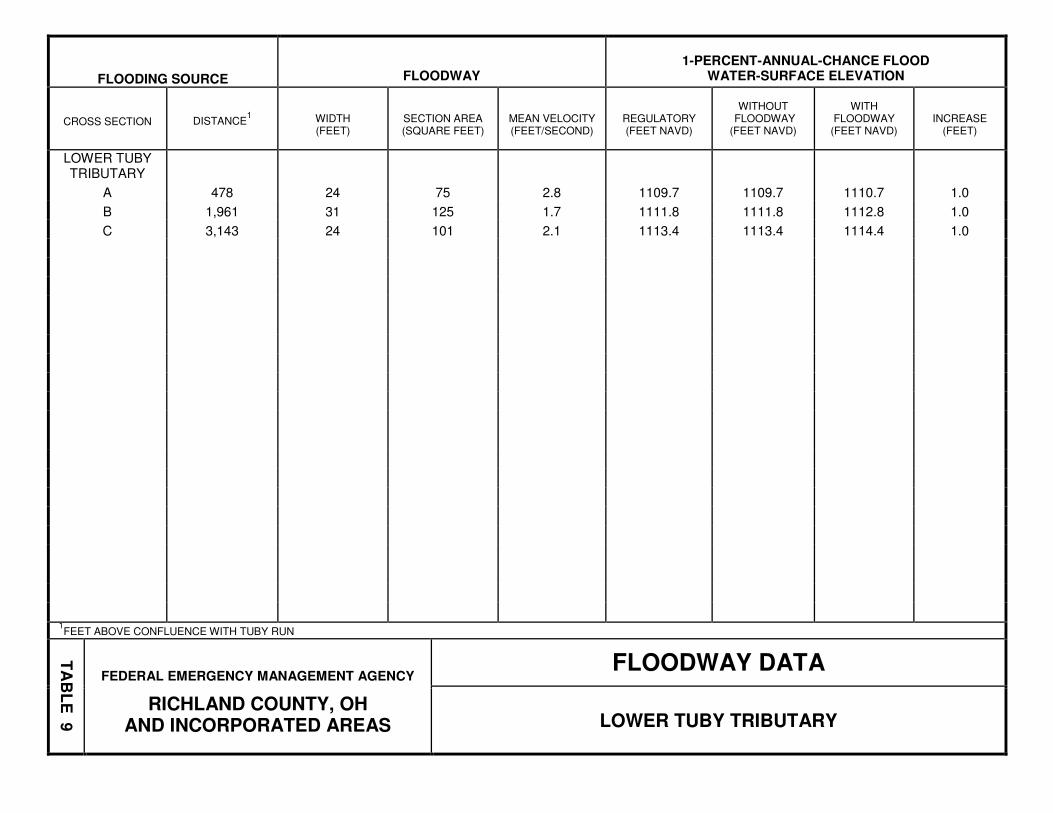
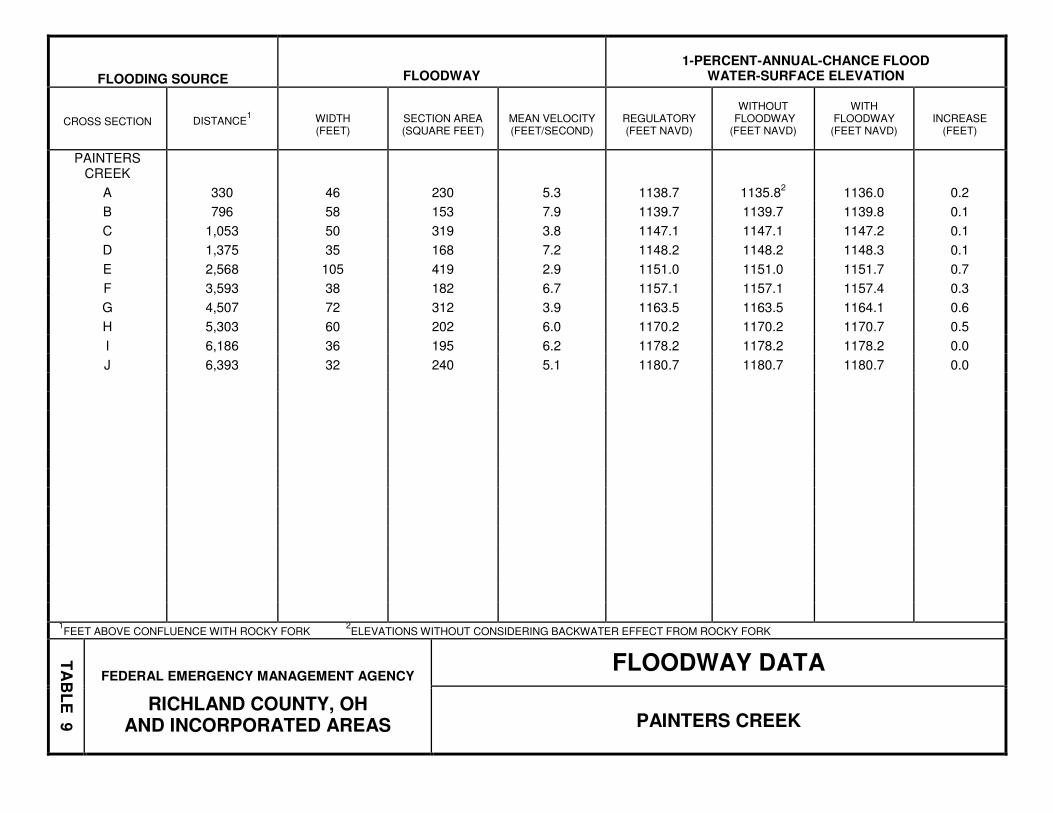
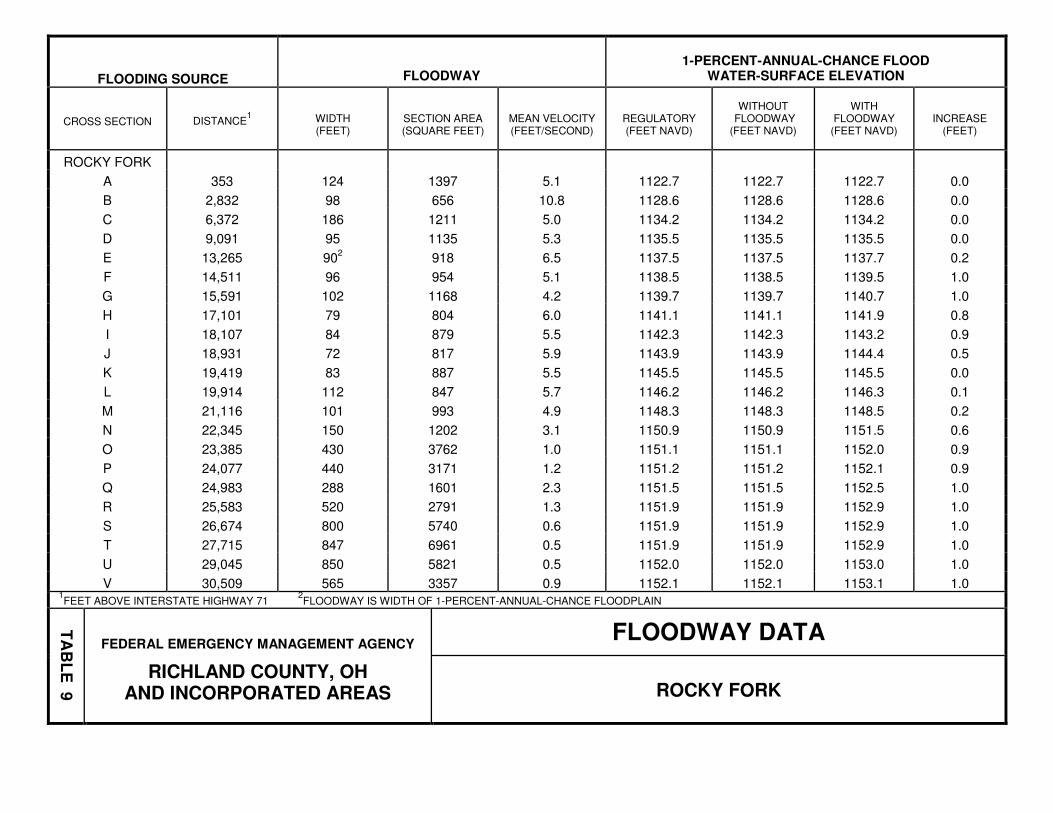
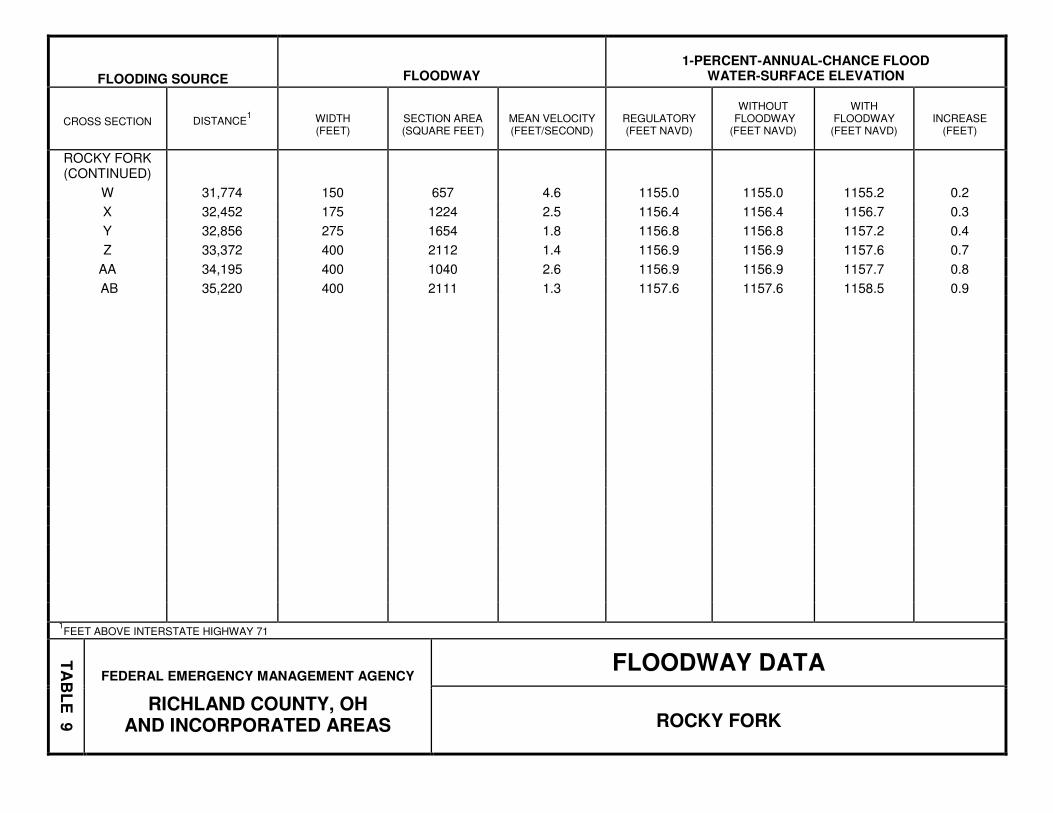
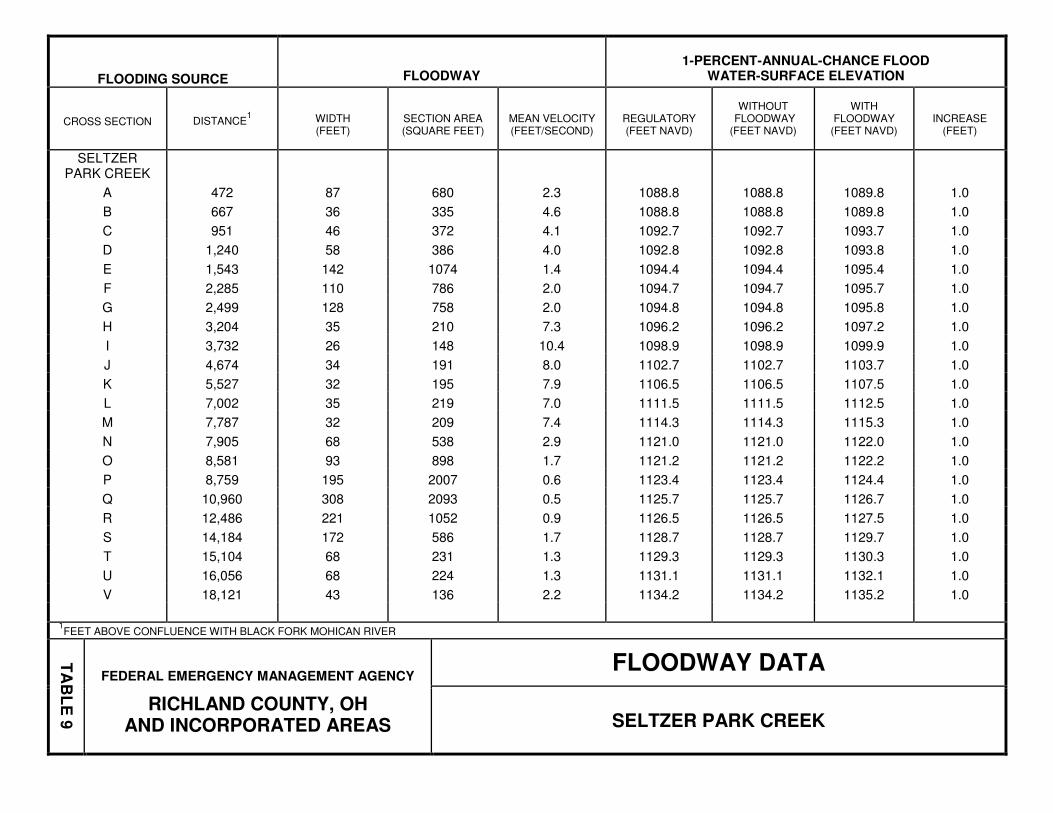
The floodway presented in this FIS report and on the FIRM was computed for certain stream segments on the basis of equal conveyance reduction from each side of the floodplain. Floodway widths were computed at cross sections. Between cross sections, the floodway boundaries were interpolated. The results of the floodway computations have been tabulated for selected cross sections, the floodway boundaries were interpolated. The results of the floodway computations have been tabulated for selected cross sections shown in the Floodway Data Tables, Table 9. In cases where the floodway and 1-percent-annual-chance floodplain boundaries are close together or collinear, only the floodway boundary has been shown.
Encroachment into areas subject to inundation by floodwaters having hazardous velocities aggravates the risk of flood damage, and heightens potential flood hazards by further increasing velocities. A listing of stream velocities at selected cross-sections is provided in Table 9. In order to reduce the risk of property damage in areas where the stream velocities are high, the jurisdiction may wish to restrict development in areas outside the floodway. The area between the floodway and 1-percent-annual-chance floodplain boundary is termed the floodway fringe. The floodway fringe encompasses the portion of the floodplain that could be completely obstructed without increasing the water-surface elevation of the 1-percent-annual-chance flood more than 1.0 foot at any point. Typical relationships between the floodway and the floodway fringe and their significance to floodplain development are shown in Figure 1, Floodway Schematic.
25
*Surcharge is not to exceed 1.0 foot (FEMA requirement) or lesser amount if specified by state.
Figure 1 – Floodway Schematic
1%-Annual-Chance Floodplain
FLOODING SOURCE
FLOODWAY
1-PERCENT-ANNUAL-CHANCE FLOOD
WATER-SURFACE ELEVATION
CROSS SECTION
DISTANCE1
WIDTH (FEET)
SECTION AREA (SQUARE FEET)
MEAN VELOCITY (FEET/SECOND)
REGULATORY (FEET NAVD)
WITHOUT
FLOODWAY (FEET NAVD)
WITH
FLOODWAY (FEET NAVD)
INCREASE (FEET)
BEAR RUN A 4,512 264 2256 1.0 1068.2 1068.2 1069.2 1.0 B 8,813 335 1633 1.3 1072.3 1072.3 1073.3 1.0 C 10,836 143 830 2.6 1076.6 1076.6 1077.6 1.0 D 12,411 123 646 3.4 1078.5 1078.5 1079.5 1.0 E 15,049 61 407 5.3 1083.6 1083.6 1084.6 1.0 F 17,452 117 728 3.3 1093.4 1093.4 1094.4 1.0 G 18,351 96 619 3.8 1096.0 1096.0 1097.0 1.0 H 21,024 134 738 3.2 1101.5 1101.5 1102.5 1.0 I 21,278 137 840 2.8 1102.3 1102.3 1103.3 1.0 J 24,178 75 523 4.3 1110.1 1110.1 1111.1 1.0 K 26,185 165 763 1.9 1114.4 1114.4 1115.4 1.0 L 28,068 50 274 5.2 1123.7 1123.7 1124.7 1.0 M 31,256 66 299 2.6 1132.6 1132.6 1133.6 1.0 N 33,054 32 179 4.3 1140.0 1140.0 1141.0 1.0 O 34,741 80 238 3.2 1148.0 1148.0 1149.0 1.0 P 35,204 42 207 3.7 1150.7 1150.7 1151.7 1.0 Q 37,267 171 556 1.4 1160.9 1160.9 1161.9 1.0 R 38,543 121 430 1.8 1168.1 1168.1 1169.1 1.0 S 39,429 123 297 2.6 1174.6 1174.6 1175.6 1.0
1FEET ABOVE CONFLUENCE WITH BLACK FORK MOHICAN RIVER
TAB
LE 9
FEDERAL EMERGENCY MANAGEMENT AGENCY
RICHLAND COUNTY, OH
AND INCORPORATED AREAS
FLOODWAY DATA
BEAR RUN
FLOODING SOURCE
FLOODWAY
1-PERCENT-ANNUAL-CHANCE FLOOD
WATER-SURFACE ELEVATION
CROSS SECTION
DISTANCE1
WIDTH (FEET)
SECTION AREA (SQUARE FEET)
MEAN VELOCITY (FEET/SECOND)
REGULATORY (FEET NAVD)
WITHOUT
FLOODWAY (FEET NAVD)
WITH
FLOODWAY (FEET NAVD)
INCREASE (FEET)
BLACK FORK
MOHICAN RIVER A 80 159 1773 6.2 1066.9 1066.9 1067.9 1.0 B 2,391 571 7062 1.4 1072.6 1072.6 1073.6 1.0 C 6,087 964 12507 0.8 1073.3 1073.3 1074.3 1.0 D 7,560 645 7584 0.8 1073.4 1073.4 1074.4 1.0 E 9,049 785 7265 0.9 1073.5 1073.5 1074.5 1.0 F 11,721 311 2424 2.6 1074.3 1074.3 1075.3 1.0 G 15,762 468 3338 2.0 1078.6 1078.6 1079.6 1.0 H 16,749 330 2571 2.6 1079.0 1079.0 1080.0 1.0 I 17,098 102 1012 6.7 1079.5 1079.5 1080.5 1.0 J 17,968 137 1304 5.2 1082.3 1082.3 1083.3 1.0 K 19,673 60 744 9.3 1085.3 1085.3 1086.3 1.0 L 20,968 298 2596 2.1 1088.6 1088.6 1089.6 1.0 M 21,618 214 1887 2.9 1088.8 1088.8 1089.8 1.0 N 22,977 126 1344 4.1 1089.8 1089.8 1090.8 1.0 O 24,283 279 1892 2.9 1090.9 1090.9 1091.9 1.0 P 24,779 291 1847 3.0 1091.3 1091.3 1092.3 1.0 Q 25,040 209 1582 3.6 1092.3 1092.3 1093.3 1.0 R 25,861 427 2173 2.6 1093.5 1093.5 1094.5 1.0 S 27,148 86 732 6.1 1096.5 1096.5 1097.5 1.0 T 28,937 237 1182 3.8 1099.5 1099.5 1100.5 1.0 U 30,464 254 1356 3.3 1102.3 1102.3 1103.3 1.0 V 34,113 185 1110 4.2 1111.5 1111.5 1112.5 1.0 W 35,948 82 659 7.1 1117.8 1117.8 1118.8 1.0 X 36,905 145 1291 3.6 1122.7 1122.7 1123.7 1.0
1FEET ABOVE PLYMOUTH-SPRINGMILL ROAD
TAB
LE 9
FEDERAL EMERGENCY MANAGEMENT AGENCY
RICHLAND COUNTY, OH
AND INCORPORATED AREAS
FLOODWAY DATA
BLACK FORK MOHICAN RIVER
FLOODING SOURCE
FLOODWAY
1-PERCENT-ANNUAL-CHANCE FLOOD
WATER-SURFACE ELEVATION
CROSS SECTION
DISTANCE1
WIDTH (FEET)
SECTION AREA (SQUARE FEET)
MEAN VELOCITY (FEET/SECOND)
REGULATORY (FEET NAVD)
WITHOUT
FLOODWAY (FEET NAVD)
WITH
FLOODWAY (FEET NAVD)
INCREASE
(FEET)
CLEAR FORK MOHICAN
RIVER
A 23,827 1125 5770 2.4 1067.1 1067.1 1068.0 0.9 B 52,442 312 2929 4.2 1117.2 1117.2 1117.9 0.7 C 53,436 992 5757 2.1 1118.1 1118.1 1118.8 0.7 D 53,891 899 2606 4.7 1119.3 1119.3 1119.3 0.0 E 54,771 330 1467 8.4 1120.2 1120.2 1120.2 0.0 F 55,931 117 1075 11.4 1123.2 1123.2 1123.5 0.3 G 56,549 320 2420 5.1 1128.7 1128.7 1128.7 0.0 H 57,258 456 4258 2.9 1129.3 1129.3 1129.4 0.1 I 58,536 390 4084 3.0 1129.5 1129.5 1129.7 0.2 J 59,474 212 3013 4.1 1130.5 1130.5 1130.8 0.3 K 59,935 325 2552 4.6 1130.5 1130.5 1131.5 1.0 L 61,759 610 3790 3.1 1132.0 1132.0 1133.0 1.0 M 63,005 240 2214 5.4 1134.1 1134.1 1134.6 0.5 N 64,668 465 2963 4.0 1136.8 1136.8 1137.7 0.9 O 69,241 700 6591 1.1 1138.4 1138.4 1139.3 0.9 P 71,887 520 2003 3.5 1138.9 1138.9 1139.6 0.7 Q 76,961 375 2707 2.6 1149.0 1149.0 1149.6 0.6 R 80,138 240 1418 5.0 1152.3 1152.3 1153.0 0.7 S 82,334 600 3208 2.2 1154.6 1154.6 1155.5 0.9 T 86,210 620 3707 1.7 1156.3 1156.3 1157.2 0.9 U 91,216 775 4299 1.4 1157.6 1157.6 1158.6 1.0 V 95,198 865 3527 1.7 1159.8 1159.8 1160.8 1.0 W 106,235 90 736 7.0 1171.7 1171.7 1172.3 0.6
1FEET ABOVE PLEASANT HILL ROAD
TAB
LE 9
FEDERAL EMERGENCY MANAGEMENT AGENCY
RICHLAND COUNTY, OH
AND INCORPORATED AREAS
FLOODWAY DATA
CLEAR FORK MOHICAN RIVER
FLOODING SOURCE
FLOODWAY
1-PERCENT-ANNUAL-CHANCE FLOOD
WATER-SURFACE ELEVATION
CROSS SECTION
DISTANCE1
WIDTH (FEET)
SECTION AREA (SQUARE FEET)
MEAN VELOCITY (FEET/SECOND)
REGULATORY (FEET NAVD)
WITHOUT
FLOODWAY (FEET NAVD)
WITH
FLOODWAY (FEET NAVD)
INCREASE (FEET)
CLEAR FORK
MOHICAN RIVER
(CONTINUED) X 109,814 325 1431 3.1 1177.3 1177.3 1177.3 0.0 Y 112,555 140 1116 4.0 1178.6 1178.6 1178.7 0.1 Z 114,604 43 432 9.2 1180.1 1180.1 1180.2 0.1
1FEET ABOVE PLEASANT HILL ROAD
TAB
LE 9
FEDERAL EMERGENCY MANAGEMENT AGENCY
RICHLAND COUNTY, OH
AND INCORPORATED AREAS
FLOODWAY DATA
CLEAR FORK MOHICAN RIVER
FLOODING SOURCE
FLOODWAY
1-PERCENT-ANNUAL-CHANCE FLOOD
WATER-SURFACE ELEVATION
CROSS SECTION
DISTANCE1
WIDTH (FEET)
SECTION AREA (SQUARE FEET)
MEAN VELOCITY (FEET/SECOND)
REGULATORY (FEET NAVD)
WITHOUT
FLOODWAY (FEET NAVD)
WITH
FLOODWAY (FEET NAVD)
INCREASE (FEET)
EAST BRANCH
BEAR RUN A 1,516 64 226 2.9 1109.2 1109.2 1110.2 1.0 B 2,746 47 157 4.3 1117.5 1117.5 1118.5 1.0 C 3,671 1372 167 4.0 1123.2 1123.2 1124.2 1.0
1FEET ABOVE CONFLUENCE WITH BEAR RUN
2FLOODWAY WIDTH is EQUAL TO WIDTH OF 1-PERCENT-ANNUAL-CHANCE FLOODPLAIN
TAB
LE 9
FEDERAL EMERGENCY MANAGEMENT AGENCY
RICHLAND COUNTY, OH
AND INCORPORATED AREAS
FLOODWAY DATA
EAST BRANCH BEAR RUN
FLOODING SOURCE
FLOODWAY
1-PERCENT-ANNUAL-CHANCE FLOOD
WATER-SURFACE ELEVATION
CROSS SECTION
DISTANCE1
WIDTH (FEET)
SECTION AREA (SQUARE FEET)
MEAN VELOCITY (FEET/SECOND)
REGULATORY (FEET NAVD)
WITHOUT
FLOODWAY (FEET NAVD)
WITH
FLOODWAY (FEET NAVD)
INCREASE (FEET)
HARTMAN
BARGAHEISER DITCH
A 1,916 130 753 0.5 1083.4 1083.4 1084.4 1.0 B 2,273 167 864 0.4 1083.5 1083.5 1084.5 1.0 C 2,826 22 116 3.1 1084.0 1084.0 1085.0 1.0 D 3,718 38 134 2.6 1084.7 1084.7 1085.7 1.0 E 4,898 91 322 1.1 1088.6 1088.6 1089.6 1.0 F 5,695 34 129 2.7 1090.0 1090.0 1091.0 1.0 G 6,460 20 84 4.2 1092.0 1092.0 1093.0 1.0 H 7,814 24 113 3.1 1096.4 1096.4 1097.4 1.0 I 7,899 24 113 3.1 1096.4 1096.4 1097.4 1.0
1FEET ABOVE CONFLUENCE WITH BLACK FORK MOHICAN RIVER
TAB
LE 9
FEDERAL EMERGENCY MANAGEMENT AGENCY
RICHLAND COUNTY, OH
AND INCORPORATED AREAS
FLOODWAY DATA
HARTMAN BARGAHEISER DITCH
FLOODING SOURCE
FLOODWAY
1-PERCENT-ANNUAL-CHANCE FLOOD
WATER-SURFACE ELEVATION
CROSS SECTION
DISTANCE1
WIDTH (FEET)
SECTION AREA (SQUARE FEET)
MEAN VELOCITY (FEET/SECOND)
REGULATORY (FEET NAVD)
WITHOUT
FLOODWAY (FEET NAVD)
WITH
FLOODWAY (FEET NAVD)
INCREASE (FEET)
LOWER TUBY TRIBUTARY
A 478 24 75 2.8 1109.7 1109.7 1110.7 1.0 B 1,961 31 125 1.7 1111.8 1111.8 1112.8 1.0 C 3,143 24 101 2.1 1113.4 1113.4 1114.4 1.0
1FEET ABOVE CONFLUENCE WITH TUBY RUN
TAB
LE 9
FEDERAL EMERGENCY MANAGEMENT AGENCY
RICHLAND COUNTY, OH
AND INCORPORATED AREAS
FLOODWAY DATA
LOWER TUBY TRIBUTARY
FLOODING SOURCE
FLOODWAY
1-PERCENT-ANNUAL-CHANCE FLOOD
WATER-SURFACE ELEVATION
CROSS SECTION
DISTANCE1
WIDTH (FEET)
SECTION AREA (SQUARE FEET)
MEAN VELOCITY (FEET/SECOND)
REGULATORY (FEET NAVD)
WITHOUT
FLOODWAY (FEET NAVD)
WITH
FLOODWAY (FEET NAVD)
INCREASE (FEET)
PAINTERS
CREEK A 330 46 230 5.3 1138.7 1135.82 1136.0 0.2 B 796 58 153 7.9 1139.7 1139.7 1139.8 0.1 C 1,053 50 319 3.8 1147.1 1147.1 1147.2 0.1 D 1,375 35 168 7.2 1148.2 1148.2 1148.3 0.1 E 2,568 105 419 2.9 1151.0 1151.0 1151.7 0.7 F 3,593 38 182 6.7 1157.1 1157.1 1157.4 0.3 G 4,507 72 312 3.9 1163.5 1163.5 1164.1 0.6 H 5,303 60 202 6.0 1170.2 1170.2 1170.7 0.5 I 6,186 36 195 6.2 1178.2 1178.2 1178.2 0.0 J 6,393 32 240 5.1 1180.7 1180.7 1180.7 0.0
1FEET ABOVE CONFLUENCE WITH ROCKY FORK
2ELEVATIONS WITHOUT CONSIDERING BACKWATER EFFECT FROM ROCKY FORK
TAB
LE 9
FEDERAL EMERGENCY MANAGEMENT AGENCY
RICHLAND COUNTY, OH
AND INCORPORATED AREAS
FLOODWAY DATA
PAINTERS CREEK
FLOODING SOURCE
FLOODWAY
1-PERCENT-ANNUAL-CHANCE FLOOD
WATER-SURFACE ELEVATION
CROSS SECTION
DISTANCE1
WIDTH (FEET)
SECTION AREA (SQUARE FEET)
MEAN VELOCITY (FEET/SECOND)
REGULATORY (FEET NAVD)
WITHOUT
FLOODWAY (FEET NAVD)
WITH
FLOODWAY (FEET NAVD)
INCREASE (FEET)
ROCKY FORK A 353 124 1397 5.1 1122.7 1122.7 1122.7 0.0 B 2,832 98 656 10.8 1128.6 1128.6 1128.6 0.0 C 6,372 186 1211 5.0 1134.2 1134.2 1134.2 0.0 D 9,091 95 1135 5.3 1135.5 1135.5 1135.5 0.0 E 13,265 902 918 6.5 1137.5 1137.5 1137.7 0.2 F 14,511 96 954 5.1 1138.5 1138.5 1139.5 1.0 G 15,591 102 1168 4.2 1139.7 1139.7 1140.7 1.0 H 17,101 79 804 6.0 1141.1 1141.1 1141.9 0.8 I 18,107 84 879 5.5 1142.3 1142.3 1143.2 0.9 J 18,931 72 817 5.9 1143.9 1143.9 1144.4 0.5 K 19,419 83 887 5.5 1145.5 1145.5 1145.5 0.0 L 19,914 112 847 5.7 1146.2 1146.2 1146.3 0.1 M 21,116 101 993 4.9 1148.3 1148.3 1148.5 0.2 N 22,345 150 1202 3.1 1150.9 1150.9 1151.5 0.6 O 23,385 430 3762 1.0 1151.1 1151.1 1152.0 0.9 P 24,077 440 3171 1.2 1151.2 1151.2 1152.1 0.9 Q 24,983 288 1601 2.3 1151.5 1151.5 1152.5 1.0 R 25,583 520 2791 1.3 1151.9 1151.9 1152.9 1.0 S 26,674 800 5740 0.6 1151.9 1151.9 1152.9 1.0 T 27,715 847 6961 0.5 1151.9 1151.9 1152.9 1.0 U 29,045 850 5821 0.5 1152.0 1152.0 1153.0 1.0 V 30,509 565 3357 0.9 1152.1 1152.1 1153.1 1.0
1FEET ABOVE INTERSTATE HIGHWAY 71
2FLOODWAY IS WIDTH OF 1-PERCENT-ANNUAL-CHANCE FLOODPLAIN
TAB
LE 9
FEDERAL EMERGENCY MANAGEMENT AGENCY
RICHLAND COUNTY, OH
AND INCORPORATED AREAS
FLOODWAY DATA
ROCKY FORK
FLOODING SOURCE
FLOODWAY
1-PERCENT-ANNUAL-CHANCE FLOOD
WATER-SURFACE ELEVATION
CROSS SECTION
DISTANCE1
WIDTH (FEET)
SECTION AREA (SQUARE FEET)
MEAN VELOCITY (FEET/SECOND)
REGULATORY (FEET NAVD)
WITHOUT
FLOODWAY (FEET NAVD)
WITH
FLOODWAY (FEET NAVD)
INCREASE (FEET)
ROCKY FORK (CONTINUED)
W 31,774 150 657 4.6 1155.0 1155.0 1155.2 0.2 X 32,452 175 1224 2.5 1156.4 1156.4 1156.7 0.3 Y 32,856 275 1654 1.8 1156.8 1156.8 1157.2 0.4 Z 33,372 400 2112 1.4 1156.9 1156.9 1157.6 0.7
AA 34,195 400 1040 2.6 1156.9 1156.9 1157.7 0.8 AB 35,220 400 2111 1.3 1157.6 1157.6 1158.5 0.9
1FEET ABOVE INTERSTATE HIGHWAY 71
TAB
LE 9
FEDERAL EMERGENCY MANAGEMENT AGENCY
RICHLAND COUNTY, OH
AND INCORPORATED AREAS
FLOODWAY DATA
ROCKY FORK
FLOODING SOURCE
FLOODWAY
1-PERCENT-ANNUAL-CHANCE FLOOD
WATER-SURFACE ELEVATION
CROSS SECTION
DISTANCE1
WIDTH (FEET)
SECTION AREA (SQUARE FEET)
MEAN VELOCITY (FEET/SECOND)
REGULATORY (FEET NAVD)
WITHOUT
FLOODWAY (FEET NAVD)
WITH
FLOODWAY (FEET NAVD)
INCREASE (FEET)
SELTZER
PARK CREEK A 472 87 680 2.3 1088.8 1088.8 1089.8 1.0 B 667 36 335 4.6 1088.8 1088.8 1089.8 1.0 C 951 46 372 4.1 1092.7 1092.7 1093.7 1.0 D 1,240 58 386 4.0 1092.8 1092.8 1093.8 1.0 E 1,543 142 1074 1.4 1094.4 1094.4 1095.4 1.0 F 2,285 110 786 2.0 1094.7 1094.7 1095.7 1.0 G 2,499 128 758 2.0 1094.8 1094.8 1095.8 1.0 H 3,204 35 210 7.3 1096.2 1096.2 1097.2 1.0 I 3,732 26 148 10.4 1098.9 1098.9 1099.9 1.0 J 4,674 34 191 8.0 1102.7 1102.7 1103.7 1.0 K 5,527 32 195 7.9 1106.5 1106.5 1107.5 1.0 L 7,002 35 219 7.0 1111.5 1111.5 1112.5 1.0 M 7,787 32 209 7.4 1114.3 1114.3 1115.3 1.0 N 7,905 68 538 2.9 1121.0 1121.0 1122.0 1.0 O 8,581 93 898 1.7 1121.2 1121.2 1122.2 1.0 P 8,759 195 2007 0.6 1123.4 1123.4 1124.4 1.0 Q 10,960 308 2093 0.5 1125.7 1125.7 1126.7 1.0 R 12,486 221 1052 0.9 1126.5 1126.5 1127.5 1.0 S 14,184 172 586 1.7 1128.7 1128.7 1129.7 1.0 T 15,104 68 231 1.3 1129.3 1129.3 1130.3 1.0 U 16,056 68 224 1.3 1131.1 1131.1 1132.1 1.0 V 18,121 43 136 2.2 1134.2 1134.2 1135.2 1.0
1FEET ABOVE CONFLUENCE WITH BLACK FORK MOHICAN RIVER
TAB
LE 9
FEDERAL EMERGENCY MANAGEMENT AGENCY
RICHLAND COUNTY, OH
AND INCORPORATED AREAS
FLOODWAY DATA
SELTZER PARK CREEK
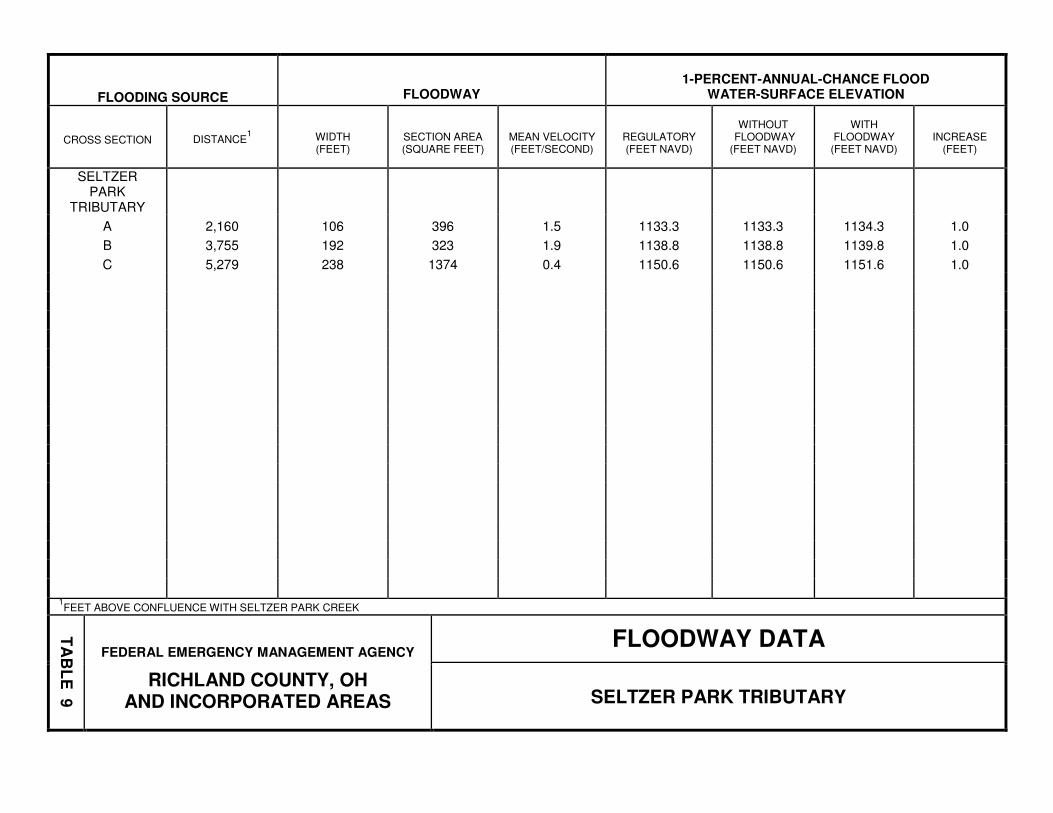
FLOODING SOURCE
FLOODWAY
1-PERCENT-ANNUAL-CHANCE FLOOD
WATER-SURFACE ELEVATION
CROSS SECTION
DISTANCE1
WIDTH (FEET)
SECTION AREA (SQUARE FEET)
MEAN VELOCITY (FEET/SECOND)
REGULATORY (FEET NAVD)
WITHOUT
FLOODWAY (FEET NAVD)
WITH
FLOODWAY (FEET NAVD)
INCREASE (FEET)
SELTZER
PARK TRIBUTARY
A 2,160 106 396 1.5 1133.3 1133.3 1134.3 1.0 B 3,755 192 323 1.9 1138.8 1138.8 1139.8 1.0 C 5,279 238 1374 0.4 1150.6 1150.6 1151.6 1.0
1FEET ABOVE CONFLUENCE WITH SELTZER PARK CREEK
TAB
LE 9
FEDERAL EMERGENCY MANAGEMENT AGENCY
RICHLAND COUNTY, OH
AND INCORPORATED AREAS
FLOODWAY DATA
SELTZER PARK TRIBUTARY
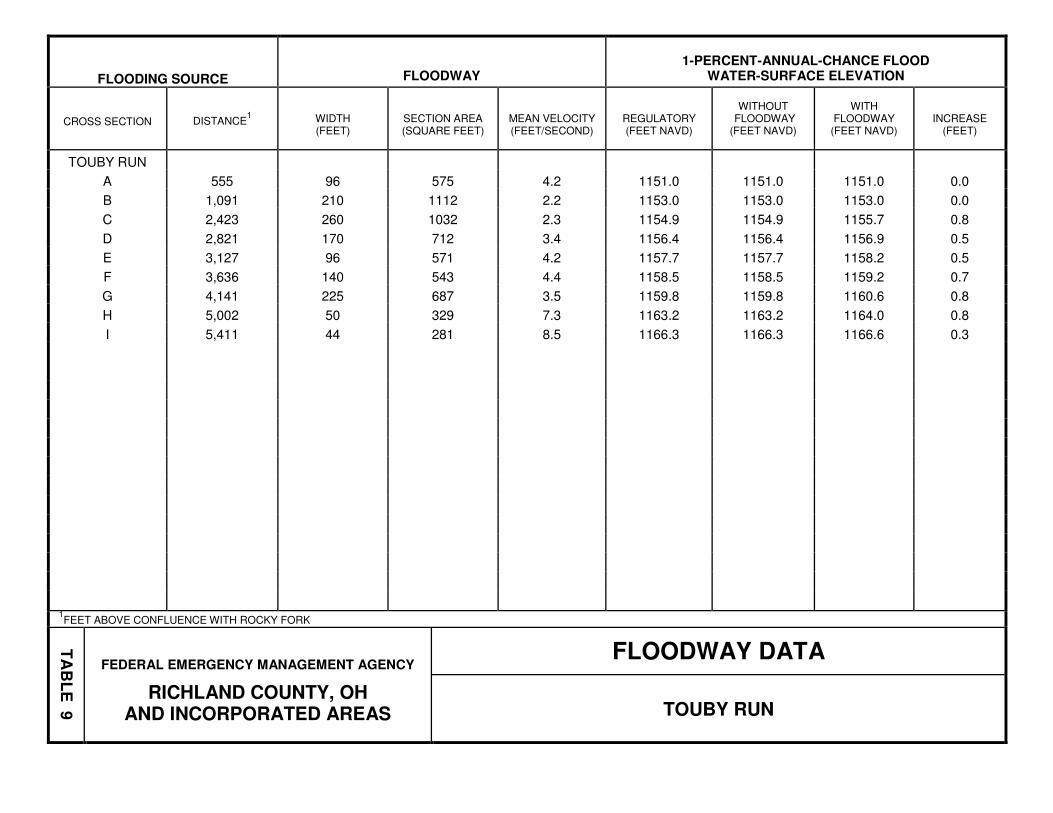
FLOODING SOURCE
FLOODWAY
1-PERCENT-ANNUAL-CHANCE FLOOD
WATER-SURFACE ELEVATION
CROSS SECTION
DISTANCE1
WIDTH (FEET)
SECTION AREA (SQUARE FEET)
MEAN VELOCITY (FEET/SECOND)
REGULATORY (FEET NAVD)
WITHOUT
FLOODWAY (FEET NAVD)
WITH
FLOODWAY (FEET NAVD)
INCREASE (FEET)
TOUBY RUN A 555 96 575 4.2 1151.0 1151.0 1151.0 0.0 B 1,091 210 1112 2.2 1153.0 1153.0 1153.0 0.0 C 2,423 260 1032 2.3 1154.9 1154.9 1155.7 0.8 D 2,821 170 712 3.4 1156.4 1156.4 1156.9 0.5 E 3,127 96 571 4.2 1157.7 1157.7 1158.2 0.5 F 3,636 140 543 4.4 1158.5 1158.5 1159.2 0.7 G 4,141 225 687 3.5 1159.8 1159.8 1160.6 0.8 H 5,002 50 329 7.3 1163.2 1163.2 1164.0 0.8 I 5,411 44 281 8.5 1166.3 1166.3 1166.6 0.3
1FEET ABOVE CONFLUENCE WITH ROCKY FORK
TAB
LE 9
FEDERAL EMERGENCY MANAGEMENT AGENCY
RICHLAND COUNTY, OH
AND INCORPORATED AREAS
FLOODWAY DATA
TOUBY RUN
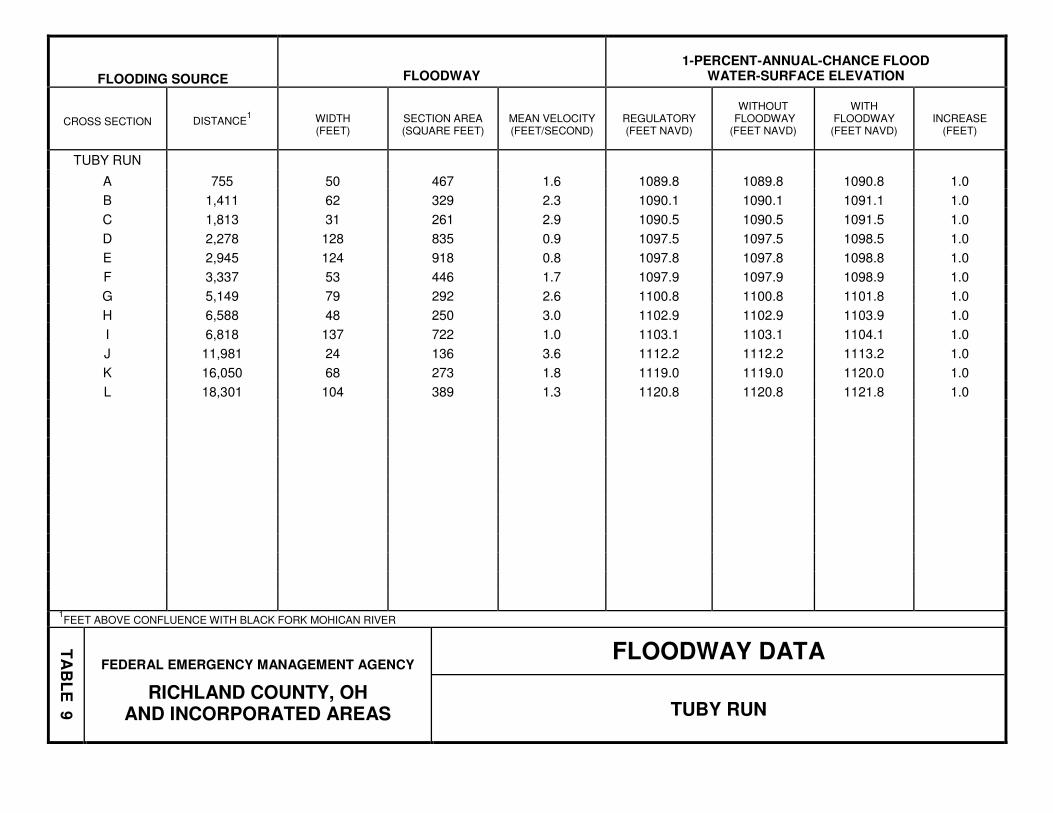
FLOODING SOURCE
FLOODWAY
1-PERCENT-ANNUAL-CHANCE FLOOD
WATER-SURFACE ELEVATION
CROSS SECTION
DISTANCE1
WIDTH (FEET)
SECTION AREA (SQUARE FEET)
MEAN VELOCITY (FEET/SECOND)
REGULATORY (FEET NAVD)
WITHOUT
FLOODWAY (FEET NAVD)
WITH
FLOODWAY (FEET NAVD)
INCREASE (FEET)
TUBY RUN A 755 50 467 1.6 1089.8 1089.8 1090.8 1.0 B 1,411 62 329 2.3 1090.1 1090.1 1091.1 1.0 C 1,813 31 261 2.9 1090.5 1090.5 1091.5 1.0 D 2,278 128 835 0.9 1097.5 1097.5 1098.5 1.0 E 2,945 124 918 0.8 1097.8 1097.8 1098.8 1.0 F 3,337 53 446 1.7 1097.9 1097.9 1098.9 1.0 G 5,149 79 292 2.6 1100.8 1100.8 1101.8 1.0 H 6,588 48 250 3.0 1102.9 1102.9 1103.9 1.0 I 6,818 137 722 1.0 1103.1 1103.1 1104.1 1.0 J 11,981 24 136 3.6 1112.2 1112.2 1113.2 1.0 K 16,050 68 273 1.8 1119.0 1119.0 1120.0 1.0 L 18,301 104 389 1.3 1120.8 1120.8 1121.8 1.0
1FEET ABOVE CONFLUENCE WITH BLACK FORK MOHICAN RIVER
TAB
LE 9
FEDERAL EMERGENCY MANAGEMENT AGENCY
RICHLAND COUNTY, OH
AND INCORPORATED AREAS
FLOODWAY DATA
TUBY RUN
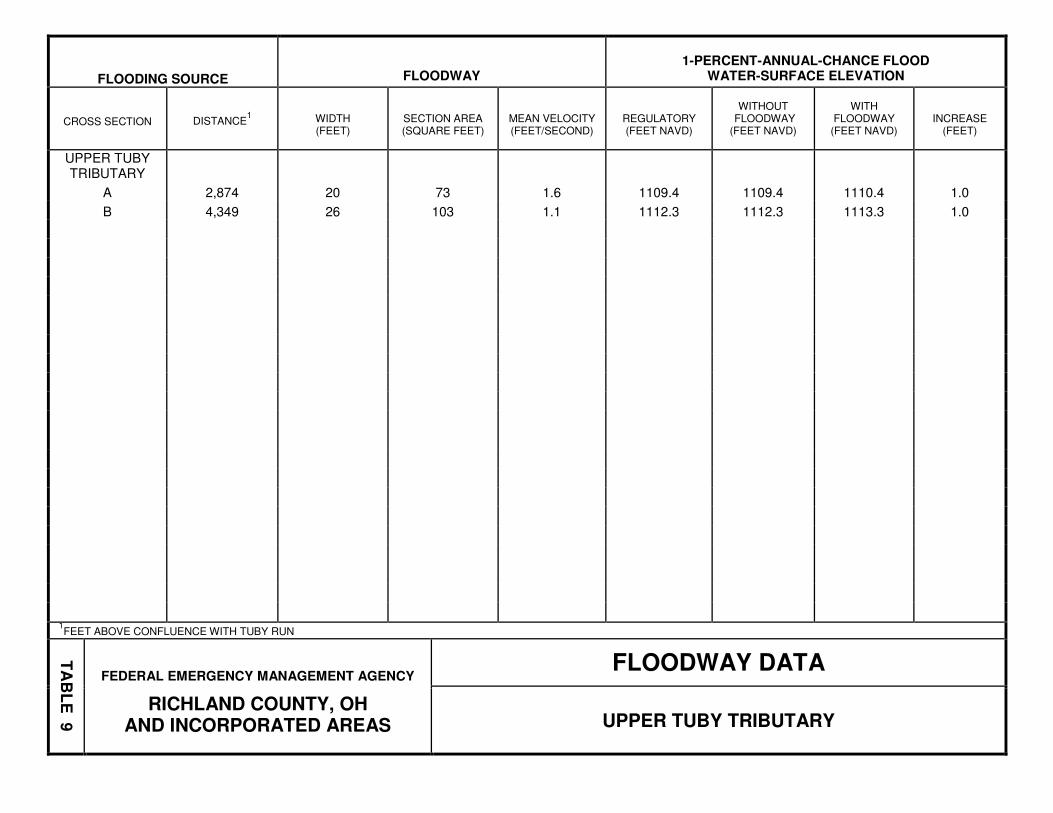
FLOODING SOURCE
FLOODWAY
1-PERCENT-ANNUAL-CHANCE FLOOD
WATER-SURFACE ELEVATION
CROSS SECTION
DISTANCE1
WIDTH (FEET)
SECTION AREA (SQUARE FEET)
MEAN VELOCITY (FEET/SECOND)
REGULATORY (FEET NAVD)
WITHOUT
FLOODWAY (FEET NAVD)
WITH
FLOODWAY (FEET NAVD)
INCREASE (FEET)
UPPER TUBY TRIBUTARY
A 2,874 20 73 1.6 1109.4 1109.4 1110.4 1.0 B 4,349 26 103 1.1 1112.3 1112.3 1113.3 1.0
1FEET ABOVE CONFLUENCE WITH TUBY RUN
TAB
LE 9
FEDERAL EMERGENCY MANAGEMENT AGENCY
RICHLAND COUNTY, OH
AND INCORPORATED AREAS
FLOODWAY DATA
UPPER TUBY TRIBUTARY
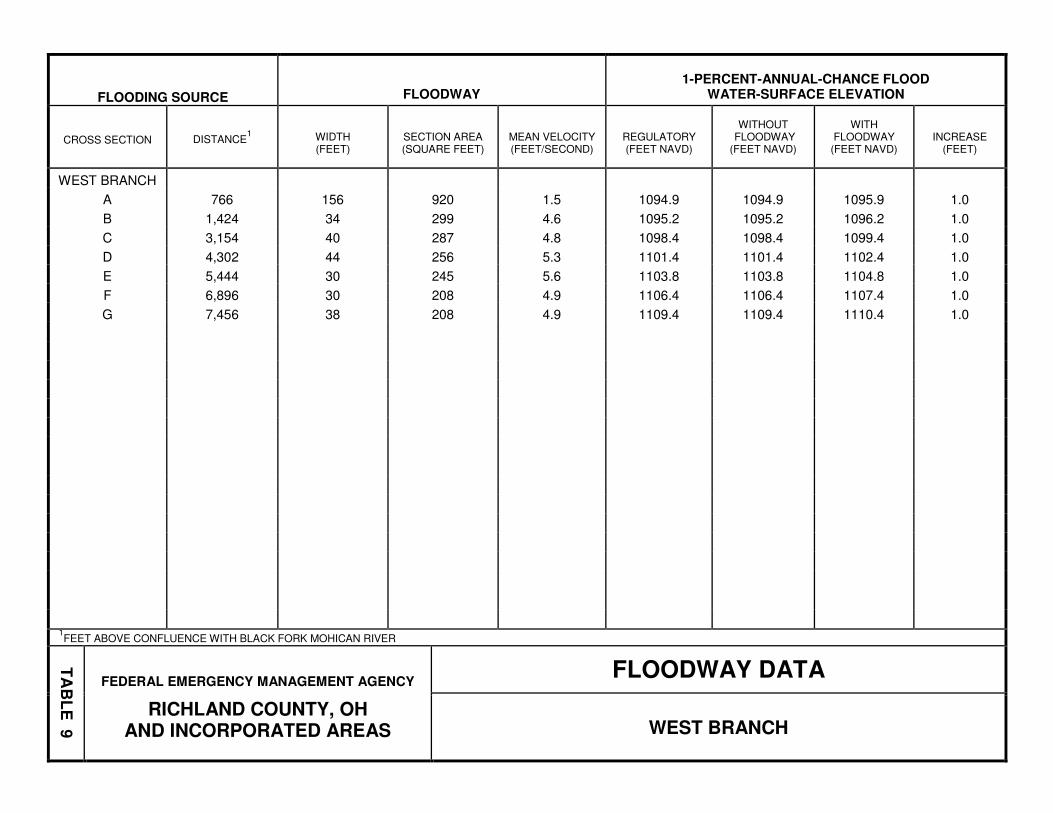
FLOODING SOURCE
FLOODWAY
1-PERCENT-ANNUAL-CHANCE FLOOD
WATER-SURFACE ELEVATION
CROSS SECTION
DISTANCE1
WIDTH (FEET)
SECTION AREA (SQUARE FEET)
MEAN VELOCITY (FEET/SECOND)
REGULATORY (FEET NAVD)
WITHOUT
FLOODWAY (FEET NAVD)
WITH
FLOODWAY (FEET NAVD)
INCREASE (FEET)
WEST BRANCH A 766 156 920 1.5 1094.9 1094.9 1095.9 1.0 B 1,424 34 299 4.6 1095.2 1095.2 1096.2 1.0 C 3,154 40 287 4.8 1098.4 1098.4 1099.4 1.0 D 4,302 44 256 5.3 1101.4 1101.4 1102.4 1.0 E 5,444 30 245 5.6 1103.8 1103.8 1104.8 1.0 F 6,896 30 208 4.9 1106.4 1106.4 1107.4 1.0 G 7,456 38 208 4.9 1109.4 1109.4 1110.4 1.0
1FEET ABOVE CONFLUENCE WITH BLACK FORK MOHICAN RIVER
TAB
LE 9
FEDERAL EMERGENCY MANAGEMENT AGENCY
RICHLAND COUNTY, OH
AND INCORPORATED AREAS
FLOODWAY DATA
WEST BRANCH
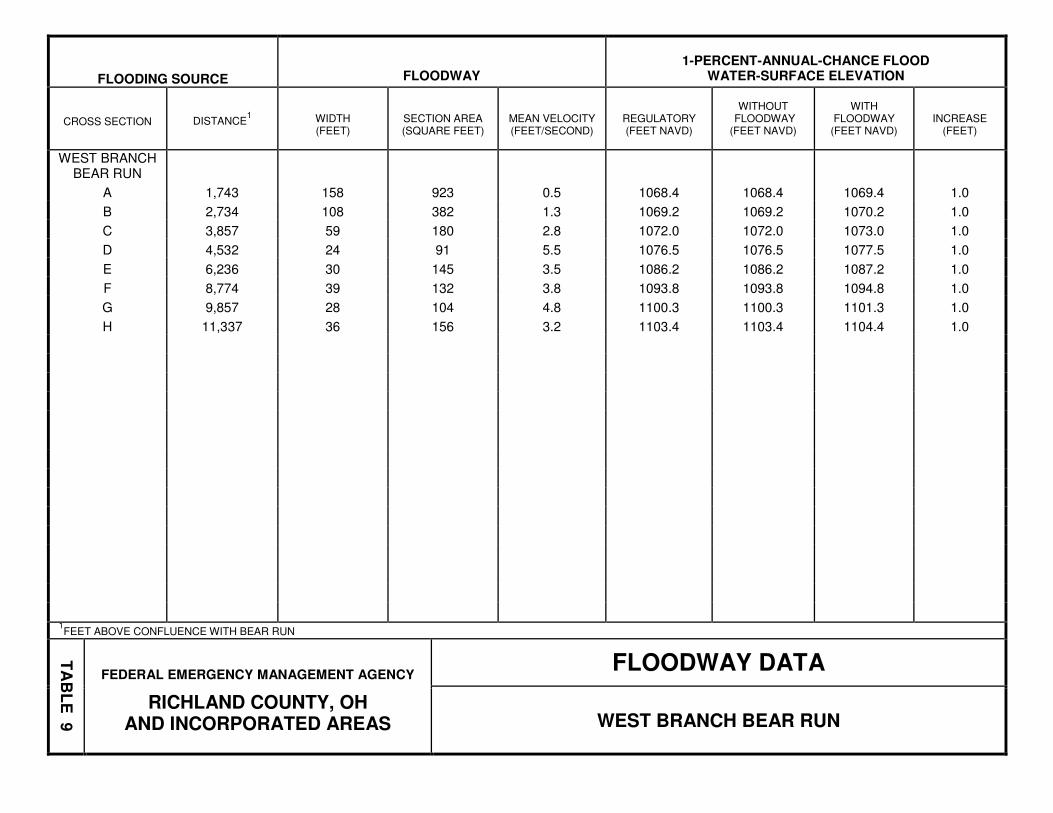
FLOODING SOURCE
FLOODWAY
1-PERCENT-ANNUAL-CHANCE FLOOD
WATER-SURFACE ELEVATION
CROSS SECTION
DISTANCE1
WIDTH (FEET)
SECTION AREA (SQUARE FEET)
MEAN VELOCITY (FEET/SECOND)
REGULATORY (FEET NAVD)
WITHOUT
FLOODWAY (FEET NAVD)
WITH
FLOODWAY (FEET NAVD)
INCREASE (FEET)
WEST BRANCH
BEAR RUN A 1,743 158 923 0.5 1068.4 1068.4 1069.4 1.0 B 2,734 108 382 1.3 1069.2 1069.2 1070.2 1.0 C 3,857 59 180 2.8 1072.0 1072.0 1073.0 1.0 D 4,532 24 91 5.5 1076.5 1076.5 1077.5 1.0 E 6,236 30 145 3.5 1086.2 1086.2 1087.2 1.0 F 8,774 39 132 3.8 1093.8 1093.8 1094.8 1.0 G 9,857 28 104 4.8 1100.3 1100.3 1101.3 1.0 H 11,337 36 156 3.2 1103.4 1103.4 1104.4 1.0
1FEET ABOVE CONFLUENCE WITH BEAR RUN
TAB
LE 9
FEDERAL EMERGENCY MANAGEMENT AGENCY
RICHLAND COUNTY, OH
AND INCORPORATED AREAS
FLOODWAY DATA
WEST BRANCH BEAR RUN
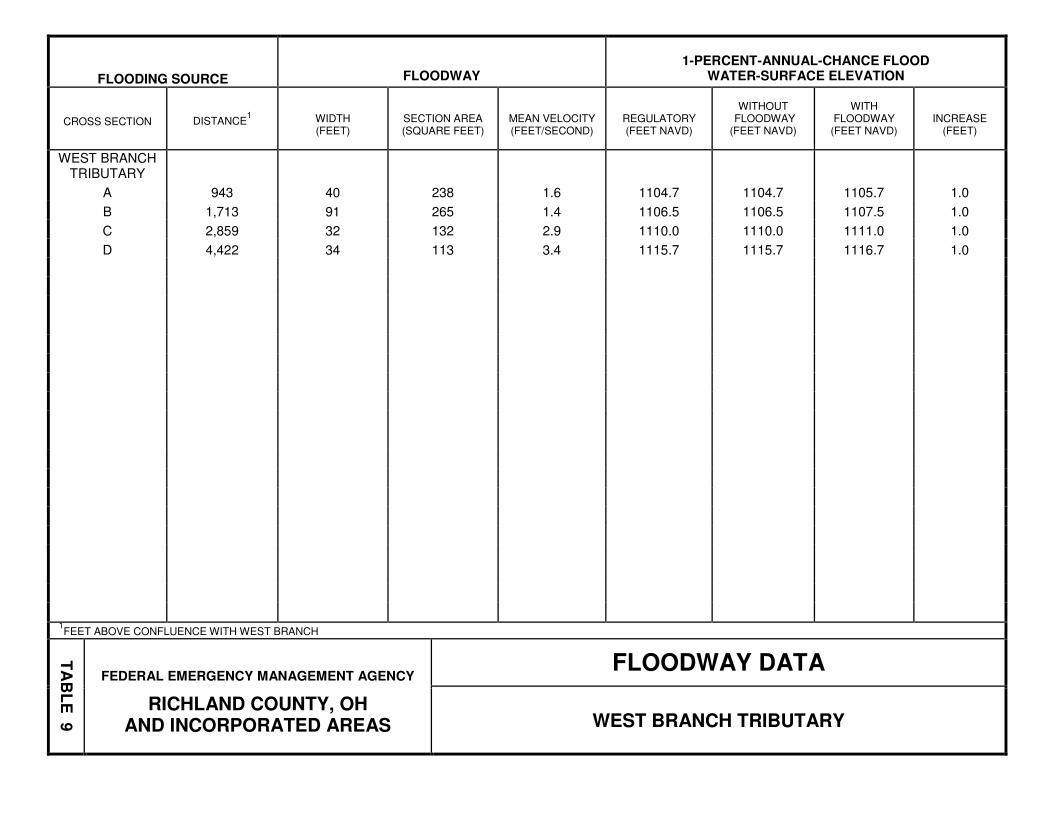
FLOODING SOURCE
FLOODWAY
1-PERCENT-ANNUAL-CHANCE FLOOD
WATER-SURFACE ELEVATION
CROSS SECTION
DISTANCE1
WIDTH (FEET)
SECTION AREA (SQUARE FEET)
MEAN VELOCITY (FEET/SECOND)
REGULATORY (FEET NAVD)
WITHOUT
FLOODWAY (FEET NAVD)
WITH
FLOODWAY (FEET NAVD)
INCREASE (FEET)
WEST BRANCH
TRIBUTARY A 943 40 238 1.6 1104.7 1104.7 1105.7 1.0 B 1,713 91 265 1.4 1106.5 1106.5 1107.5 1.0 C 2,859 32 132 2.9 1110.0 1110.0 1111.0 1.0 D 4,422 34 113 3.4 1115.7 1115.7 1116.7 1.0
1FEET ABOVE CONFLUENCE WITH WEST BRANCH
TAB
LE 9
FEDERAL EMERGENCY MANAGEMENT AGENCY
RICHLAND COUNTY, OH
AND INCORPORATED AREAS
FLOODWAY DATA
WEST BRANCH TRIBUTARY
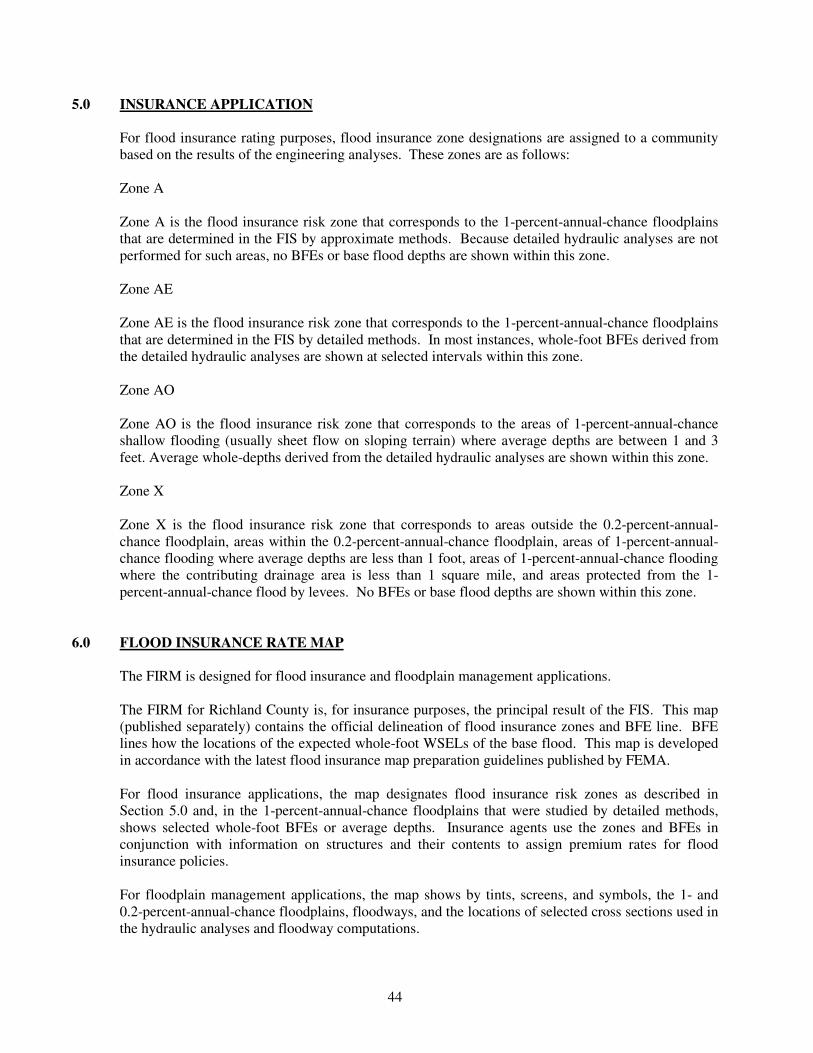
44
5.0 INSURANCE APPLICATION
For flood insurance rating purposes, flood insurance zone designations are assigned to a community based on the results of the engineering analyses. These zones are as follows: Zone A Zone A is the flood insurance risk zone that corresponds to the 1-percent-annual-chance floodplains that are determined in the FIS by approximate methods. Because detailed hydraulic analyses are not performed for such areas, no BFEs or base flood depths are shown within this zone. Zone AE Zone AE is the flood insurance risk zone that corresponds to the 1-percent-annual-chance floodplains that are determined in the FIS by detailed methods. In most instances, whole-foot BFEs derived from the detailed hydraulic analyses are shown at selected intervals within this zone. Zone AO Zone AO is the flood insurance risk zone that corresponds to the areas of 1-percent-annual-chance shallow flooding (usually sheet flow on sloping terrain) where average depths are between 1 and 3 feet. Average whole-depths derived from the detailed hydraulic analyses are shown within this zone. Zone X Zone X is the flood insurance risk zone that corresponds to areas outside the 0.2-percent-annual-chance floodplain, areas within the 0.2-percent-annual-chance floodplain, areas of 1-percent-annual-chance flooding where average depths are less than 1 foot, areas of 1-percent-annual-chance flooding where the contributing drainage area is less than 1 square mile, and areas protected from the 1-percent-annual-chance flood by levees. No BFEs or base flood depths are shown within this zone.
6.0 FLOOD INSURANCE RATE MAP
The FIRM is designed for flood insurance and floodplain management applications. The FIRM for Richland County is, for insurance purposes, the principal result of the FIS. This map (published separately) contains the official delineation of flood insurance zones and BFE line. BFE lines how the locations of the expected whole-foot WSELs of the base flood. This map is developed in accordance with the latest flood insurance map preparation guidelines published by FEMA. For flood insurance applications, the map designates flood insurance risk zones as described in Section 5.0 and, in the 1-percent-annual-chance floodplains that were studied by detailed methods, shows selected whole-foot BFEs or average depths. Insurance agents use the zones and BFEs in conjunction with information on structures and their contents to assign premium rates for flood insurance policies. For floodplain management applications, the map shows by tints, screens, and symbols, the 1- and 0.2-percent-annual-chance floodplains, floodways, and the locations of selected cross sections used in the hydraulic analyses and floodway computations.
45
The current FIRM presents flooding information for the entire geographic area of Richland County. Previously, separate FIRMS were prepared for each identified flood prone incorporated community and for the unincorporated areas of the county. Historical data relating to the maps prepared for each community, up to and including this countywide FIS, are presented in Table 10.
7.0 OTHER STUDIES This FIS supersedes previously printed FIS reports for Richland County, Ohio. This FIS also supersedes the Flood Boundary and Floodway Maps for Richland County that were printed as part of previous FIS reports. The information on the Flood Boundary and Floodway Maps has been added to the FIRM accompanying this FIS. This FIS report either supersedes or is compatible with all previous studies on streams studied in this report and should be considered authoritative for purposes of the NFIP.
8.0 LOCATION OF DATA
Information concerning the pertinent data used in the preparation of this study can be obtained by contacting FEMA, Mitigation Division, 536 South Clark Street, Sixth Floor, Chicago, Illinois 60605 or visiting their website: http://www.fema.gov/.
Future revisions may be made that do not result in the republishing of the FIS report. To ensure that any user is aware of all revisions, it is advisable to contact the map repository of the flood hazard data located in the community.
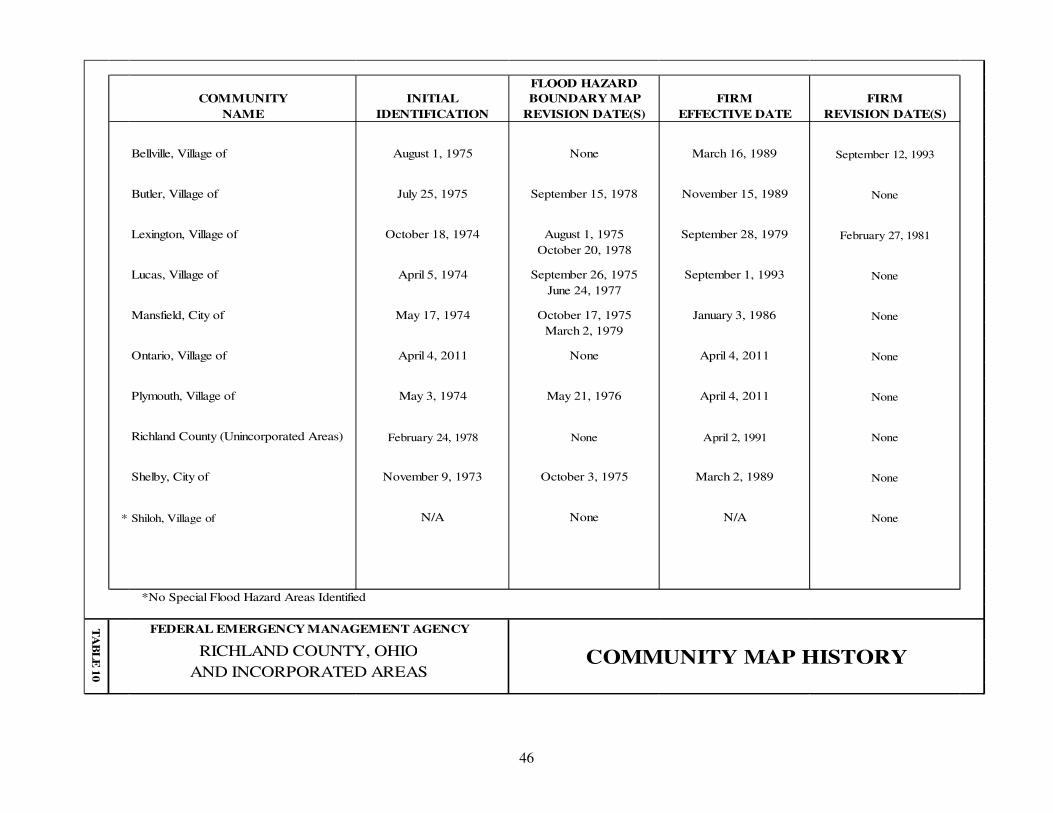
46
FLOOD HAZARDCOMMUNITY INITIAL BOUNDARY MAP FIRM FIRM
NAME IDENTIFICATION REVISION DATE(S) EFFECTIVE DATE REVISION DATE(S)
Bellville, Village of August 1, 1975 None March 16, 1989 September 12, 1993
Butler, Village of July 25, 1975 September 15, 1978 November 15, 1989 None
Lexington, Village of October 18, 1974 August 1, 1975 September 28, 1979 February 27, 1981October 20, 1978
Lucas, Village of April 5, 1974 September 26, 1975 September 1, 1993 NoneJune 24, 1977
Mansfield, City of May 17, 1974 October 17, 1975 January 3, 1986 NoneMarch 2, 1979
Ontario, Village of April 4, 2011 None April 4, 2011 None
Plymouth, Village of May 3, 1974 May 21, 1976 April 4, 2011 None
Richland County (Unincorporated Areas) February 24, 1978 None April 2, 1991 None
Shelby, City of November 9, 1973 October 3, 1975 March 2, 1989 None
* Shiloh, Village of N/A None N/A None
*No Special Flood Hazard Areas Identified
TA
BL
E 10
FEDERAL EMERGENCY MANAGEMENT AGENCY
COMMUNITY MAP HISTORYRICHLAND COUNTY, OHIOAND INCORPORATED AREAS
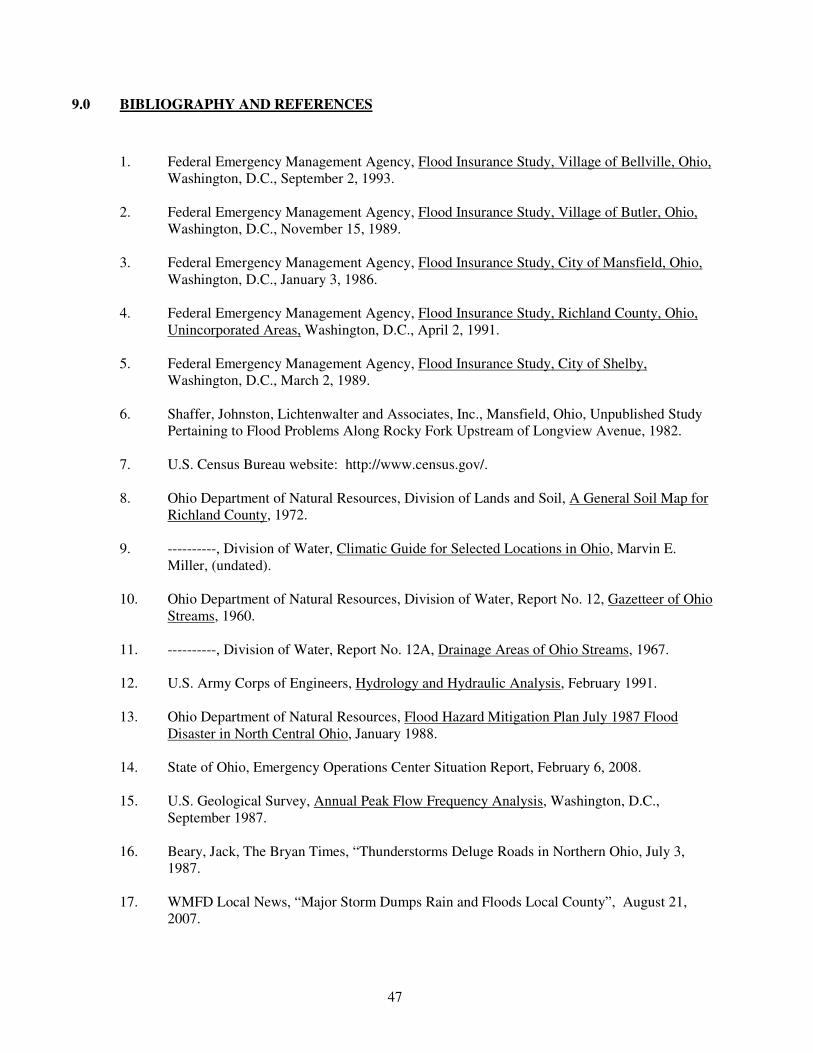
47
9.0 BIBLIOGRAPHY AND REFERENCES
1. Federal Emergency Management Agency, Flood Insurance Study, Village of Bellville, Ohio, Washington, D.C., September 2, 1993.
2. Federal Emergency Management Agency, Flood Insurance Study, Village of Butler, Ohio,
Washington, D.C., November 15, 1989.
3. Federal Emergency Management Agency, Flood Insurance Study, City of Mansfield, Ohio, Washington, D.C., January 3, 1986.
4. Federal Emergency Management Agency, Flood Insurance Study, Richland County, Ohio,
Unincorporated Areas, Washington, D.C., April 2, 1991.
5. Federal Emergency Management Agency, Flood Insurance Study, City of Shelby, Washington, D.C., March 2, 1989.
6. Shaffer, Johnston, Lichtenwalter and Associates, Inc., Mansfield, Ohio, Unpublished Study
Pertaining to Flood Problems Along Rocky Fork Upstream of Longview Avenue, 1982.
7. U.S. Census Bureau website: http://www.census.gov/.
8. Ohio Department of Natural Resources, Division of Lands and Soil, A General Soil Map for Richland County, 1972.
9. ----------, Division of Water, Climatic Guide for Selected Locations in Ohio, Marvin E.
Miller, (undated).
10. Ohio Department of Natural Resources, Division of Water, Report No. 12, Gazetteer of Ohio Streams, 1960.
11. ----------, Division of Water, Report No. 12A, Drainage Areas of Ohio Streams, 1967.
12. U.S. Army Corps of Engineers, Hydrology and Hydraulic Analysis, February 1991.
13. Ohio Department of Natural Resources, Flood Hazard Mitigation Plan July 1987 Flood
Disaster in North Central Ohio, January 1988.
14. State of Ohio, Emergency Operations Center Situation Report, February 6, 2008.
15. U.S. Geological Survey, Annual Peak Flow Frequency Analysis, Washington, D.C., September 1987.
16. Beary, Jack, The Bryan Times, “Thunderstorms Deluge Roads in Northern Ohio, July 3,
1987.
17. WMFD Local News, “Major Storm Dumps Rain and Floods Local County”, August 21, 2007.
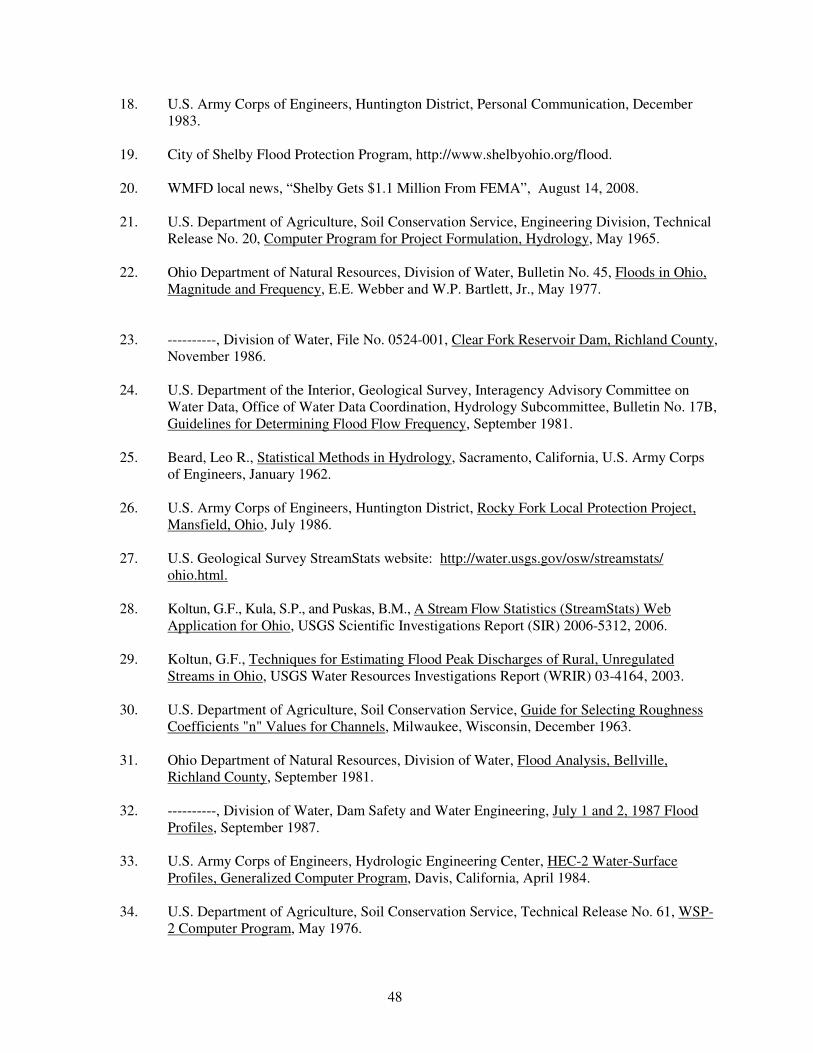
48
18. U.S. Army Corps of Engineers, Huntington District, Personal Communication, December 1983.
19. City of Shelby Flood Protection Program, http://www.shelbyohio.org/flood.
20. WMFD local news, “Shelby Gets $1.1 Million From FEMA”, August 14, 2008.
21. U.S. Department of Agriculture, Soil Conservation Service, Engineering Division, Technical
Release No. 20, Computer Program for Project Formulation, Hydrology, May 1965.
22. Ohio Department of Natural Resources, Division of Water, Bulletin No. 45, Floods in Ohio, Magnitude and Frequency, E.E. Webber and W.P. Bartlett, Jr., May 1977.
23. ----------, Division of Water, File No. 0524-001, Clear Fork Reservoir Dam, Richland County, November 1986.
24. U.S. Department of the Interior, Geological Survey, Interagency Advisory Committee on
Water Data, Office of Water Data Coordination, Hydrology Subcommittee, Bulletin No. 17B, Guidelines for Determining Flood Flow Frequency, September 1981.
25. Beard, Leo R., Statistical Methods in Hydrology, Sacramento, California, U.S. Army Corps
of Engineers, January 1962.
26. U.S. Army Corps of Engineers, Huntington District, Rocky Fork Local Protection Project, Mansfield, Ohio, July 1986.
27. U.S. Geological Survey StreamStats website: http://water.usgs.gov/osw/streamstats/
ohio.html.
28. Koltun, G.F., Kula, S.P., and Puskas, B.M., A Stream Flow Statistics (StreamStats) Web Application for Ohio, USGS Scientific Investigations Report (SIR) 2006-5312, 2006.
29. Koltun, G.F., Techniques for Estimating Flood Peak Discharges of Rural, Unregulated
Streams in Ohio, USGS Water Resources Investigations Report (WRIR) 03-4164, 2003.
30. U.S. Department of Agriculture, Soil Conservation Service, Guide for Selecting Roughness Coefficients "n" Values for Channels, Milwaukee, Wisconsin, December 1963.
31. Ohio Department of Natural Resources, Division of Water, Flood Analysis, Bellville,
Richland County, September 1981.
32. ----------, Division of Water, Dam Safety and Water Engineering, July 1 and 2, 1987 Flood Profiles, September 1987.
33. U.S. Army Corps of Engineers, Hydrologic Engineering Center, HEC-2 Water-Surface
Profiles, Generalized Computer Program, Davis, California, April 1984.
34. U.S. Department of Agriculture, Soil Conservation Service, Technical Release No. 61, WSP-2 Computer Program, May 1976.
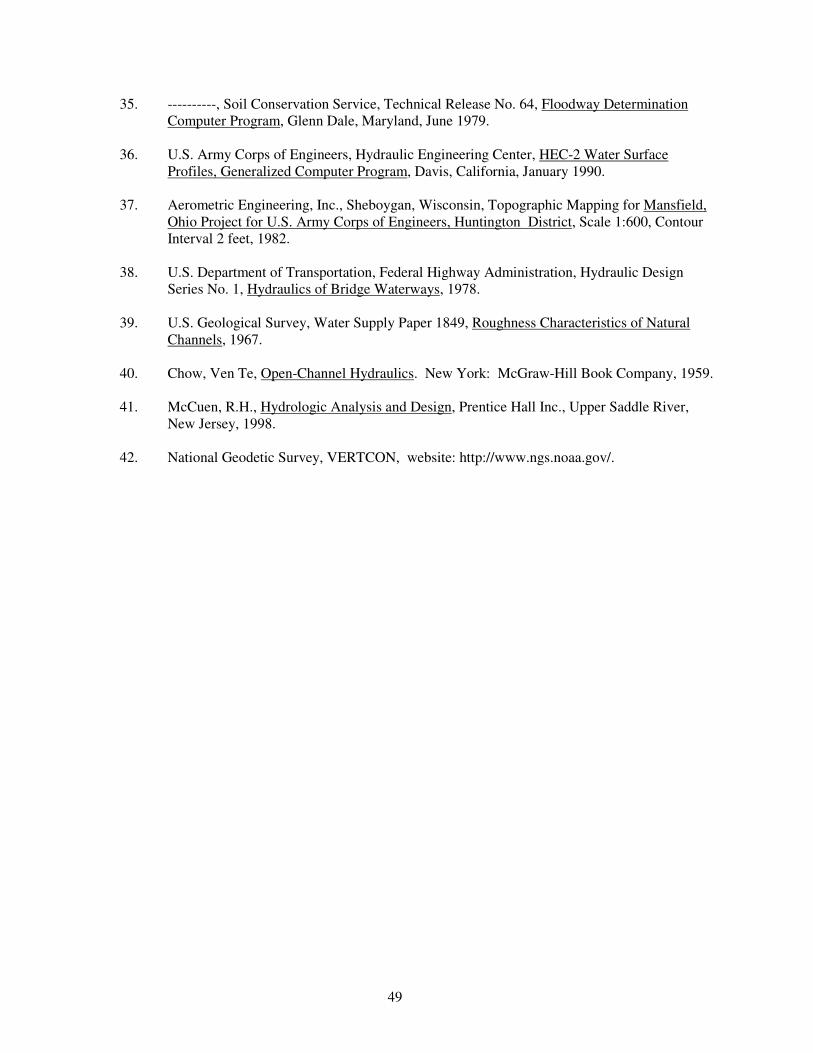
49
35. ----------, Soil Conservation Service, Technical Release No. 64, Floodway Determination Computer Program, Glenn Dale, Maryland, June 1979.
36. U.S. Army Corps of Engineers, Hydraulic Engineering Center, HEC-2 Water Surface
Profiles, Generalized Computer Program, Davis, California, January 1990.
37. Aerometric Engineering, Inc., Sheboygan, Wisconsin, Topographic Mapping for Mansfield, Ohio Project for U.S. Army Corps of Engineers, Huntington District, Scale 1:600, Contour Interval 2 feet, 1982.
38. U.S. Department of Transportation, Federal Highway Administration, Hydraulic Design
Series No. 1, Hydraulics of Bridge Waterways, 1978.
39. U.S. Geological Survey, Water Supply Paper 1849, Roughness Characteristics of Natural Channels, 1967.
40. Chow, Ven Te, Open-Channel Hydraulics. New York: McGraw-Hill Book Company, 1959.
41. McCuen, R.H., Hydrologic Analysis and Design, Prentice Hall Inc., Upper Saddle River,
New Jersey, 1998.
42. National Geodetic Survey, VERTCON, website: http://www.ngs.noaa.gov/.
1030
1040 1040
1050 1050
1060 1060
1070 1070
1080 1080
1090 1090
1100 1100
0 1000 2000 3000 4000 5000 6000 7000 8000 9000 10000 11000
ELE
VA
TIO
N IN
FEET
(N
AV
D 8
8)
STREAM DISTANCE IN FEET ABOVE CONFLUENCE WITH BLACK FORK MOHICAN RIVER
FED
ER
AL
EM
ER
GEN
CY
MA
NA
GEM
EN
T A
GEN
CY
RIC
HLA
ND
CO
UN
TY
, O
HA
ND
IN
CO
RP
OR
AT
ED
AR
EA
S
FLO
OD
PR
OFI L
ES
BEA
R R
UN
01P
A B
C
CO
NFL
UEN
CE W
ITH
BLA
CK
FO
RK
MO
HIC
AN
RIV
ER
LON
DO
N W
ES
T R
OA
D
CO
NFLU
EN
CE W
ITH
WES
T B
RA
NC
H B
EA
R R
UN
SH
ELB
Y G
AN
GES
RO
AD
PLY
MO
UT
H S
PR
ING
MIL
L R
OA
D
LEGEND
0.2% ANNUAL CHANCE FLOOD
1% ANNUAL CHANCE FLOOD
2% ANNUAL CHANCE FLOOD
10% ANNUAL CHANCE FLOOD
STREAM BED
CROSS SECTION LOCATION
1% ANNUAL-CHANCE OVERFLOW FROM BLACK FORK MOHICAN RIVER
THE 2% ANNUAL-CHANCE PROFILE IS TOO CLOSE TO THE 1% ANNUAL-CHANCE PROFILE TO BE SHOWN SEPARATELY
1060
1070 1070
1080 1080
1090 1090
1100 1100
1110 1110
1120 1120
1130 1130
11000 12000 13000 14000 15000 16000 17000 18000 19000 20000 21000 22000
ELE
VA
TIO
N IN
FEET
(N
AV
D 8
8)
STREAM DISTANCE IN FEET ABOVE CONFLUENCE WITH BLACK FORK MOHICAN RIVER
FED
ER
AL
EM
ER
GEN
CY
MA
NA
GEM
EN
T A
GEN
CY
RIC
HLA
ND
CO
UN
TY
, O
HA
ND
IN
CO
RP
OR
AT
ED
AR
EA
S
FLO
OD
PR
OFI L
ES
BEA
R R
UN
02P
D E F G
H
I
ST
AT
E R
OU
TE 9
6
SM
ILEY
RO
AD
EA
ST
PLY
MO
UT
H-S
PR
ING
MIL
L R
OA
D
LEGEND
0.2% ANNUAL CHANCE FLOOD
1% ANNUAL CHANCE FLOOD
2% ANNUAL CHANCE FLOOD
10% ANNUAL CHANCE FLOOD
STREAM BED
CROSS SECTION LOCATION
THE 2% ANNUAL-CHANCE PROFILE IS TOO CLOSE TO THE 1% ANNUAL-CHANCE PROFILE TO BE SHOWN SEPARATELY
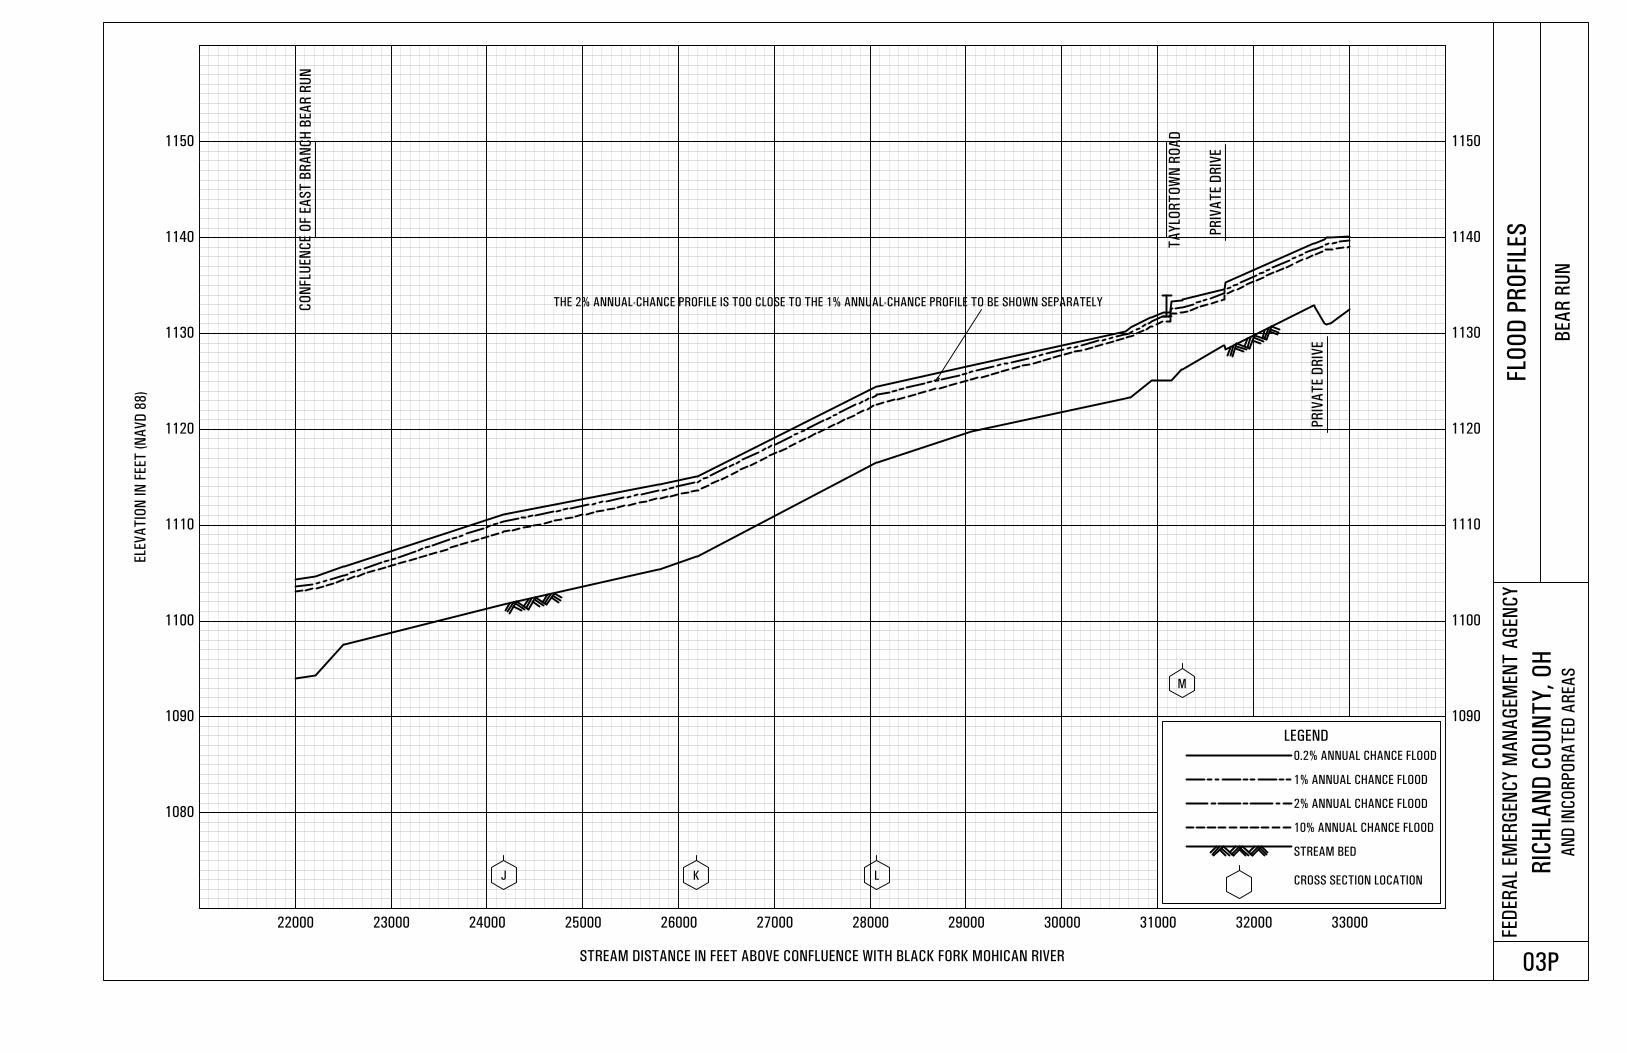
1080
1090 1090
1100 1100
1110 1110
1120 1120
1130 1130
1140 1140
1150 1150
22000 23000 24000 25000 26000 27000 28000 29000 30000 31000 32000 33000
ELE
VA
TIO
N IN
FEET
(N
AV
D 8
8)
STREAM DISTANCE IN FEET ABOVE CONFLUENCE WITH BLACK FORK MOHICAN RIVER
FED
ER
AL
EM
ER
GEN
CY
MA
NA
GEM
EN
T A
GEN
CY
RIC
HLA
ND
CO
UN
TY
, O
HA
ND
IN
CO
RP
OR
AT
ED
AR
EA
S
FLO
OD
PR
OFI L
ES
BEA
R R
UN
03P
J K L
M
CO
NFLU
EN
CE O
F E
AS
T B
RA
NC
H B
EA
R R
UN
PR
IVA
TE D
RIV
E
TA
YLO
RT
OW
N R
OA
D
LEGEND
0.2% ANNUAL CHANCE FLOOD
1% ANNUAL CHANCE FLOOD
2% ANNUAL CHANCE FLOOD
10% ANNUAL CHANCE FLOOD
STREAM BED
CROSS SECTION LOCATION
THE 2% ANNUAL-CHANCE PROFILE IS TOO CLOSE TO THE 1% ANNUAL-CHANCE PROFILE TO BE SHOWN SEPARATELY
PR
IVA
TE D
RIV
E
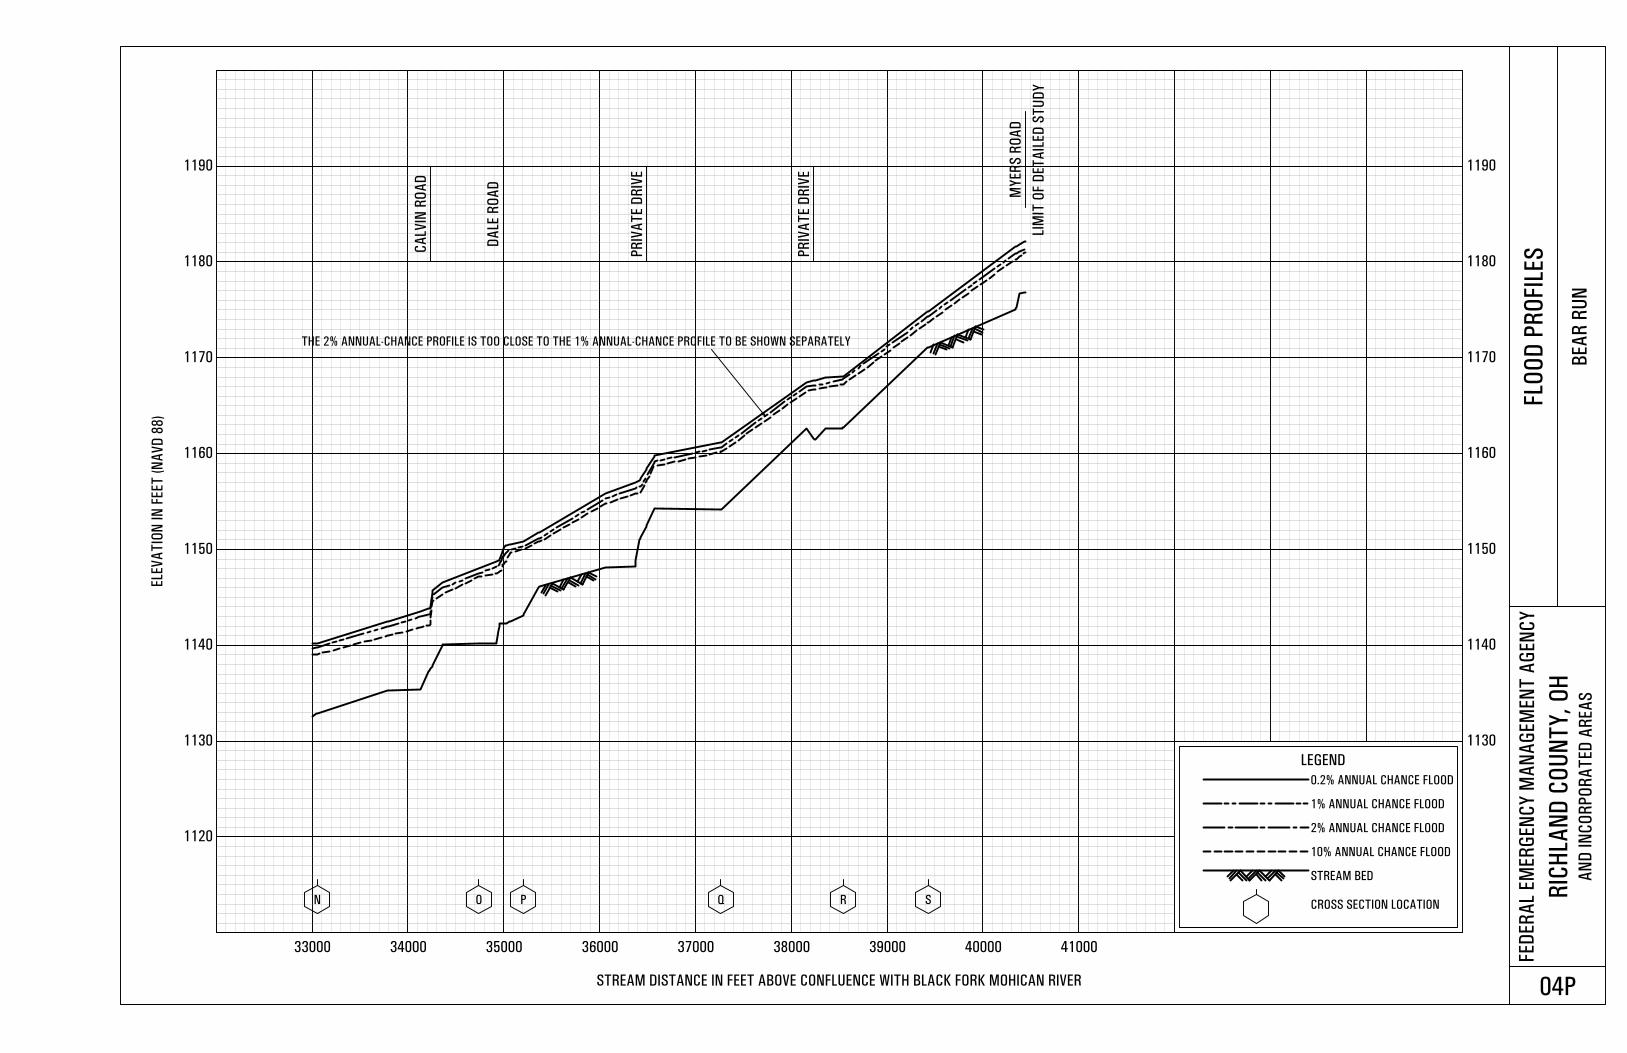
1120
1130 1130
1140 1140
1150 1150
1160 1160
1170 1170
1180 1180
1190 1190
33000 34000 35000 36000 37000 38000 39000 40000 41000
ELE
VA
TIO
N IN
FEET
(N
AV
D 8
8)
STREAM DISTANCE IN FEET ABOVE CONFLUENCE WITH BLACK FORK MOHICAN RIVER
FED
ER
AL
EM
ER
GEN
CY
MA
NA
GEM
EN
T A
GEN
CY
RIC
HLA
ND
CO
UN
TY
, O
HA
ND
IN
CO
RP
OR
AT
ED
AR
EA
S
FLO
OD
PR
OFI L
ES
BEA
R R
UN
04P
N O P Q R S
CA
LVIN
RO
AD
DA
LE R
OA
D
PR
IVA
TE D
RIV
E
PR
IVA
TE D
RIV
E
MY
ER
S R
OA
D
LIM
IT O
F D
ET
AIL
ED
ST
UD
Y
LEGEND
0.2% ANNUAL CHANCE FLOOD
1% ANNUAL CHANCE FLOOD
2% ANNUAL CHANCE FLOOD
10% ANNUAL CHANCE FLOOD
STREAM BED
CROSS SECTION LOCATION
THE 2% ANNUAL-CHANCE PROFILE IS TOO CLOSE TO THE 1% ANNUAL-CHANCE PROFILE TO BE SHOWN SEPARATELY
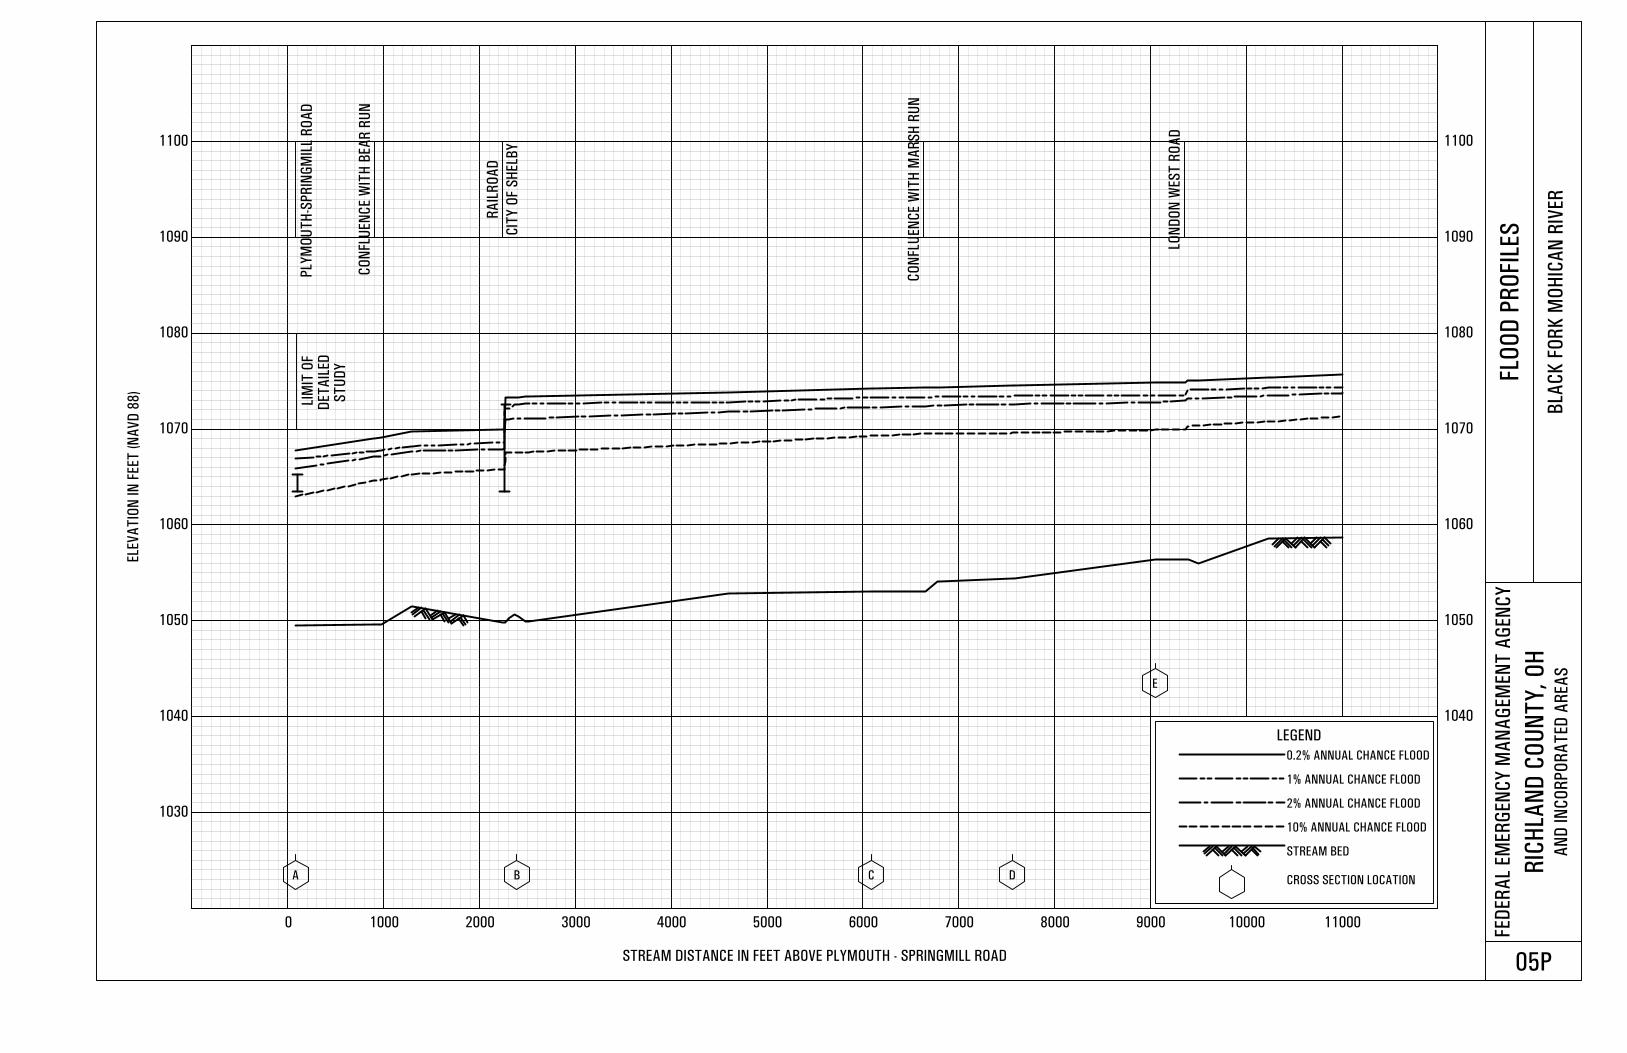
1030
1040 1040
1050 1050
1060 1060
1070 1070
1080 1080
1090 1090
1100 1100
0 1000 2000 3000 4000 5000 6000 7000 8000 9000 10000 11000
ELE
VA
TIO
N IN
FEET
(N
AV
D 8
8)
STREAM DISTANCE IN FEET ABOVE PLYMOUTH - SPRINGMILL ROAD
FED
ER
AL
EM
ER
GEN
CY
MA
NA
GEM
EN
T A
GEN
CY
RIC
HLA
ND
CO
UN
TY
, O
HA
ND
IN
CO
RP
OR
AT
ED
AR
EA
S
FLO
OD
PR
OFI L
ES
BLA
CK
FO
RK
MO
HIC
AN
RIV
ER
05P
A B C D
E
LIM
IT O
F
CO
NFL
UEN
CE W
ITH
BEA
R R
UN
RA
ILR
OA
D
CO
NFL
UEN
CE W
ITH
MA
RS
H R
UN
LON
DO
N W
ES
T R
OA
D
LEGEND
0.2% ANNUAL CHANCE FLOOD
1% ANNUAL CHANCE FLOOD
2% ANNUAL CHANCE FLOOD
10% ANNUAL CHANCE FLOOD
STREAM BED
CROSS SECTION LOCATION
PLY
MO
UT
H-S
PR
ING
MIL
L R
OA
D
CIT
Y O
F S
HELB
Y
DET
AIL
ED
S
TU
DY
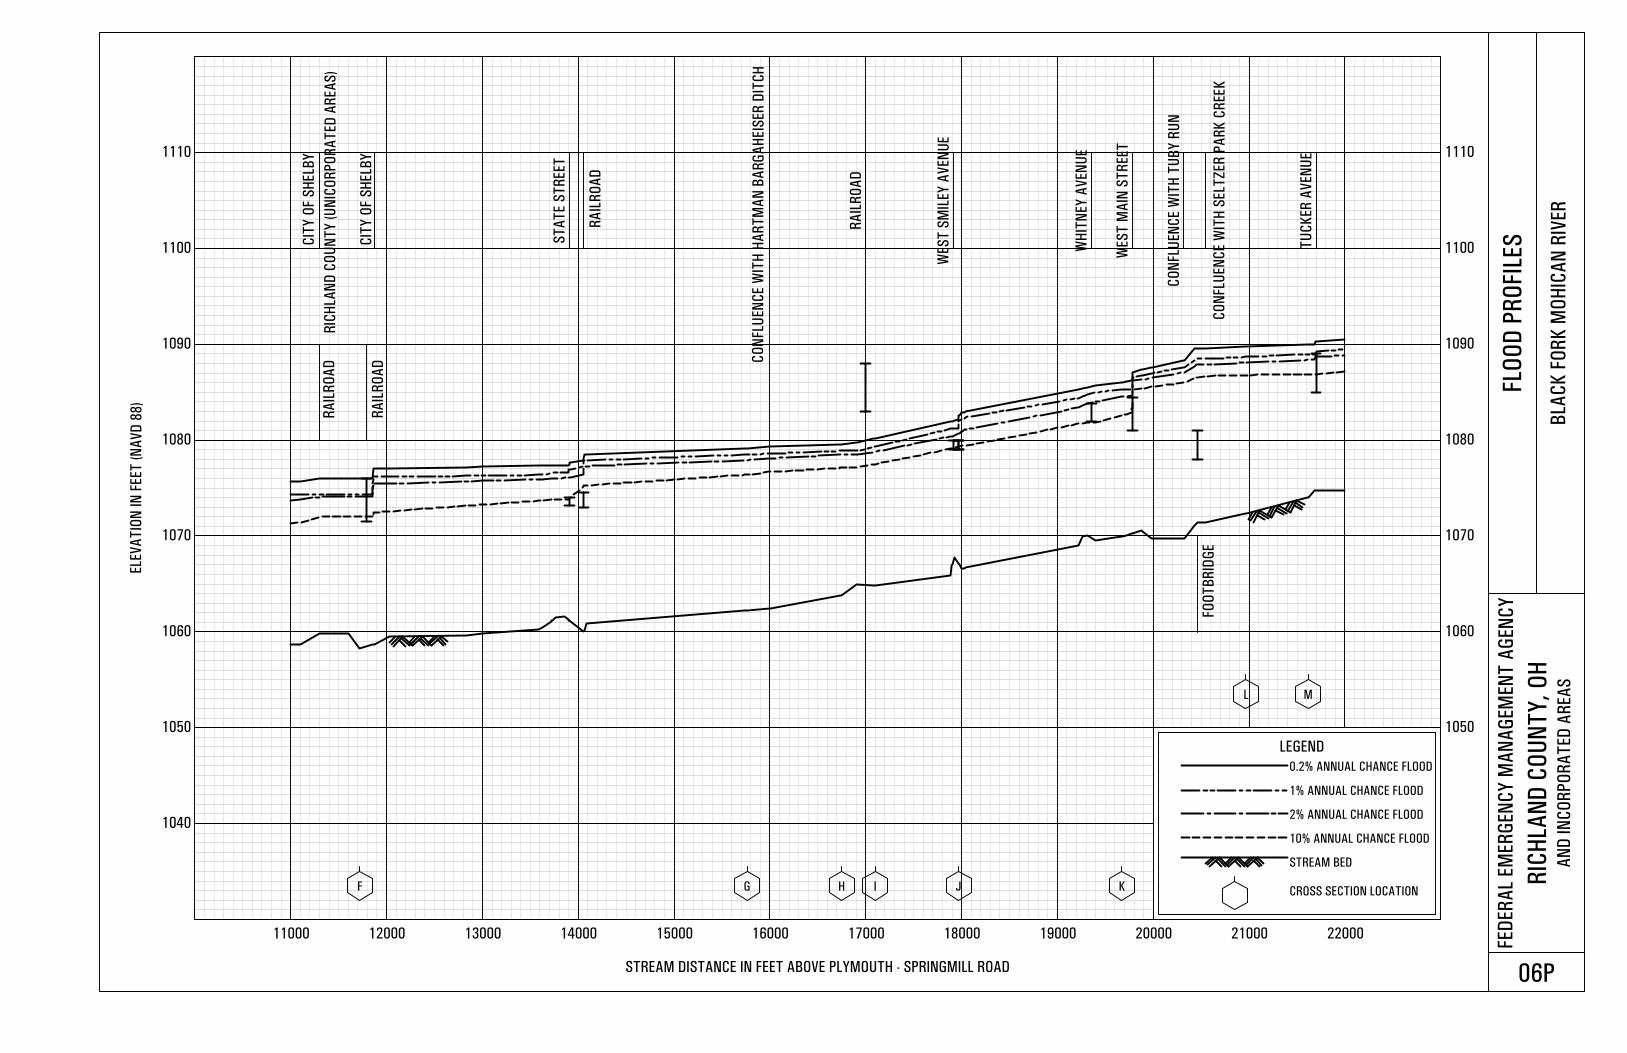
1040
1050 1050
1060 1060
1070 1070
1080 1080
1090 1090
1100 1100
1110 1110
11000 12000 13000 14000 15000 16000 17000 18000 19000 20000 21000 22000
ELE
VA
TIO
N IN
FEET
(N
AV
D 8
8)
STREAM DISTANCE IN FEET ABOVE PLYMOUTH - SPRINGMILL ROAD
FED
ER
AL
EM
ER
GEN
CY
MA
NA
GEM
EN
T A
GEN
CY
RIC
HLA
ND
CO
UN
TY
, O
HA
ND
IN
CO
RP
OR
AT
ED
AR
EA
S
FLO
OD
PR
OFI L
ES
BLA
CK
FO
RK
MO
HIC
AN
RIV
ER
06P
F G H I J K
L M
RIC
HLA
ND
CO
UN
TY
(U
NIC
OR
PO
RA
TED
AR
EA
S)
CIT
Y O
F S
HELB
Y
CO
NFL
UEN
CE W
ITH
HA
RT
MA
N B
AR
GA
HEIS
ER
DIT
CH
CO
NFL
UEN
CE W
ITH
TU
BY
RU
N
FO
OT
BR
IDG
E
RA
ILR
OA
D
ST
AT
E S
TR
EET
RA
ILR
OA
D
RA
ILR
OA
D
WES
T S
MIL
EY
AV
EN
UE
WH
ITN
EY
AV
EN
UE
WES
T M
AIN
ST
REET
CO
NFLU
EN
CE W
ITH
SELT
ZER
PA
RK
CR
EEK
TU
CK
ER
AV
EN
UE
LEGEND
0.2% ANNUAL CHANCE FLOOD
1% ANNUAL CHANCE FLOOD
2% ANNUAL CHANCE FLOOD
10% ANNUAL CHANCE FLOOD
STREAM BED
CROSS SECTION LOCATION
CIT
Y O
F S
HELB
Y
RA
ILR
OA
D
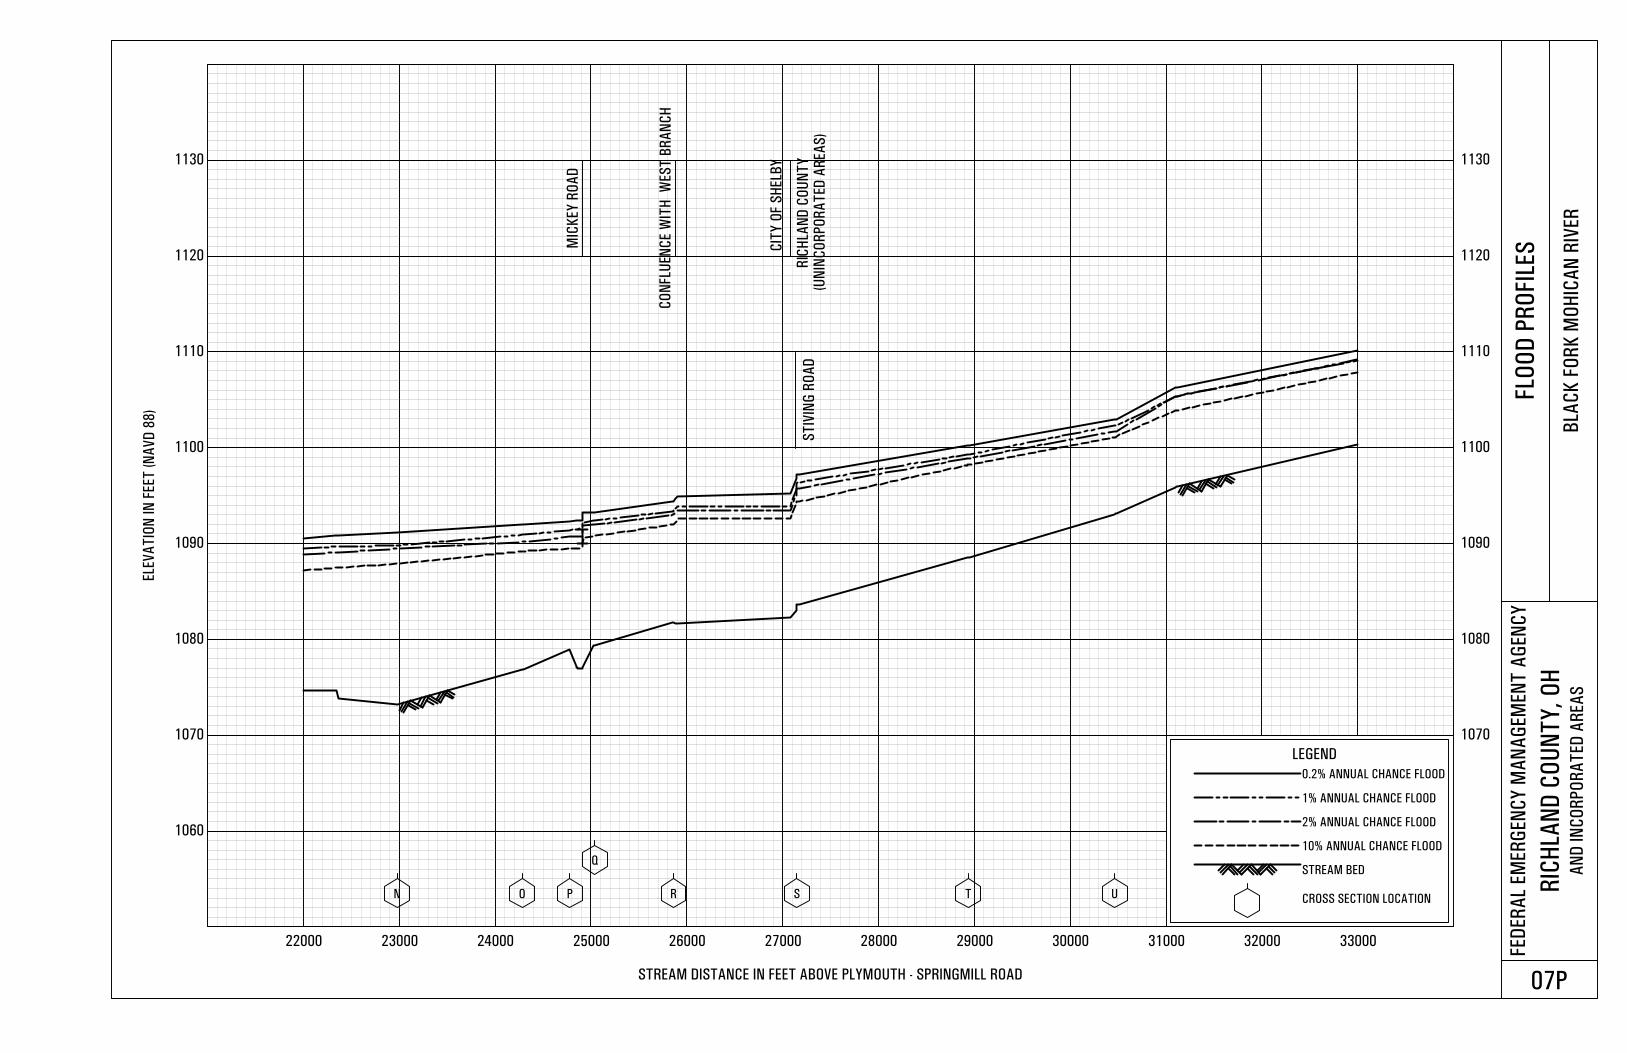
1060
1070 1070
1080 1080
1090 1090
1100 1100
1110 1110
1120 1120
1130 1130
22000 23000 24000 25000 26000 27000 28000 29000 30000 31000 32000 33000
ELE
VA
TIO
N IN
FEET
(N
AV
D 8
8)
STREAM DISTANCE IN FEET ABOVE PLYMOUTH - SPRINGMILL ROAD
FED
ER
AL
EM
ER
GEN
CY
MA
NA
GEM
EN
T A
GEN
CY
RIC
HLA
ND
CO
UN
TY
, O
HA
ND
IN
CO
RP
OR
AT
ED
AR
EA
S
FLO
OD
PR
OFI L
ES
BLA
CK
FO
RK
MO
HIC
AN
RIV
ER
07P
N O P
Q
R S T U
CO
NFLU
EN
CE W
ITH
W
ES
T B
RA
NC
H
RI C
HLA
ND
CO
UN
TY
MIC
KEY
RO
AD
ST
IVIN
G R
OA
D
LEGEND
0.2% ANNUAL CHANCE FLOOD
1% ANNUAL CHANCE FLOOD
2% ANNUAL CHANCE FLOOD
10% ANNUAL CHANCE FLOOD
STREAM BED
CROSS SECTION LOCATION
CIT
Y O
F S
HELB
Y
(UN
INC
OR
PO
RA
TED
AR
EA
S)
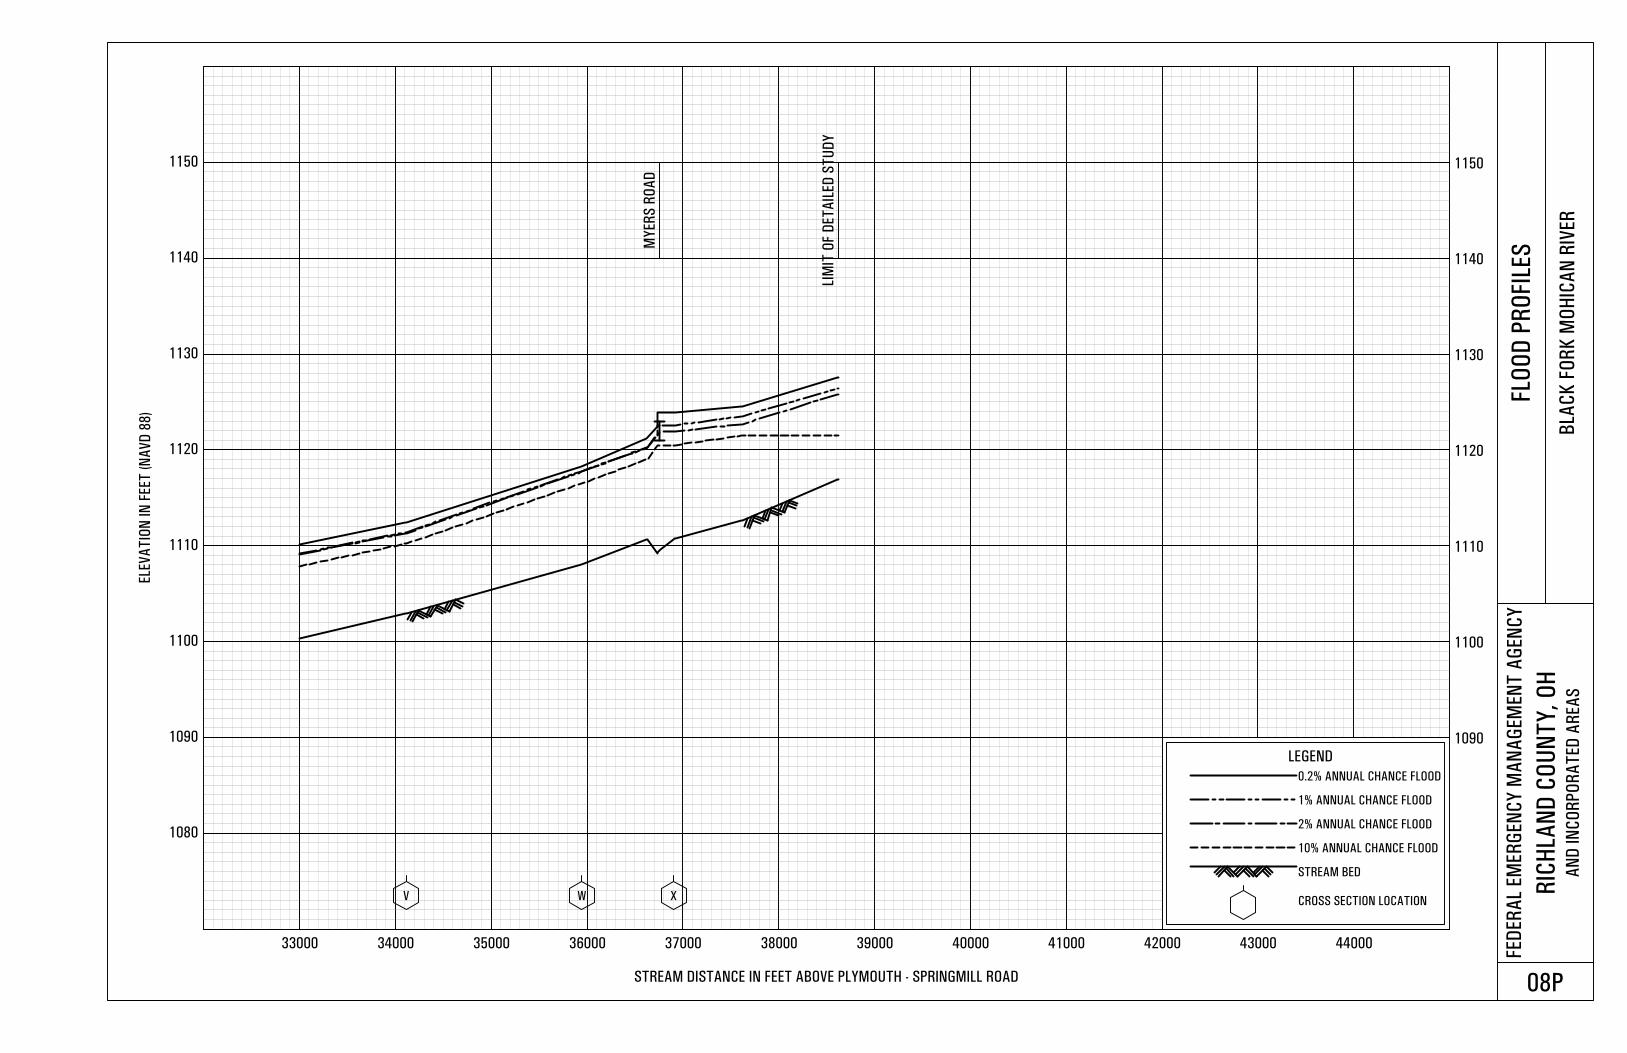
1080
1090 1090
1100 1100
1110 1110
1120 1120
1130 1130
1140 1140
1150 1150
33000 34000 35000 36000 37000 38000 39000 40000 41000 42000 43000 44000
ELE
VA
TIO
N IN
FEET
(N
AV
D 8
8)
STREAM DISTANCE IN FEET ABOVE PLYMOUTH - SPRINGMILL ROAD
FED
ER
AL
EM
ER
GEN
CY
MA
NA
GEM
EN
T A
GEN
CY
RIC
HLA
ND
CO
UN
TY
, O
HA
ND
IN
CO
RP
OR
AT
ED
AR
EA
S
FLO
OD
PR
OFI L
ES
BLA
CK
FO
RK
MO
HIC
AN
RIV
ER
08P
V W X
LIM
IT O
F D
ET
AIL
ED
ST
UD
Y
MY
ER
S R
OA
D
LEGEND
0.2% ANNUAL CHANCE FLOOD
1% ANNUAL CHANCE FLOOD
2% ANNUAL CHANCE FLOOD
10% ANNUAL CHANCE FLOOD
STREAM BED
CROSS SECTION LOCATION
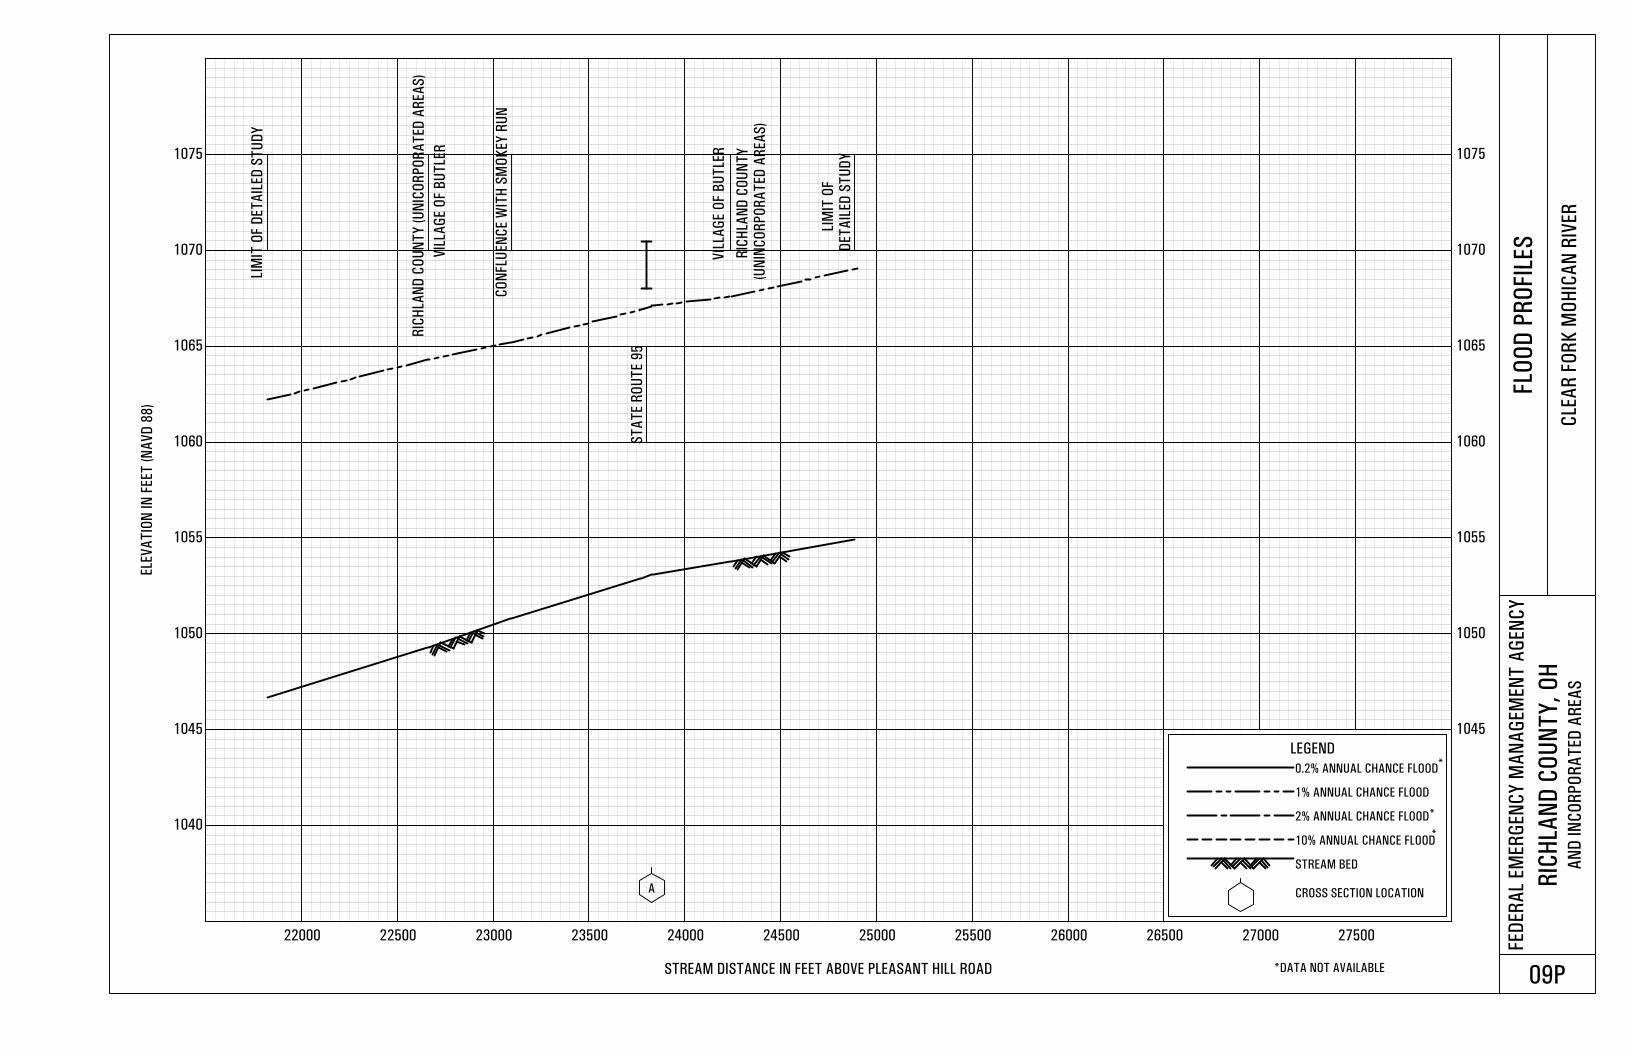
1040
1045 1045
1050 1050
1055 1055
1060 1060
1065 1065
1070 1070
1075 1075
22000 22500 23000 23500 24000 24500 25000 25500 26000 26500 27000 27500
ELE
VA
TIO
N IN
FEET
(N
AV
D 8
8)
STREAM DISTANCE IN FEET ABOVE PLEASANT HILL ROAD
FED
ER
AL
EM
ER
GEN
CY
MA
NA
GEM
EN
T A
GEN
CY
RIC
HLA
ND
CO
UN
TY
, O
HA
ND
IN
CO
RP
OR
AT
ED
AR
EA
S
FLO
OD
PR
OFI L
ES
CLE
AR
FO
RK
MO
HIC
AN
RIV
ER
09P
A
LIM
IT O
F D
ET
AIL
ED
ST
UD
Y
RIC
HLA
ND
CO
UN
TY
(U
NIC
OR
PO
RA
TED
AR
EA
S)
CO
NFLU
EN
CE W
ITH
SM
OK
EY
RU
N
RI C
HLA
ND
CO
UN
TY
DET
AIL
ED
ST
UD
Y
ST
AT
E R
OU
TE 9
5
LEGEND
0.2% ANNUAL CHANCE FLOOD
1% ANNUAL CHANCE FLOOD
2% ANNUAL CHANCE FLOOD
10% ANNUAL CHANCE FLOOD
STREAM BED
CROSS SECTION LOCATION
VI L
LAG
E O
F B
UT
LER
VI L
LAG
E O
F B
UT
LER
(UN
INC
OR
PO
RA
TED
AR
EA
S)
*
*
*
*DATA NOT AVAILABLE
LIM
IT O
F
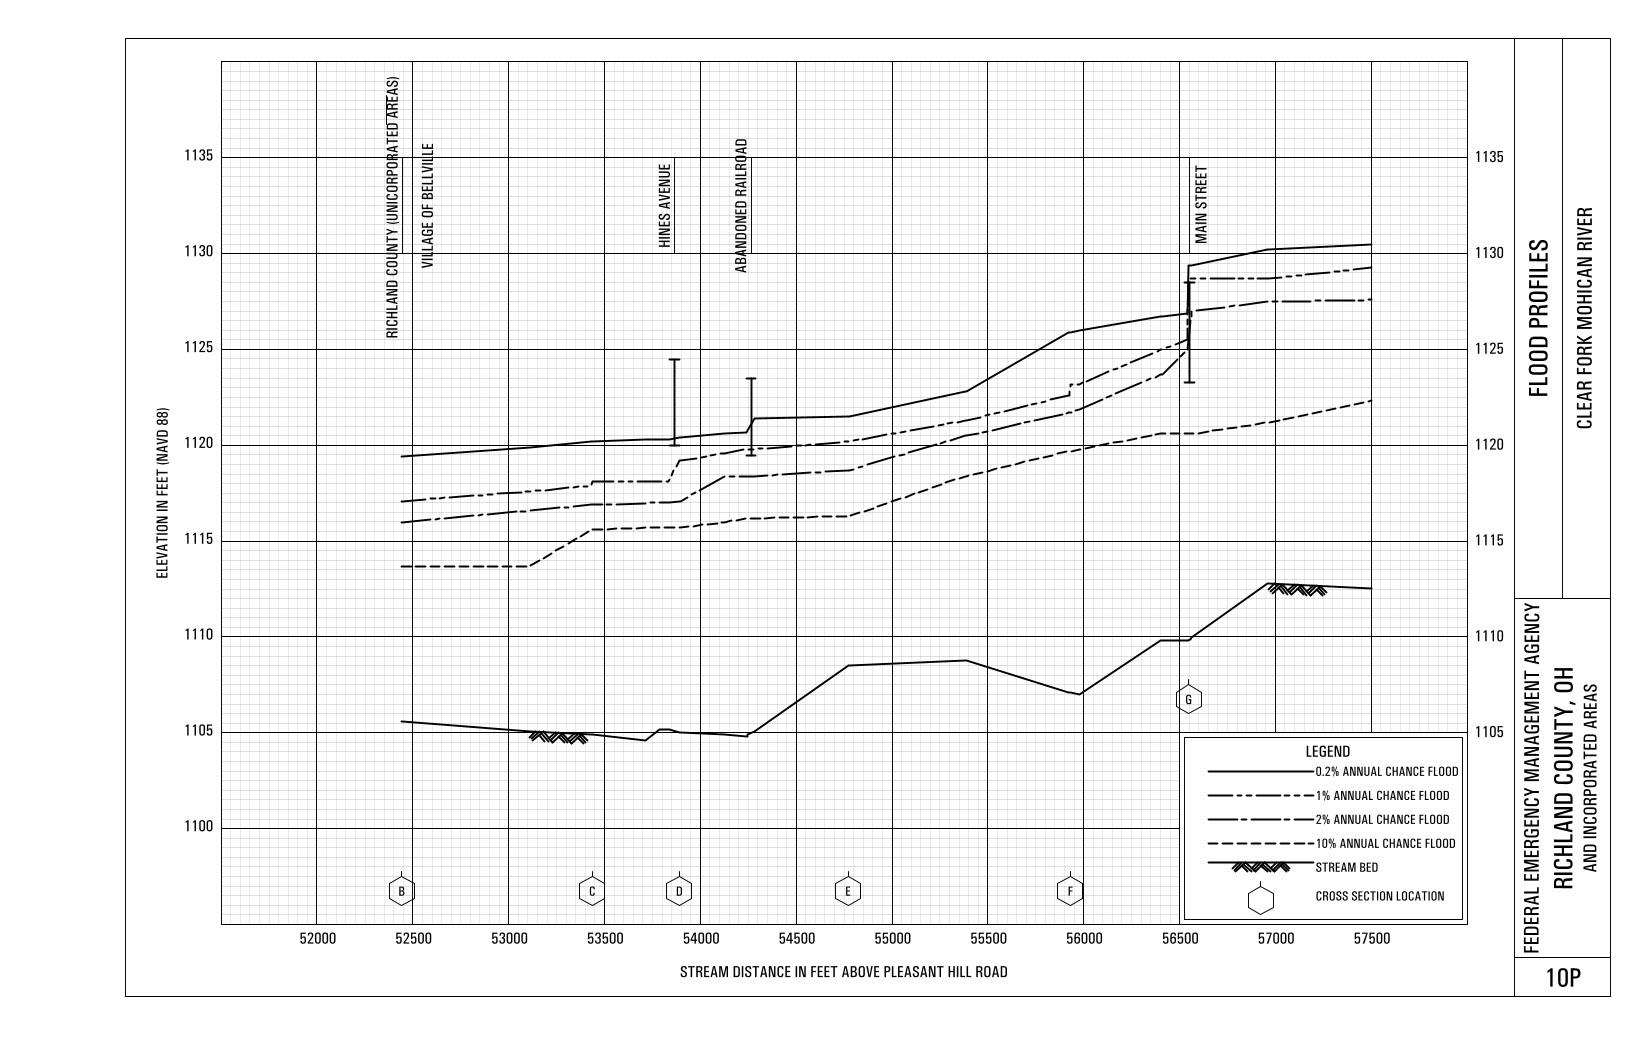
1100
1105 1105
1110 1110
1115 1115
1120 1120
1125 1125
1130 1130
1135 1135
52000 52500 53000 53500 54000 54500 55000 55500 56000 56500 57000 57500
ELE
VA
TIO
N IN
FEET
(N
AV
D 8
8)
STREAM DISTANCE IN FEET ABOVE PLEASANT HILL ROAD
FED
ER
AL
EM
ER
GEN
CY
MA
NA
GEM
EN
T A
GEN
CY
RIC
HLA
ND
CO
UN
TY
, O
HA
ND
IN
CO
RP
OR
AT
ED
AR
EA
S
FLO
OD
PR
OFI L
ES
CLE
AR
FO
RK
MO
HIC
AN
RIV
ER
10P
B C D E F
G
RIC
HLA
ND
CO
UN
TY
(U
NIC
OR
PO
RA
TED
AR
EA
S)
HIN
ES
AV
EN
UE
AB
AN
DO
NED
RA
ILR
OA
D
MA
IN S
TR
EET
LEGEND
0.2% ANNUAL CHANCE FLOOD
1% ANNUAL CHANCE FLOOD
2% ANNUAL CHANCE FLOOD
10% ANNUAL CHANCE FLOOD
STREAM BED
CROSS SECTION LOCATION
VIL
LAG
E O
F B
ELL
VI L
LE
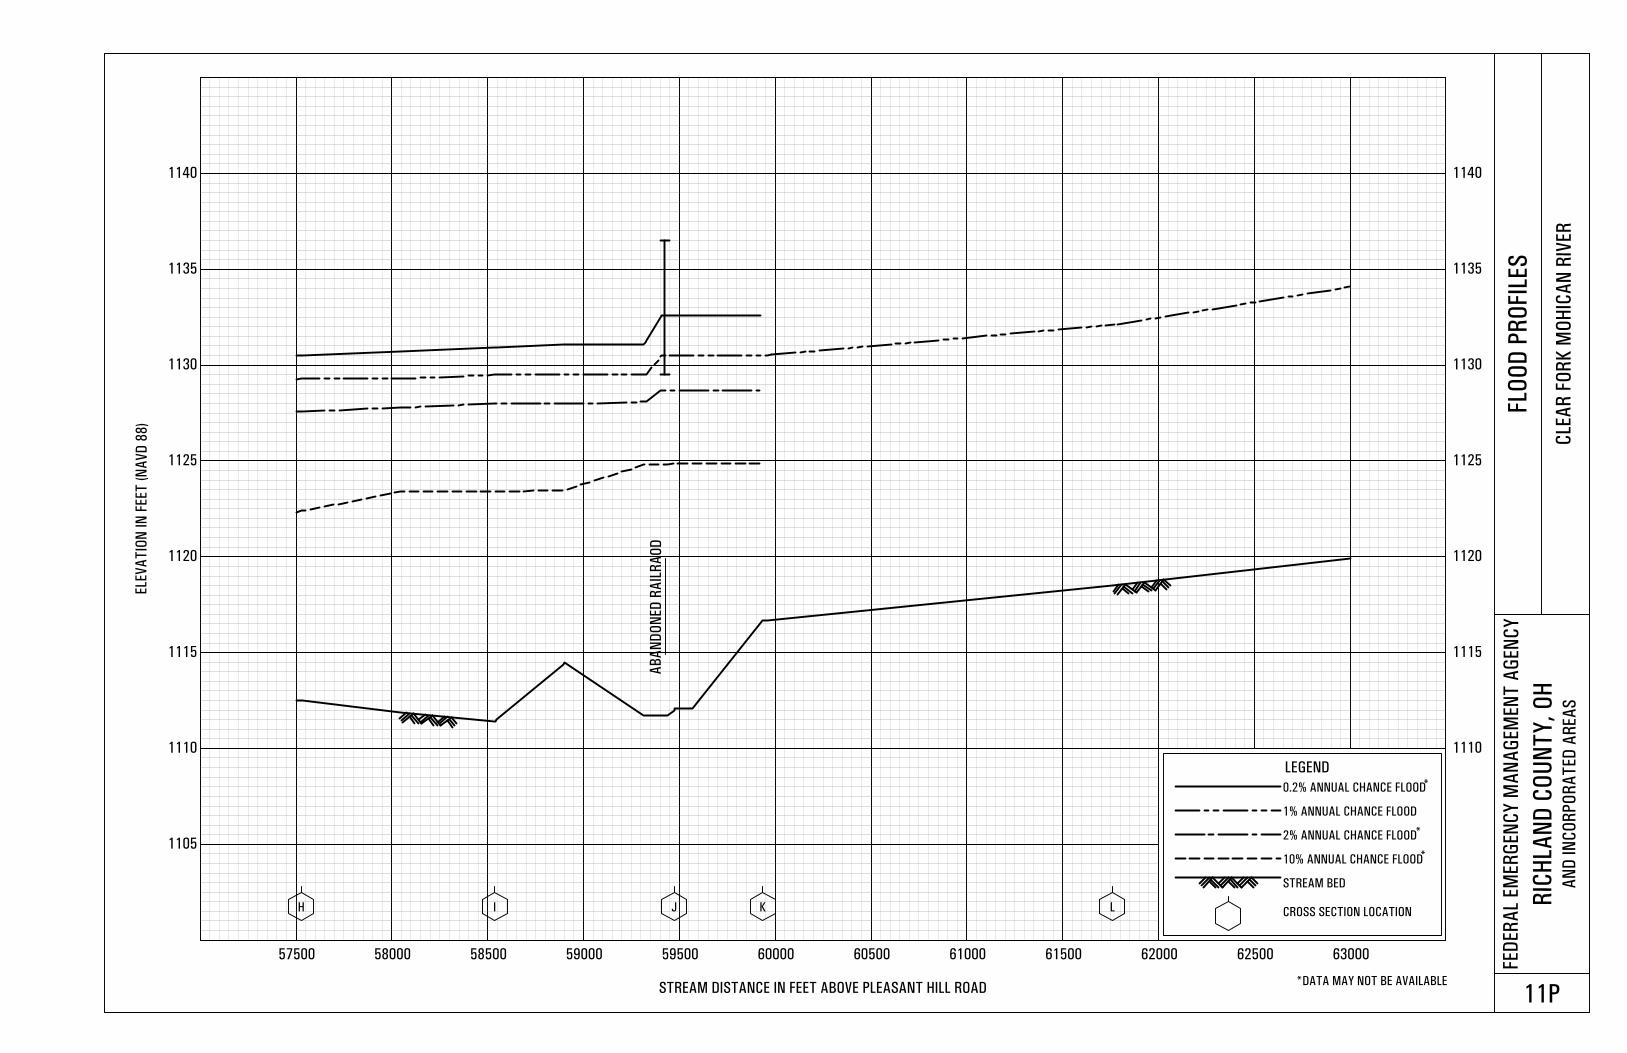
1105
1110 1110
1115 1115
1120 1120
1125 1125
1130 1130
1135 1135
1140 1140
57500 58000 58500 59000 59500 60000 60500 61000 61500 62000 62500 63000
ELE
VA
TIO
N IN
FEET
(N
AV
D 8
8)
STREAM DISTANCE IN FEET ABOVE PLEASANT HILL ROAD
FED
ER
AL
EM
ER
GEN
CY
MA
NA
GEM
EN
T A
GEN
CY
RIC
HLA
ND
CO
UN
TY
, O
HA
ND
IN
CO
RP
OR
AT
ED
AR
EA
S
FLO
OD
PR
OFI L
ES
CLE
AR
FO
RK
MO
HIC
AN
RIV
ER
11P
H I J K L
AB
AN
DO
NED
RA
ILR
AO
D
LEGEND
0.2% ANNUAL CHANCE FLOOD
1% ANNUAL CHANCE FLOOD
2% ANNUAL CHANCE FLOOD
10% ANNUAL CHANCE FLOOD
STREAM BED
CROSS SECTION LOCATION
*
*
*
*DATA MAY NOT BE AVAILABLE
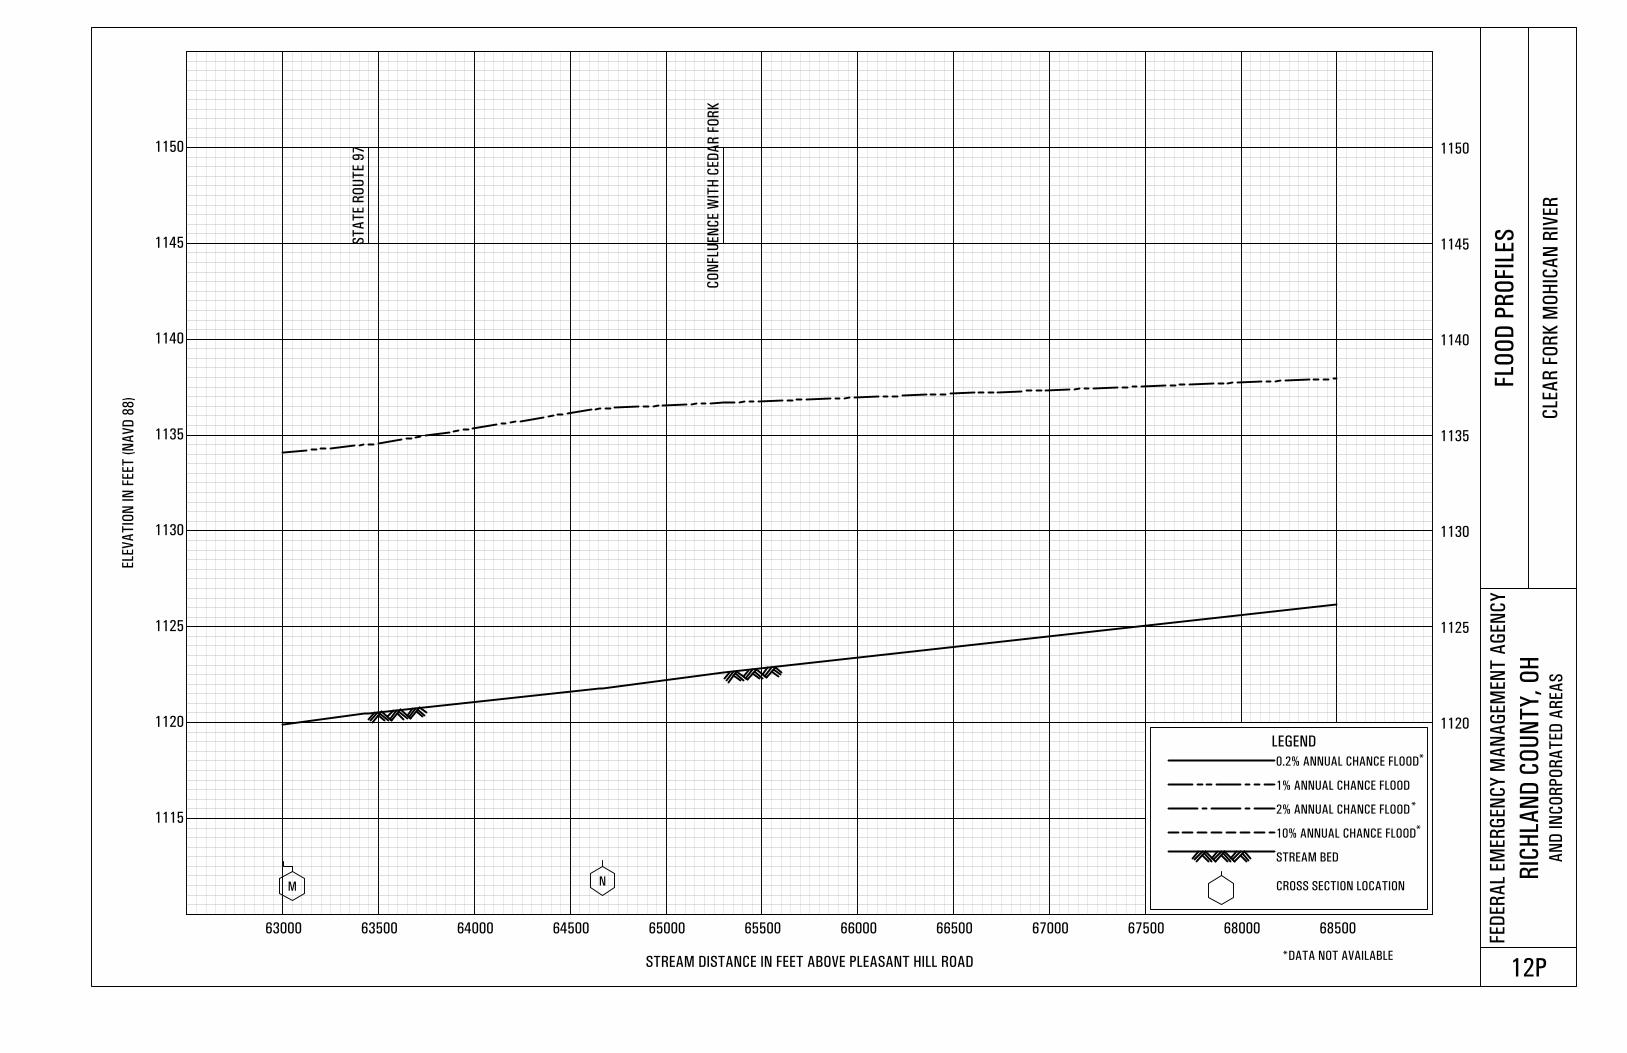
1115
1120 1120
1125 1125
1130 1130
1135 1135
1140 1140
1145 1145
1150 1150
63000 63500 64000 64500 65000 65500 66000 66500 67000 67500 68000 68500
ELE
VA
TIO
N IN
FEET
(N
AV
D 8
8)
STREAM DISTANCE IN FEET ABOVE PLEASANT HILL ROAD
FED
ER
AL
EM
ER
GEN
CY
MA
NA
GEM
EN
T A
GEN
CY
RIC
HLA
ND
CO
UN
TY
, O
HA
ND
IN
CO
RP
OR
AT
ED
AR
EA
S
FLO
OD
PR
OFI L
ES
CLE
AR
FO
RK
MO
HIC
AN
RIV
ER
12P
N
ST
AT
E R
OU
TE 9
7
CO
NFLU
EN
CE W
ITH
CED
AR
FO
RK
LEGEND
0.2% ANNUAL CHANCE FLOOD
1% ANNUAL CHANCE FLOOD
2% ANNUAL CHANCE FLOOD
10% ANNUAL CHANCE FLOOD
STREAM BED
CROSS SECTION LOCATION
*
*
*
*DATA NOT AVAILABLE
M
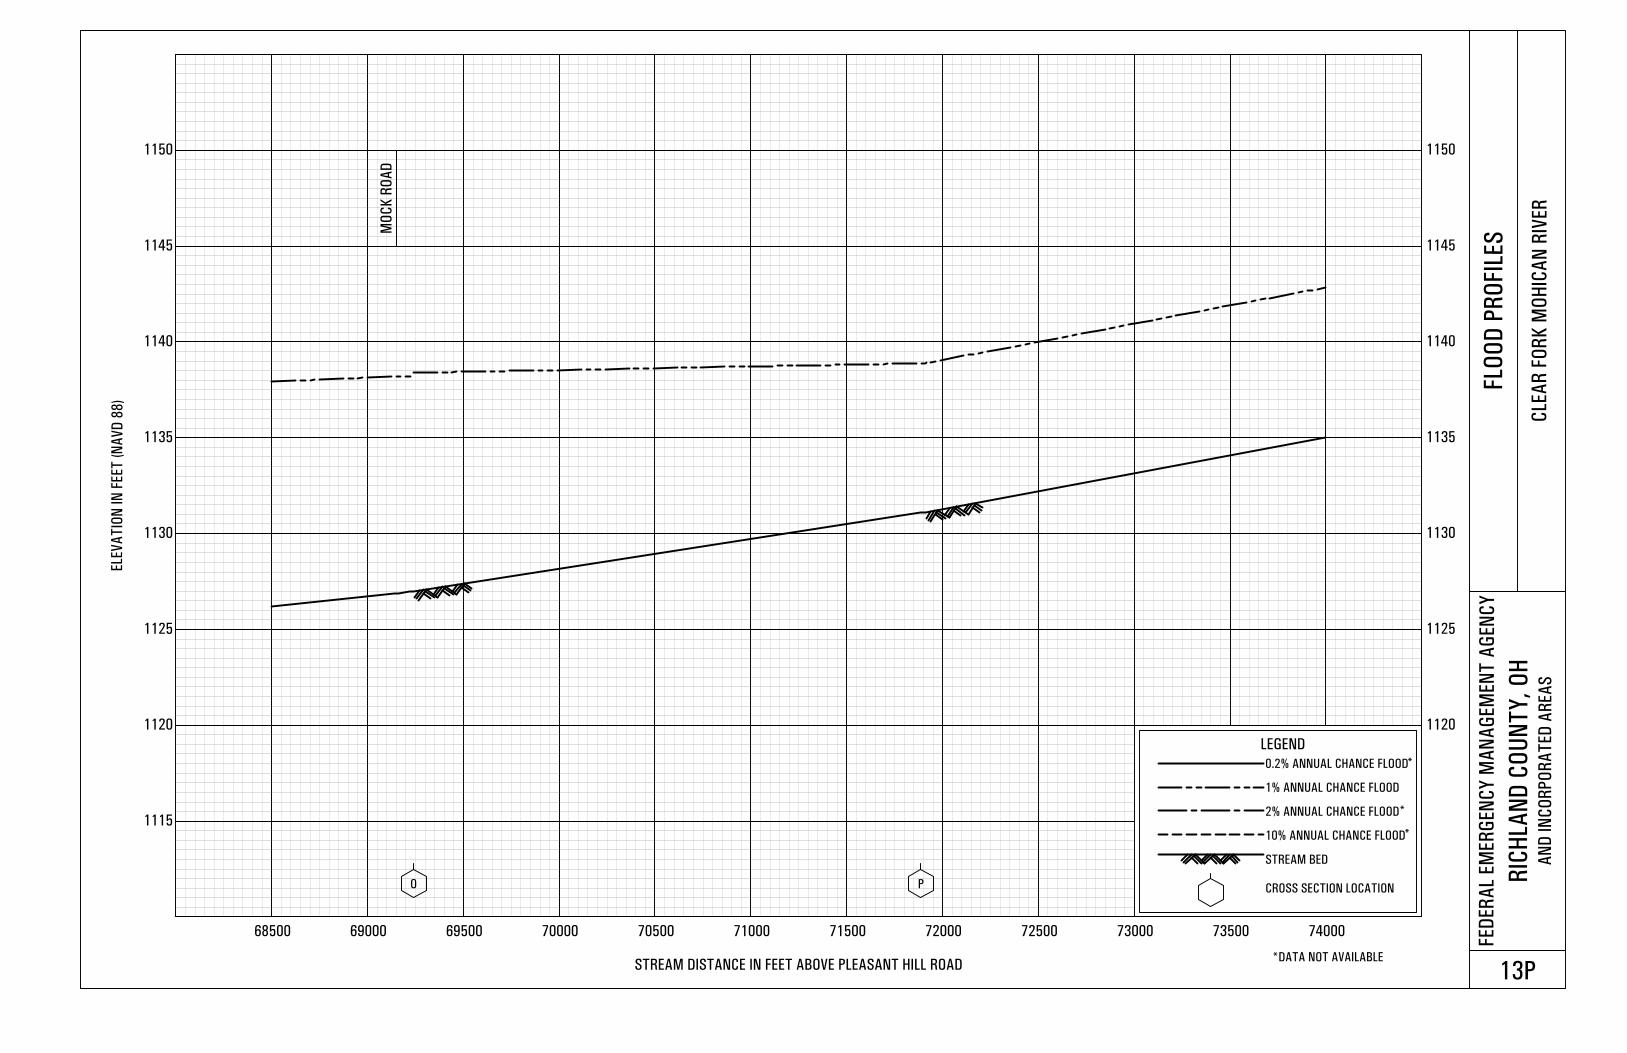
1115
1120 1120
1125 1125
1130 1130
1135 1135
1140 1140
1145 1145
1150 1150
68500 69000 69500 70000 70500 71000 71500 72000 72500 73000 73500 74000
ELE
VA
TIO
N IN
FEET
(N
AV
D 8
8)
STREAM DISTANCE IN FEET ABOVE PLEASANT HILL ROAD
FED
ER
AL
EM
ER
GEN
CY
MA
NA
GEM
EN
T A
GEN
CY
RIC
HLA
ND
CO
UN
TY
, O
HA
ND
IN
CO
RP
OR
AT
ED
AR
EA
S
FLO
OD
PR
OFI L
ES
CLE
AR
FO
RK
MO
HIC
AN
RIV
ER
13P
O P
MO
CK
RO
AD
LEGEND
0.2% ANNUAL CHANCE FLOOD
1% ANNUAL CHANCE FLOOD
2% ANNUAL CHANCE FLOOD
10% ANNUAL CHANCE FLOOD
STREAM BED
CROSS SECTION LOCATION
*
*
*
*DATA NOT AVAILABLE
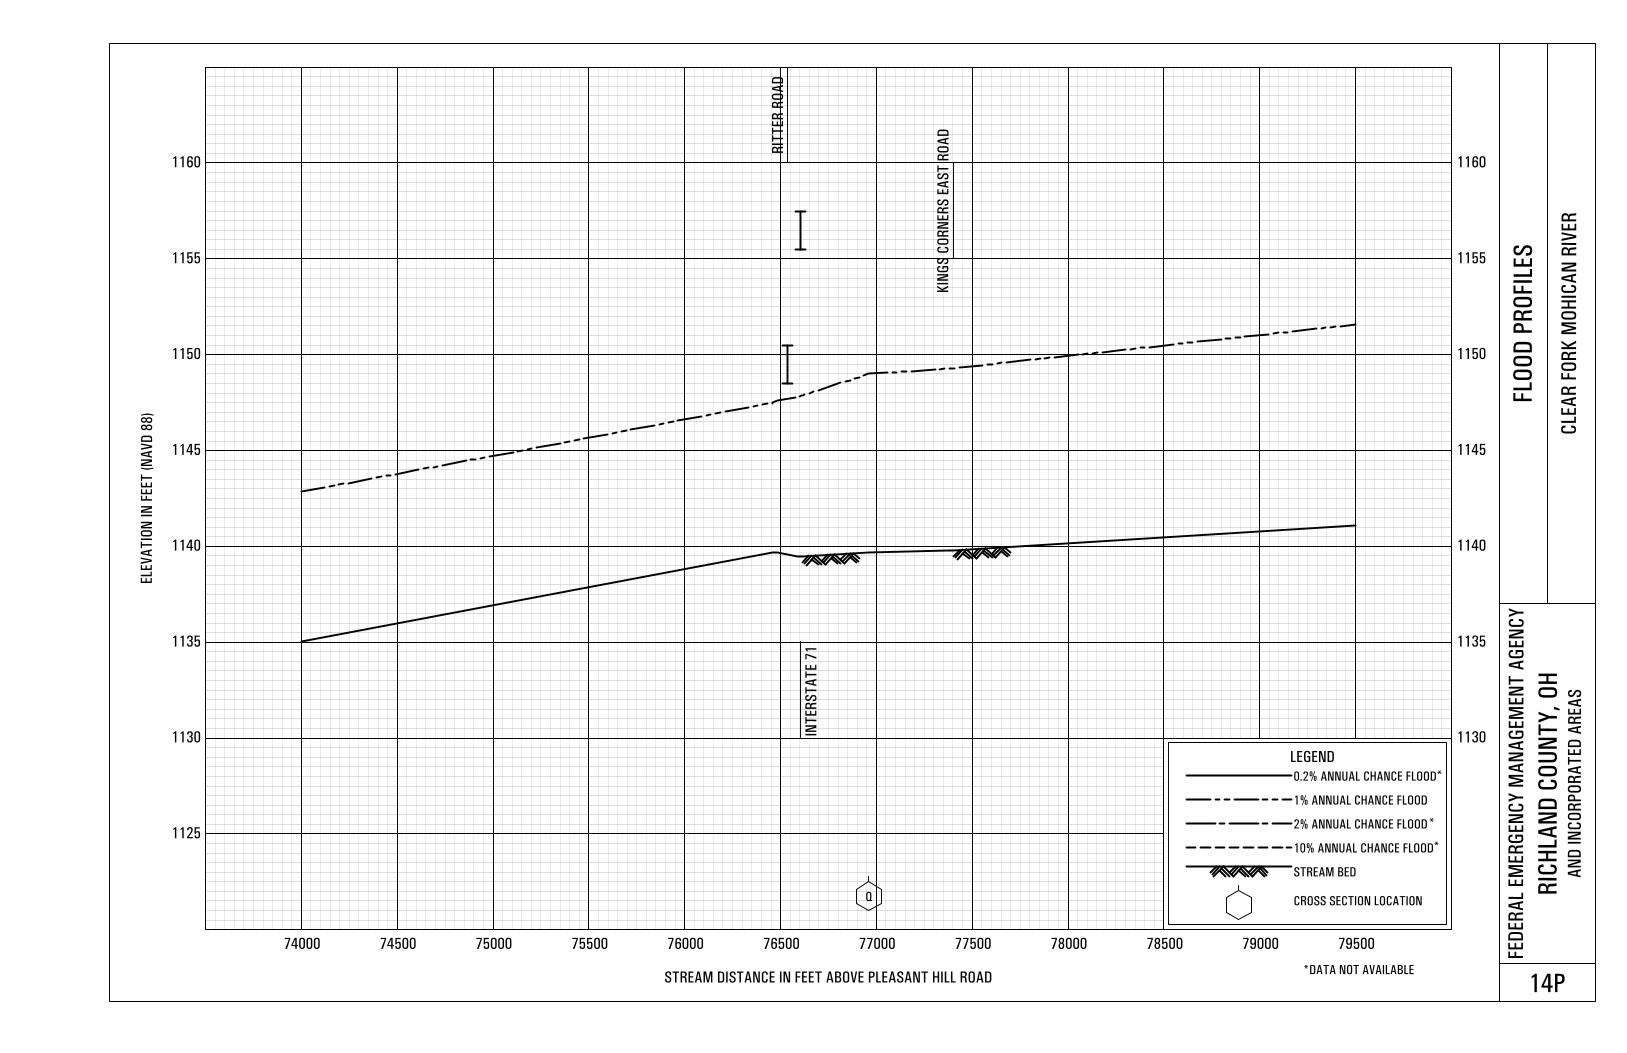
1125
1130 1130
1135 1135
1140 1140
1145 1145
1150 1150
1155 1155
1160 1160
74000 74500 75000 75500 76000 76500 77000 77500 78000 78500 79000 79500
ELE
VA
TIO
N IN
FEET
(N
AV
D 8
8)
STREAM DISTANCE IN FEET ABOVE PLEASANT HILL ROAD
FED
ER
AL
EM
ER
GEN
CY
MA
NA
GEM
EN
T A
GEN
CY
RIC
HLA
ND
CO
UN
TY
, O
HA
ND
IN
CO
RP
OR
AT
ED
AR
EA
S
FLO
OD
PR
OFI L
ES
CLE
AR
FO
RK
MO
HIC
AN
RIV
ER
14P
Q
KIN
GS
CO
RN
ER
S E
AS
T R
OA
D
RIT
TER
RO
AD
INT
ER
ST
AT
E 7
1
LEGEND
0.2% ANNUAL CHANCE FLOOD
1% ANNUAL CHANCE FLOOD
2% ANNUAL CHANCE FLOOD
10% ANNUAL CHANCE FLOOD
STREAM BED
CROSS SECTION LOCATION
*
*
*
*DATA NOT AVAILABLE
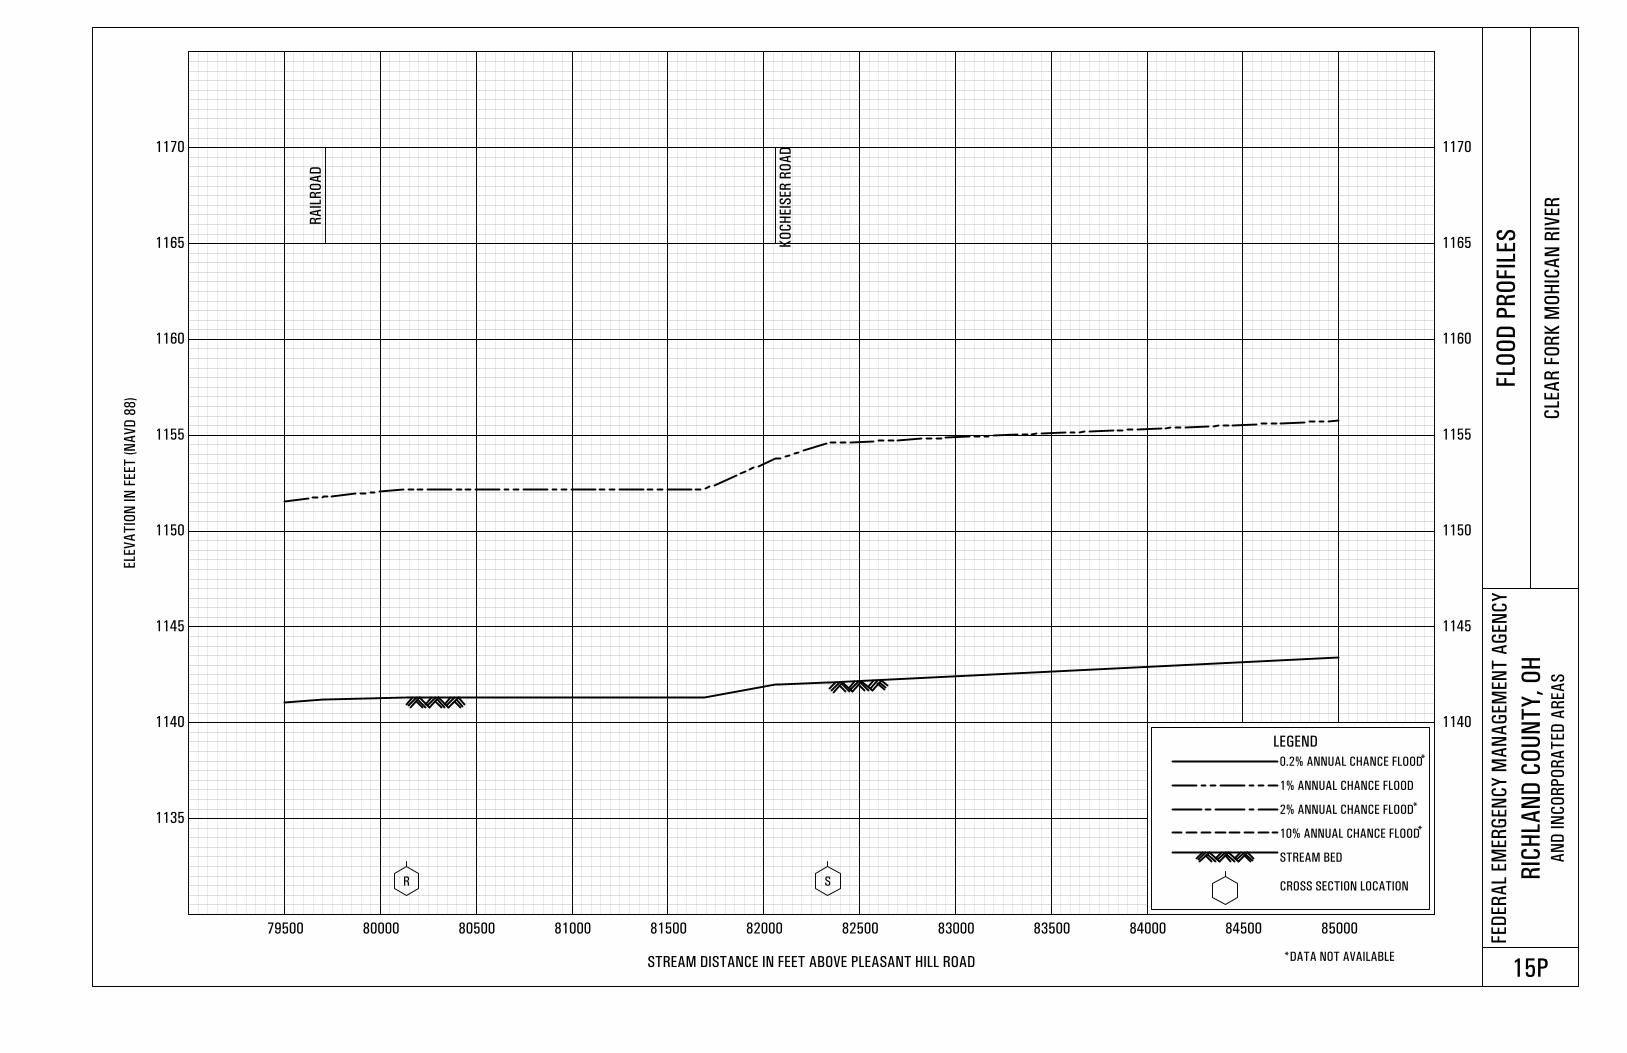
1135
1140 1140
1145 1145
1150 1150
1155 1155
1160 1160
1165 1165
1170 1170
79500 80000 80500 81000 81500 82000 82500 83000 83500 84000 84500 85000
ELE
VA
TIO
N IN
FEET
(N
AV
D 8
8)
STREAM DISTANCE IN FEET ABOVE PLEASANT HILL ROAD
FED
ER
AL
EM
ER
GEN
CY
MA
NA
GEM
EN
T A
GEN
CY
RIC
HLA
ND
CO
UN
TY
, O
HA
ND
IN
CO
RP
OR
AT
ED
AR
EA
S
FLO
OD
PR
OFI L
ES
CLE
AR
FO
RK
MO
HIC
AN
RIV
ER
15P
R S
RA
ILR
OA
D
KO
CH
EIS
ER
RO
AD
LEGEND
0.2% ANNUAL CHANCE FLOOD
1% ANNUAL CHANCE FLOOD
2% ANNUAL CHANCE FLOOD
10% ANNUAL CHANCE FLOOD
STREAM BED
CROSS SECTION LOCATION
*
*
*
*DATA NOT AVAILABLE
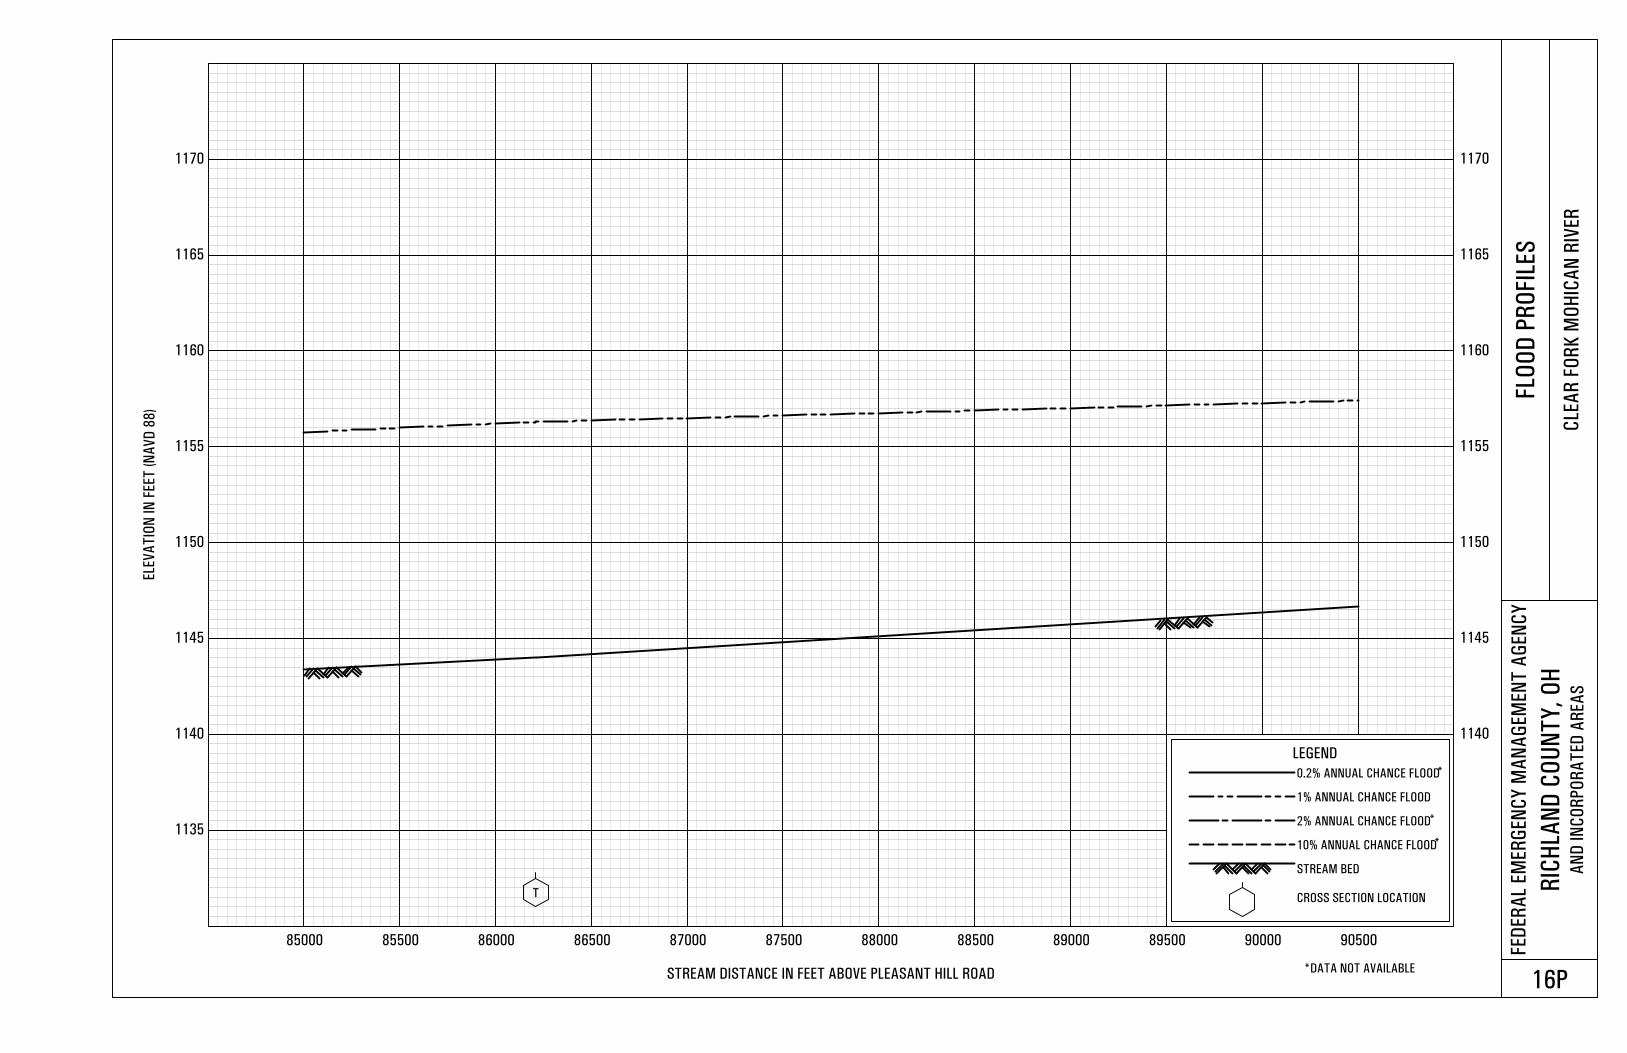
1135
1140 1140
1145 1145
1150 1150
1155 1155
1160 1160
1165 1165
1170 1170
85000 85500 86000 86500 87000 87500 88000 88500 89000 89500 90000 90500
ELE
VA
TIO
N IN
FEET
(N
AV
D 8
8)
STREAM DISTANCE IN FEET ABOVE PLEASANT HILL ROAD
FED
ER
AL
EM
ER
GEN
CY
MA
NA
GEM
EN
T A
GEN
CY
RIC
HLA
ND
CO
UN
TY
, O
HA
ND
IN
CO
RP
OR
AT
ED
AR
EA
S
FLO
OD
PR
OFI L
ES
CLE
AR
FO
RK
MO
HIC
AN
RIV
ER
16P
T
LEGEND
0.2% ANNUAL CHANCE FLOOD
1% ANNUAL CHANCE FLOOD
2% ANNUAL CHANCE FLOOD
10% ANNUAL CHANCE FLOOD
STREAM BED
CROSS SECTION LOCATION
*
*
*
*DATA NOT AVAILABLE
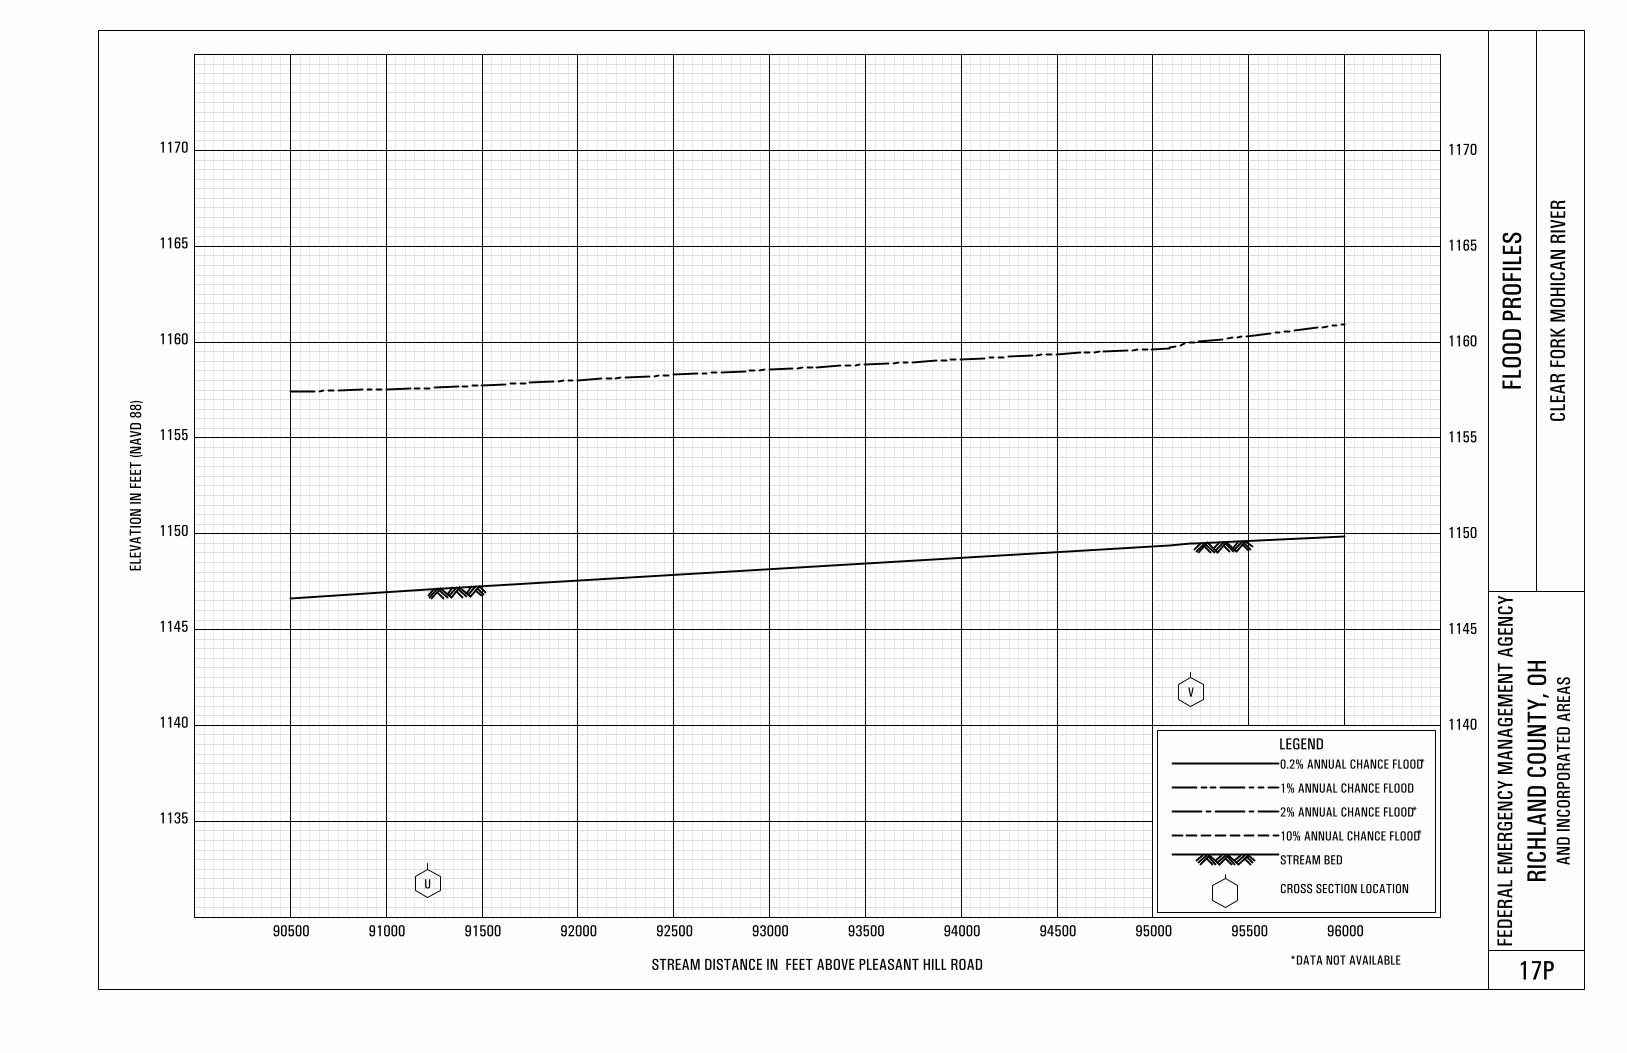
1135
1140 1140
1145 1145
1150 1150
1155 1155
1160 1160
1165 1165
1170 1170
90500 91000 91500 92000 92500 93000 93500 94000 94500 95000 95500 96000
ELE
VA
TIO
N IN
FEET
(N
AV
D 8
8)
STREAM DISTANCE IN FEET ABOVE PLEASANT HILL ROAD
FED
ER
AL
EM
ER
GEN
CY
MA
NA
GEM
EN
T A
GEN
CY
RIC
HLA
ND
CO
UN
TY
, O
HA
ND
IN
CO
RP
OR
AT
ED
AR
EA
S
FLO
OD
PR
OFI L
ES
CLE
AR
FO
RK
MO
HIC
AN
RIV
ER
17P
U
V
LEGEND
0.2% ANNUAL CHANCE FLOOD
1% ANNUAL CHANCE FLOOD
2% ANNUAL CHANCE FLOOD
10% ANNUAL CHANCE FLOOD
STREAM BED
CROSS SECTION LOCATION
*
*
*
*DATA NOT AVAILABLE
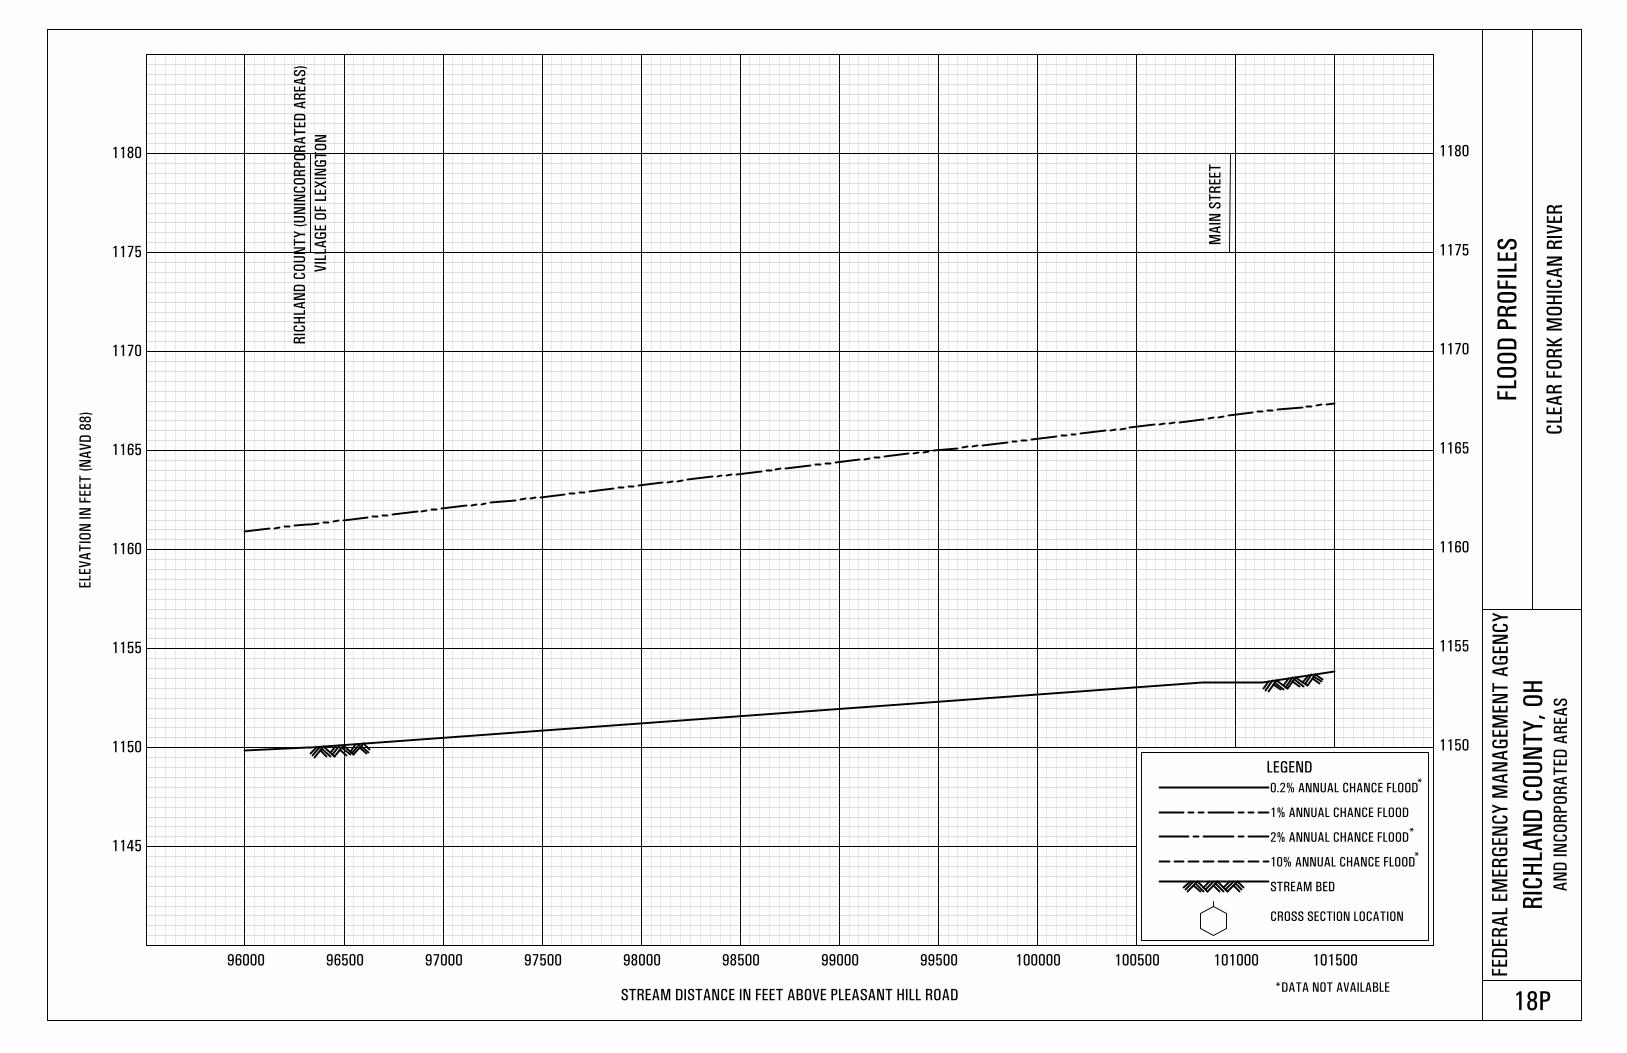
1145
1150 1150
1155 1155
1160 1160
1165 1165
1170 1170
1175 1175
1180 1180
96000 96500 97000 97500 98000 98500 99000 99500 100000 100500 101000 101500
ELE
VA
TIO
N IN
FEET
(N
AV
D 8
8)
STREAM DISTANCE IN FEET ABOVE PLEASANT HILL ROAD
FED
ER
AL
EM
ER
GEN
CY
MA
NA
GEM
EN
T A
GEN
CY
RIC
HLA
ND
CO
UN
TY
, O
HA
ND
IN
CO
RP
OR
AT
ED
AR
EA
S
FLO
OD
PR
OFI L
ES
CLE
AR
FO
RK
MO
HIC
AN
RIV
ER
18P
RIC
HLA
ND
CO
UN
TY
(U
NIN
CO
RP
OR
AT
ED
AR
EA
S)
LEGEND
0.2% ANNUAL CHANCE FLOOD
1% ANNUAL CHANCE FLOOD
2% ANNUAL CHANCE FLOOD
10% ANNUAL CHANCE FLOOD
STREAM BED
CROSS SECTION LOCATION
*
*
*
*DATA NOT AVAILABLE
VIL
L AG
E O
F L
EX
ING
TO
N
MA
IN S
TR
EET
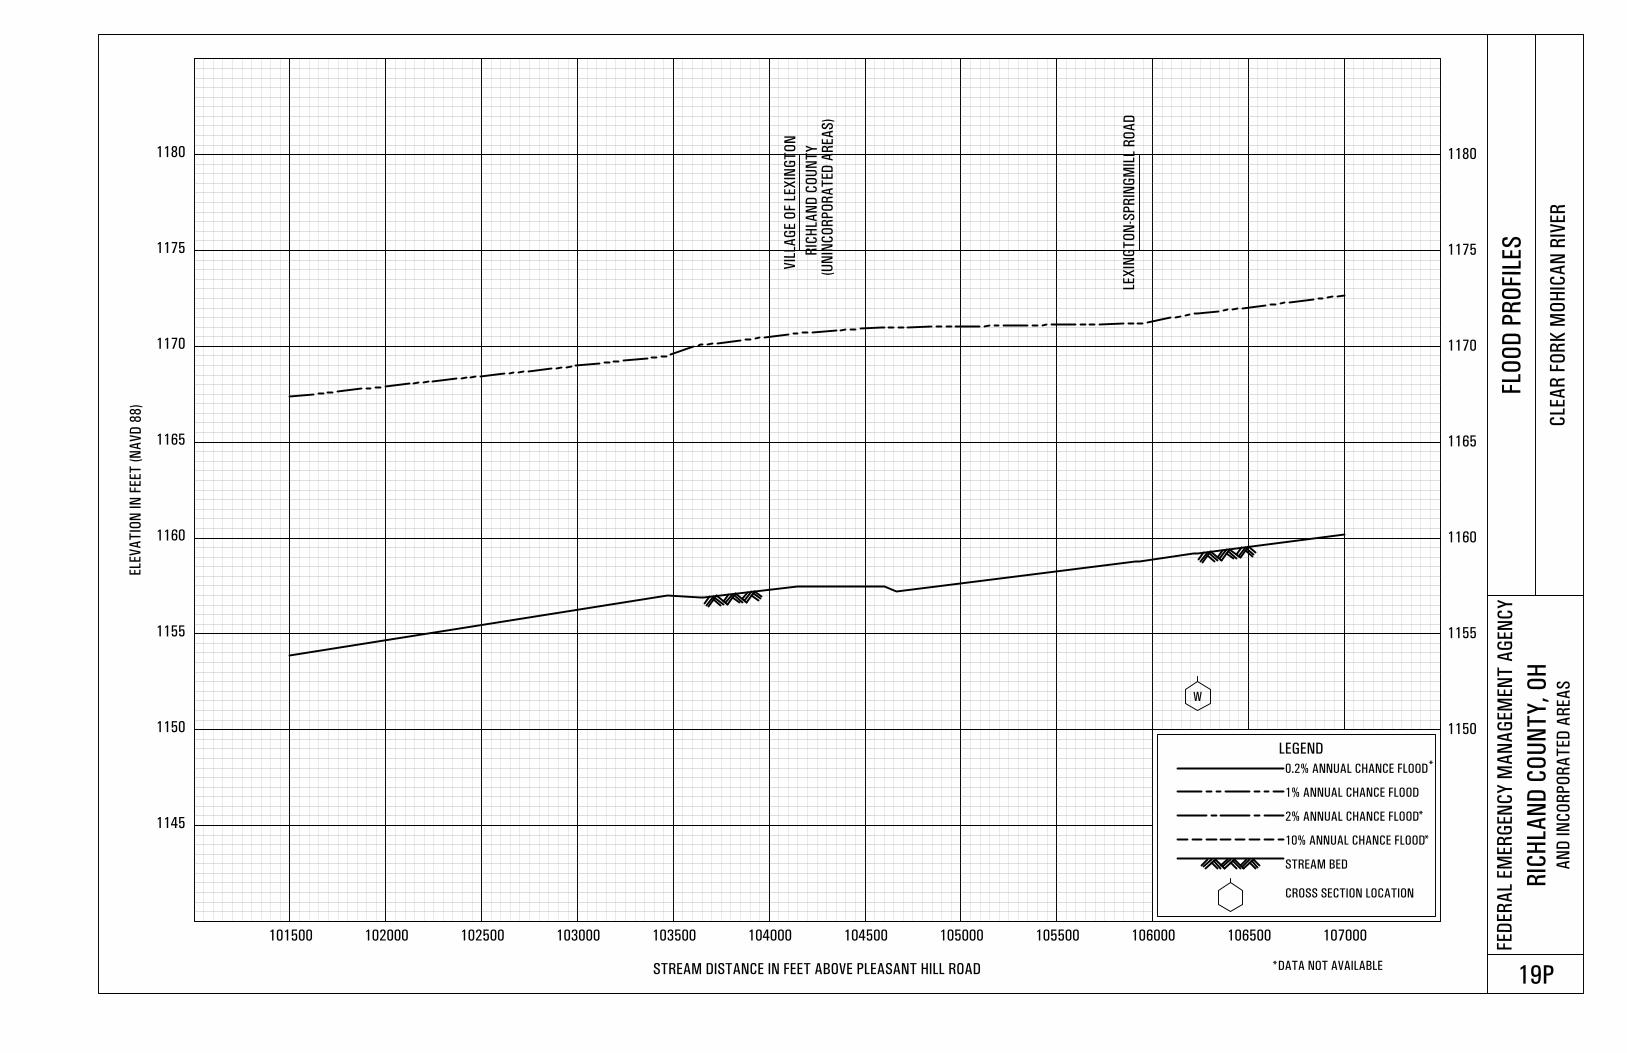
1145
1150 1150
1155 1155
1160 1160
1165 1165
1170 1170
1175 1175
1180 1180
101500 102000 102500 103000 103500 104000 104500 105000 105500 106000 106500 107000
ELE
VA
TIO
N IN
FEET
(N
AV
D 8
8)
STREAM DISTANCE IN FEET ABOVE PLEASANT HILL ROAD
FED
ER
AL
EM
ER
GEN
CY
MA
NA
GEM
EN
T A
GEN
CY
RIC
HLA
ND
CO
UN
TY
, O
HA
ND
IN
CO
RP
OR
AT
ED
AR
EA
S
FLO
OD
PR
OFI L
ES
CLE
AR
FO
RK
MO
HIC
AN
RIV
ER
19P
W
VIL
LAG
E O
F LE
XIN
GT
ON
LEX
ING
TO
N-S
PR
ING
MIL
L R
OA
D
LEGEND
0.2% ANNUAL CHANCE FLOOD
1% ANNUAL CHANCE FLOOD
2% ANNUAL CHANCE FLOOD
10% ANNUAL CHANCE FLOOD
STREAM BED
CROSS SECTION LOCATION
RI C
HLA
ND
CO
UN
TY
*
*
*
*DATA NOT AVAILABLE
(UN
INC
OR
PO
RA
TED
AR
EA
S)
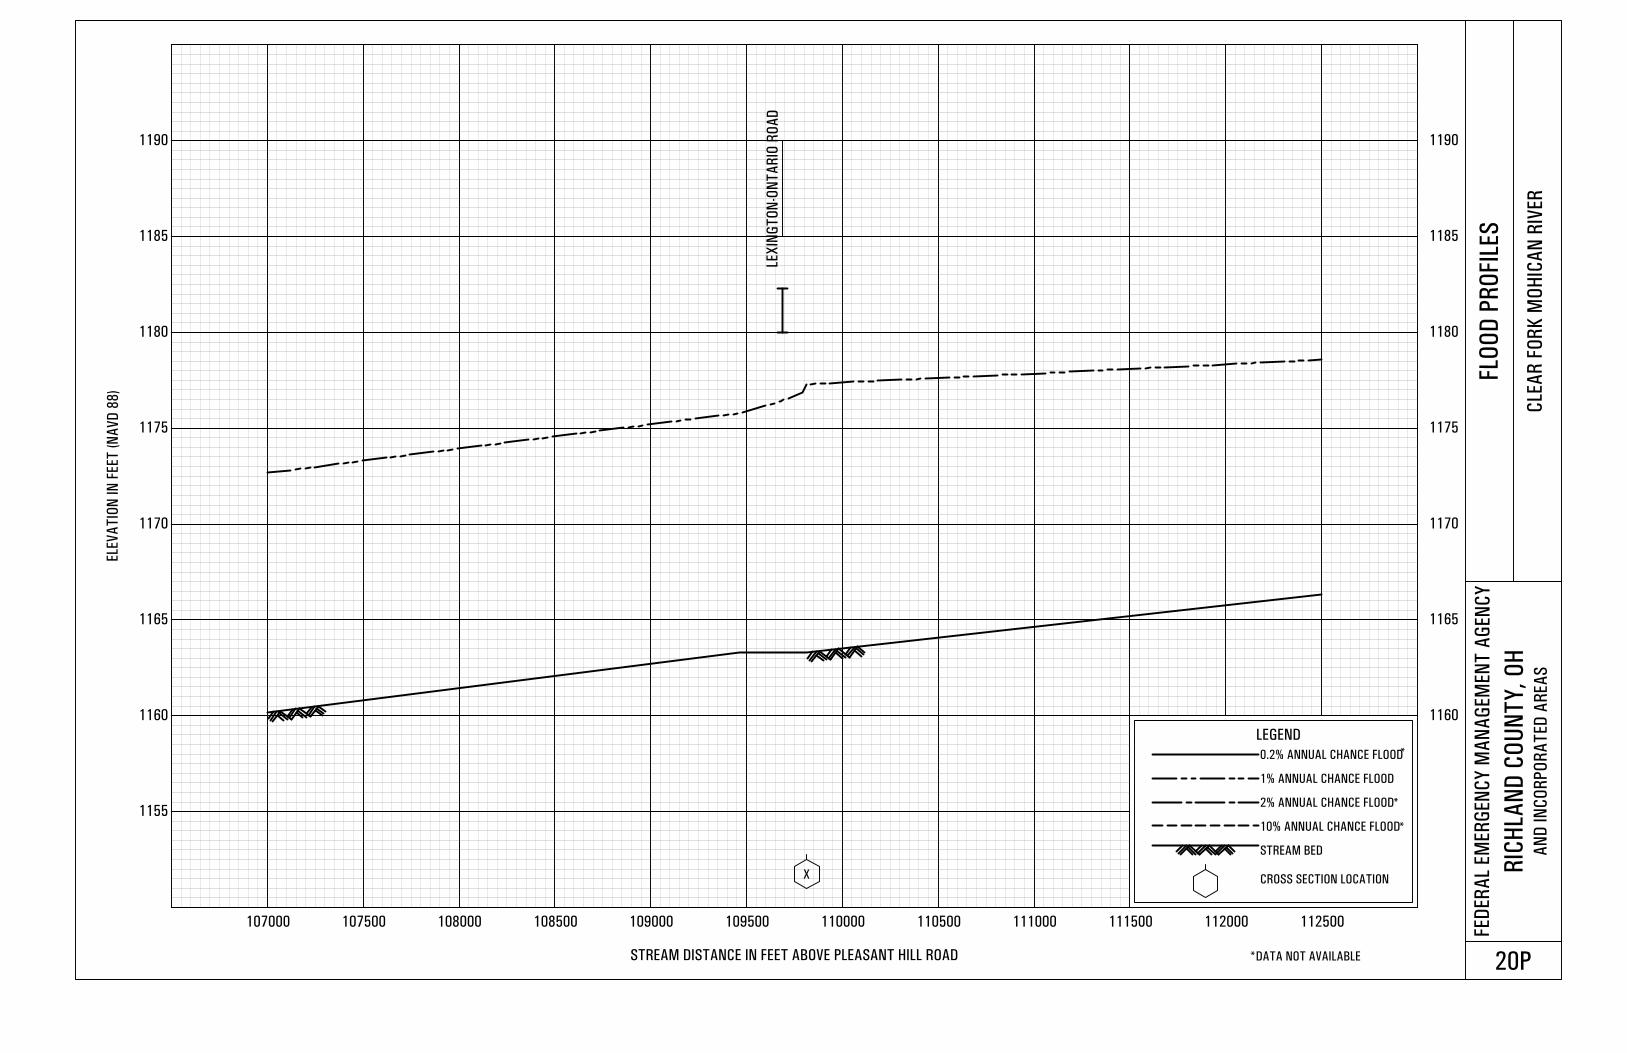
1155
1160 1160
1165 1165
1170 1170
1175 1175
1180 1180
1185 1185
1190 1190
107000 107500 108000 108500 109000 109500 110000 110500 111000 111500 112000 112500
ELE
VA
TIO
N IN
FEET
(N
AV
D 8
8)
STREAM DISTANCE IN FEET ABOVE PLEASANT HILL ROAD
FED
ER
AL
EM
ER
GEN
CY
MA
NA
GEM
EN
T A
GEN
CY
RIC
HLA
ND
CO
UN
TY
, O
HA
ND
IN
CO
RP
OR
AT
ED
AR
EA
S
FLO
OD
PR
OFI L
ES
CLE
AR
FO
RK
MO
HIC
AN
RIV
ER
20P
X
LEX
ING
TO
N-O
NT
AR
IO R
OA
D
LEGEND
0.2% ANNUAL CHANCE FLOOD
1% ANNUAL CHANCE FLOOD
2% ANNUAL CHANCE FLOOD
10% ANNUAL CHANCE FLOOD
STREAM BED
CROSS SECTION LOCATION
*
*
*
*DATA NOT AVAILABLE
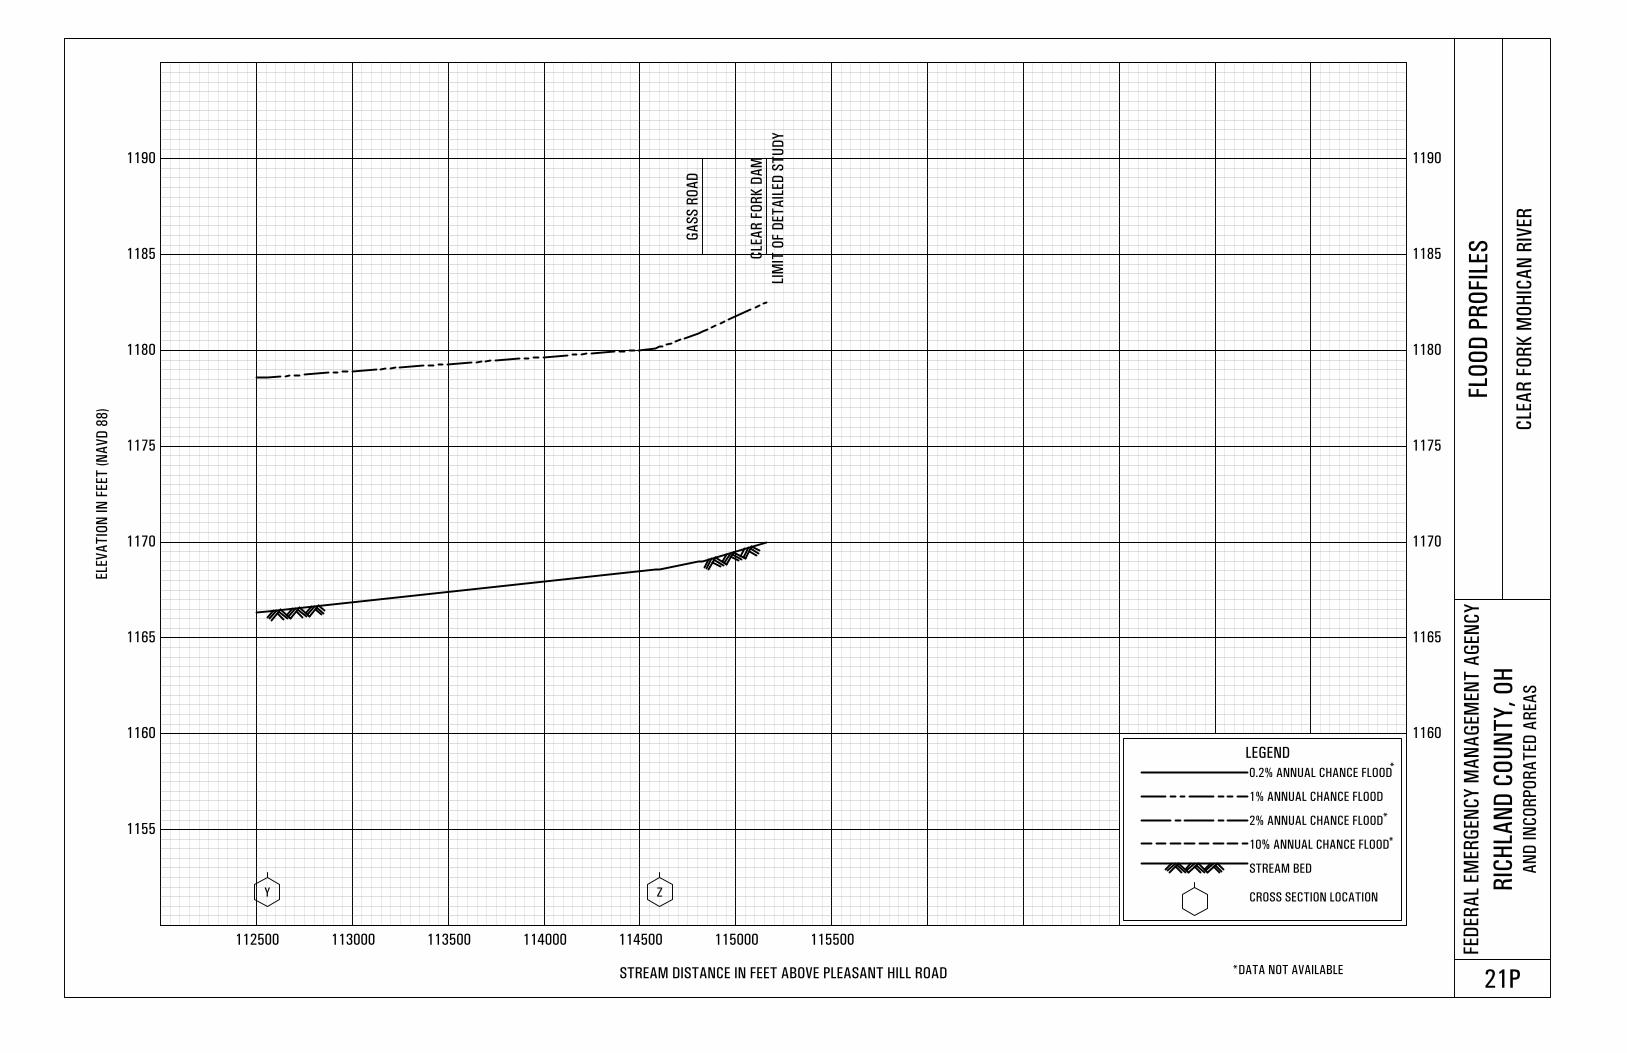
1155
1160 1160
1165 1165
1170 1170
1175 1175
1180 1180
1185 1185
1190 1190
112500 113000 113500 114000 114500 115000 115500
ELE
VA
TIO
N IN
FEET
(N
AV
D 8
8)
STREAM DISTANCE IN FEET ABOVE PLEASANT HILL ROAD
FED
ER
AL
EM
ER
GEN
CY
MA
NA
GEM
EN
T A
GEN
CY
RIC
HLA
ND
CO
UN
TY
, O
HA
ND
IN
CO
RP
OR
AT
ED
AR
EA
S
FLO
OD
PR
OFI L
ES
CLE
AR
FO
RK
MO
HIC
AN
RIV
ER
21P
Y Z
GA
SS
RO
AD
CLE
AR
FO
RK
DA
M
LEGEND
0.2% ANNUAL CHANCE FLOOD
1% ANNUAL CHANCE FLOOD
2% ANNUAL CHANCE FLOOD
10% ANNUAL CHANCE FLOOD
STREAM BED
CROSS SECTION LOCATION
*
*
*
*DATA NOT AVAILABLE
LIM
IT O
F D
ET
AIL
ED
ST
UD
Y
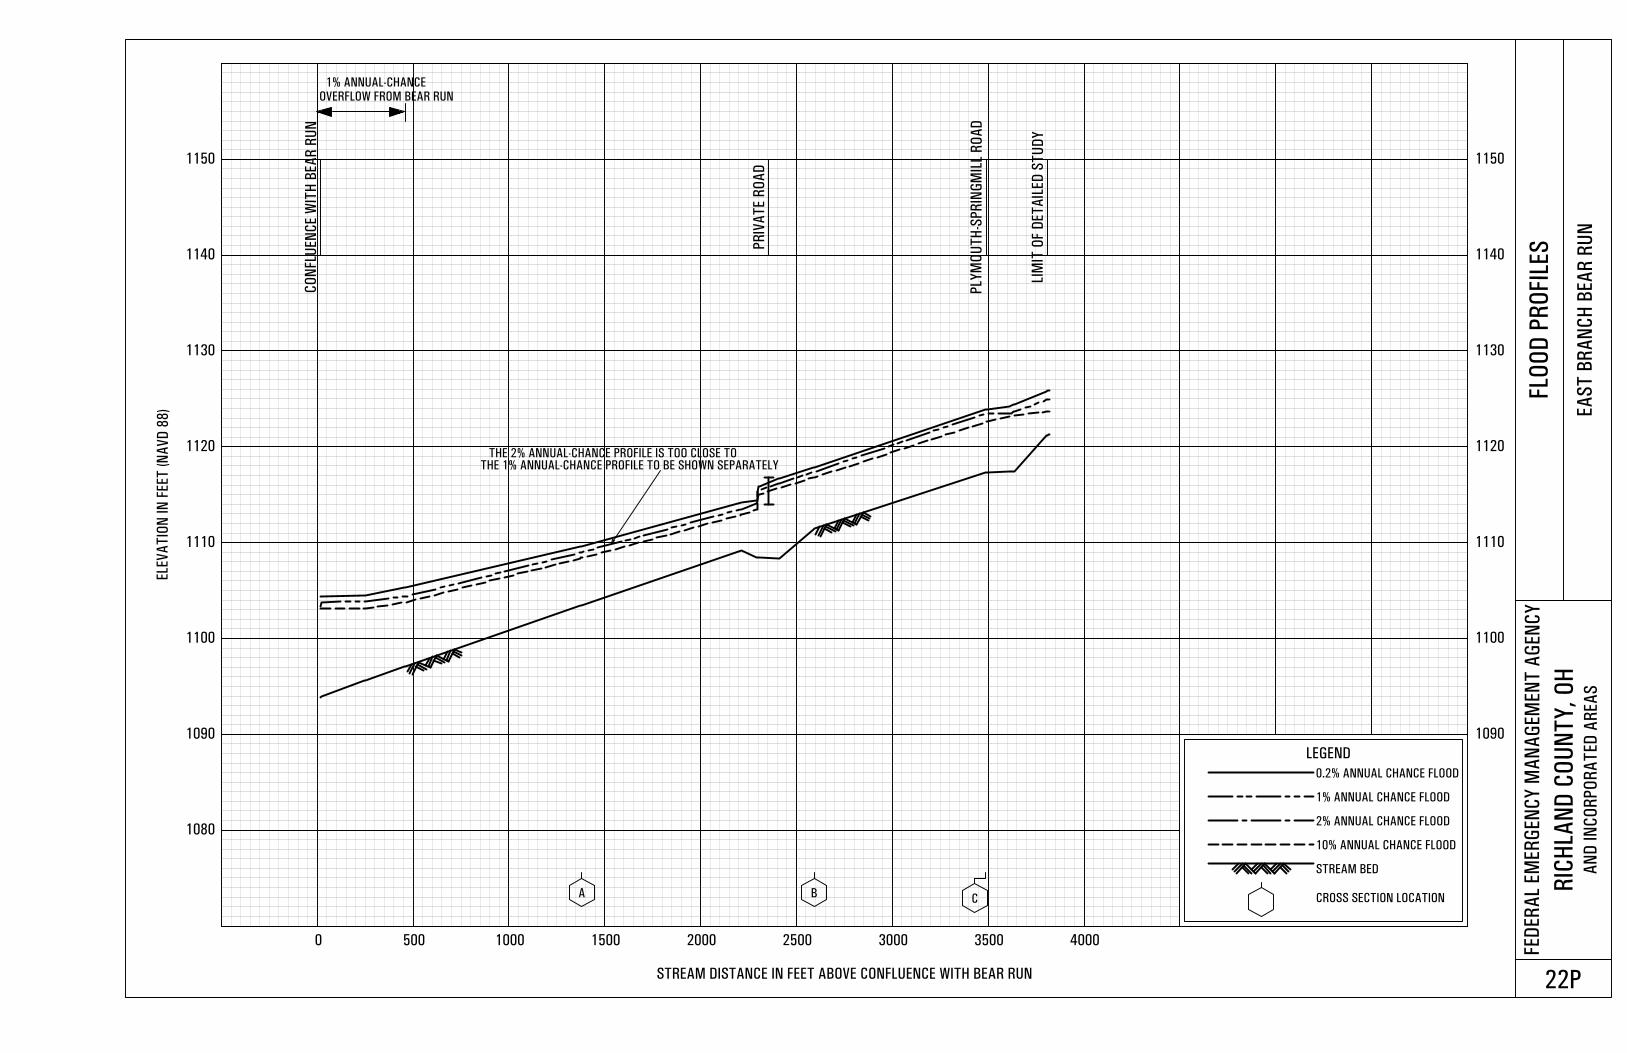
1080
1090 1090
1100 1100
1110 1110
1120 1120
1130 1130
1140 1140
1150 1150
0 500 1000 1500 2000 2500 3000 3500 4000
ELE
VA
TIO
N IN
FEET
(N
AV
D 8
8)
STREAM DISTANCE IN FEET ABOVE CONFLUENCE WITH BEAR RUN
FED
ER
AL
EM
ER
GEN
CY
MA
NA
GEM
EN
T A
GEN
CY
RIC
HLA
ND
CO
UN
TY
, O
HA
ND
IN
CO
RP
OR
AT
ED
AR
EA
S
FLO
OD
PR
OFI L
ES
EA
ST
BR
AN
CH
BEA
R R
UN
22P
A BC
CO
NFL
UEN
CE W
ITH
BEA
R R
UN
PLY
MO
UT
H-S
PR
ING
MIL
L R
OA
D
LIM
IT O
F D
ET
AIL
ED
ST
UD
Y
PR
IVA
TE R
OA
DLEGEND
0.2% ANNUAL CHANCE FLOOD
1% ANNUAL CHANCE FLOOD
2% ANNUAL CHANCE FLOOD
10% ANNUAL CHANCE FLOOD
STREAM BED
CROSS SECTION LOCATION
OVERFLOW FROM BEAR RUN
THE 2% ANNUAL-CHANCE PROFILE IS TOO CLOSE TO THE 1% ANNUAL-CHANCE PROFILE TO BE SHOWN SEPARATELY
1% ANNUAL-CHANCE
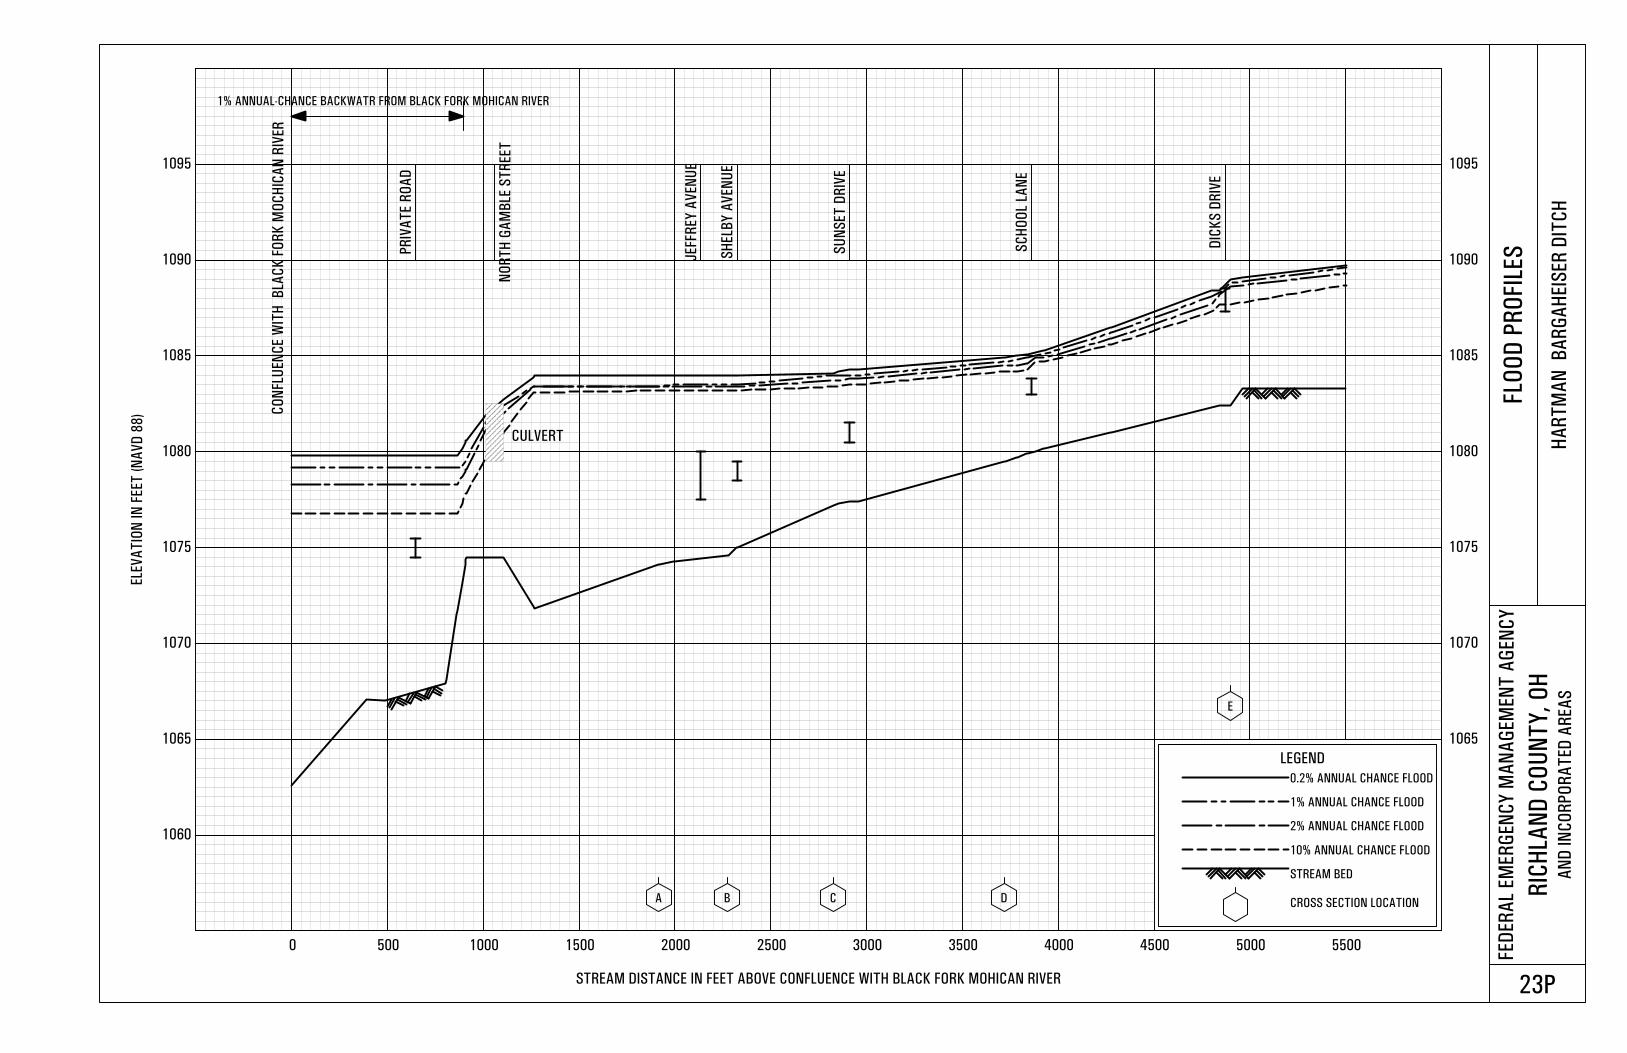
1060
1065 1065
1070 1070
1075 1075
1080 1080
1085 1085
1090 1090
1095 1095
0 500 1000 1500 2000 2500 3000 3500 4000 4500 5000 5500
ELE
VA
TIO
N IN
FEET
(N
AV
D 8
8)
STREAM DISTANCE IN FEET ABOVE CONFLUENCE WITH BLACK FORK MOHICAN RIVER
FED
ER
AL
EM
ER
GEN
CY
MA
NA
GEM
EN
T A
GEN
CY
RIC
HLA
ND
CO
UN
TY
, O
HA
ND
IN
CO
RP
OR
AT
ED
AR
EA
S
FLO
OD
PR
OFI L
ES
HA
RT
MA
N
BA
RG
AH
EIS
ER
DIT
CH
23P
A B C D
E
CO
NFL
UEN
CE W
ITH
B
LAC
K F
OR
K M
OC
HIC
AN
RIV
ER
PR
IVA
TE R
OA
D
NO
RT
H G
AM
BLE
ST
REET
JEFF
REY
AV
EN
UE
SH
ELB
Y A
VEN
UE
SU
NS
ET
DR
IVE
SC
HO
OL
LAN
E
DIC
KS
DR
IVE
LEGEND
0.2% ANNUAL CHANCE FLOOD
1% ANNUAL CHANCE FLOOD
2% ANNUAL CHANCE FLOOD
10% ANNUAL CHANCE FLOOD
STREAM BED
CROSS SECTION LOCATION
1% ANNUAL-CHANCE BACKWATR FROM BLACK FORK MOHICAN RIVER
CULVERT
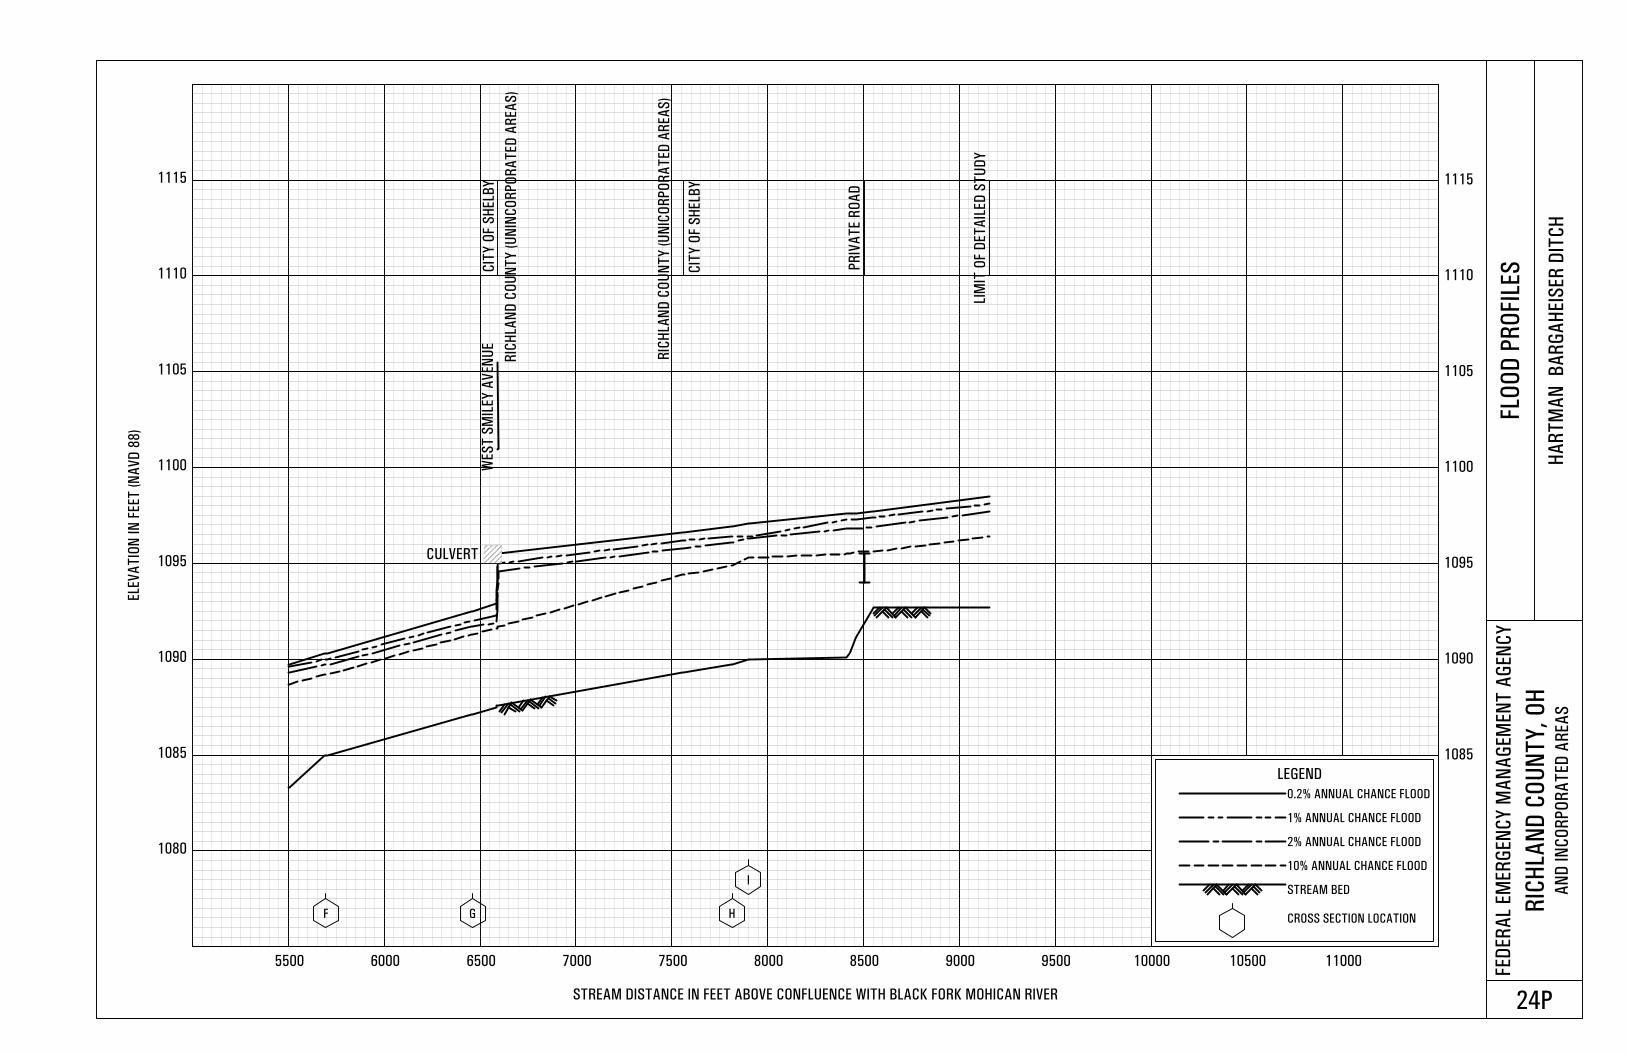
1080
1085 1085
1090 1090
1095 1095
1100 1100
1105 1105
1110 1110
1115 1115
5500 6000 6500 7000 7500 8000 8500 9000 9500 10000 10500 11000
ELE
VA
TIO
N IN
FEET
(N
AV
D 8
8)
STREAM DISTANCE IN FEET ABOVE CONFLUENCE WITH BLACK FORK MOHICAN RIVER
FED
ER
AL
EM
ER
GEN
CY
MA
NA
GEM
EN
T A
GEN
CY
RIC
HLA
ND
CO
UN
TY
, O
HA
ND
IN
CO
RP
OR
AT
ED
AR
EA
S
FLO
OD
PR
OFI L
ES
HA
RT
MA
N
BA
RG
AH
EIS
ER
DIT
CH
24P
F G H
I
RIC
HLA
ND
CO
UN
TY
(U
NIC
OR
PO
RA
TED
AR
EA
S)
LIM
IT O
F D
ET
AIL
ED
ST
UD
Y
RIC
HLA
ND
CO
UN
TY
(U
NIN
CO
RP
OR
AT
ED
AR
EA
S)
PR
IVA
TE R
OA
D
LEGEND
0.2% ANNUAL CHANCE FLOOD
1% ANNUAL CHANCE FLOOD
2% ANNUAL CHANCE FLOOD
10% ANNUAL CHANCE FLOOD
STREAM BED
CROSS SECTION LOCATION
CIT
Y O
F S
HELB
Y
WES
T S
MIL
EY
AV
EN
UE
CIT
Y O
F S
HELB
Y
CULVERT
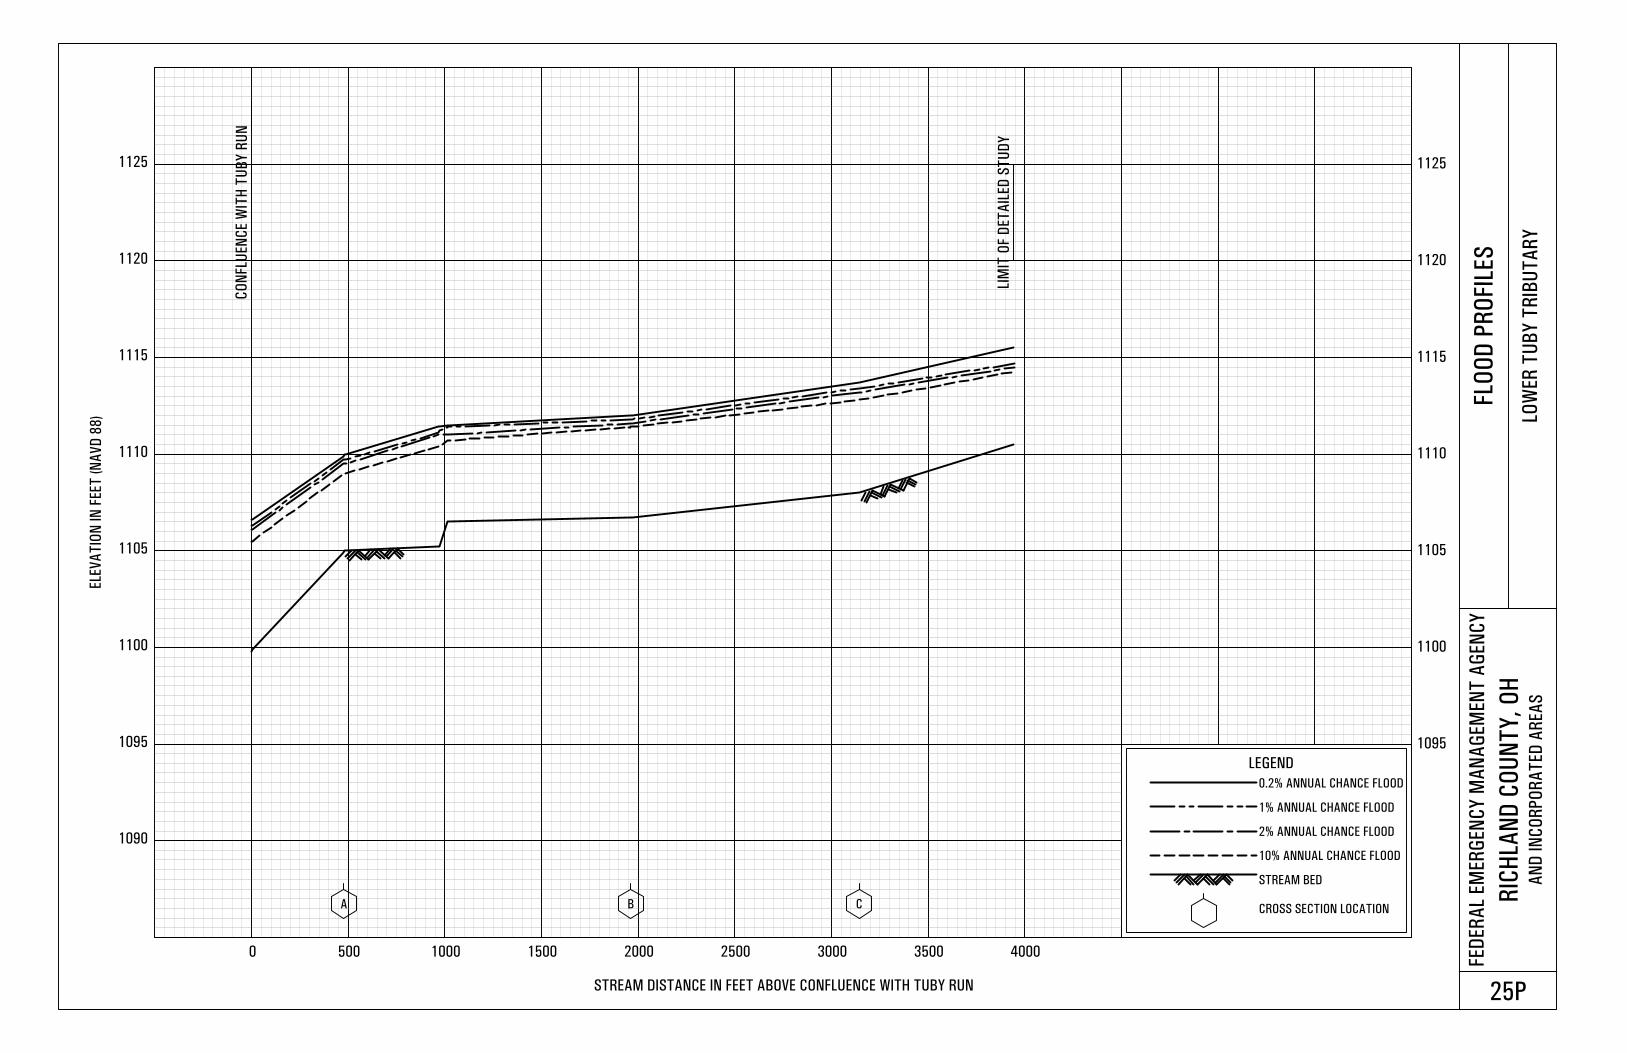
1090
1095 1095
1100 1100
1105 1105
1110 1110
1115 1115
1120 1120
1125 1125
0 500 1000 1500 2000 2500 3000 3500 4000
ELE
VA
TIO
N IN
FEET
(N
AV
D 8
8)
STREAM DISTANCE IN FEET ABOVE CONFLUENCE WITH TUBY RUN
FED
ER
AL
EM
ER
GEN
CY
MA
NA
GEM
EN
T A
GEN
CY
RIC
HLA
ND
CO
UN
TY
, O
HA
ND
IN
CO
RP
OR
AT
ED
AR
EA
S
FLO
OD
PR
OFI
LES
LOW
ER
TU
BY
TR
IBU
TA
RY
25P
A B C
CO
NFL
UEN
CE W
ITH
TU
BY
RU
N
LIM
IT O
F D
ET
AIL
ED
ST
UD
Y
LEGEND
0.2% ANNUAL CHANCE FLOOD
1% ANNUAL CHANCE FLOOD
2% ANNUAL CHANCE FLOOD
10% ANNUAL CHANCE FLOOD
STREAM BED
CROSS SECTION LOCATION
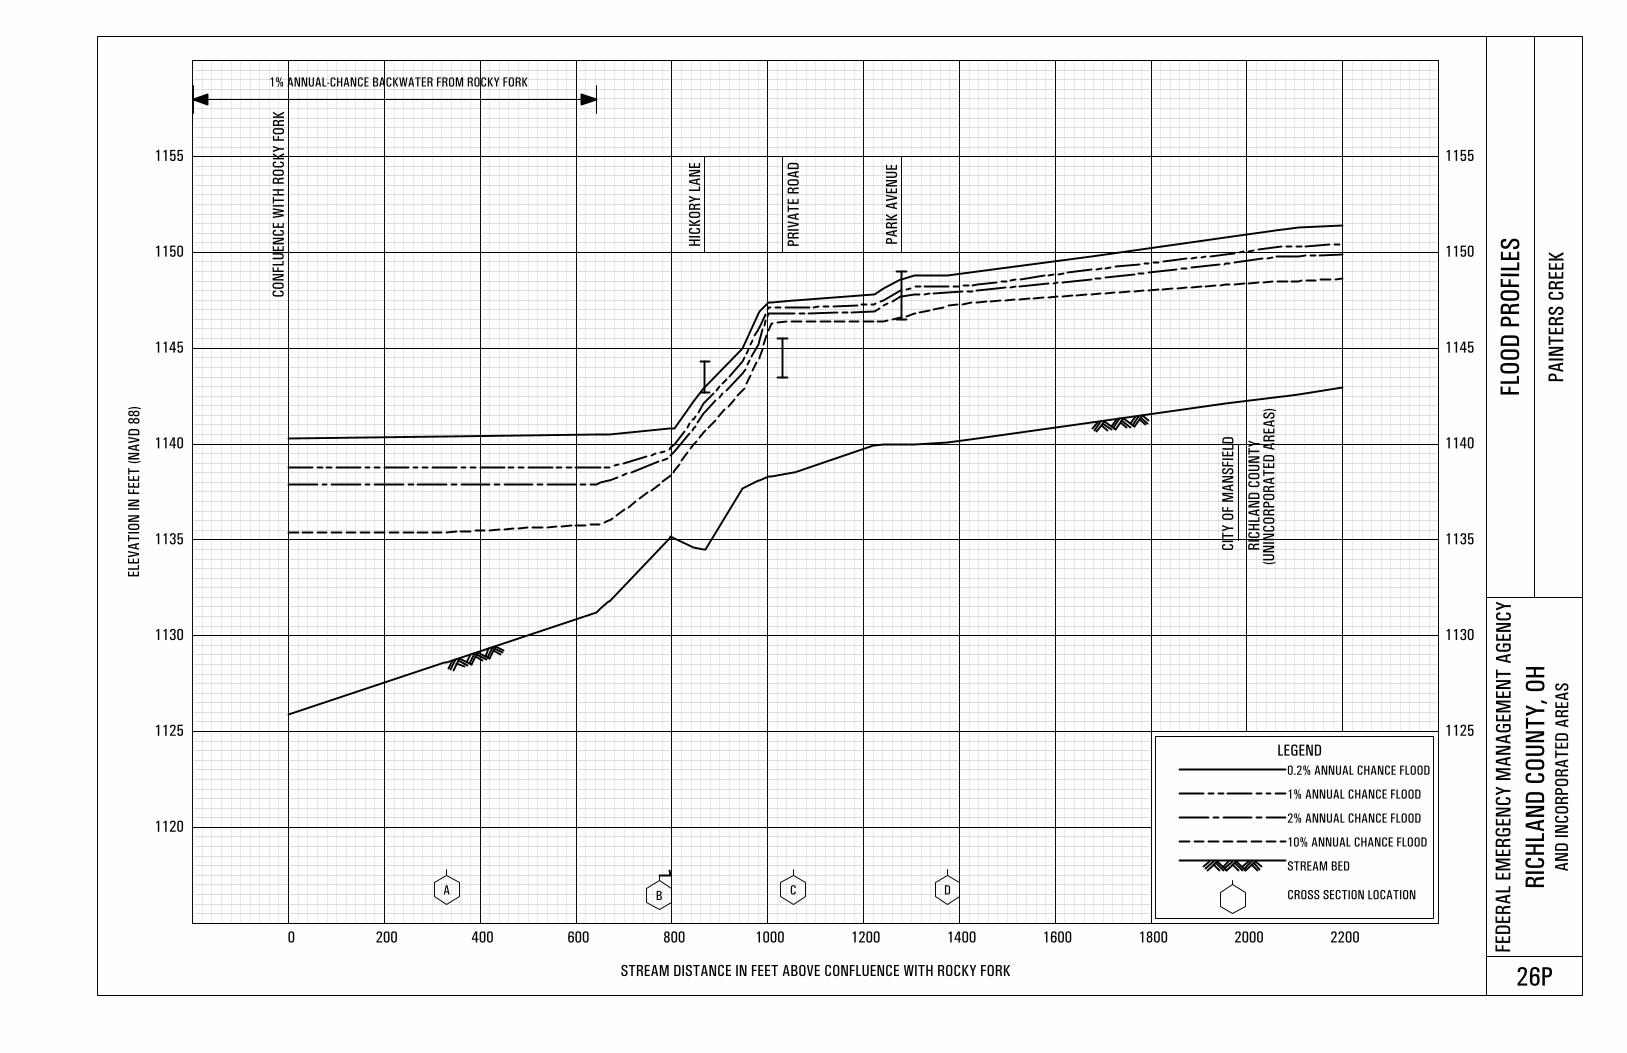
1120
1125 1125
1130 1130
1135 1135
1140 1140
1145 1145
1150 1150
1155 1155
0 200 400 600 800 1000 1200 1400 1600 1800 2000 2200
ELE
VA
TIO
N IN
FEET
(N
AV
D 8
8)
STREAM DISTANCE IN FEET ABOVE CONFLUENCE WITH ROCKY FORK
FED
ER
AL
EM
ER
GEN
CY
MA
NA
GEM
EN
T A
GEN
CY
RIC
HLA
ND
CO
UN
TY
, O
HA
ND
IN
CO
RP
OR
AT
ED
AR
EA
S
FLO
OD
PR
OFI L
ES
PA
INT
ER
S C
REEK
26P
AB
C D
CO
NFLU
EN
CE W
ITH
RO
CK
Y F
OR
K
HIC
KO
RY
LA
NE
PR
IVA
TE R
OA
D
PA
RK
AV
EN
UE
LEGEND
0.2% ANNUAL CHANCE FLOOD
1% ANNUAL CHANCE FLOOD
2% ANNUAL CHANCE FLOOD
10% ANNUAL CHANCE FLOOD
STREAM BED
CROSS SECTION LOCATION
1% ANNUAL-CHANCE BACKWATER FROM ROCKY FORK
CI T
Y O
F M
AN
SFIE
LD
RI C
HLA
ND
CO
UN
TY
(U
NIN
CO
RP
OR
AT
ED
AR
EA
S)
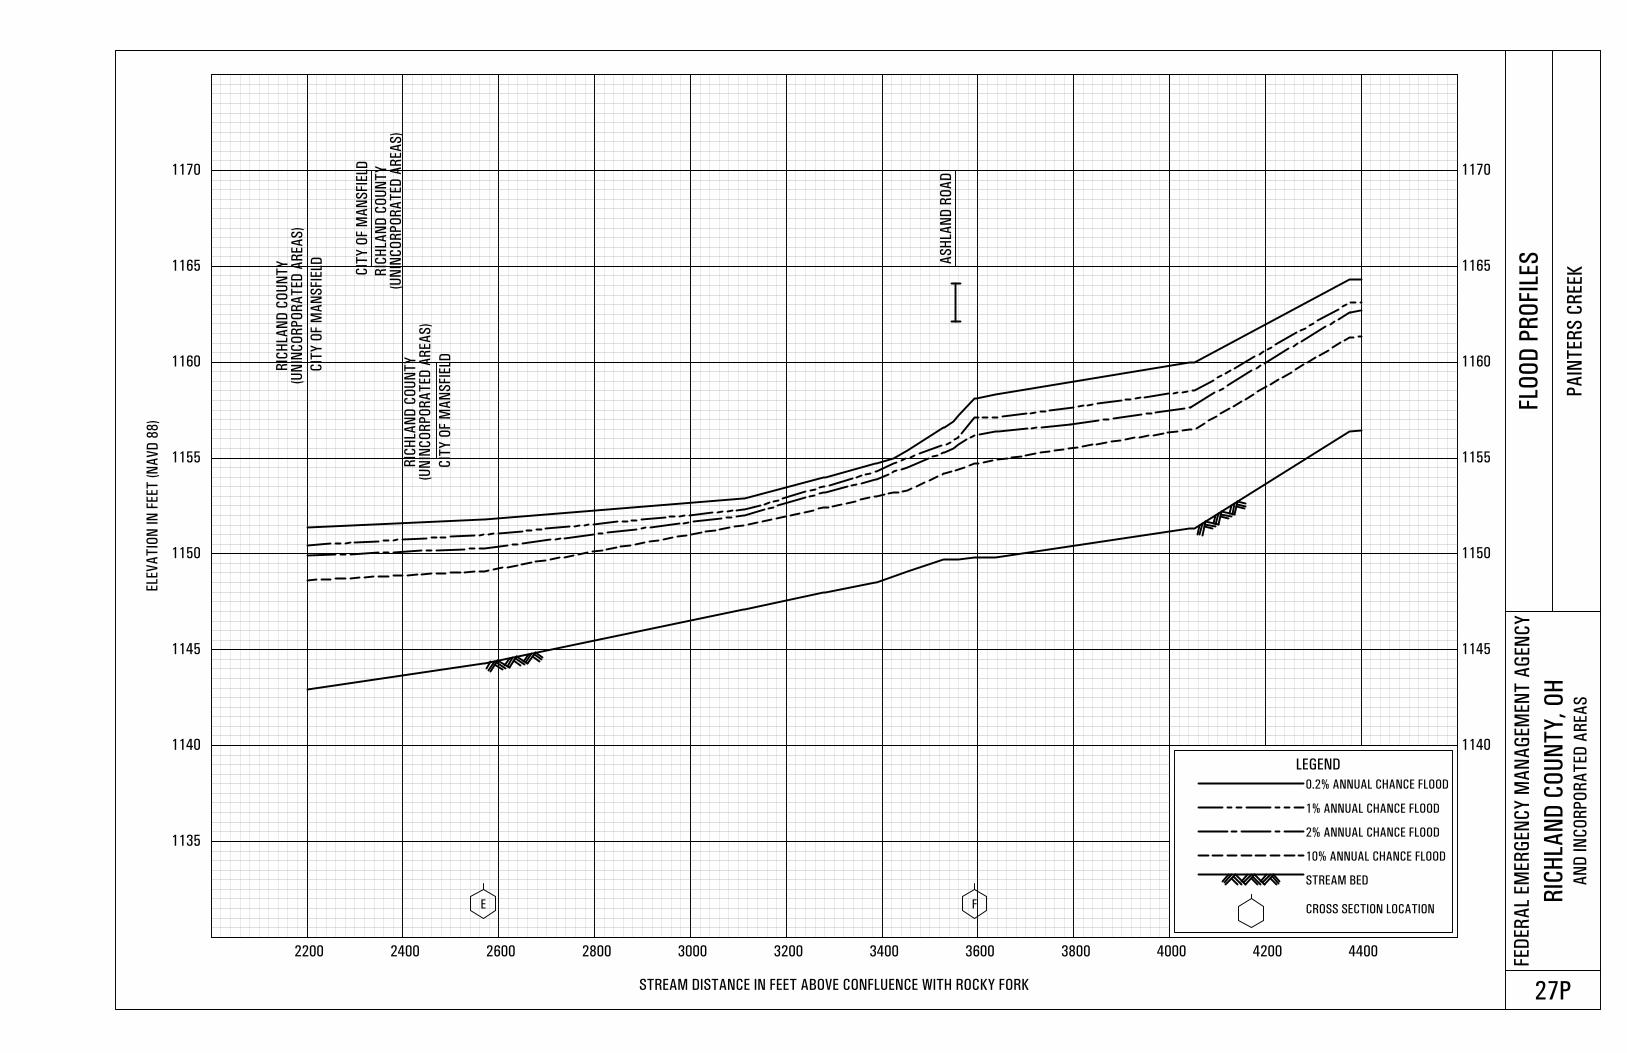
1135
1140 1140
1145 1145
1150 1150
1155 1155
1160 1160
1165 1165
1170 1170
2200 2400 2600 2800 3000 3200 3400 3600 3800 4000 4200 4400
ELE
VA
TIO
N IN
FEET
(N
AV
D 8
8)
STREAM DISTANCE IN FEET ABOVE CONFLUENCE WITH ROCKY FORK
FED
ER
AL
EM
ER
GEN
CY
MA
NA
GEM
EN
T A
GEN
CY
RIC
HLA
ND
CO
UN
TY
, O
HA
ND
IN
CO
RP
OR
AT
ED
AR
EA
S
FLO
OD
PR
OFI L
ES
PA
INT
ER
S C
REEK
27P
E F
AS
HLA
ND
RO
AD
LEGEND
0.2% ANNUAL CHANCE FLOOD
1% ANNUAL CHANCE FLOOD
2% ANNUAL CHANCE FLOOD
10% ANNUAL CHANCE FLOOD
STREAM BED
CROSS SECTION LOCATION
CI T
Y O
F M
AN
SFIE
LD
RI C
HLA
ND
CO
UN
TY
(U
NIN
CO
RP
OR
AT
ED
AR
EA
S)
RI C
HLA
ND
CO
UN
TY
(U
NIN
CO
RP
OR
AT
ED
AR
EA
S)
CI T
Y O
F M
AN
SFIE
LD
(UN
INC
OR
PO
RA
TED
AR
EA
S)
RI C
HLA
ND
CO
UN
TY
CI T
Y O
F M
AN
SFIE
LD
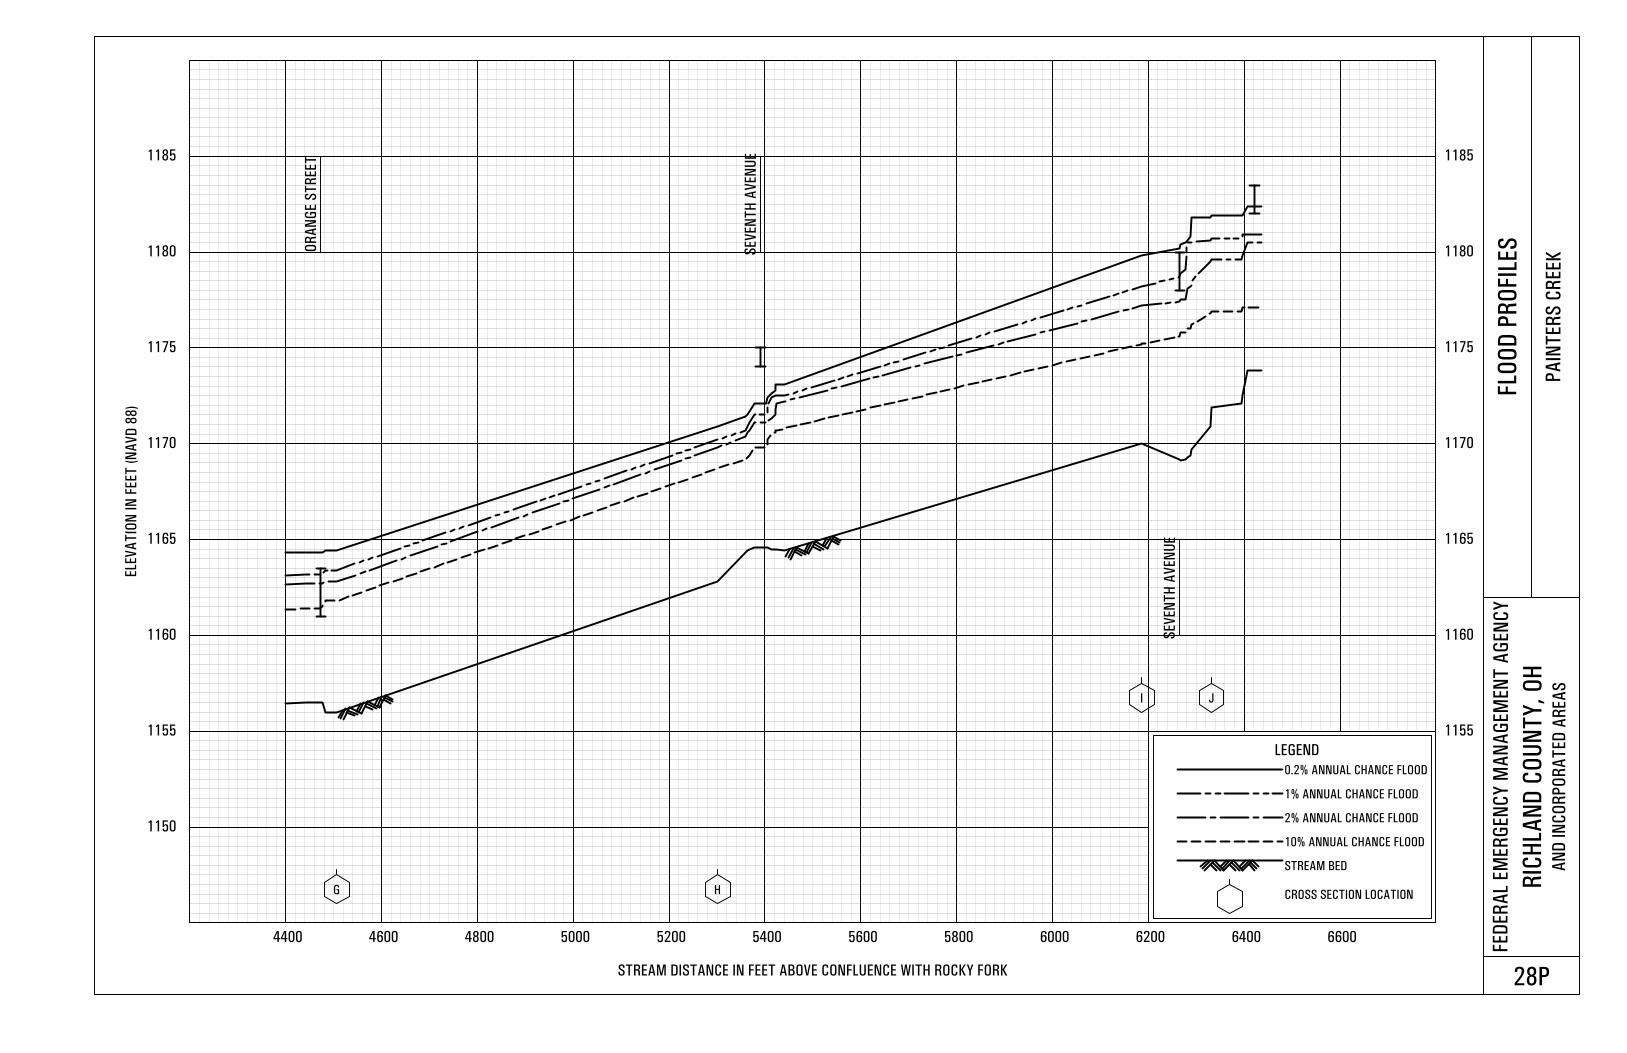
1150
1155 1155
1160 1160
1165 1165
1170 1170
1175 1175
1180 1180
1185 1185
4400 4600 4800 5000 5200 5400 5600 5800 6000 6200 6400 6600
ELE
VA
TIO
N IN
FEET
(N
AV
D 8
8)
STREAM DISTANCE IN FEET ABOVE CONFLUENCE WITH ROCKY FORK
FED
ER
AL
EM
ER
GEN
CY
MA
NA
GEM
EN
T A
GEN
CY
RIC
HLA
ND
CO
UN
TY
, O
HA
ND
IN
CO
RP
OR
AT
ED
AR
EA
S
FLO
OD
PR
OFI L
ES
PA
INT
ER
S C
REEK
28P
G H
I J
OR
AN
GE S
TR
EET
SEV
EN
TH
AV
EN
UE
SEV
EN
TH
AV
EN
UE
LEGEND
0.2% ANNUAL CHANCE FLOOD
1% ANNUAL CHANCE FLOOD
2% ANNUAL CHANCE FLOOD
10% ANNUAL CHANCE FLOOD
STREAM BED
CROSS SECTION LOCATION
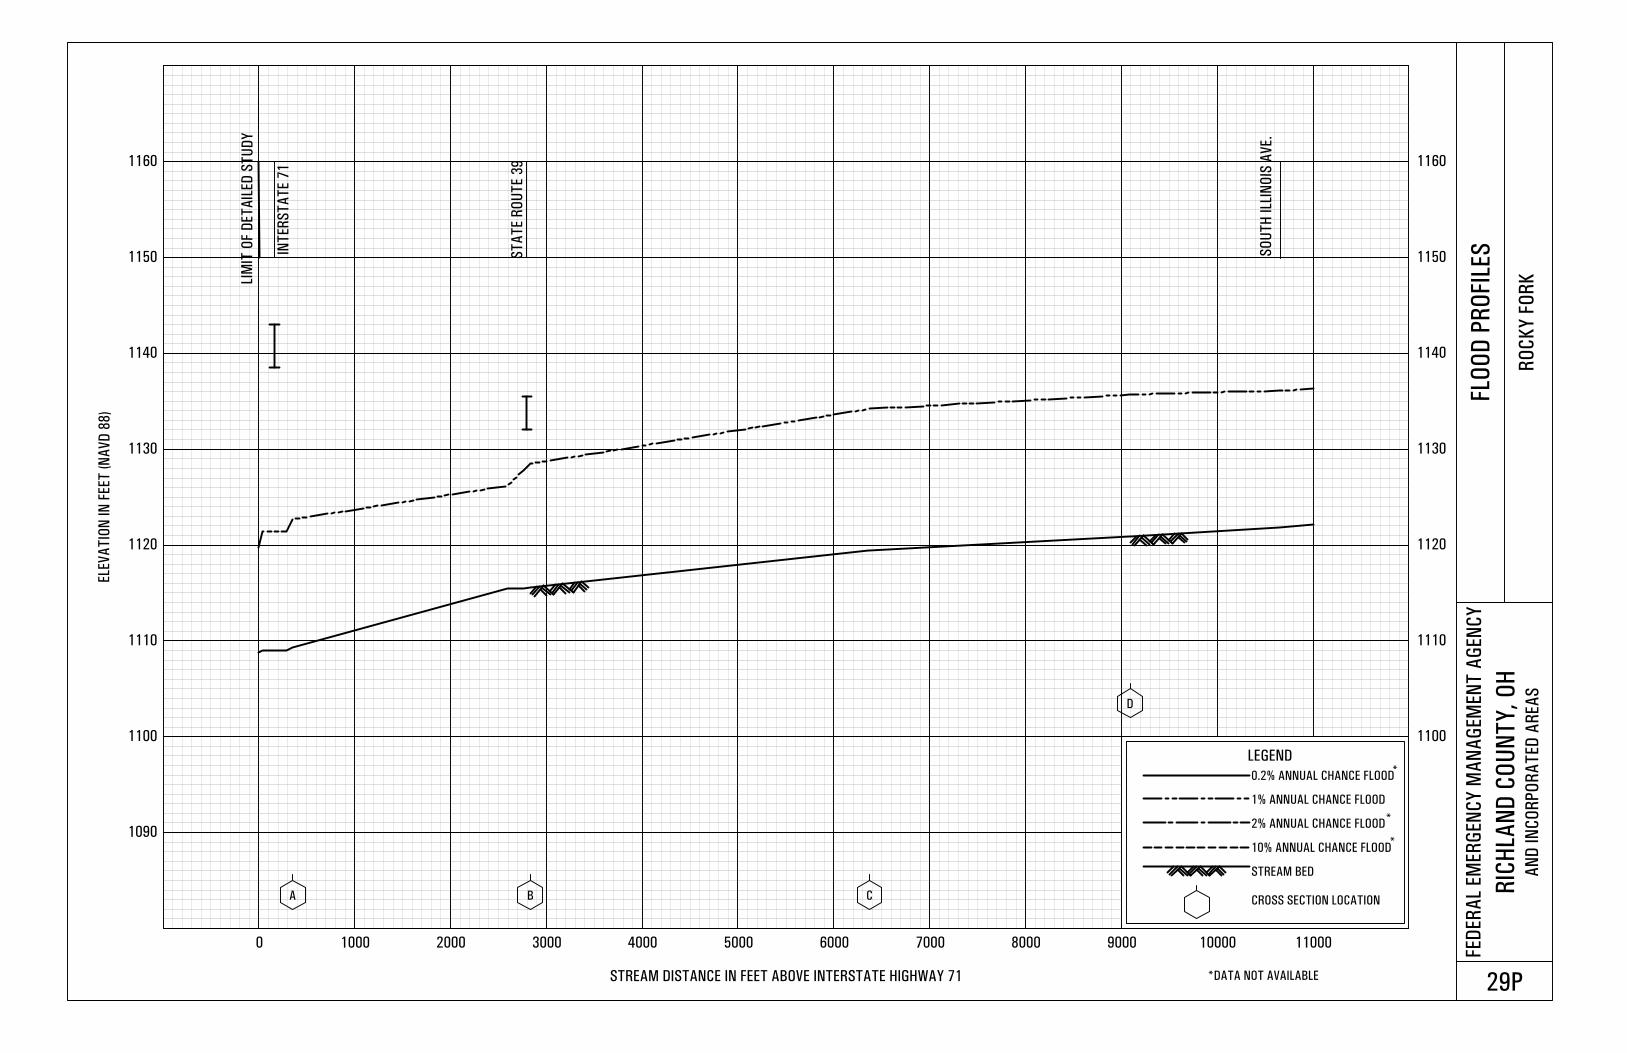
1090
1100 1100
1110 1110
1120 1120
1130 1130
1140 1140
1150 1150
1160 1160
0 1000 2000 3000 4000 5000 6000 7000 8000 9000 10000 11000
ELE
VA
TIO
N IN
FEET
(N
AV
D 8
8)
STREAM DISTANCE IN FEET ABOVE INTERSTATE HIGHWAY 71
FED
ER
AL
EM
ER
GEN
CY
MA
NA
GEM
EN
T A
GEN
CY
RIC
HLA
ND
CO
UN
TY
, O
HA
ND
IN
CO
RP
OR
AT
ED
AR
EA
S
FLO
OD
PR
OFI L
ES
RO
CK
Y F
OR
K
29P
A B C
D
LIM
IT O
F D
ET
AIL
ED
ST
UD
Y
INT
ER
ST
AT
E 7
1
ST
AT
E R
OU
TE 3
9
LEGEND
0.2% ANNUAL CHANCE FLOOD
1% ANNUAL CHANCE FLOOD
2% ANNUAL CHANCE FLOOD
10% ANNUAL CHANCE FLOOD
STREAM BED
CROSS SECTION LOCATION
*
*
*
*DATA NOT AVAILABLE
SO
UT
H ILL
INO
IS A
VE.
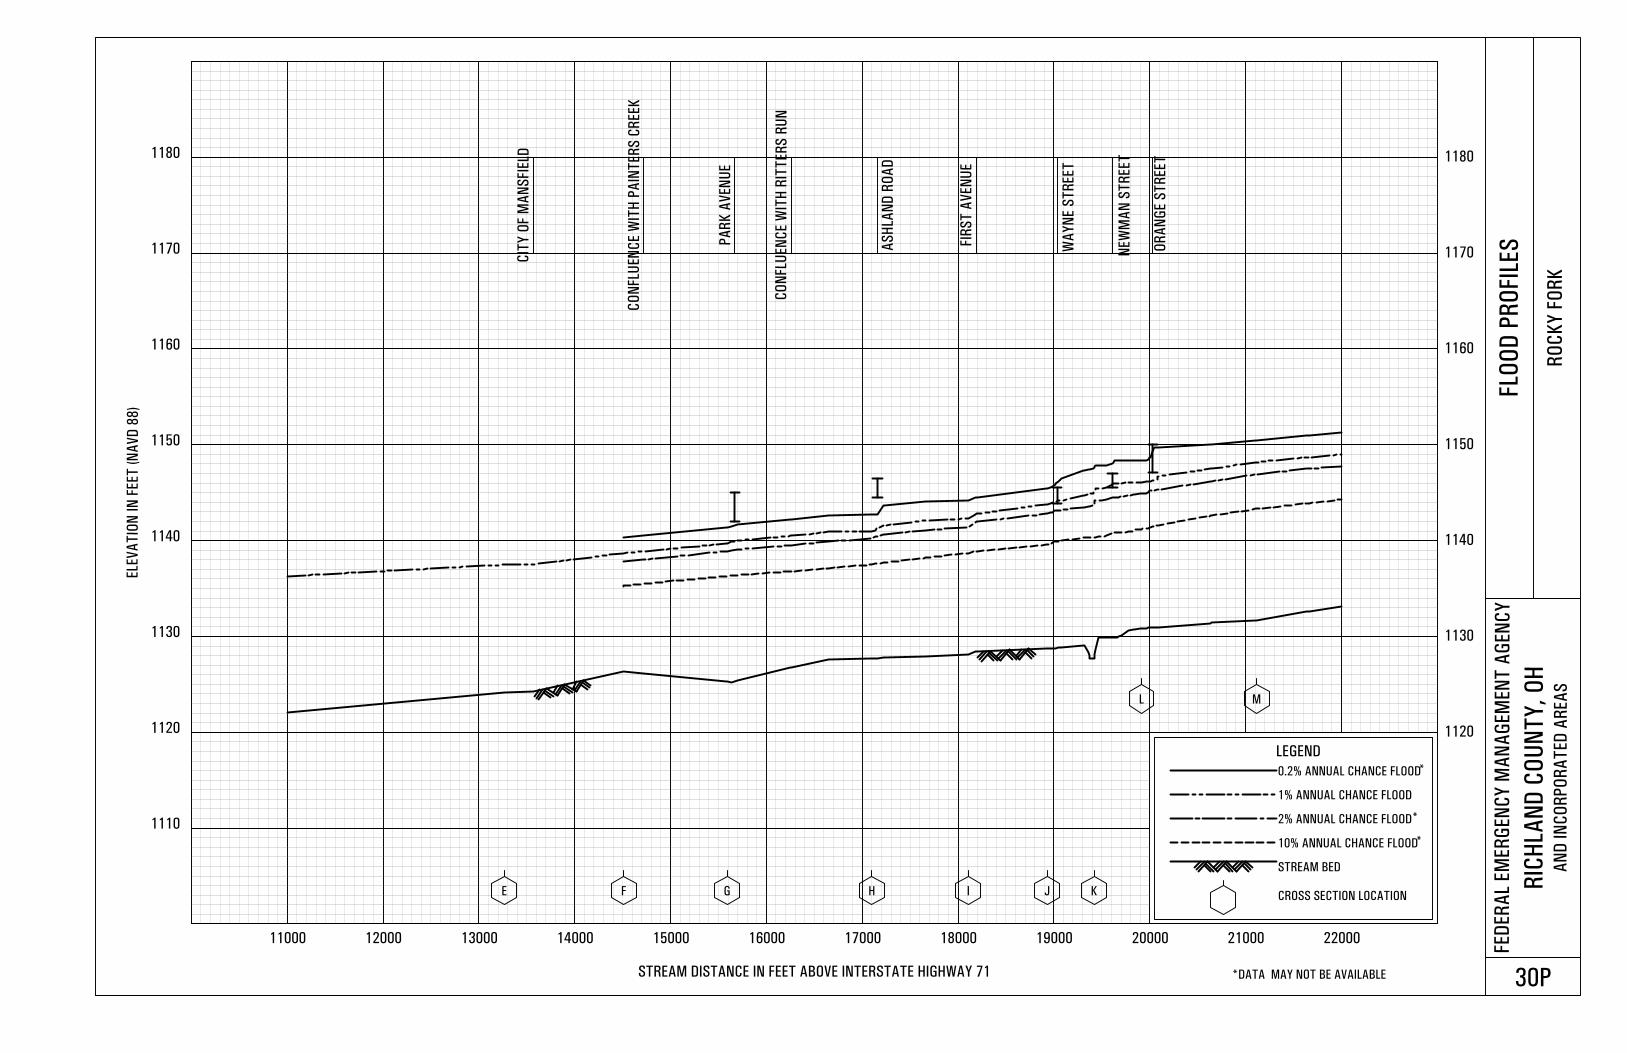
1110
1120 1120
1130 1130
1140 1140
1150 1150
1160 1160
1170 1170
1180 1180
11000 12000 13000 14000 15000 16000 17000 18000 19000 20000 21000 22000
ELE
VA
TIO
N IN
FEET
(N
AV
D 8
8)
STREAM DISTANCE IN FEET ABOVE INTERSTATE HIGHWAY 71
FED
ER
AL
EM
ER
GEN
CY
MA
NA
GEM
EN
T A
GEN
CY
RIC
HLA
ND
CO
UN
TY
, O
HA
ND
IN
CO
RP
OR
AT
ED
AR
EA
S
FLO
OD
PR
OFI L
ES
RO
CK
Y F
OR
K
30P
E F G H I J K
L M
CI T
Y O
F M
AN
SFIE
LD
CO
NFLU
EN
CE W
ITH
PA
INT
ER
S C
REEK
CO
NFLU
EN
CE W
ITH
RIT
TER
S R
UN
PA
RK
AV
EN
UE
AS
HLA
ND
RO
AD
FIR
ST
AV
EN
UE
WA
YN
E S
TR
EET
NEW
MA
N S
TR
EET
OR
AN
GE S
TR
EET
LEGEND
0.2% ANNUAL CHANCE FLOOD
1% ANNUAL CHANCE FLOOD
2% ANNUAL CHANCE FLOOD
10% ANNUAL CHANCE FLOOD
STREAM BED
CROSS SECTION LOCATION
*
*
*
*DATA MAY NOT BE AVAILABLE
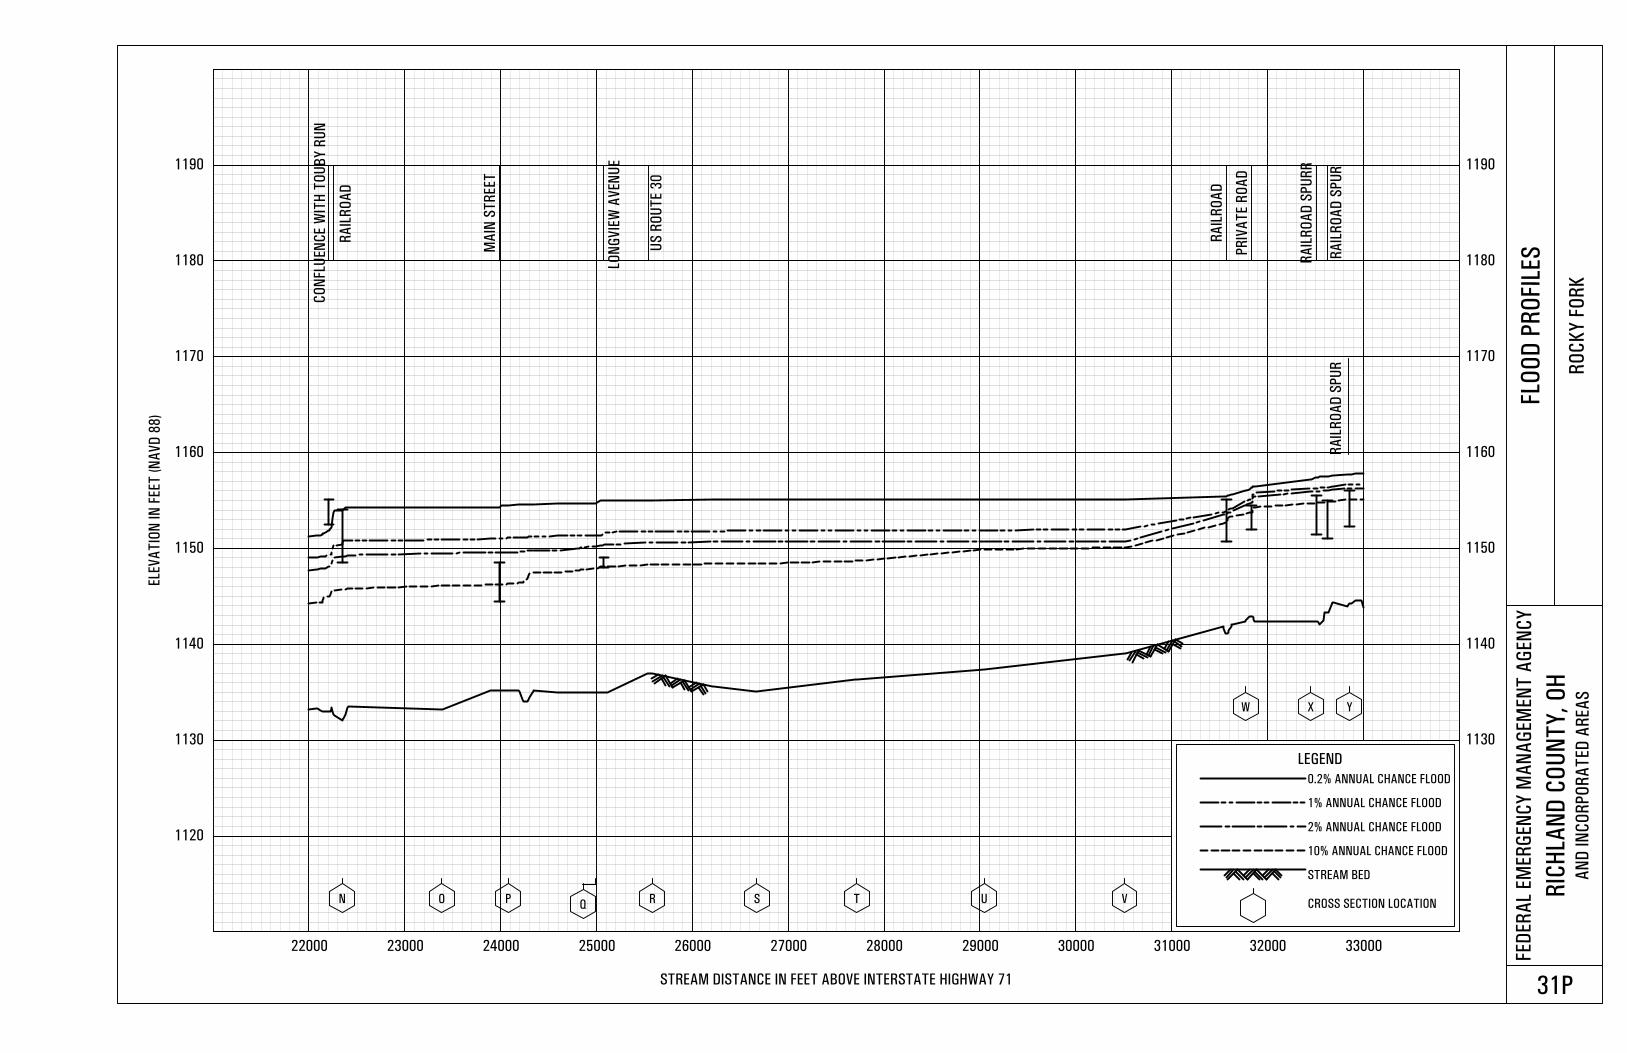
1120
1130 1130
1140 1140
1150 1150
1160 1160
1170 1170
1180 1180
1190 1190
22000 23000 24000 25000 26000 27000 28000 29000 30000 31000 32000 33000
ELE
VA
TIO
N IN
FEET
(N
AV
D 8
8)
STREAM DISTANCE IN FEET ABOVE INTERSTATE HIGHWAY 71
FED
ER
AL
EM
ER
GEN
CY
MA
NA
GEM
EN
T A
GEN
CY
RIC
HLA
ND
CO
UN
TY
, O
HA
ND
IN
CO
RP
OR
AT
ED
AR
EA
S
FLO
OD
PR
OFI L
ES
RO
CK
Y F
OR
K
31P
N O PQ
R S T U V
W X Y
CO
NFL
UEN
CE W
ITH
TO
UB
Y R
UN
US
RO
UT
E 3
0
RA
ILR
OA
D
MA
IN S
TR
EET
L ON
GV
IEW
AV
EN
UE
RA
ILR
OA
D
PR
IVA
TE R
OA
D
RA
ILR
OA
D S
PU
RR
RA
ILR
OA
D S
PU
RR
AIL
RO
AD
SP
UR
LEGEND
0.2% ANNUAL CHANCE FLOOD
1% ANNUAL CHANCE FLOOD
2% ANNUAL CHANCE FLOOD
10% ANNUAL CHANCE FLOOD
STREAM BED
CROSS SECTION LOCATION
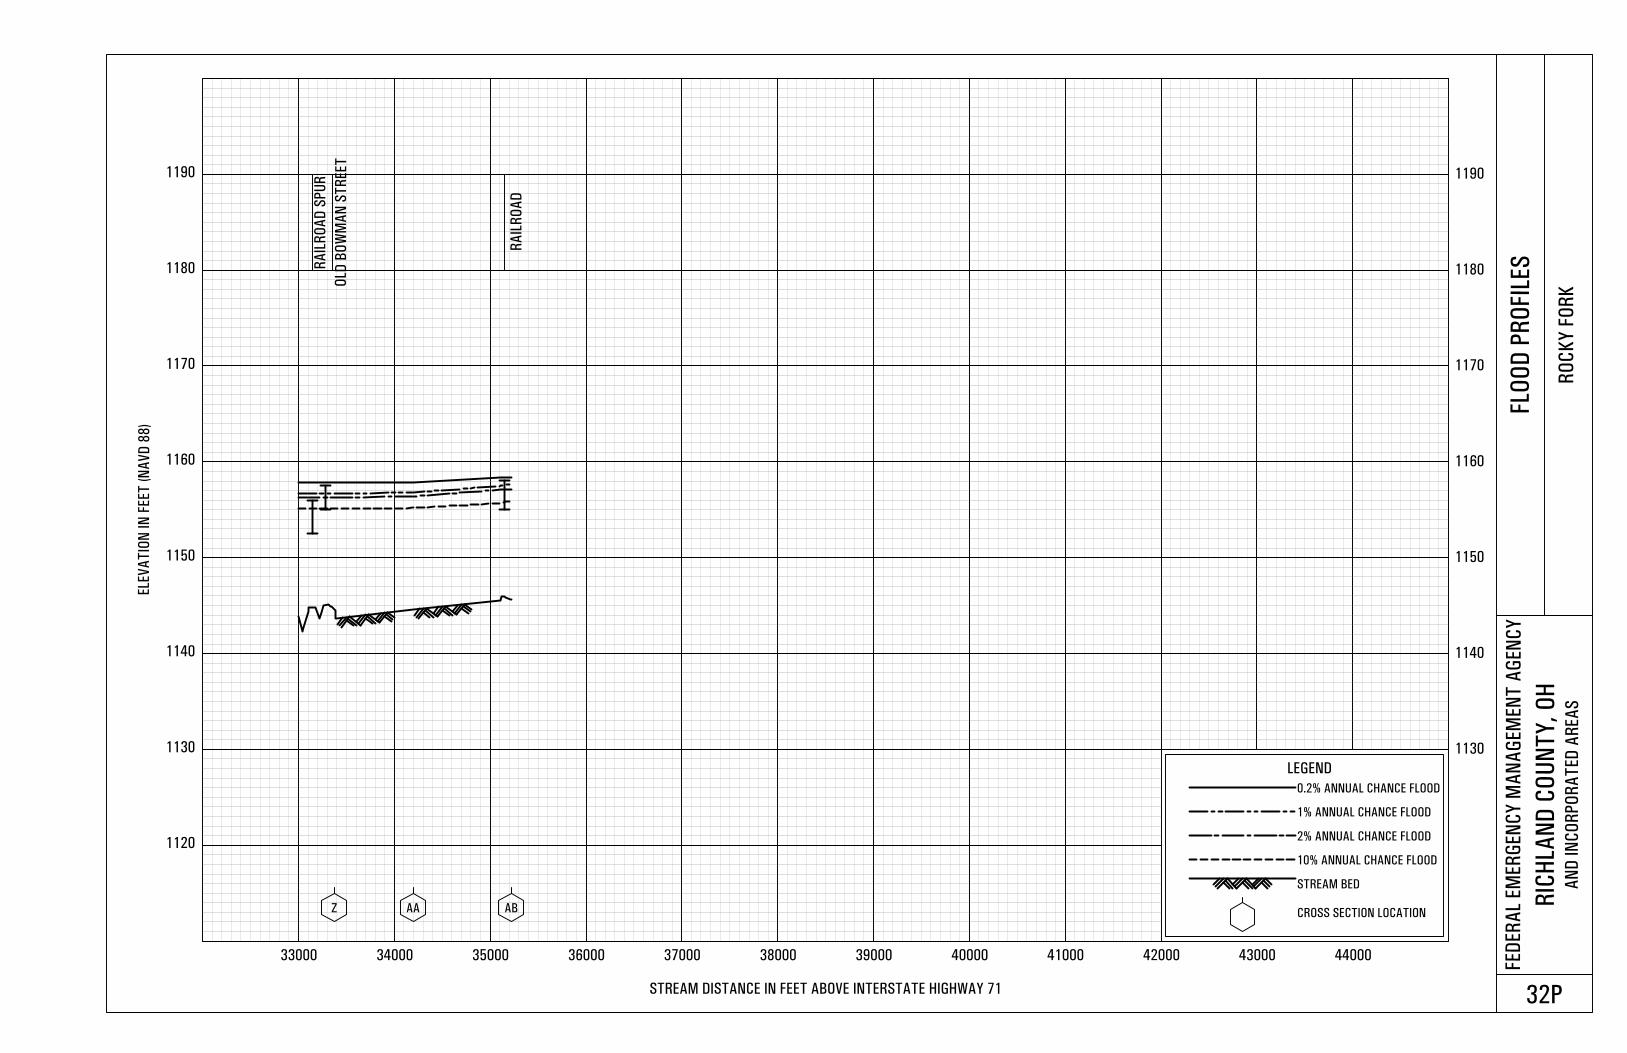
1120
1130 1130
1140 1140
1150 1150
1160 1160
1170 1170
1180 1180
1190 1190
33000 34000 35000 36000 37000 38000 39000 40000 41000 42000 43000 44000
ELE
VA
TIO
N IN
FEET
(N
AV
D 8
8)
STREAM DISTANCE IN FEET ABOVE INTERSTATE HIGHWAY 71
FED
ER
AL
EM
ER
GEN
CY
MA
NA
GEM
EN
T A
GEN
CY
RIC
HLA
ND
CO
UN
TY
, O
HA
ND
IN
CO
RP
OR
AT
ED
AR
EA
S
FLO
OD
PR
OFI L
ES
RO
CK
Y F
OR
K
32P
Z AA AB
OL D
BO
WM
AN
ST
REET
RA
ILR
OA
D
RA
ILR
OA
D S
PU
R
LEGEND
0.2% ANNUAL CHANCE FLOOD
1% ANNUAL CHANCE FLOOD
2% ANNUAL CHANCE FLOOD
10% ANNUAL CHANCE FLOOD
STREAM BED
CROSS SECTION LOCATION
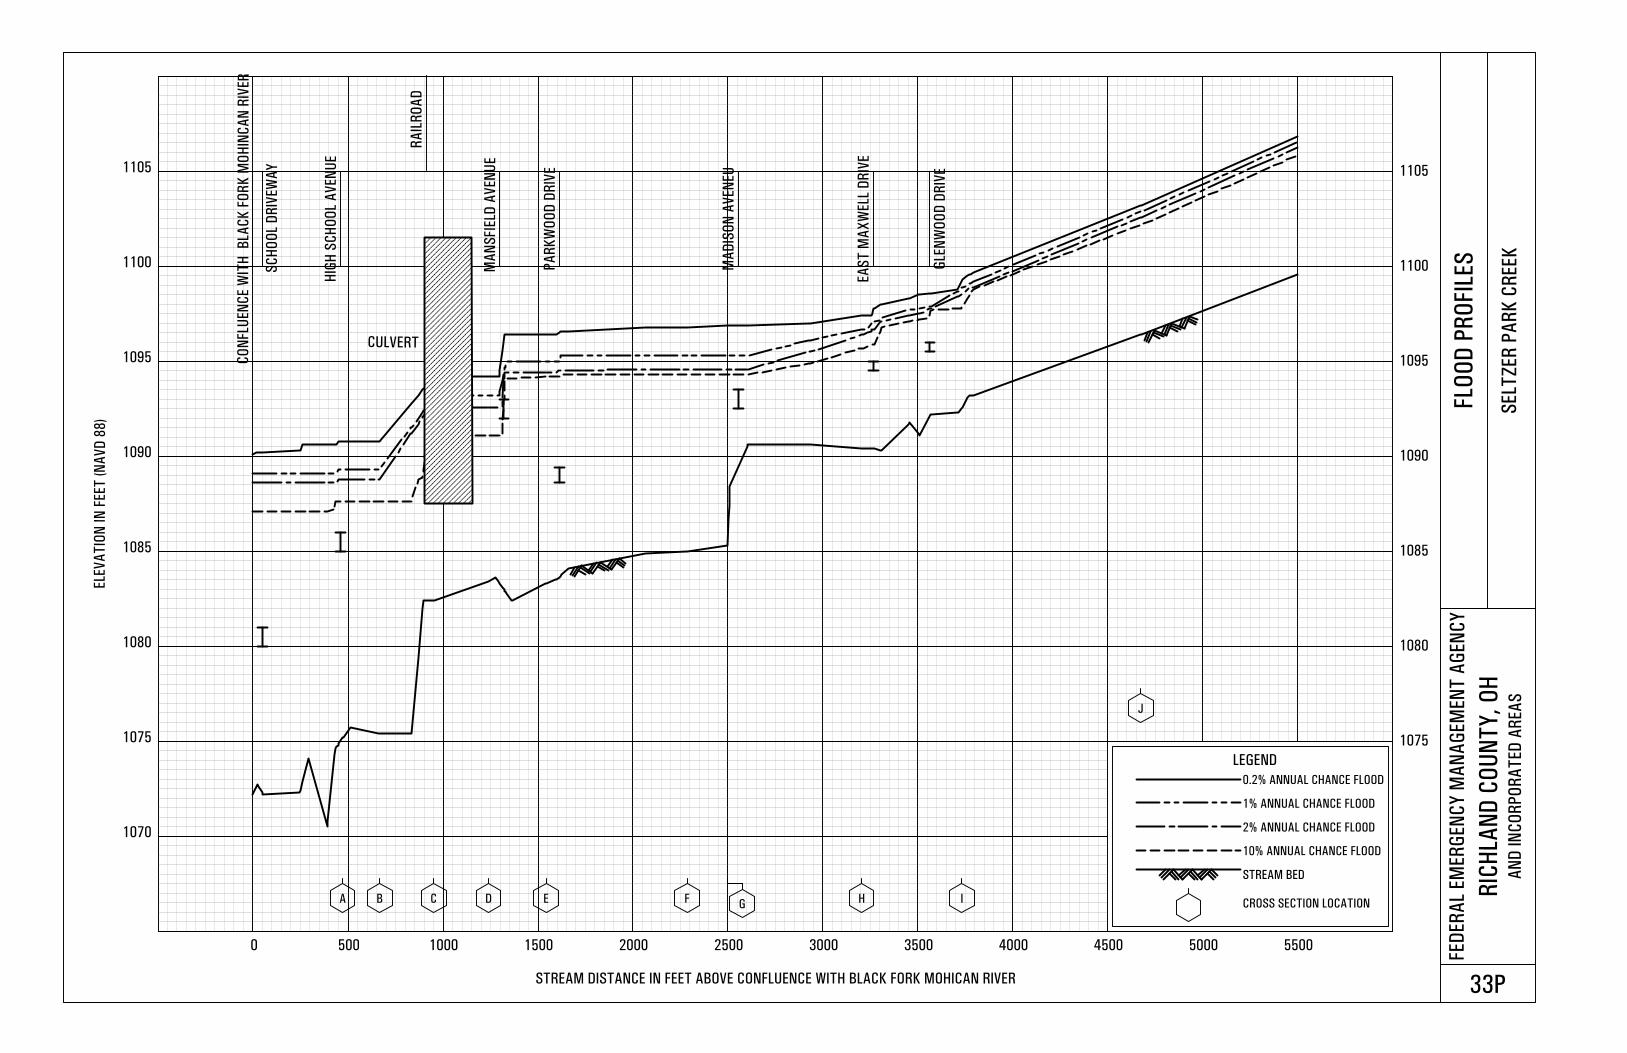
1070
1075 1075
1080 1080
1085 1085
1090 1090
1095 1095
1100 1100
1105 1105
0 500 1000 1500 2000 2500 3000 3500 4000 4500 5000 5500
ELE
VA
TIO
N I
N F
EET
(N
AV
D 8
8)
STREAM DISTANCE IN FEET ABOVE CONFLUENCE WITH BLACK FORK MOHICAN RIVER
FED
ER
AL
EM
ER
GEN
CY
MA
NA
GEM
EN
T A
GEN
CY
RIC
HLA
ND
CO
UN
TY
, O
HA
ND
IN
CO
RP
OR
AT
ED
AR
EA
S
FLO
OD
PR
OFI L
ES
SELT
ZER
PA
RK
CR
EEK
33P
A B C D E FG
H I
J
CO
NFLU
EN
CE W
ITH
B
LAC
K F
OR
K M
OH
INC
AN
RIV
ER
MA
NS
FIE
LD A
VEN
UE
SC
HO
OL
DR
IVEW
AY
HIG
H S
CH
OO
L A
VEN
UE
RA
ILR
OA
D
PA
RK
WO
OD
DR
IVE
MA
DIS
ON
AV
EN
EU
EA
ST
MA
XW
ELL
DR
IVE
GLE
NW
OO
D D
RIV
E
LEGEND
0.2% ANNUAL CHANCE FLOOD
1% ANNUAL CHANCE FLOOD
2% ANNUAL CHANCE FLOOD
10% ANNUAL CHANCE FLOOD
STREAM BED
CROSS SECTION LOCATION
CULVERT
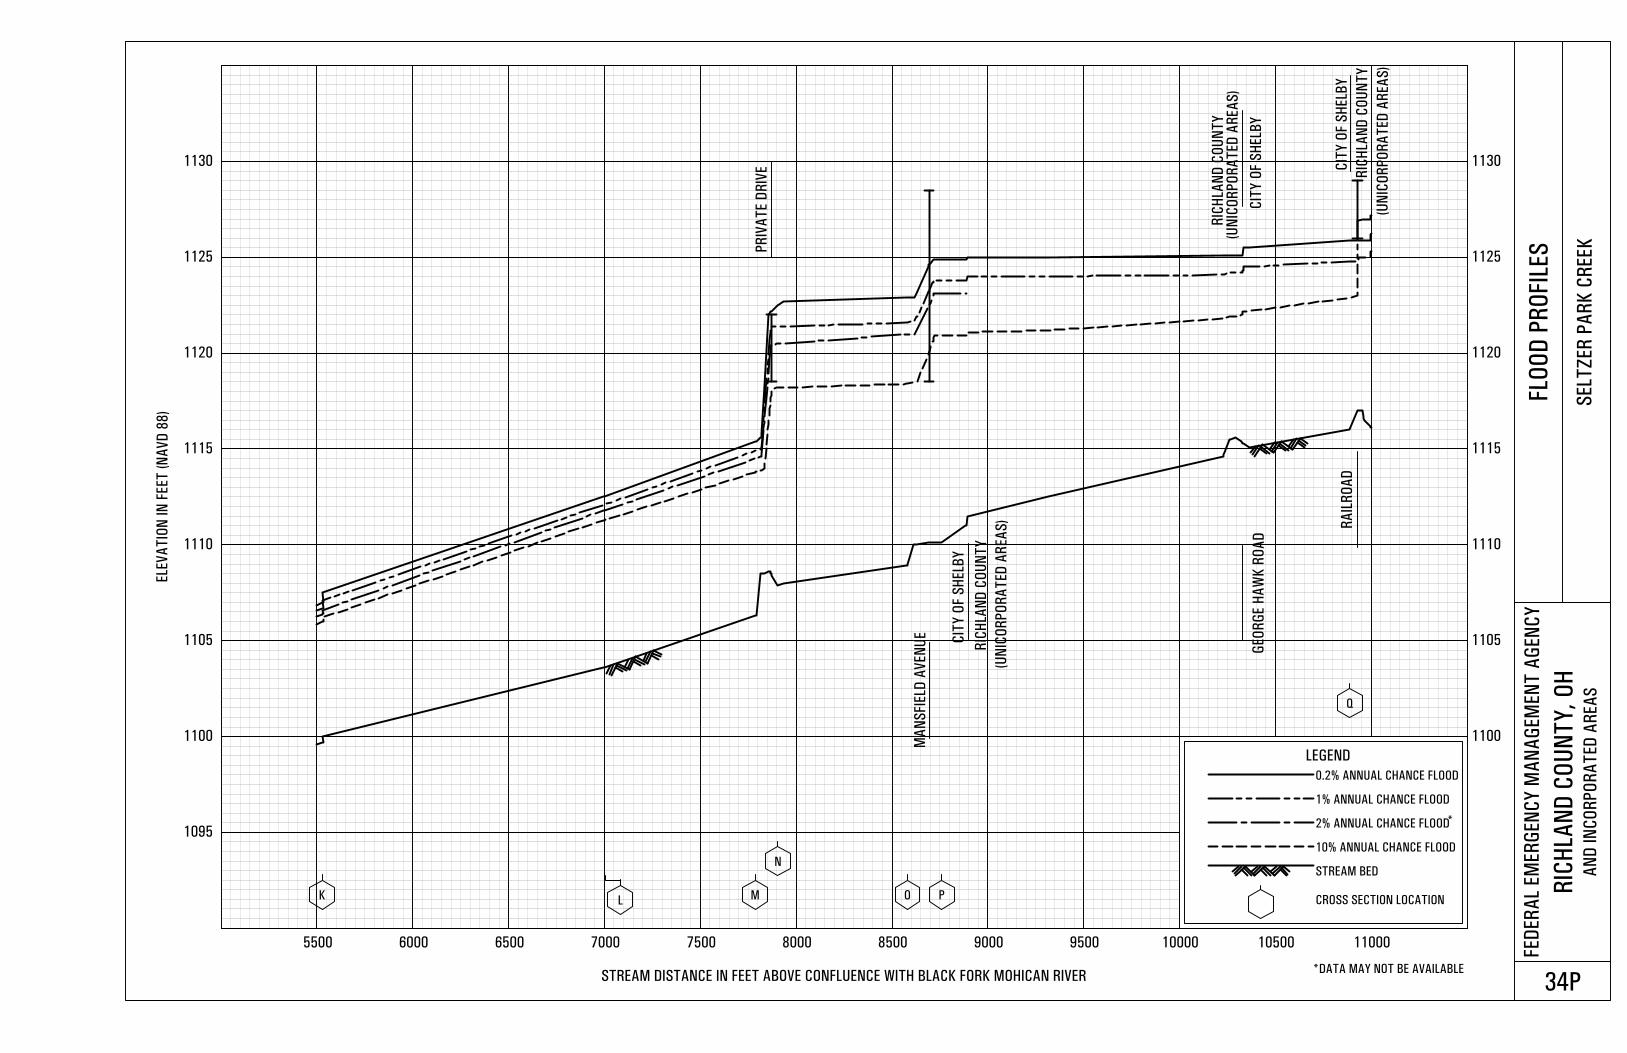
1095
1100 1100
1105 1105
1110 1110
1115 1115
1120 1120
1125 1125
1130 1130
5500 6000 6500 7000 7500 8000 8500 9000 9500 10000 10500 11000
ELE
VA
TIO
N IN
FEET
(N
AV
D 8
8)
STREAM DISTANCE IN FEET ABOVE CONFLUENCE WITH BLACK FORK MOHICAN RIVER
FED
ER
AL
EM
ER
GEN
CY
MA
NA
GEM
EN
T A
GEN
CY
RIC
HLA
ND
CO
UN
TY
, O
HA
ND
IN
CO
RP
OR
AT
ED
AR
EA
S
FLO
OD
PR
OFI L
ES
SELT
ZER
PA
RK
CR
EEK
34P
K L M
N
O P
Q
CIT
Y O
F S
HELB
Y
(UN
ICO
RP
OR
AT
ED
AR
EA
S)
PR
IVA
TE D
RIV
E
MA
NS
FIE
LD A
VEN
UE
LEGEND
0.2% ANNUAL CHANCE FLOOD
1% ANNUAL CHANCE FLOOD
2% ANNUAL CHANCE FLOOD
10% ANNUAL CHANCE FLOOD
STREAM BED
CROSS SECTION LOCATION
RI C
HLA
ND
CO
UN
TY
(UN
ICO
RP
OR
AT
ED
AR
EA
S)
CIT
Y O
F S
HELB
Y
RI C
HLA
ND
CO
UN
TY
RA
ILR
OA
D
GEO
RG
E H
AW
K R
OA
D
CIT
Y O
F S
HELB
Y
RI C
HLA
ND
CO
UN
TY
(UN
ICO
RP
OR
AT
ED
AR
EA
S)
*
*DATA MAY NOT BE AVAILABLE
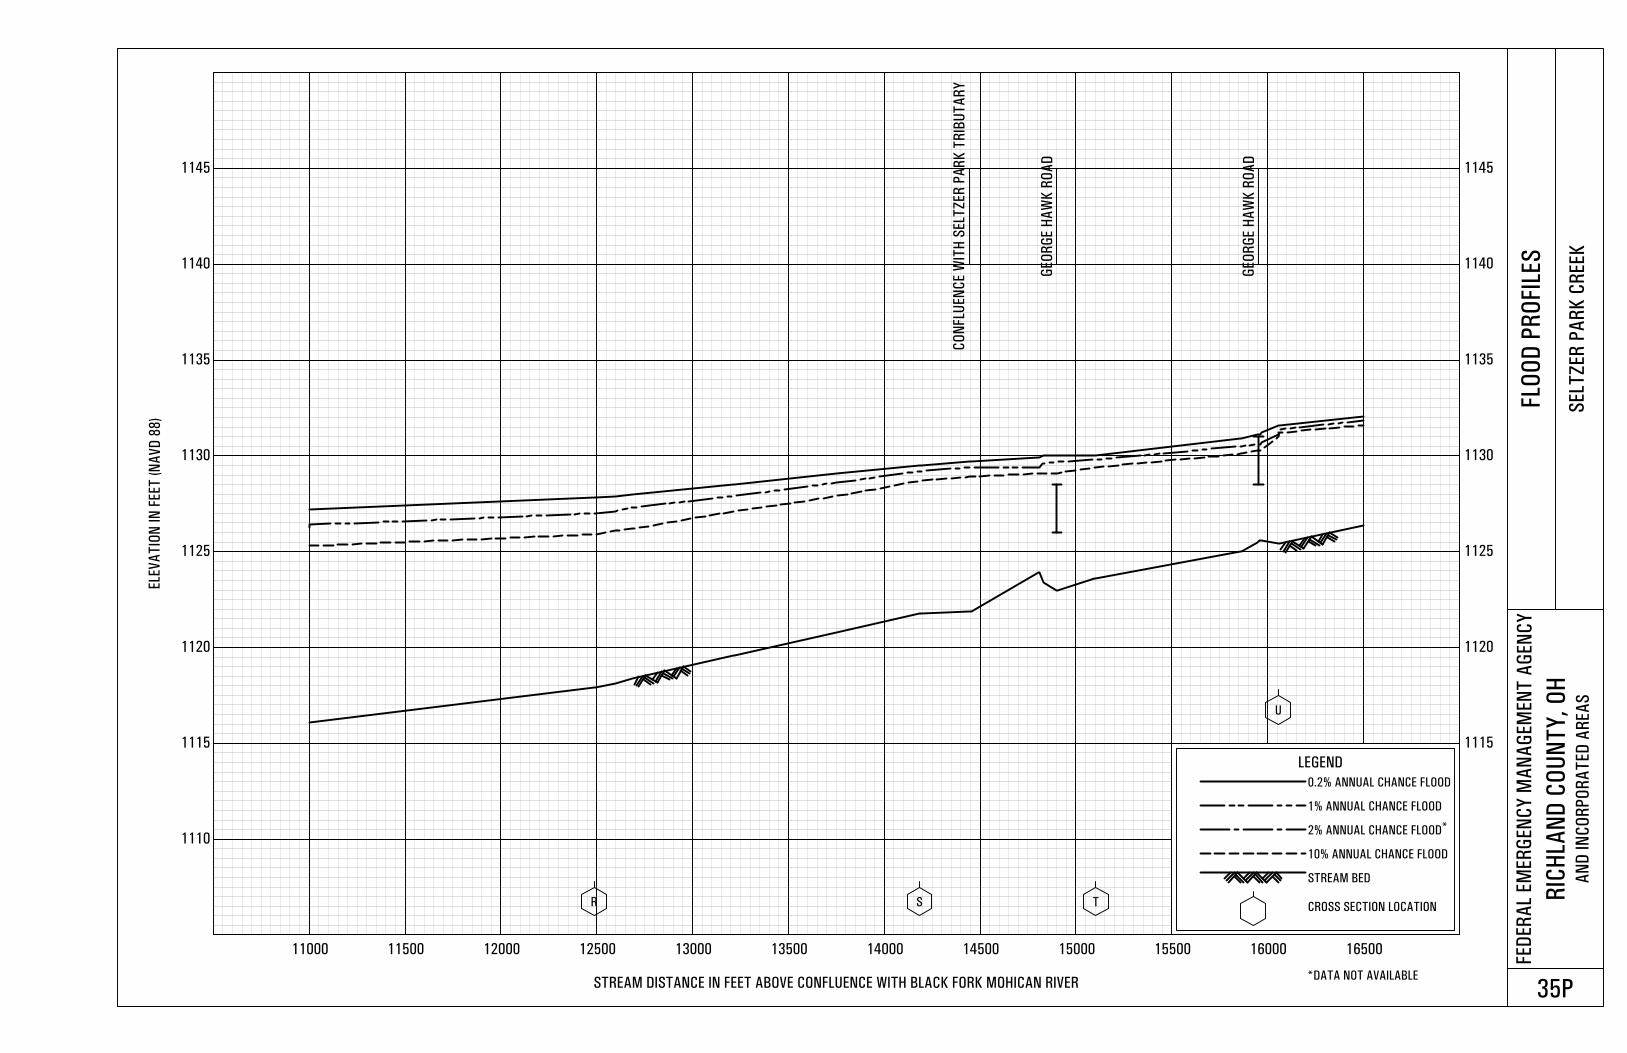
1110
1115 1115
1120 1120
1125 1125
1130 1130
1135 1135
1140 1140
1145 1145
11000 11500 12000 12500 13000 13500 14000 14500 15000 15500 16000 16500
ELE
VA
TIO
N IN
FEET
(N
AV
D 8
8)
STREAM DISTANCE IN FEET ABOVE CONFLUENCE WITH BLACK FORK MOHICAN RIVER
FED
ER
AL
EM
ER
GEN
CY
MA
NA
GEM
EN
T A
GEN
CY
RIC
HLA
ND
CO
UN
TY
, O
HA
ND
IN
CO
RP
OR
AT
ED
AR
EA
S
FLO
OD
PR
OFI L
ES
SELT
ZER
PA
RK
CR
EEK
35P
R S T
U
CO
NFLU
EN
CE W
ITH
SELT
ZER
PA
RK
TR
IBU
TA
RY
GEO
RG
E H
AW
K R
OA
D
GEO
RG
E H
AW
K R
OA
D
LEGEND
0.2% ANNUAL CHANCE FLOOD
1% ANNUAL CHANCE FLOOD
2% ANNUAL CHANCE FLOOD
10% ANNUAL CHANCE FLOOD
STREAM BED
CROSS SECTION LOCATION
*
*DATA NOT AVAILABLE
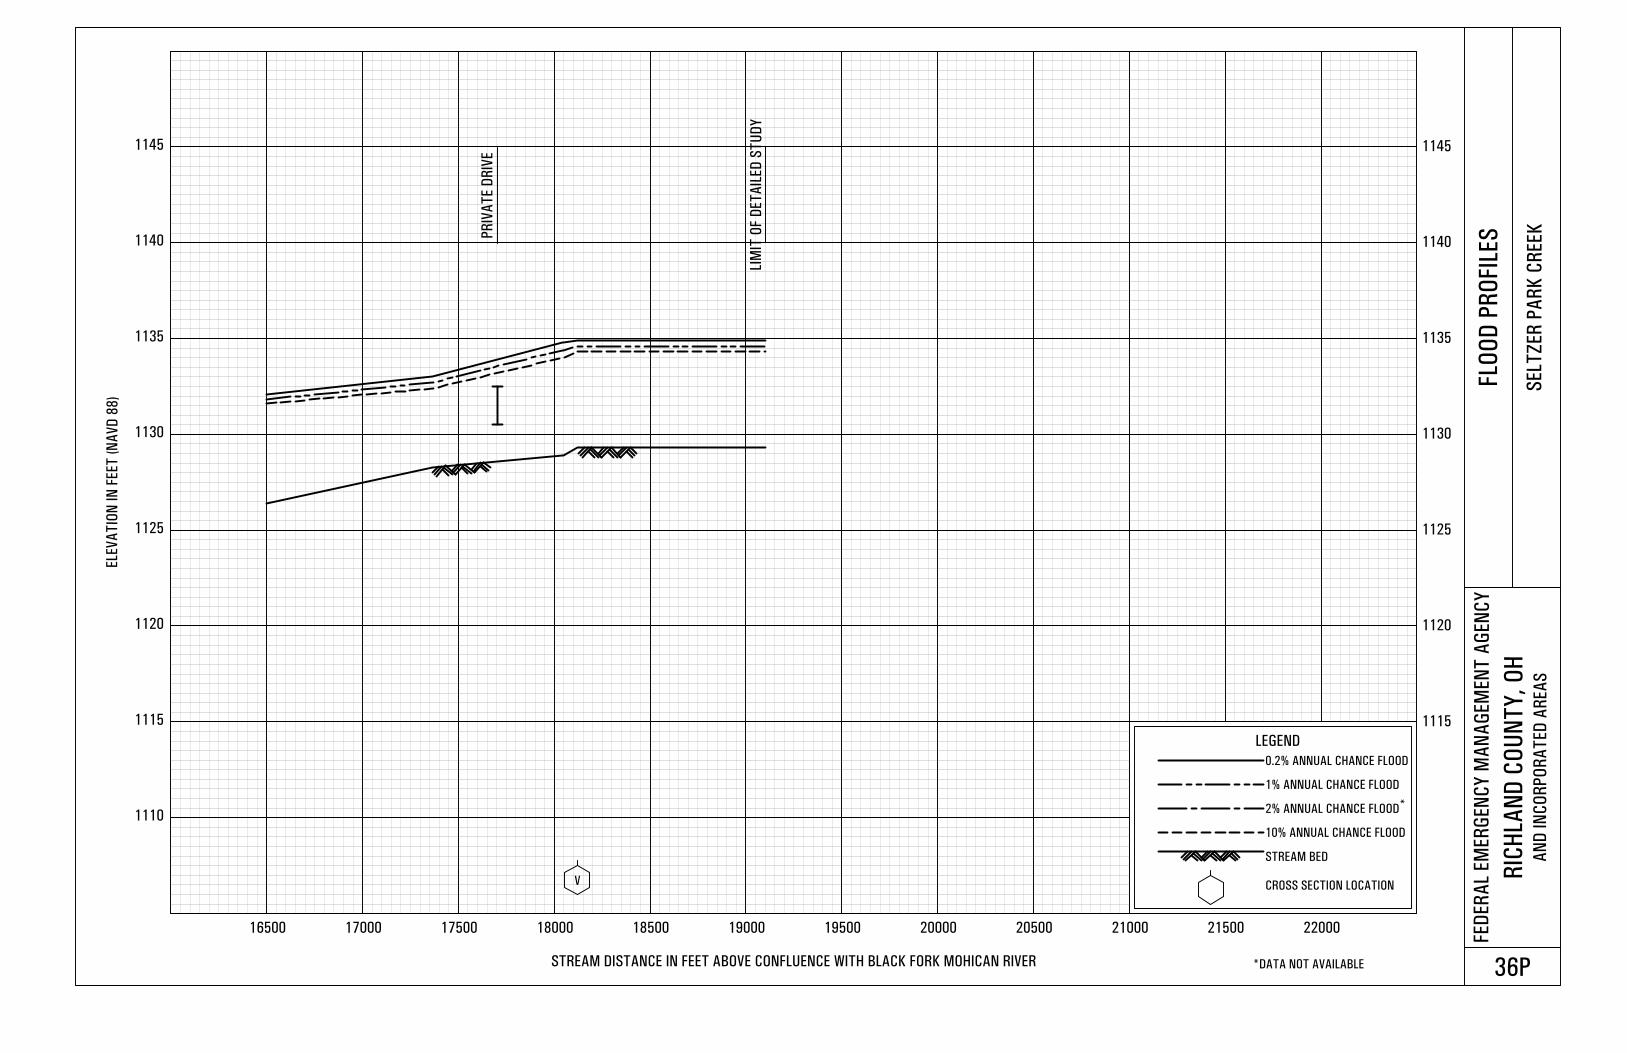
1110
1115 1115
1120 1120
1125 1125
1130 1130
1135 1135
1140 1140
1145 1145
16500 17000 17500 18000 18500 19000 19500 20000 20500 21000 21500 22000
ELE
VA
TIO
N IN
FEET
(N
AV
D 8
8)
STREAM DISTANCE IN FEET ABOVE CONFLUENCE WITH BLACK FORK MOHICAN RIVER
FED
ER
AL
EM
ER
GEN
CY
MA
NA
GEM
EN
T A
GEN
CY
RIC
HLA
ND
CO
UN
TY
, O
HA
ND
IN
CO
RP
OR
AT
ED
AR
EA
S
FLO
OD
PR
OFI L
ES
SELT
ZER
PA
RK
CR
EEK
36P
V
LIM
IT O
F D
ET
AIL
ED
ST
UD
YLEGEND
0.2% ANNUAL CHANCE FLOOD
1% ANNUAL CHANCE FLOOD
2% ANNUAL CHANCE FLOOD
10% ANNUAL CHANCE FLOOD
STREAM BED
CROSS SECTION LOCATION
*DATA NOT AVAILABLE
*
PR
IVA
TE D
RIV
E
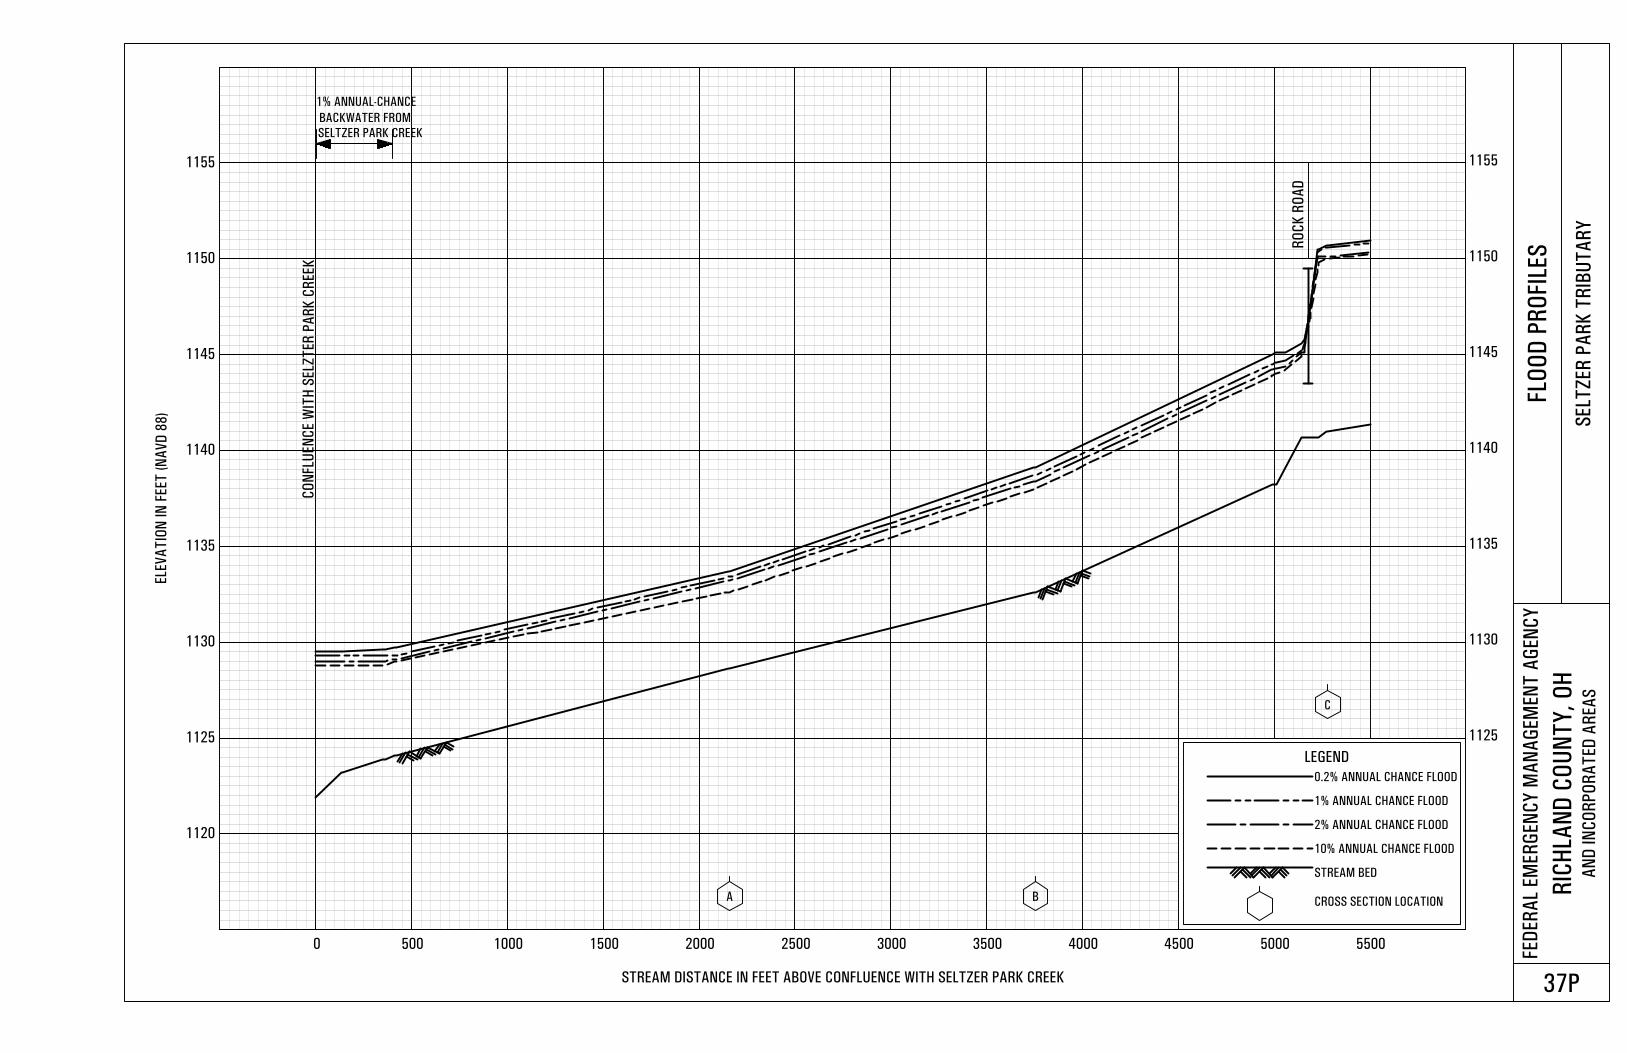
1120
1125 1125
1130 1130
1135 1135
1140 1140
1145 1145
1150 1150
1155 1155
0 500 1000 1500 2000 2500 3000 3500 4000 4500 5000 5500
ELE
VA
TIO
N IN
FEET
(N
AV
D 8
8)
STREAM DISTANCE IN FEET ABOVE CONFLUENCE WITH SELTZER PARK CREEK
FED
ER
AL
EM
ER
GEN
CY
MA
NA
GEM
EN
T A
GEN
CY
RIC
HLA
ND
CO
UN
TY
, O
HA
ND
IN
CO
RP
OR
AT
ED
AR
EA
S
FLO
OD
PR
OFI L
ES
SELT
ZER
PA
RK
TR
IBU
TA
RY
37P
A B
C
CO
NFLU
EN
CE W
ITH
SELZ
TER
PA
RK
CR
EEK
RO
CK
RO
AD
LEGEND
0.2% ANNUAL CHANCE FLOOD
1% ANNUAL CHANCE FLOOD
2% ANNUAL CHANCE FLOOD
10% ANNUAL CHANCE FLOOD
STREAM BED
CROSS SECTION LOCATION
SELTZER PARK CREEK
BACKWATER FROM
1% ANNUAL-CHANCE
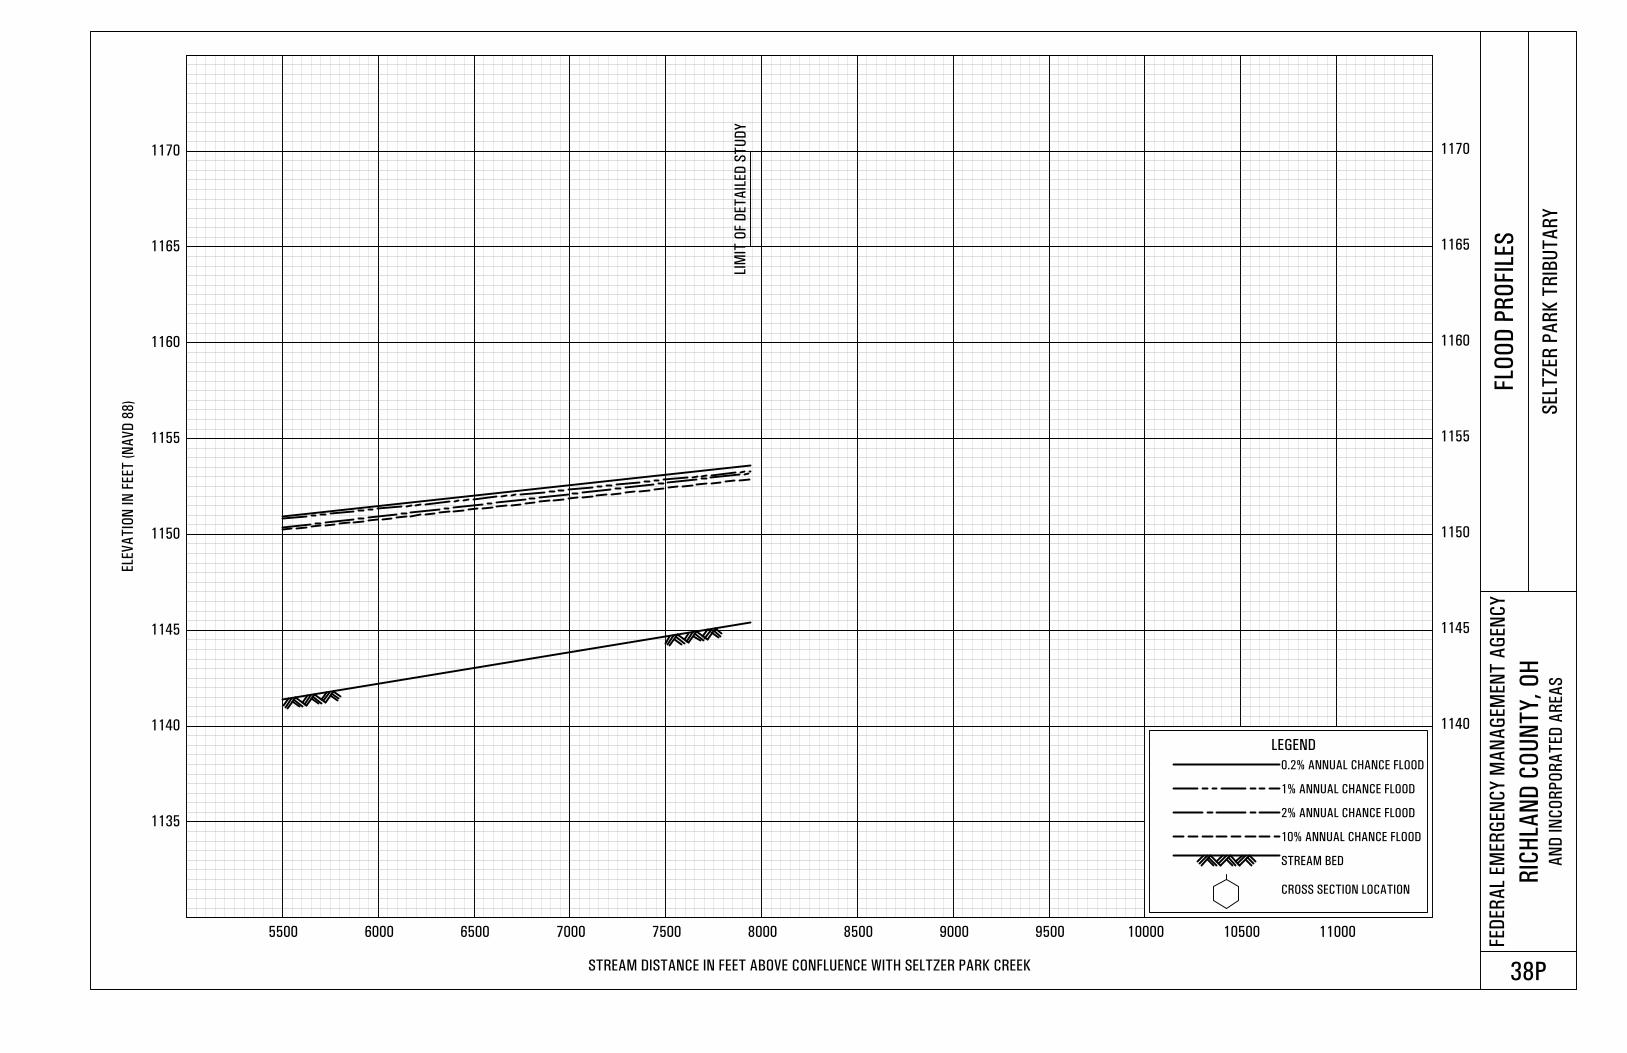
1135
1140 1140
1145 1145
1150 1150
1155 1155
1160 1160
1165 1165
1170 1170
5500 6000 6500 7000 7500 8000 8500 9000 9500 10000 10500 11000
ELE
VA
TIO
N IN
FEET
(N
AV
D 8
8)
STREAM DISTANCE IN FEET ABOVE CONFLUENCE WITH SELTZER PARK CREEK
FED
ER
AL
EM
ER
GEN
CY
MA
NA
GEM
EN
T A
GEN
CY
RIC
HLA
ND
CO
UN
TY
, O
HA
ND
IN
CO
RP
OR
AT
ED
AR
EA
S
FLO
OD
PR
OFI L
ES
SELT
ZER
PA
RK
TR
IBU
TA
RY
38P
LIM
IT O
F D
ET
AIL
ED
ST
UD
YLEGEND
0.2% ANNUAL CHANCE FLOOD
1% ANNUAL CHANCE FLOOD
2% ANNUAL CHANCE FLOOD
10% ANNUAL CHANCE FLOOD
STREAM BED
CROSS SECTION LOCATION
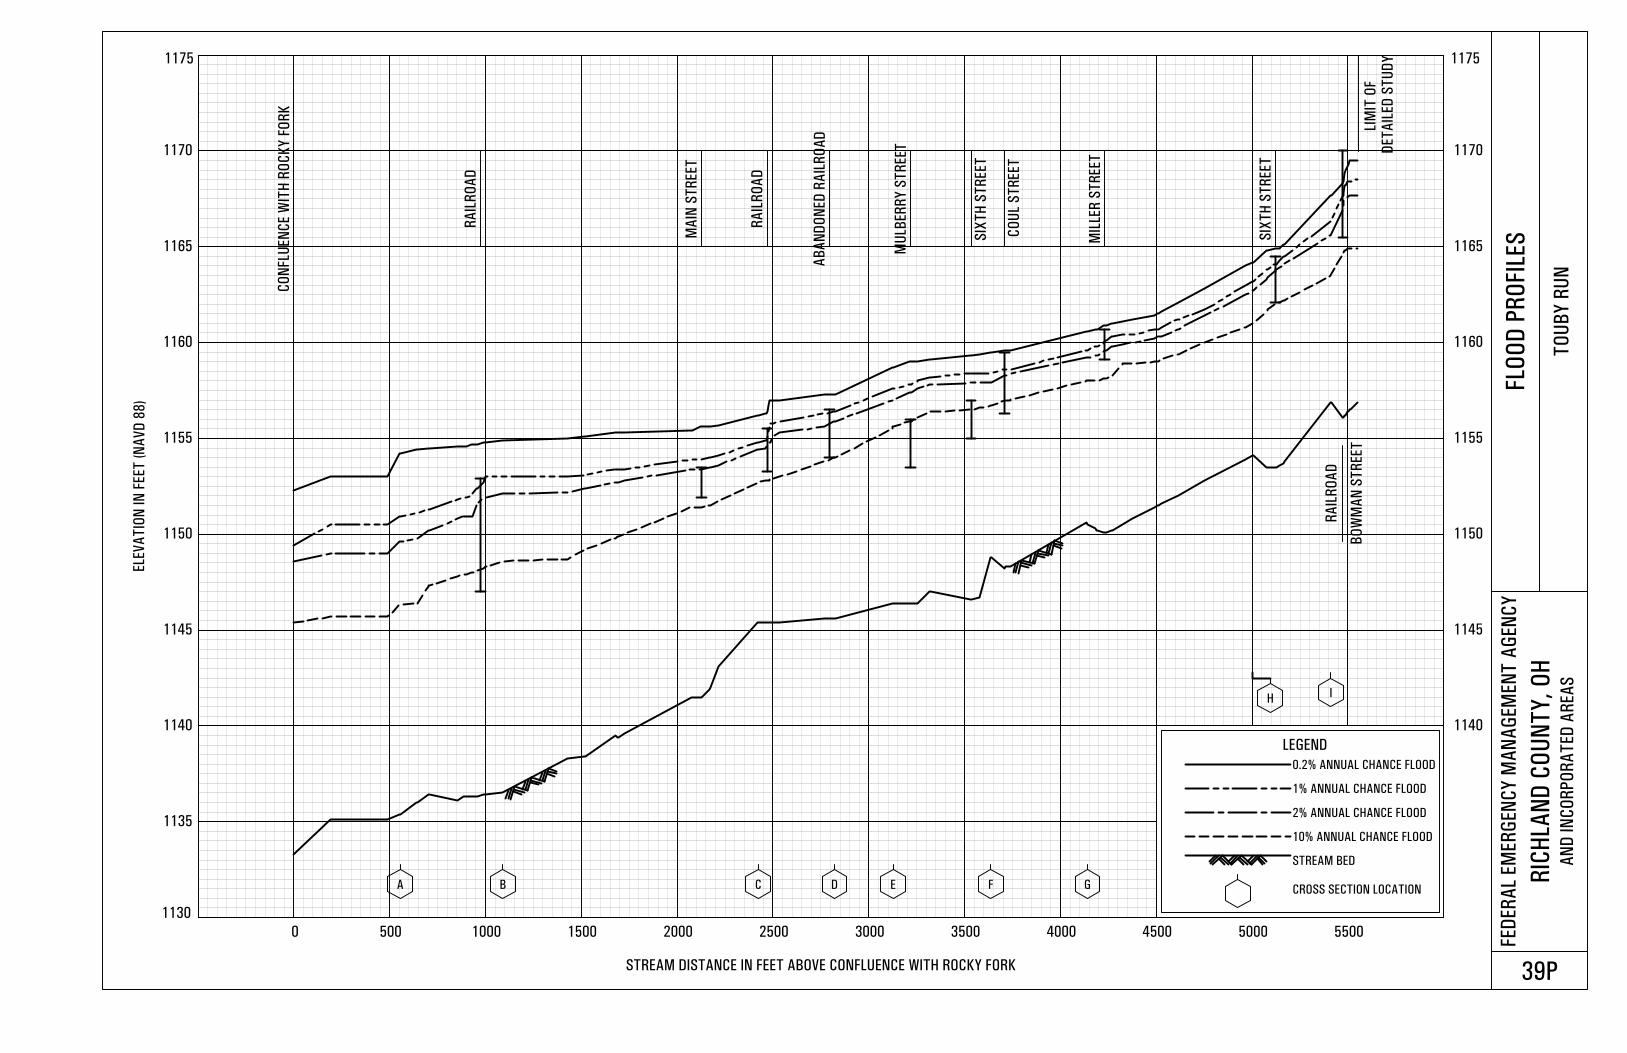
1135
1140 1140
1145 1145
1150 1150
1155 1155
1160 1160
1165 1165
1170 1170
0 500 1000 1500 2000 2500 3000 3500 4000 4500 5000 5500
ELE
VA
TIO
N IN
FEET
(N
AV
D 8
8)
STREAM DISTANCE IN FEET ABOVE CONFLUENCE WITH ROCKY FORK
FED
ER
AL
EM
ER
GEN
CY
MA
NA
GEM
EN
T A
GEN
CY
RIC
HLA
ND
CO
UN
TY
, O
HA
ND
IN
CO
RP
OR
AT
ED
AR
EA
S
FLO
OD
PR
OFI L
ES
TO
UB
Y R
UN
39P
A B C D E F G
HI
CO
NFLU
EN
CE W
ITH
RO
CK
Y F
OR
K
BO
WM
AN
ST
REET
LIM
IT O
F
RA
ILR
OA
D
MA
IN S
TR
EET
RA
ILR
OA
D
AB
AN
DO
NED
RA
ILR
OA
D
MU
LBER
RY
ST
REET
SIX
TH
ST
REET
CO
UL
ST
REET
MIL
LER
ST
REET
SIX
TH
ST
REET
RA
ILR
OA
D
LEGEND
0.2% ANNUAL CHANCE FLOOD
1% ANNUAL CHANCE FLOOD
2% ANNUAL CHANCE FLOOD
10% ANNUAL CHANCE FLOOD
STREAM BED
CROSS SECTION LOCATION
1130
1175 1175
DET
AIL
ED
ST
UD
Y
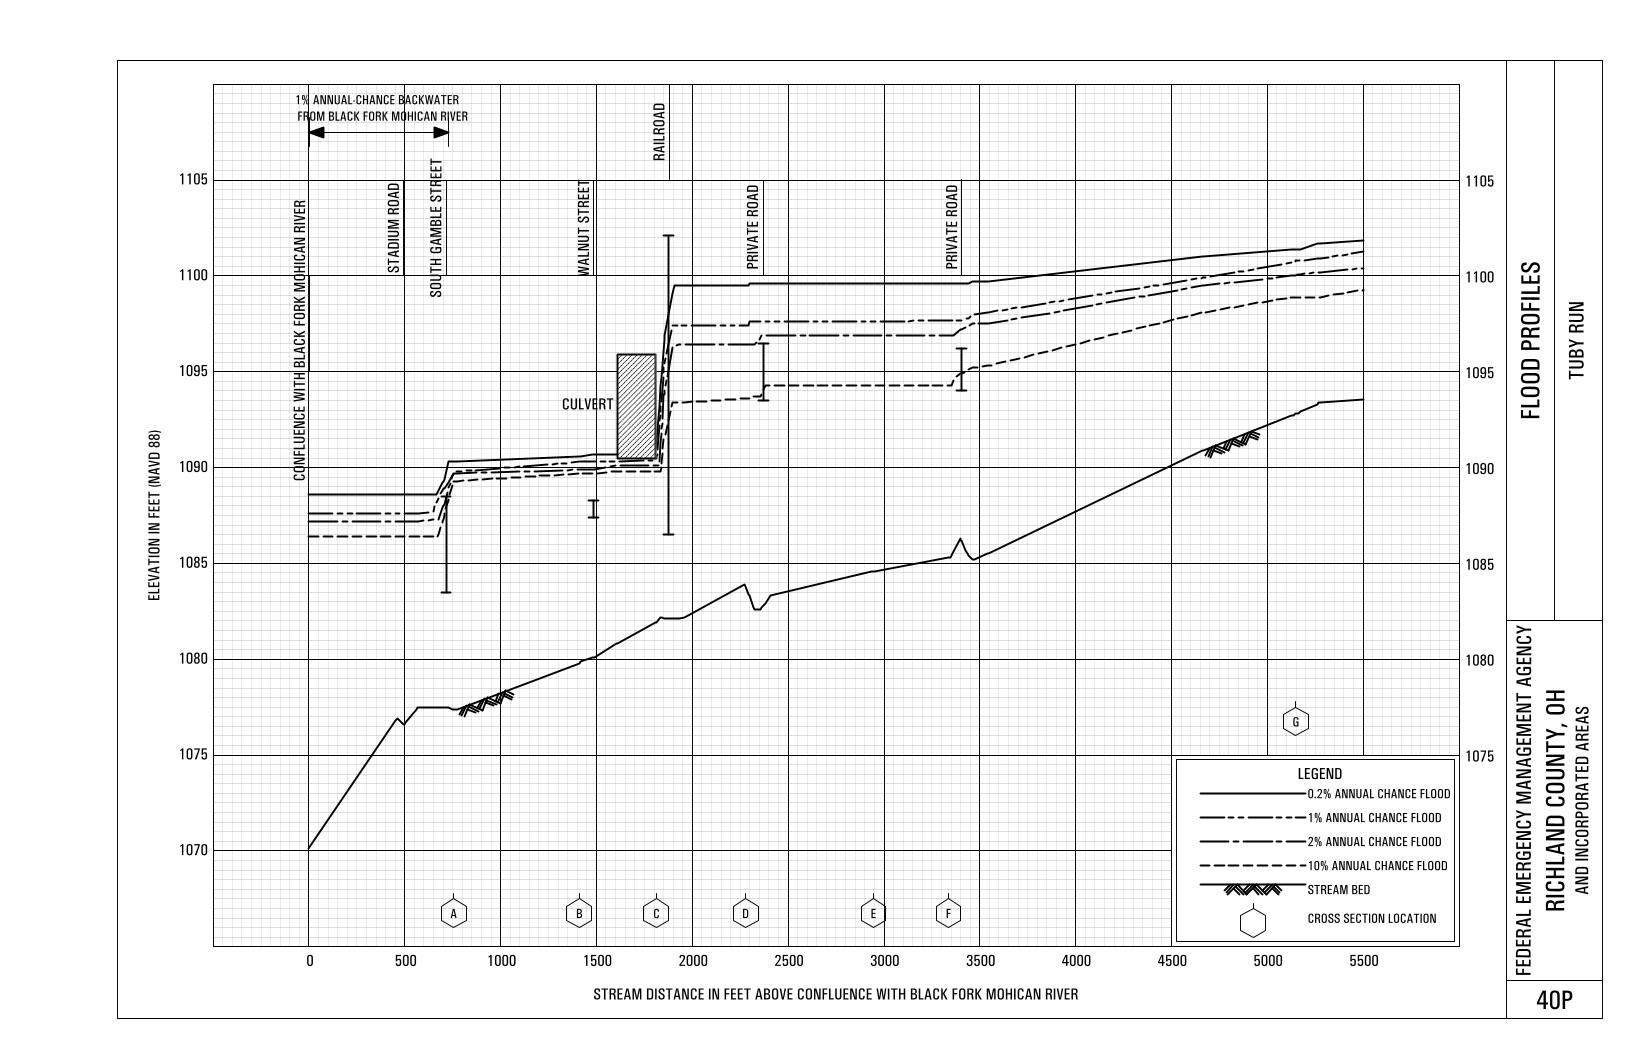
1070
1075 1075
1080 1080
1085 1085
1090 1090
1095 1095
1100 1100
1105 1105
0 500 1000 1500 2000 2500 3000 3500 4000 4500 5000 5500
ELE
VA
TIO
N IN
FEET
(N
AV
D 8
8)
STREAM DISTANCE IN FEET ABOVE CONFLUENCE WITH BLACK FORK MOHICAN RIVER
FED
ER
AL
EM
ER
GEN
CY
MA
NA
GEM
EN
T A
GEN
CY
RIC
HLA
ND
CO
UN
TY
, O
HA
ND
IN
CO
RP
OR
AT
ED
AR
EA
S
FLO
OD
PR
OFI L
ES
TU
BY
RU
N
40P
A B C D E F
G
CO
NFL
UEN
CE W
ITH
BLA
CK
FO
RK
MO
HIC
AN
RIV
ER
ST
AD
IUM
RO
AD
SO
UT
H G
AM
BLE
ST
REET
WA
LNU
T S
TR
EET
RA
ILR
OA
D
PR
IVA
TE R
OA
D
PR
IVA
TE R
OA
D
LEGEND
0.2% ANNUAL CHANCE FLOOD
1% ANNUAL CHANCE FLOOD
2% ANNUAL CHANCE FLOOD
10% ANNUAL CHANCE FLOOD
STREAM BED
CROSS SECTION LOCATION
FROM BLACK FORK MOHICAN RIVER
1% ANNUAL-CHANCE BACKWATER
CULVERT
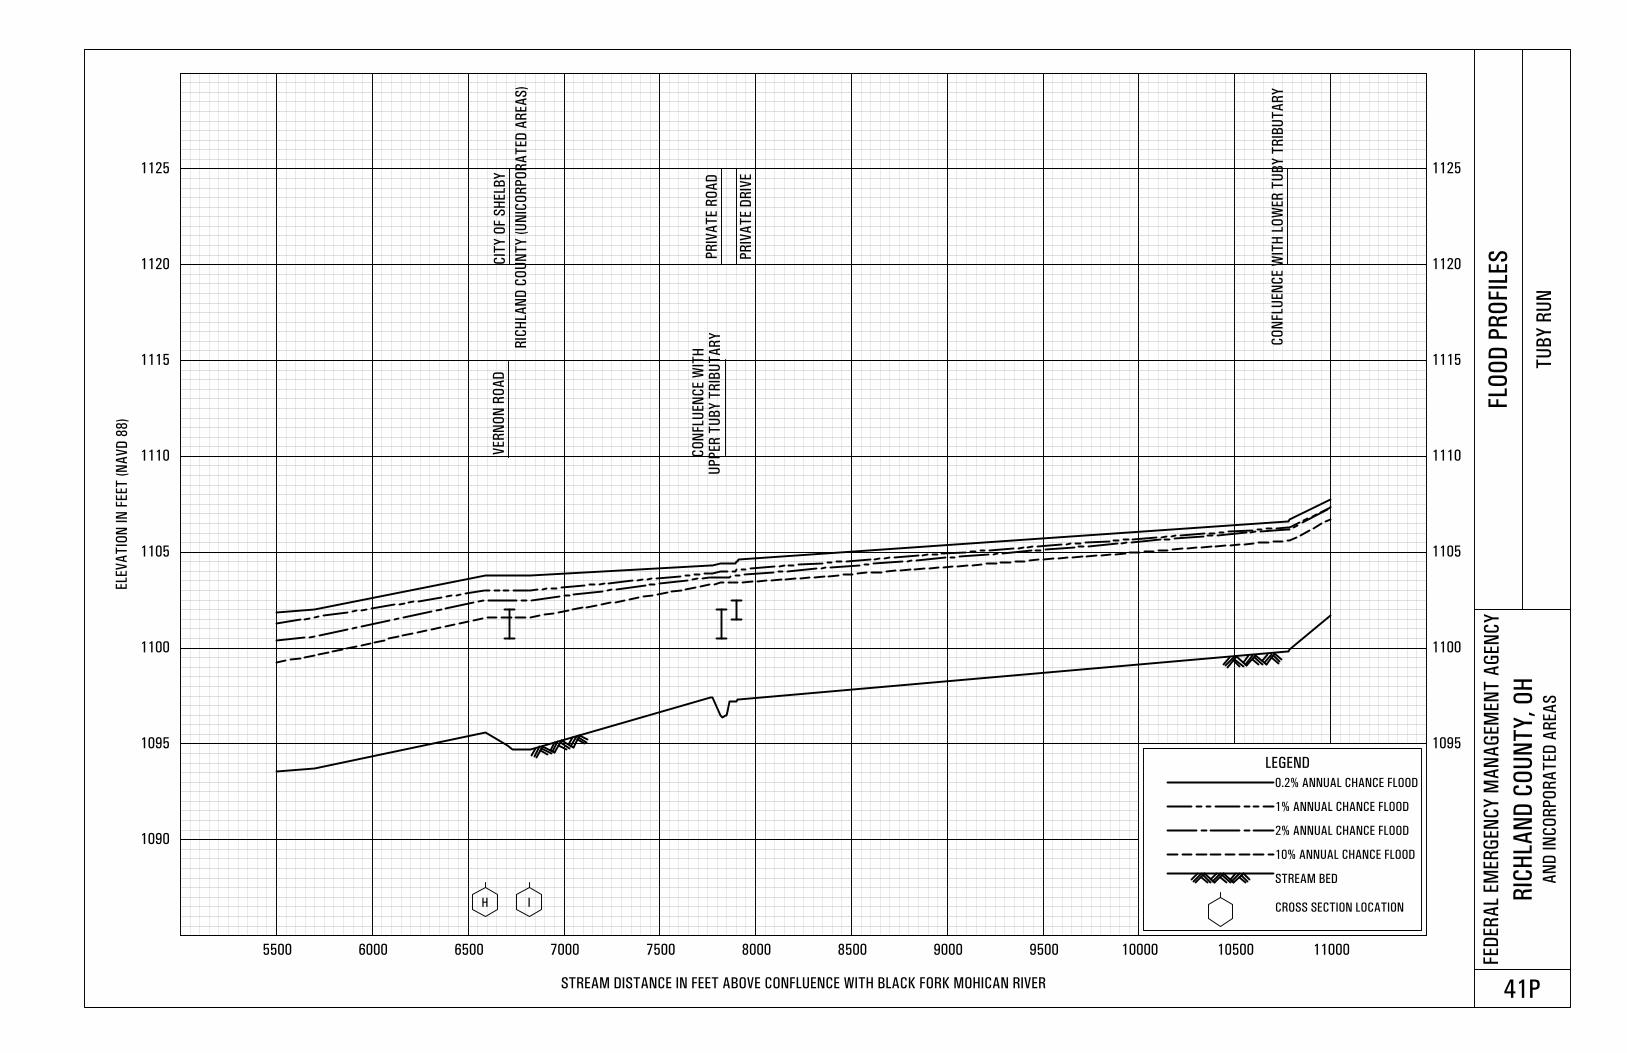
1090
1095 1095
1100 1100
1105 1105
1110 1110
1115 1115
1120 1120
1125 1125
5500 6000 6500 7000 7500 8000 8500 9000 9500 10000 10500 11000
ELE
VA
TIO
N IN
FEET
(N
AV
D 8
8)
STREAM DISTANCE IN FEET ABOVE CONFLUENCE WITH BLACK FORK MOHICAN RIVER
FED
ER
AL
EM
ER
GEN
CY
MA
NA
GEM
EN
T A
GEN
CY
RIC
HLA
ND
CO
UN
TY
, O
HA
ND
IN
CO
RP
OR
AT
ED
AR
EA
S
FLO
OD
PR
OFI L
ES
TU
BY
RU
N
41P
H I
UP
PER
TU
BY
TR
IBU
TA
RY CO
NFLU
EN
CE W
ITH
LO
WER
TU
BY
TR
IBU
TA
RY
CIT
Y O
F S
HELB
Y
PR
IVA
TE R
OA
D
PR
IVA
TE D
RIV
E
LEGEND
0.2% ANNUAL CHANCE FLOOD
1% ANNUAL CHANCE FLOOD
2% ANNUAL CHANCE FLOOD
10% ANNUAL CHANCE FLOOD
STREAM BED
CROSS SECTION LOCATION
RIC
HLA
ND
CO
UN
TY
(U
NIC
OR
PO
RA
TED
AR
EA
S)
VER
NO
N R
OA
D
CO
NFL
UEN
CE W
ITH
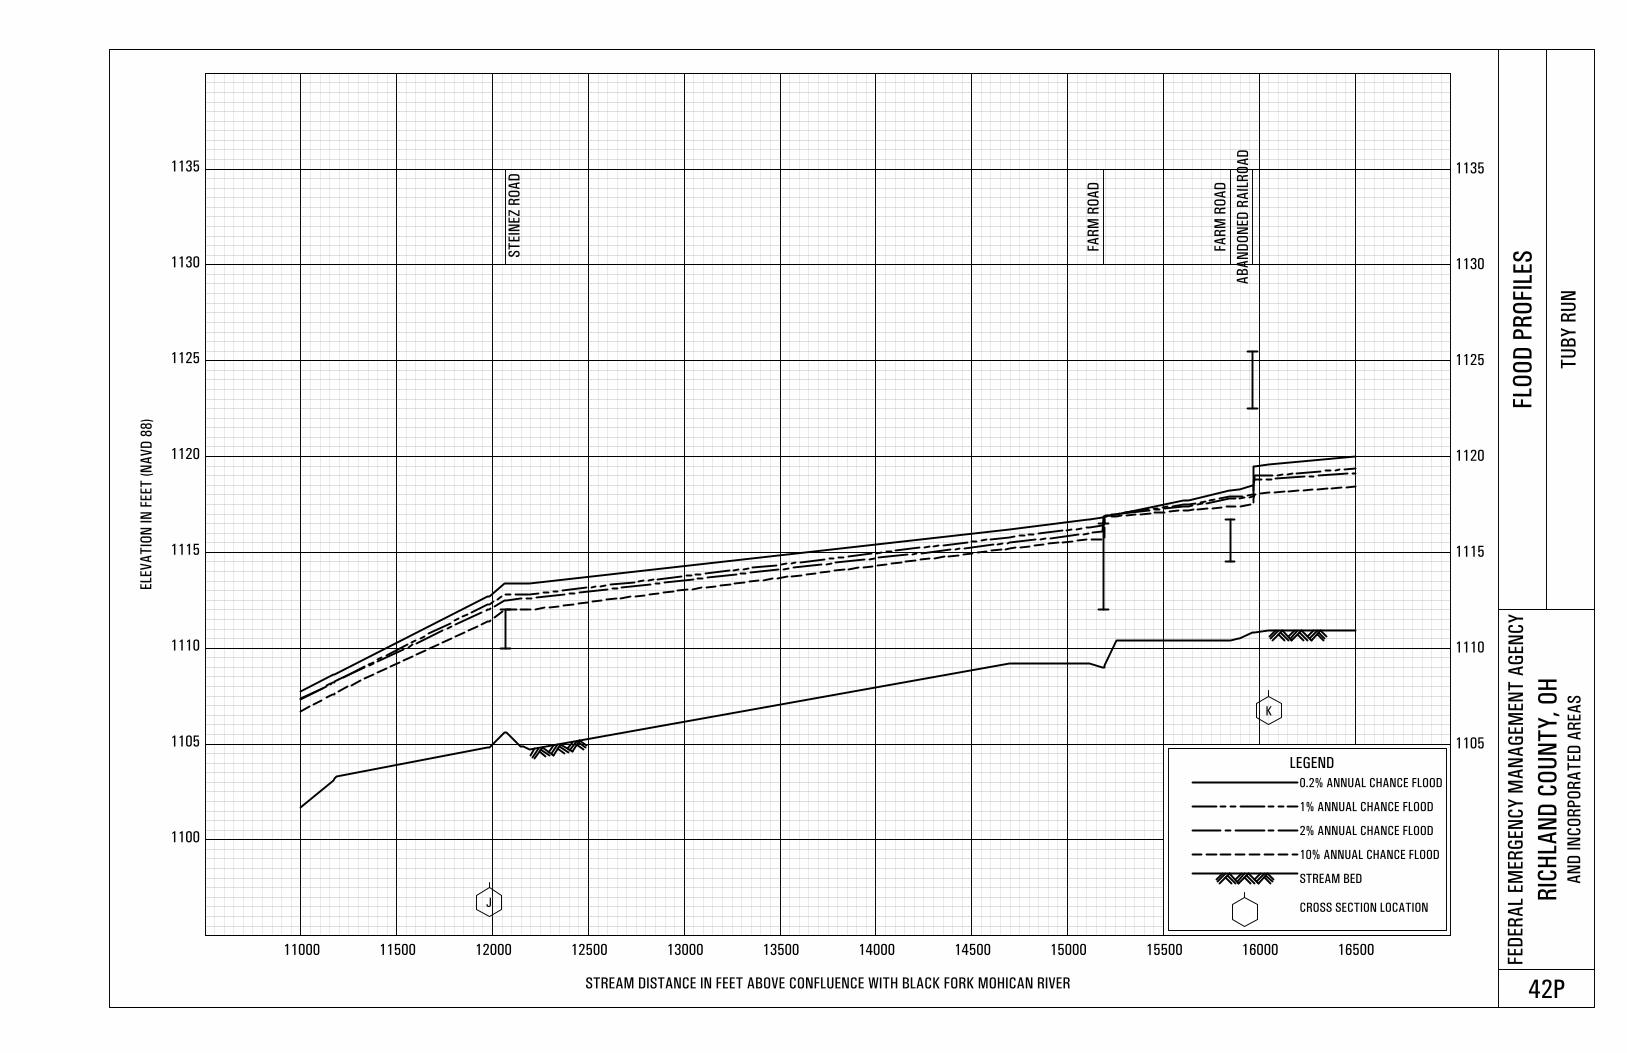
1100
1105 1105
1110 1110
1115 1115
1120 1120
1125 1125
1130 1130
1135 1135
11000 11500 12000 12500 13000 13500 14000 14500 15000 15500 16000 16500
ELE
VA
TIO
N IN
FEET
(N
AV
D 8
8)
STREAM DISTANCE IN FEET ABOVE CONFLUENCE WITH BLACK FORK MOHICAN RIVER
FED
ER
AL
EM
ER
GEN
CY
MA
NA
GEM
EN
T A
GEN
CY
RIC
HLA
ND
CO
UN
TY
, O
HA
ND
IN
CO
RP
OR
AT
ED
AR
EA
S
FLO
OD
PR
OFI L
ES
TU
BY
RU
N
42P
J
K
ST
EIN
EZ
RO
AD
FAR
M R
OA
D
FAR
M R
OA
D
AB
AN
DO
NED
RA
ILR
OA
D
LEGEND
0.2% ANNUAL CHANCE FLOOD
1% ANNUAL CHANCE FLOOD
2% ANNUAL CHANCE FLOOD
10% ANNUAL CHANCE FLOOD
STREAM BED
CROSS SECTION LOCATION
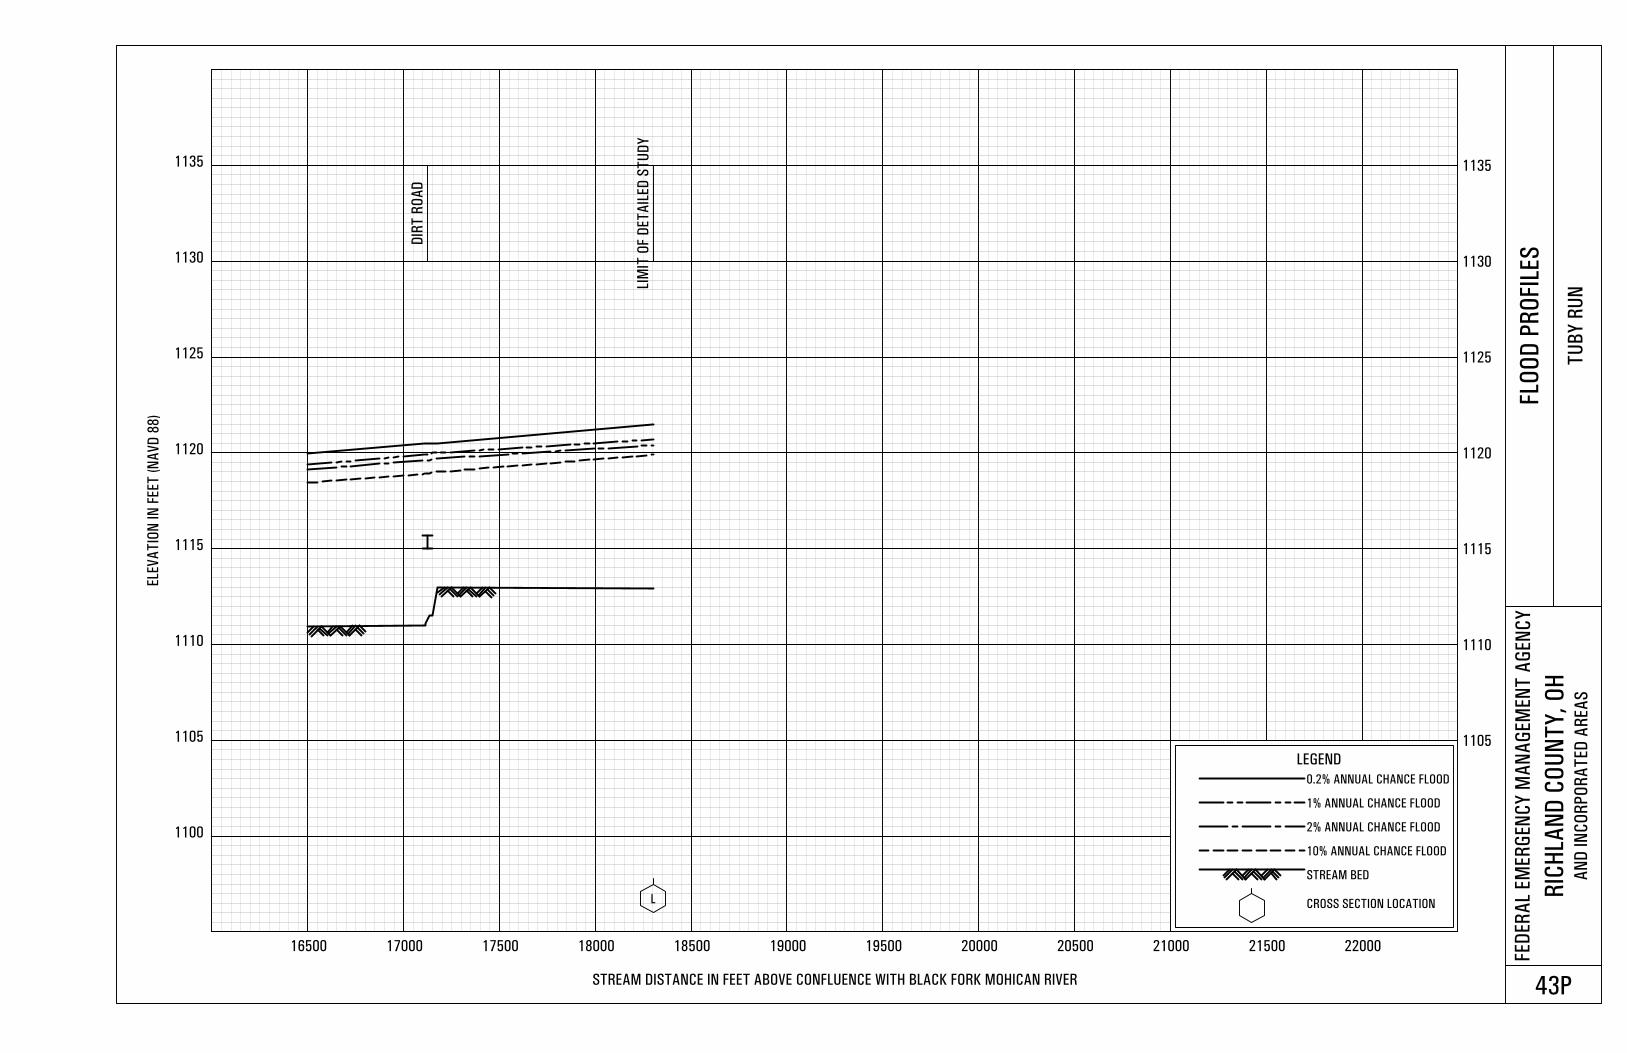
1100
1105 1105
1110 1110
1115 1115
1120 1120
1125 1125
1130 1130
1135 1135
16500 17000 17500 18000 18500 19000 19500 20000 20500 21000 21500 22000
ELE
VA
TIO
N IN
FEET
(N
AV
D 8
8)
STREAM DISTANCE IN FEET ABOVE CONFLUENCE WITH BLACK FORK MOHICAN RIVER
FED
ER
AL
EM
ER
GEN
CY
MA
NA
GEM
EN
T A
GEN
CY
RIC
HLA
ND
CO
UN
TY
, O
HA
ND
IN
CO
RP
OR
AT
ED
AR
EA
S
FLO
OD
PR
OFI L
ES
TU
BY
RU
N
43P
L
LIM
IT O
F D
ET
AIL
ED
ST
UD
Y
DIR
T R
OA
D
LEGEND
0.2% ANNUAL CHANCE FLOOD
1% ANNUAL CHANCE FLOOD
2% ANNUAL CHANCE FLOOD
10% ANNUAL CHANCE FLOOD
STREAM BED
CROSS SECTION LOCATION
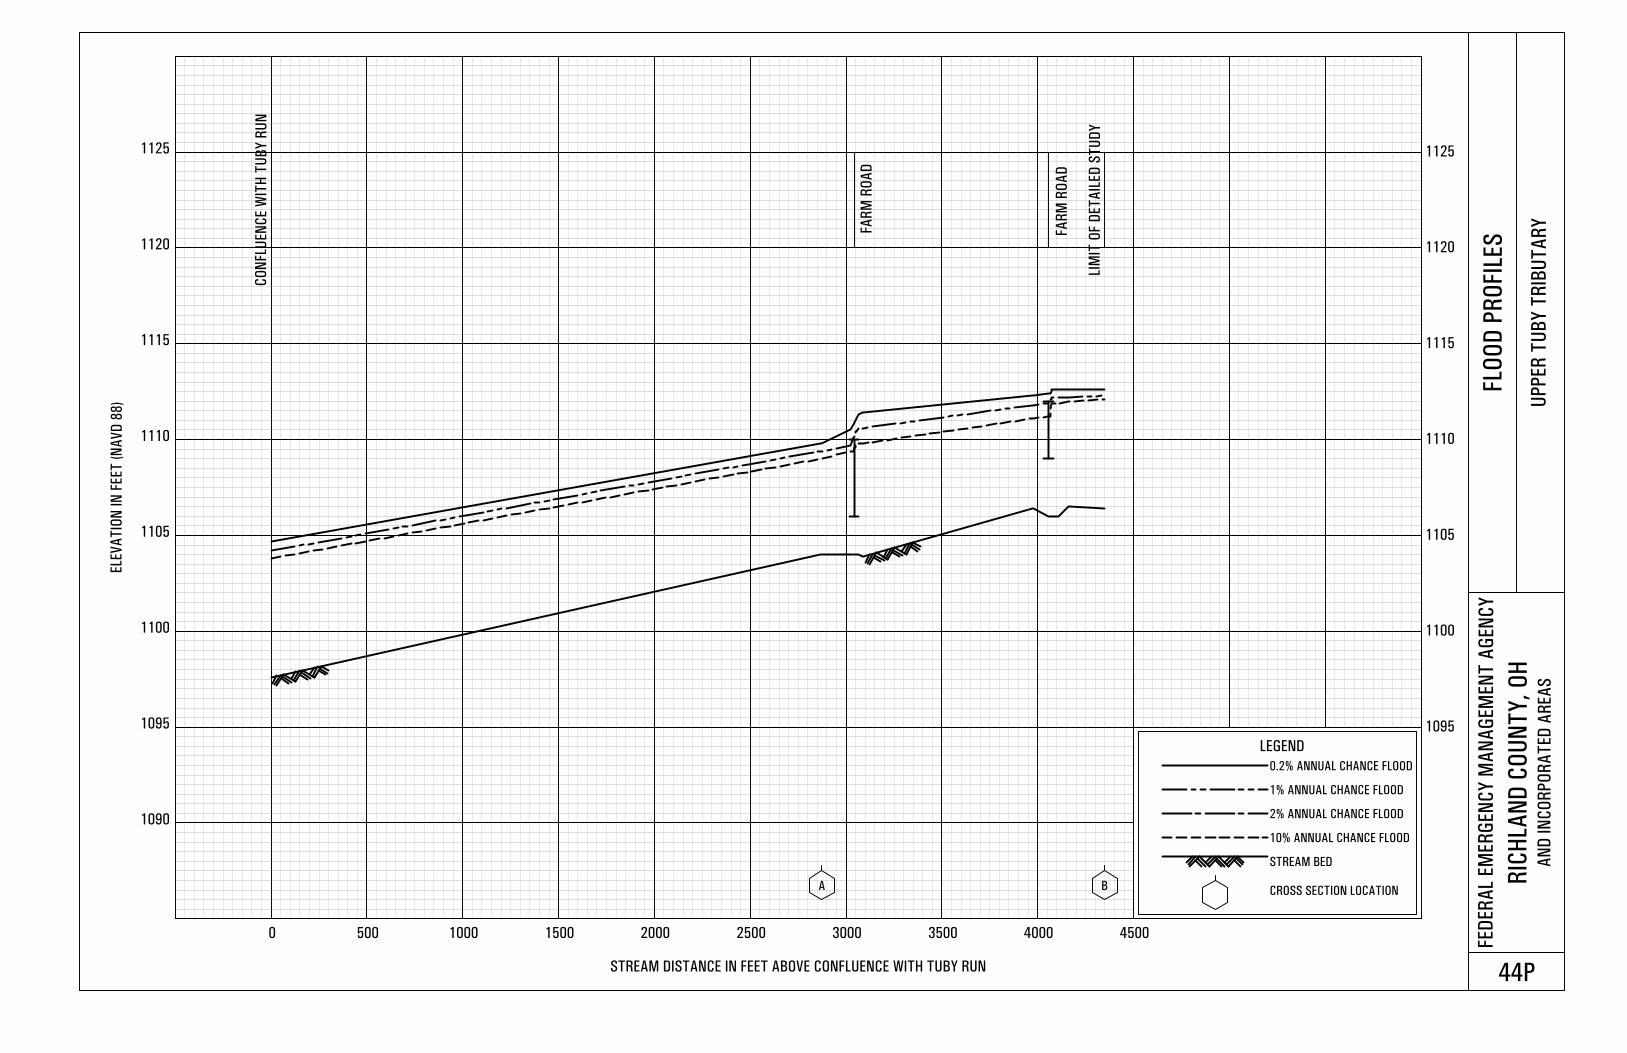
1090
1095 1095
1100 1100
1105 1105
1110 1110
1115 1115
1120 1120
1125 1125
0 500 1000 1500 2000 2500 3000 3500 4000 4500
ELE
VA
TIO
N IN
FEET
(N
AV
D 8
8)
STREAM DISTANCE IN FEET ABOVE CONFLUENCE WITH TUBY RUN
FED
ER
AL
EM
ER
GEN
CY
MA
NA
GEM
EN
T A
GEN
CY
RIC
HLA
ND
CO
UN
TY
, O
HA
ND
IN
CO
RP
OR
AT
ED
AR
EA
S
FLO
OD
PR
OFI L
ES
UP
PER
TU
BY
TR
IBU
TA
RY
44P
A B
CO
NFL
UEN
CE W
ITH
TU
BY
RU
N
LIM
IT O
F D
ET
AIL
ED
ST
UD
Y
FAR
M R
OA
D
FAR
M R
OA
D
LEGEND
0.2% ANNUAL CHANCE FLOOD
1% ANNUAL CHANCE FLOOD
2% ANNUAL CHANCE FLOOD
10% ANNUAL CHANCE FLOOD
STREAM BED
CROSS SECTION LOCATION
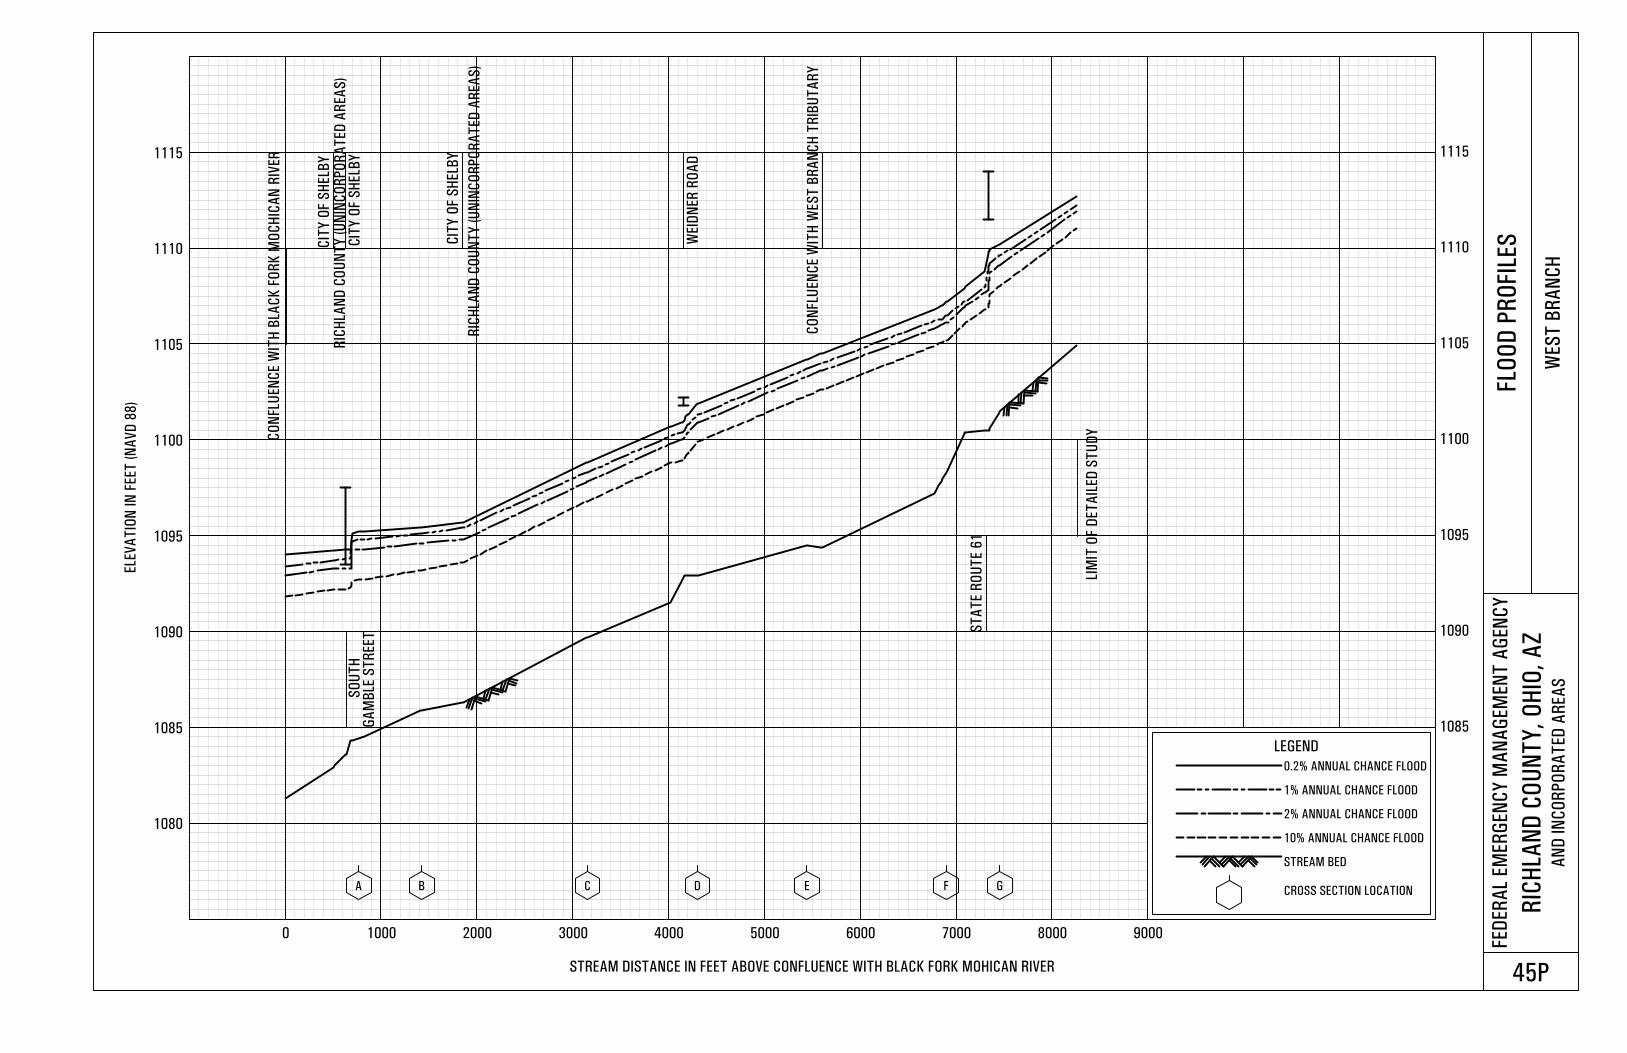
1080
1085 1085
1090 1090
1095 1095
1100 1100
1105 1105
1110 1110
1115 1115
0 1000 2000 3000 4000 5000 6000 7000 8000 9000
ELE
VA
TIO
N IN
FEET
(N
AV
D 8
8)
STREAM DISTANCE IN FEET ABOVE CONFLUENCE WITH BLACK FORK MOHICAN RIVER
FED
ER
AL
EM
ER
GEN
CY
MA
NA
GEM
EN
T A
GEN
CY
RIC
HLA
ND
CO
UN
TY
, O
HIO
, A
ZA
ND
IN
CO
RP
OR
AT
ED
AR
EA
S
FLO
OD
PR
OFI L
ES
WES
T B
RA
NC
H
45P
A B C D E F G
CO
NFL
UEN
CE W
ITH
BLA
CK
FO
RK
MO
CH
ICA
N R
IVER
CIT
Y O
F S
HELB
Y
CIT
Y O
F S
HELB
Y
CO
NFLU
EN
CE W
ITH
WES
T B
RA
NC
H T
RIB
UT
AR
Y
LIM
IT O
F D
ET
AIL
ED
ST
UD
Y
CIT
Y O
F S
HELB
Y
WEID
NER
RO
AD
ST
AT
E R
OU
TE 6
1
LEGEND
0.2% ANNUAL CHANCE FLOOD
1% ANNUAL CHANCE FLOOD
2% ANNUAL CHANCE FLOOD
10% ANNUAL CHANCE FLOOD
STREAM BED
CROSS SECTION LOCATION
RIC
HLA
ND
CO
UN
TY
(U
NIN
CO
RP
OR
AT
ED
AR
EA
S)
RIC
HLA
ND
CO
UN
TY
(U
NIN
CO
RP
OR
AT
ED
AR
EA
S)
SO
UT
H
GA
MB
LE S
TR
EET
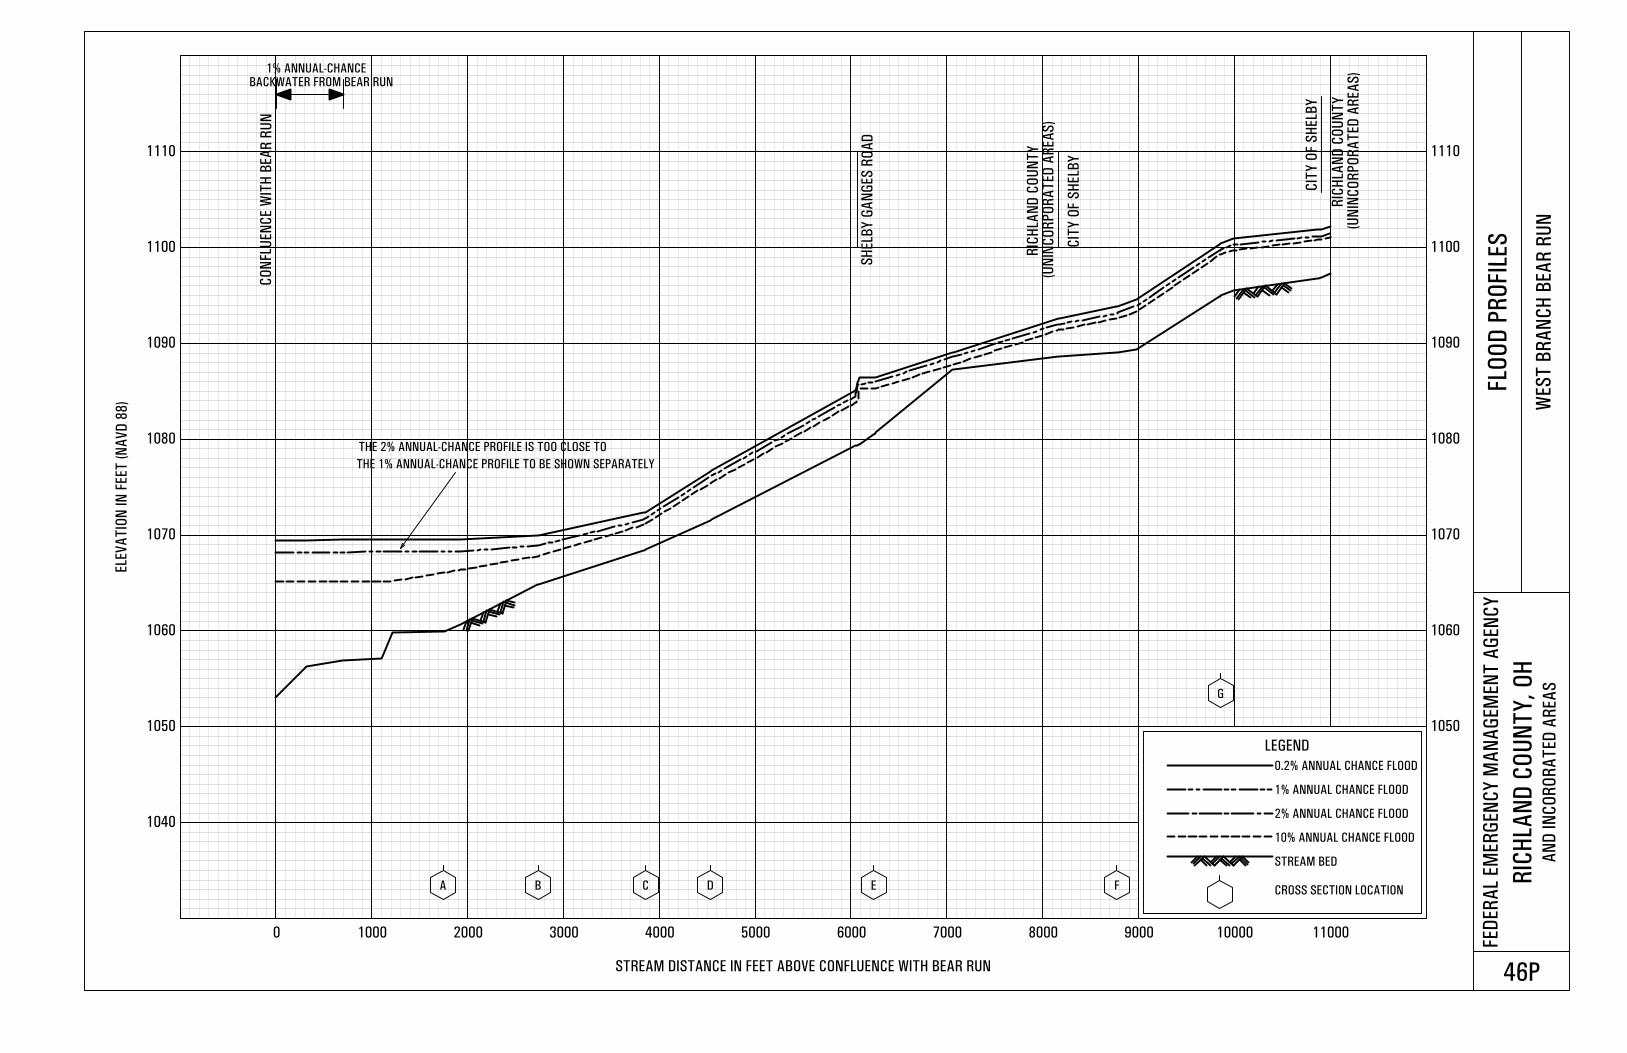
1040
1050 1050
1060 1060
1070 1070
1080 1080
1090 1090
1100 1100
1110 1110
0 1000 2000 3000 4000 5000 6000 7000 8000 9000 10000 11000
ELE
VA
TIO
N IN
FEET
(N
AV
D 8
8)
STREAM DISTANCE IN FEET ABOVE CONFLUENCE WITH BEAR RUN
FED
ER
AL
EM
ER
GEN
CY
MA
NA
GEM
EN
T A
GEN
CY
RIC
HLA
ND
CO
UN
TY
, O
HA
ND
IN
CO
RO
RA
TED
AR
EA
S
FLO
OD
PR
OFI L
ES
WES
T B
RA
NC
H B
EA
R R
UN
46P
A B C D E F
G
CO
NFL
UEN
CE W
ITH
BEA
R R
UN
SH
ELB
Y G
AN
GES
RO
AD
(U
NIN
CO
RP
OR
AT
ED
AR
EA
S)
CIT
Y O
F S
HELB
Y
LEGEND
0.2% ANNUAL CHANCE FLOOD
1% ANNUAL CHANCE FLOOD
2% ANNUAL CHANCE FLOOD
10% ANNUAL CHANCE FLOOD
STREAM BED
CROSS SECTION LOCATION
BACKWATER FROM BEAR RUN
CIT
Y O
F S
HELB
Y
RI C
HLA
ND
CO
UN
TY
RI C
HLA
ND
CO
UN
TY
(U
NIN
CO
RP
OR
AT
ED
AR
EA
S)
THE 2% ANNUAL-CHANCE PROFILE IS TOO CLOSE TO
THE 1% ANNUAL-CHANCE PROFILE TO BE SHOWN SEPARATELY
1% ANNUAL-CHANCE
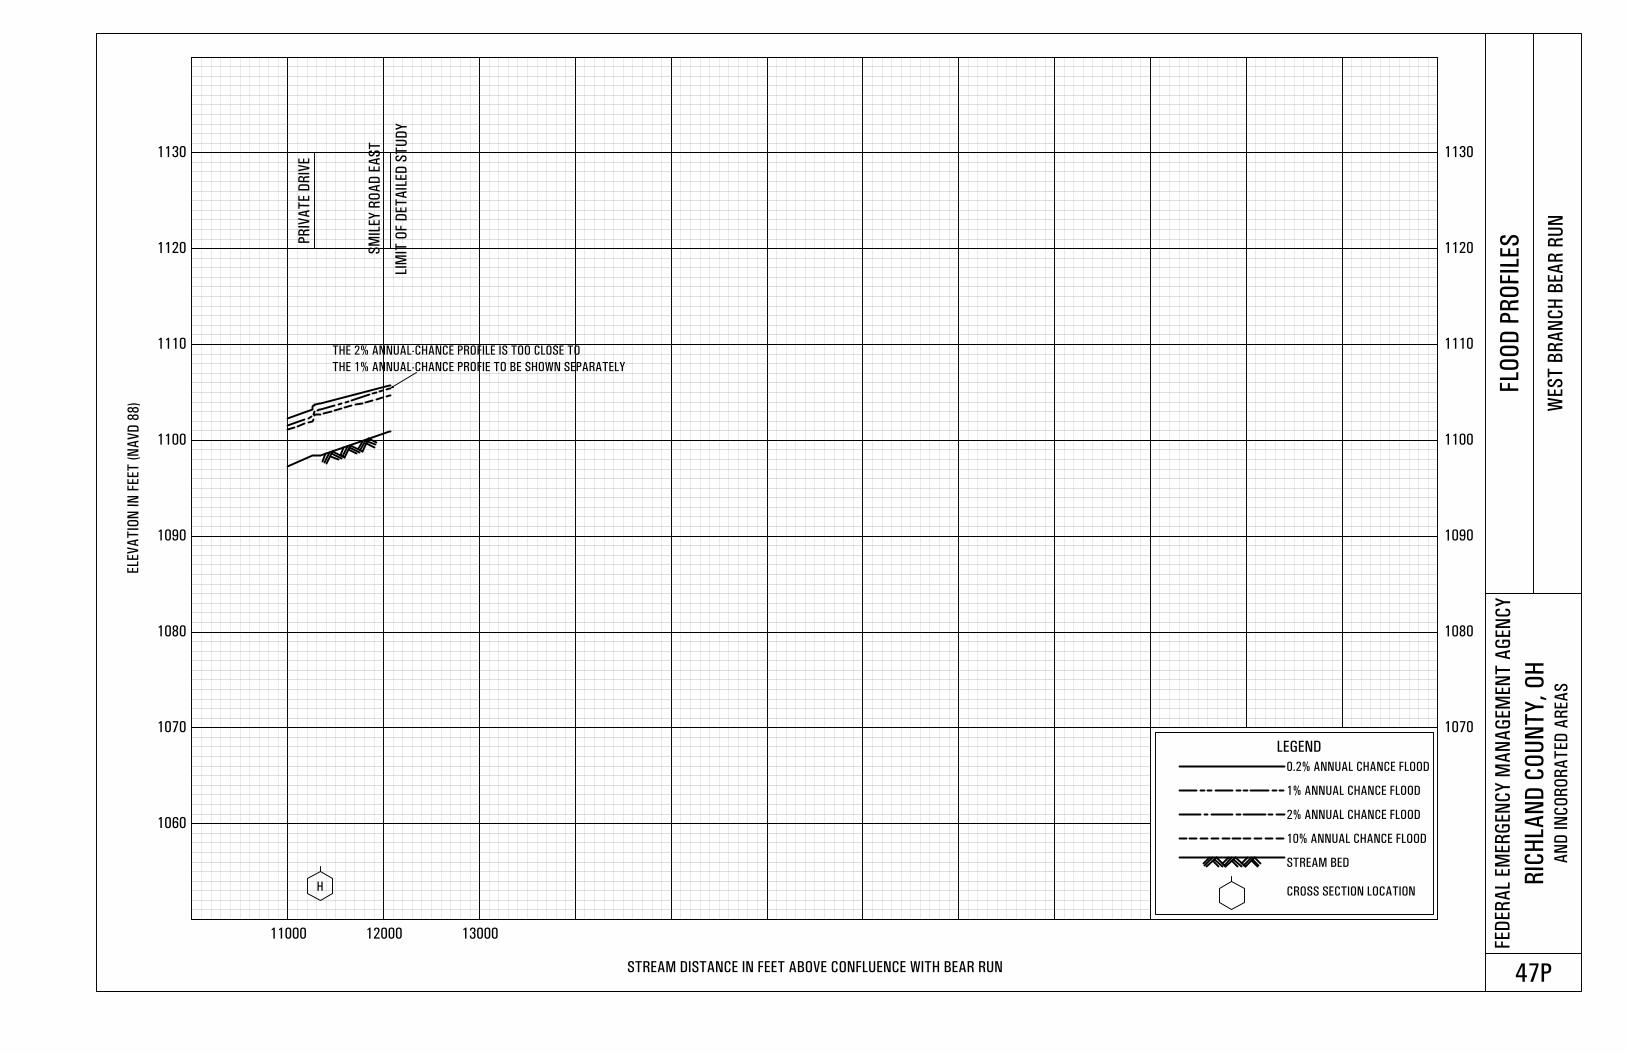
1060
1070 1070
1080 1080
1090 1090
1100 1100
1110 1110
1120 1120
1130 1130
11000 12000 13000
ELE
VA
TIO
N IN
FEET
(N
AV
D 8
8)
STREAM DISTANCE IN FEET ABOVE CONFLUENCE WITH BEAR RUN
FED
ER
AL
EM
ER
GEN
CY
MA
NA
GEM
EN
T A
GEN
CY
RIC
HLA
ND
CO
UN
TY
, O
HA
ND
IN
CO
RO
RA
TED
AR
EA
S
FLO
OD
PR
OFI L
ES
WES
T B
RA
NC
H B
EA
R R
UN
47P
H
PR
IVA
TE D
RIV
E
SM
ILEY
RO
AD
EA
ST
LEGEND
0.2% ANNUAL CHANCE FLOOD
1% ANNUAL CHANCE FLOOD
2% ANNUAL CHANCE FLOOD
10% ANNUAL CHANCE FLOOD
STREAM BED
CROSS SECTION LOCATION
LIM
IT O
F D
ET
AIL
ED
ST
UD
Y
THE 2% ANNUAL-CHANCE PROFILE IS TOO CLOSE TO
THE 1% ANNUAL-CHANCE PROFIE TO BE SHOWN SEPARATELY
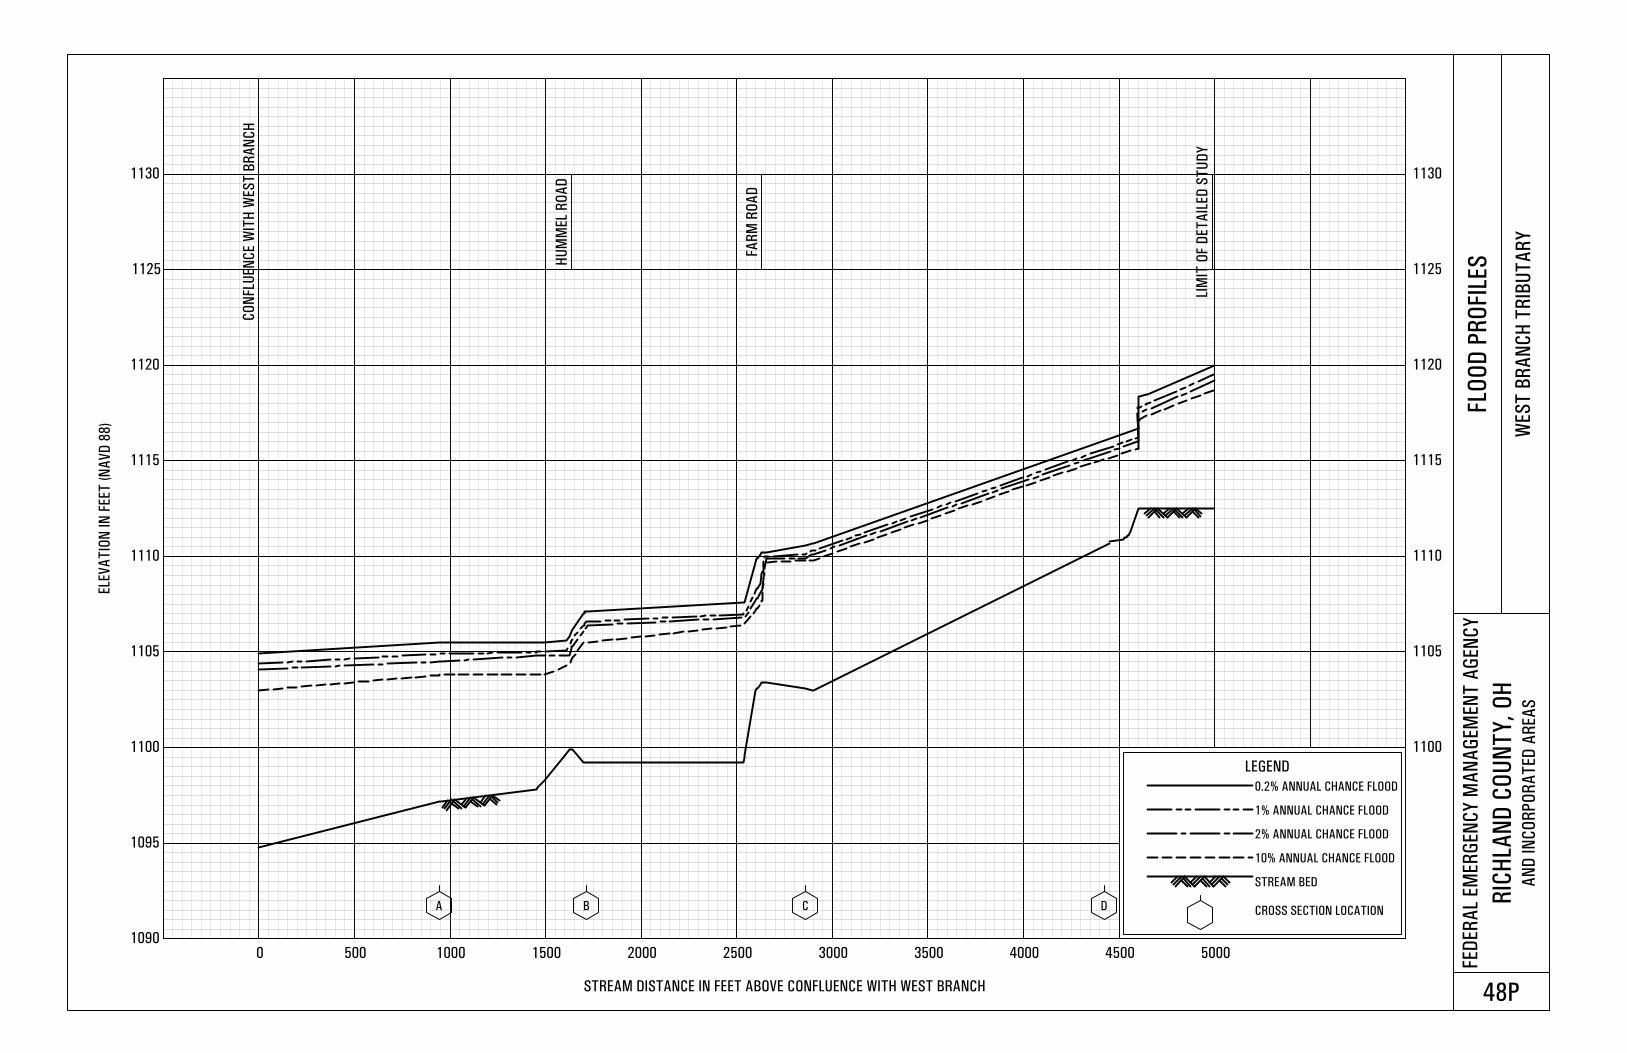
1090
1095
1100 1100
1105 1105
1110 1110
1115 1115
1120 1120
1125 1125
1130 1130
0 500 1000 1500 2000 2500 3000 3500 4000 4500 5000
ELE
VA
TIO
N IN
FEET
(N
AV
D 8
8)
STREAM DISTANCE IN FEET ABOVE CONFLUENCE WITH WEST BRANCH
FED
ER
AL
EM
ER
GEN
CY
MA
NA
GEM
EN
T A
GEN
CY
RIC
HLA
ND
CO
UN
TY
, O
HA
ND
IN
CO
RP
OR
AT
ED
AR
EA
S
FLO
OD
PR
OFI
LES
WES
T B
RA
NC
H T
RIB
UT
AR
Y
48P
A B C D
CO
NFL
UEN
CE W
ITH
WES
T B
RA
NC
H
HU
MM
EL
RO
AD
FAR
M R
OA
D
LIM
IT O
F D
ET
AIL
ED
ST
UD
Y
LEGEND
0.2% ANNUAL CHANCE FLOOD
1% ANNUAL CHANCE FLOOD
2% ANNUAL CHANCE FLOOD
10% ANNUAL CHANCE FLOOD
STREAM BED
CROSS SECTION LOCATION


![State v. Smith - Supreme Court of Ohio · [Cite as State v. Smith, 2012-Ohio-2956.] COURT OF APPEALS RICHLAND COUNTY, OHIO FIFTH APPELLATE DISTRICT STATE OF OHIO Plaintiff-Appellee](https://img.pdfslide.us/doc/110x75/5b5fd5c97f8b9a51328e8a15/state-v-smith-supreme-court-of-cite-as-state-v-smith-2012-ohio-2956.jpg)