Embed Size (px)
Citation preview
INSIGHT
Richardson/Plano
Office Sub-Market www.citadelpartnersus.com 4th Quarter 2015
Office Sub-Market Snapshot Andy Goldston – Advisor
214-420-3168 [email protected]
15770 N Dallas Parkway Suite 950
Dallas, TX 75248 972.980.2800
www.citadelpartnersus.com
This document has been prepared by Citadel Partners, LLC. for advertising and general information only. The
information contained herein is accurate and reliable as of the date of publication; however we do not assume
any liability whatsoever for the accuracy and completeness of the information should it be modified at a later
date by CoStar. Citadel Partners, LLC. makes no guarantees, representations or warranties of any kind,
expressed or implied, regarding the information including, but not limited to, warranties of content, accuracy and
reliability. Any interested party should undertake their own inquiries as to the accuracy of the information.
Citadel Partners, LLC. excludes unequivocally all inferred or implied terms, conditions and warranties arising out
of this document and excludes all liability for loss and damages arising there from. This publication is the
copyrighted property of Citadel Partners, LLC. and/or their licensor(s). All rights reserved.
Q4 2015 (All Classes)
Campbell
ABSORPTION (through Q4)
DELIVERED (through Q4)
2014 517,789 SF 2014 71,711 SF
2015 1,308,650 SF 2015 2,046,638 SF
DIRECT FULL SERVICE RENTAL RATE (Q4) VACANCY (Q4)
2014 $19.55 PSF 2014 13.4%
2015 $22.96 PSF 2015 16.4%
VACANCY BY CLASS (Q4)
Class A 11% Class B 21%
This Richardson/Plano Sub-Market covers the I-75 corridor from Walnut Street to Hedgcoxe Road and includes Central Plano up to Sam Rayburn Tollway to the North until Alma Road when it drops down to Hedgecoxe Road and Coit Road to the West. The included statistics cover Class A and B office buildings that have more than 50,000 square feet and are either under construction or existing. With the continued growth of the D/FW Market, Richardson/Plano is experiencing a resurgence of corporate relocations, growth of businesses within the city and the retail and residential development that comes with it. The Richardson/Plano Sub-Market has shown an increase in the direct Class A vacancy from 6.7% in the fourth quarter of 2014 to 10.9% at the beginning of the fourth quarter of 2015. Meanwhile, direct weighted average full-service rents increased per square foot from $23.26 to $24.09 per square foot during the same time. Class A net absorption remains positive at 1,509,497 square feet through the fourth quarter. Class B vacancy remained relatively stable and sits at 21.3% with full-service rental rates jumping from $18.09 per square foot to $22.36 per square foot. Net absorption in Class B space decreased from 387,126 square feet in 2014 to -292,237 square feet through the fourth quarter of 2015.
Sub-Market Momentum & Forecast
Office Sub-Market Highlights
Office Sub-Market Momentum & Forecast
www.citadelpartnersus.com
Total Office Sub-Market Statistics 4th Quarter 2015
2015 Year-to-Date Market Highlights
Top New Leases Tenant Square Feet 2400 N Glenville Dr. Verizon Building Access 388,600 2201 Lakeside Blvd. RealPage, Inc. 332,653 2280 N Greenville Ave. GEICO 232,710 The Tower Lakeside Campus Frontier Communications 191,534
Deliveries Delivery Date Square Feet State Farm Campus – Bldg A 2015 Q1 667,285 Raytheon Headquarters 2015 Q4 489,000 State Farm Campus – Bldg B 2015 Q1 459,186 State Farm Campus – Bldg C 2015 Q1 431,167
Construction Delivery Date Square Feet State Farm Campus – Bldg D 2016 Q1 500,000 Alcatel-Lucent Regional HQ 2016 Q1 250,000
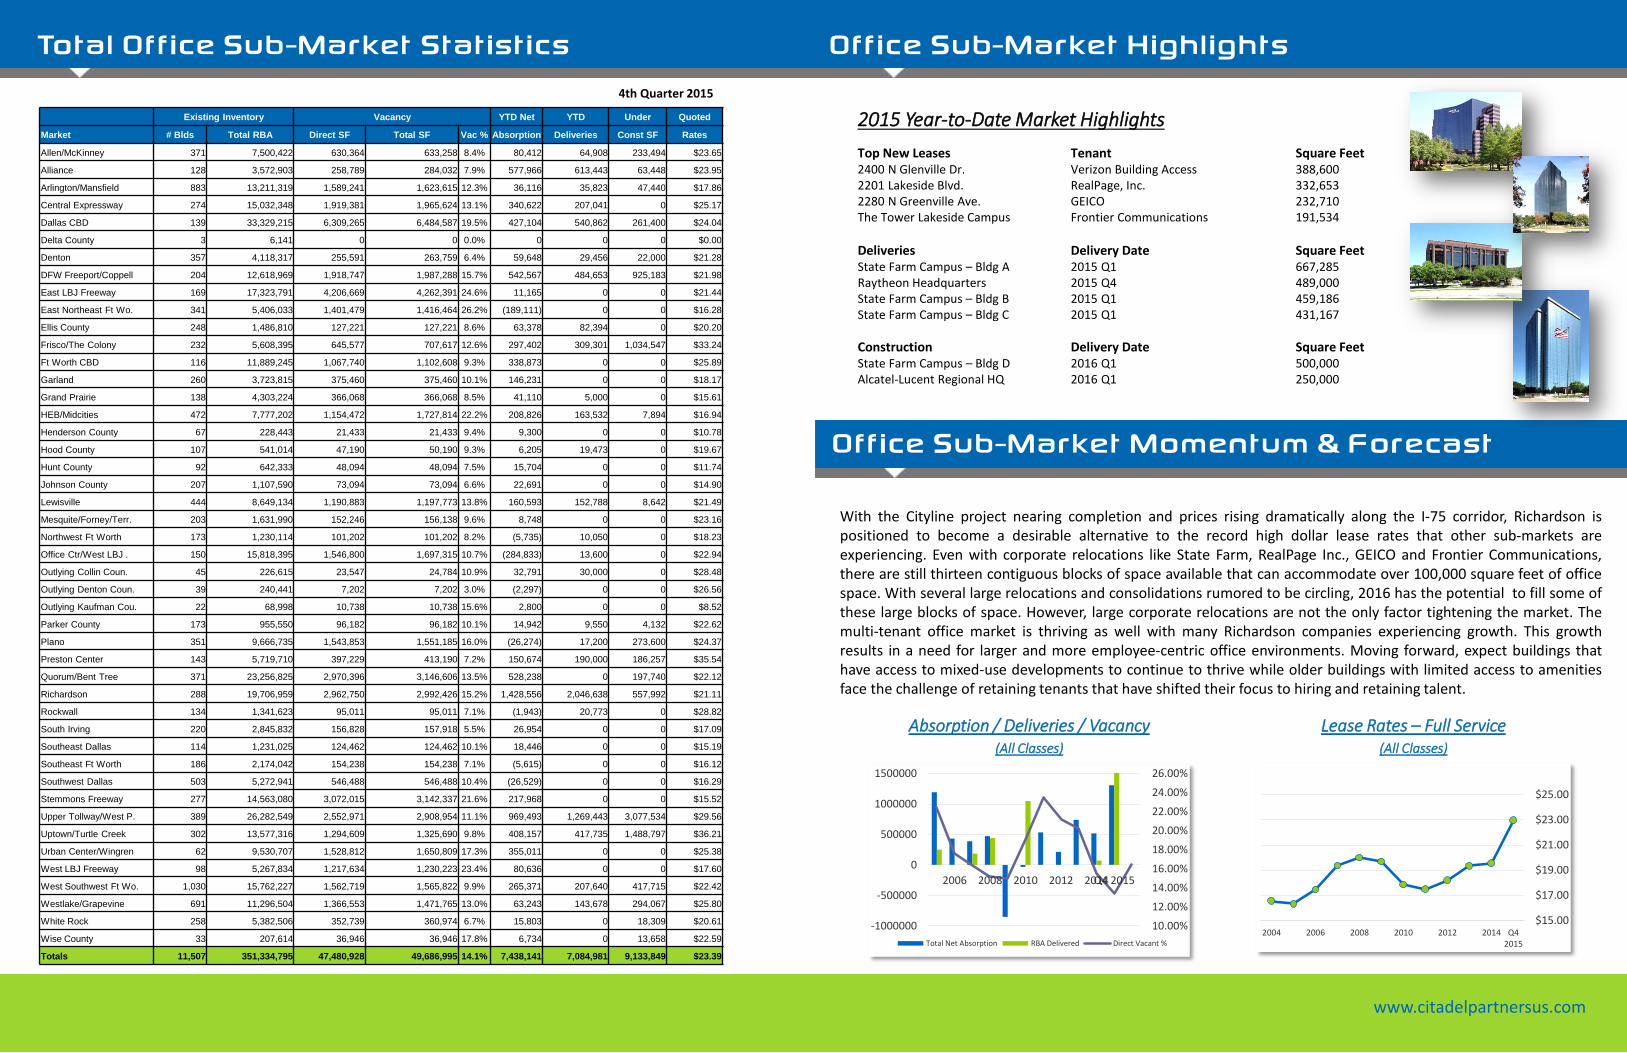
With the Cityline project nearing completion and prices rising dramatically along the I-75 corridor, Richardson is positioned to become a desirable alternative to the record high dollar lease rates that other sub-markets are experiencing. Even with corporate relocations like State Farm, RealPage Inc., GEICO and Frontier Communications, there are still thirteen contiguous blocks of space available that can accommodate over 100,000 square feet of office space. With several large relocations and consolidations rumored to be circling, 2016 has the potential to fill some of these large blocks of space. However, large corporate relocations are not the only factor tightening the market. The multi-tenant office market is thriving as well with many Richardson companies experiencing growth. This growth results in a need for larger and more employee-centric office environments. Moving forward, expect buildings that have access to mixed-use developments to continue to thrive while older buildings with limited access to amenities face the challenge of retaining tenants that have shifted their focus to hiring and retaining talent.
Lease Rates – Full Service (All Classes)
Absorption / Deliveries / Vacancy (All Classes)
10.00%
12.00%
14.00%
16.00%
18.00%
20.00%
22.00%
24.00%
26.00%
-1000000
-500000
0
500000
1000000
1500000
2006 2008 2010 2012 2014Q4 2015
Total Net Absorption RBA Delivered Direct Vacant %
$15.00
$17.00
$19.00
$21.00
$23.00
$25.00
2004 2006 2008 2010 2012 2014 Q42015
Existing Inventory Vacancy YTD Net YTD Under Quoted
Market # Blds Total RBA Direct SF Total SF Vac % Absorption Deliveries Const SF Rates
Allen/McKinney 371 7,500,422 630,364 633,258 8.4% 80,412 64,908 233,494 $23.65
Alliance 128 3,572,903 258,789 284,032 7.9% 577,966 613,443 63,448 $23.95
Arlington/Mansfield 883 13,211,319 1,589,241 1,623,615 12.3% 36,116 35,823 47,440 $17.86
Central Expressway 274 15,032,348 1,919,381 1,965,624 13.1% 340,622 207,041 0 $25.17
Dallas CBD 139 33,329,215 6,309,265 6,484,587 19.5% 427,104 540,862 261,400 $24.04
Delta County 3 6,141 0 0 0.0% 0 0 0 $0.00
Denton 357 4,118,317 255,591 263,759 6.4% 59,648 29,456 22,000 $21.28
DFW Freeport/Coppell 204 12,618,969 1,918,747 1,987,288 15.7% 542,567 484,653 925,183 $21.98
East LBJ Freeway 169 17,323,791 4,206,669 4,262,391 24.6% 11,165 0 0 $21.44
East Northeast Ft Wo. 341 5,406,033 1,401,479 1,416,464 26.2% (189,111) 0 0 $16.28
Ellis County 248 1,486,810 127,221 127,221 8.6% 63,378 82,394 0 $20.20
Frisco/The Colony 232 5,608,395 645,577 707,617 12.6% 297,402 309,301 1,034,547 $33.24
Ft Worth CBD 116 11,889,245 1,067,740 1,102,608 9.3% 338,873 0 0 $25.89
Garland 260 3,723,815 375,460 375,460 10.1% 146,231 0 0 $18.17
Grand Prairie 138 4,303,224 366,068 366,068 8.5% 41,110 5,000 0 $15.61
HEB/Midcities 472 7,777,202 1,154,472 1,727,814 22.2% 208,826 163,532 7,894 $16.94
Henderson County 67 228,443 21,433 21,433 9.4% 9,300 0 0 $10.78
Hood County 107 541,014 47,190 50,190 9.3% 6,205 19,473 0 $19.67
Hunt County 92 642,333 48,094 48,094 7.5% 15,704 0 0 $11.74
Johnson County 207 1,107,590 73,094 73,094 6.6% 22,691 0 0 $14.90
Lewisville 444 8,649,134 1,190,883 1,197,773 13.8% 160,593 152,788 8,642 $21.49
Mesquite/Forney/Terr. 203 1,631,990 152,246 156,138 9.6% 8,748 0 0 $23.16
Northwest Ft Worth 173 1,230,114 101,202 101,202 8.2% (5,735) 10,050 0 $18.23
Office Ctr/West LBJ . 150 15,818,395 1,546,800 1,697,315 10.7% (284,833) 13,600 0 $22.94
Outlying Collin Coun. 45 226,615 23,547 24,784 10.9% 32,791 30,000 0 $28.48
Outlying Denton Coun. 39 240,441 7,202 7,202 3.0% (2,297) 0 0 $26.56
Outlying Kaufman Cou. 22 68,998 10,738 10,738 15.6% 2,800 0 0 $8.52
Parker County 173 955,550 96,182 96,182 10.1% 14,942 9,550 4,132 $22.62
Plano 351 9,666,735 1,543,853 1,551,185 16.0% (26,274) 17,200 273,600 $24.37
Preston Center 143 5,719,710 397,229 413,190 7.2% 150,674 190,000 186,257 $35.54
Quorum/Bent Tree 371 23,256,825 2,970,396 3,146,606 13.5% 528,238 0 197,740 $22.12
Richardson 288 19,706,959 2,962,750 2,992,426 15.2% 1,428,556 2,046,638 557,992 $21.11
Rockwall 134 1,341,623 95,011 95,011 7.1% (1,943) 20,773 0 $28.82
South Irving 220 2,845,832 156,828 157,918 5.5% 26,954 0 0 $17.09
Southeast Dallas 114 1,231,025 124,462 124,462 10.1% 18,446 0 0 $15.19
Southeast Ft Worth 186 2,174,042 154,238 154,238 7.1% (5,615) 0 0 $16.12
Southwest Dallas 503 5,272,941 546,488 546,488 10.4% (26,529) 0 0 $16.29
Stemmons Freeway 277 14,563,080 3,072,015 3,142,337 21.6% 217,968 0 0 $15.52
Upper Tollway/West P. 389 26,282,549 2,552,971 2,908,954 11.1% 969,493 1,269,443 3,077,534 $29.56
Uptown/Turtle Creek 302 13,577,316 1,294,609 1,325,690 9.8% 408,157 417,735 1,488,797 $36.21
Urban Center/Wingren 62 9,530,707 1,528,812 1,650,809 17.3% 355,011 0 0 $25.38
West LBJ Freeway 98 5,267,834 1,217,634 1,230,223 23.4% 80,636 0 0 $17.60
West Southwest Ft Wo. 1,030 15,762,227 1,562,719 1,565,822 9.9% 265,371 207,640 417,715 $22.42
Westlake/Grapevine 691 11,296,504 1,366,553 1,471,765 13.0% 63,243 143,678 294,067 $25.80
White Rock 258 5,382,506 352,739 360,974 6.7% 15,803 0 18,309 $20.61
Wise County 33 207,614 36,946 36,946 17.8% 6,734 0 13,658 $22.59
Totals 11,507 351,334,795 47,480,928 49,686,995 14.1% 7,438,141 7,084,981 9,133,849 $23.39