Embed Size (px)
Citation preview

Richard Taylor, Thomas Civil & Environmental Consultants
h
PWC’15 September 2015
Developing a Non- Revenue Water Strategy
Let’s look at the IWA Standard Water Balance
Firstly, how do we define Non-Revenue Water?

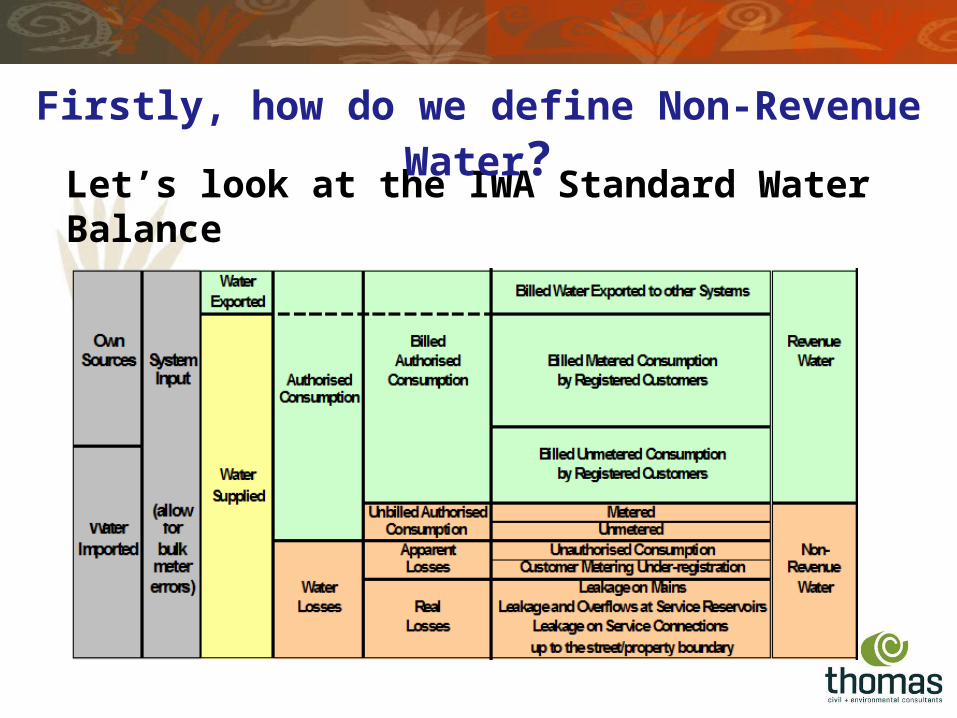
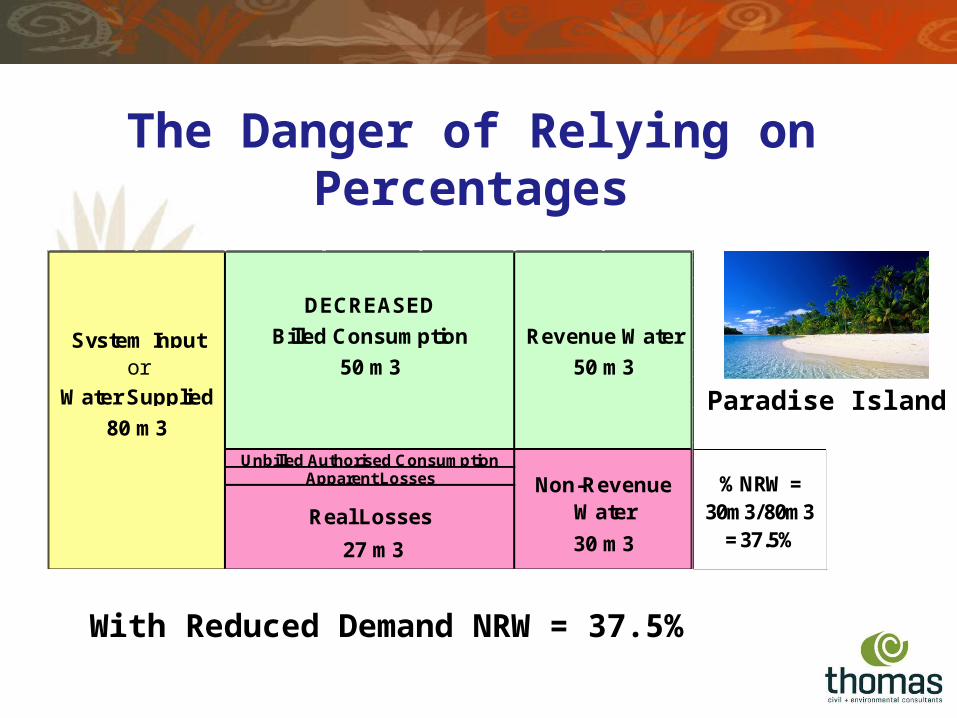
The Danger of Relying on Percentages
Paradise Island
The Danger of Relying on Percentages
27 m3
Real Losses30 m3
Unbilled Authorised Consumption% NRW =
30m3/100m3 = 30%
Apparent Losses Non-Revenue Water
Water Supplied
100 m3
System Input Billed Consumption Revenue Water
or 70 m3 70 m3
Paradise Island
At Normal Demand NRW = 30%
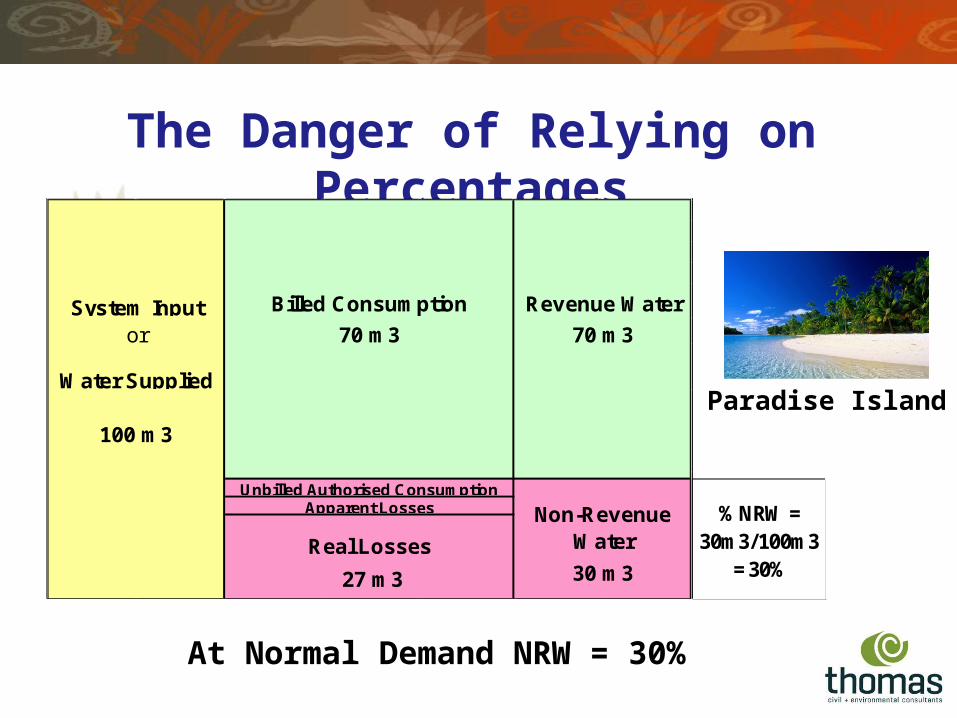
The Danger of Relying on Percentages
27 m3
Real Losses30 m3
Unbilled Authorised Consumption% NRW =
30m3/120m3 = 25%
Apparent Losses Non-Revenue Water
Water Supplied
120 m3
System Input Billed Consumption Revenue Water
or 90 m3 90 m3
INCREASED
Paradise Island
With Increased Demand NRW = 25%
The Danger of Relying on Percentages
27 m3
Real Losses30 m3
Unbilled Authorised Consumption% NRW =
30m3/80m3 = 37.5%
Apparent Losses Non-Revenue Water
Water Supplied
80 m3
System Input Billed Consumption Revenue Water
or 50 m3 50 m3
DECREASED
Paradise Island
With Reduced Demand NRW = 37.5%
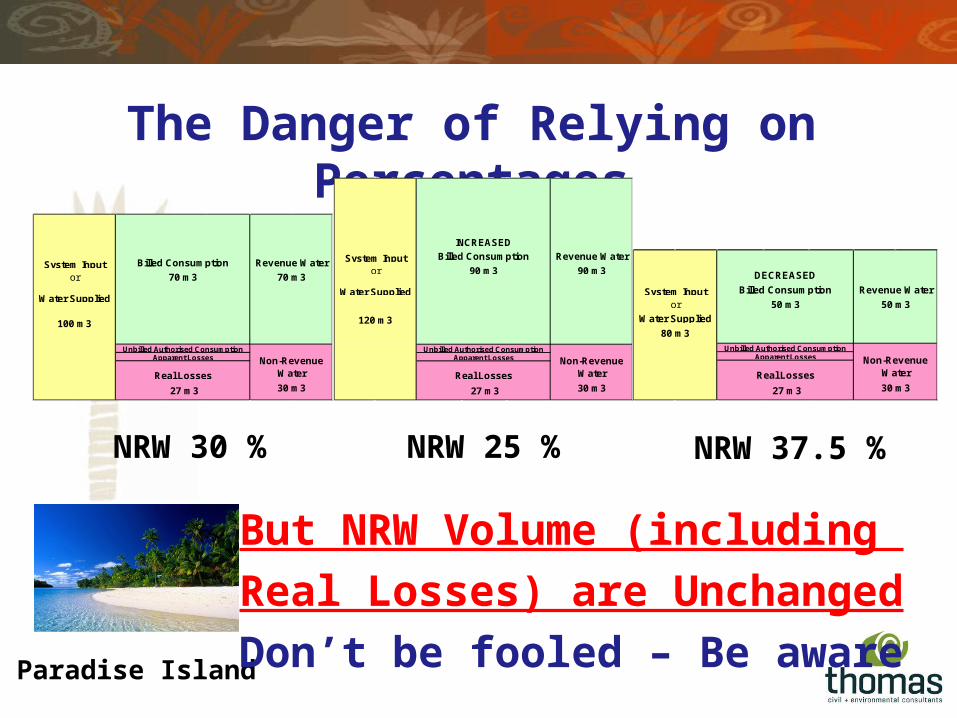
The Danger of Relying on Percentages
Paradise Island
27 m3
Real Losses30 m3
Unbilled Authorised ConsumptionApparent Losses Non-Revenue
Water
Water Supplied
120 m3
System Input Billed Consumption Revenue Water
or 90 m3 90 m3
INCREASED
27 m3
Real Losses30 m3
Unbilled Authorised ConsumptionApparent Losses Non-Revenue
Water
Water Supplied
100 m3
System Input Billed Consumption Revenue Water
or 70 m3 70 m3
NRW 30 % NRW 25 % NRW 37.5 %
But NRW Volume (including
Real Losses) are Unchanged
Don’t be fooled – Be aware
27 m3
Real Losses30 m3
Unbilled Authorised ConsumptionApparent Losses Non-Revenue
Water
Water Supplied
80 m3
System Input Billed Consumption Revenue Water
or 50 m3 50 m3
DECREASED
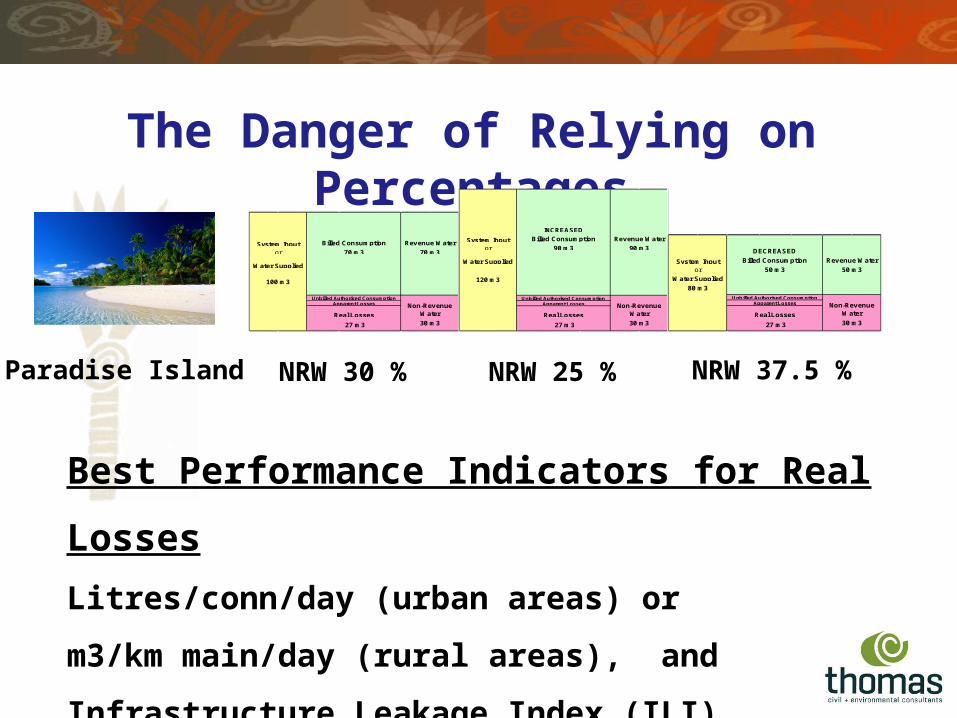
Best Performance Indicators for Real Losses
Litres/conn/day (urban areas) or
m3/km main/day (rural areas), and
Infrastructure Leakage Index (ILI)
The Danger of Relying on Percentages
Paradise Island NRW 30 % NRW 25 % NRW 37.5 %
27 m3
Real Losses30 m3
Unbilled Authorised ConsumptionApparent Losses Non-Revenue
Water
Water Supplied
120 m3
System Input Billed Consumption Revenue Water
or 90 m3 90 m3
INCREASED
27 m3
Real Losses30 m3
Unbilled Authorised ConsumptionApparent Losses Non-Revenue
Water
Water Supplied
100 m3
System Input Billed Consumption Revenue Water
or 70 m3 70 m3
27 m3
Real Losses30 m3
Unbilled Authorised ConsumptionApparent Losses Non-Revenue
Water
Water Supplied
80 m3
System Input Billed Consumption Revenue Water
or 50 m3 50 m3
DECREASED
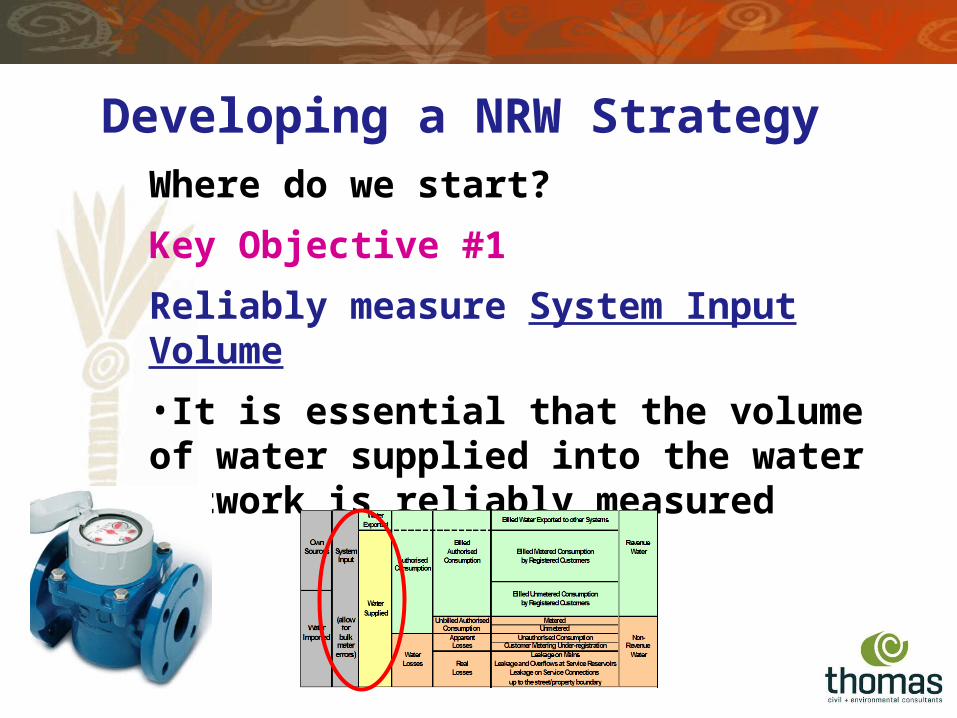
Where do we start?
Key Objective #1
Reliably measure System Input Volume
•It is essential that the volume of water supplied into the water network is reliably measured
Developing a NRW Strategy

Key Objective #1 Continued
Reliably measure System Input Volume
•Is a suitably sized meter installed?
•Is it installed correctly?
•Is ‘air’ an issue?
•Is data being accurately recorded?
Developing a NRW Strategy
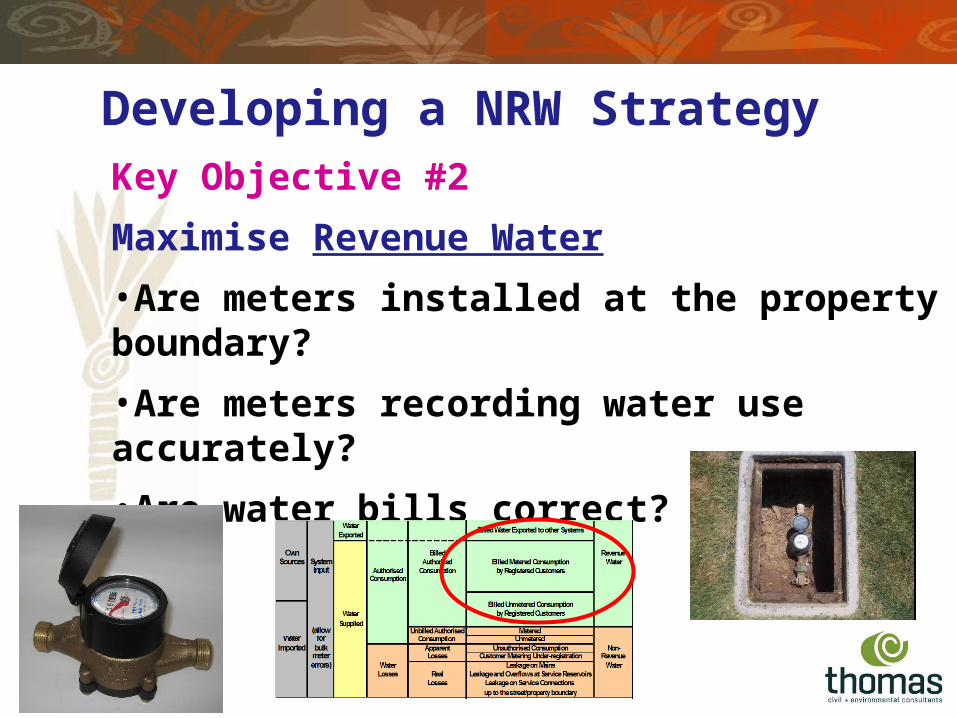
Key Objective #2
Maximise Revenue Water
•Are meters installed at the property boundary?
•Are meters recording water use accurately?
•Are water bills correct?
Developing a NRW Strategy
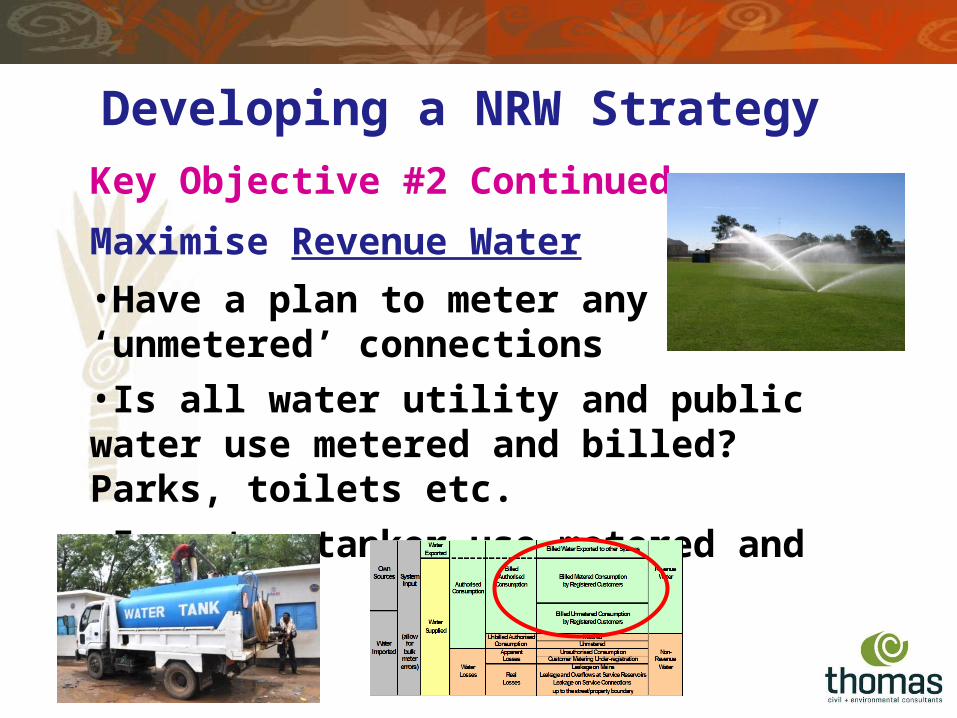
Key Objective #2 Continued
Maximise Revenue Water
•Have a plan to meter any ‘unmetered’ connections
•Is all water utility and public water use metered and billed? Parks, toilets etc.
•Is water tanker use metered and billed?
Developing a NRW Strategy
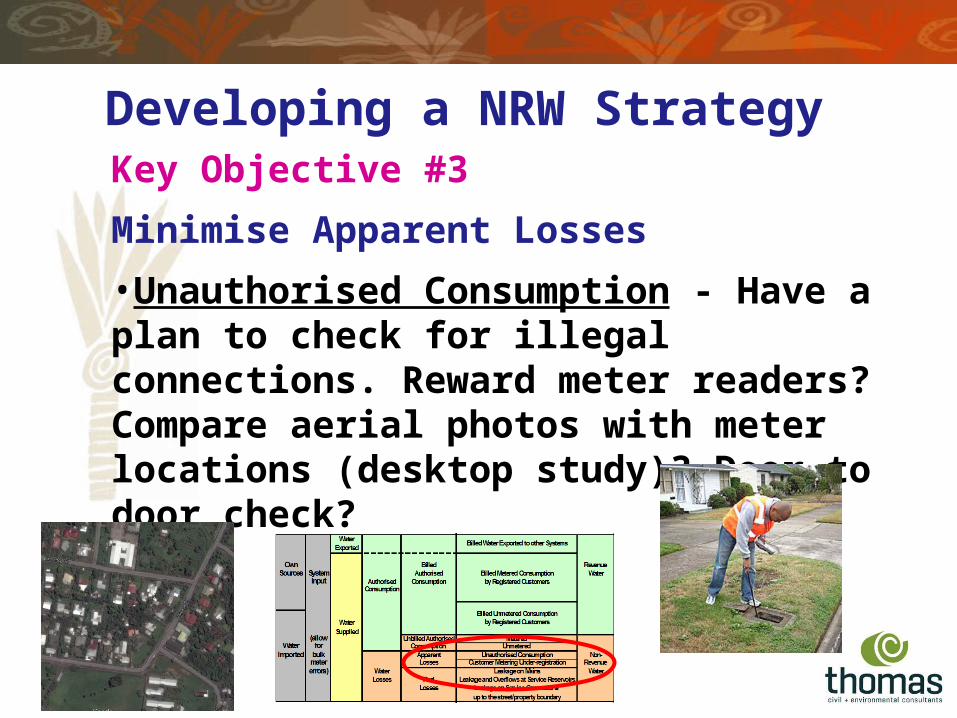
Key Objective #3
Minimise Apparent Losses
•Unauthorised Consumption - Have a plan to check for illegal connections. Reward meter readers? Compare aerial photos with meter locations (desktop study)? Door to door check?
Developing a NRW Strategy
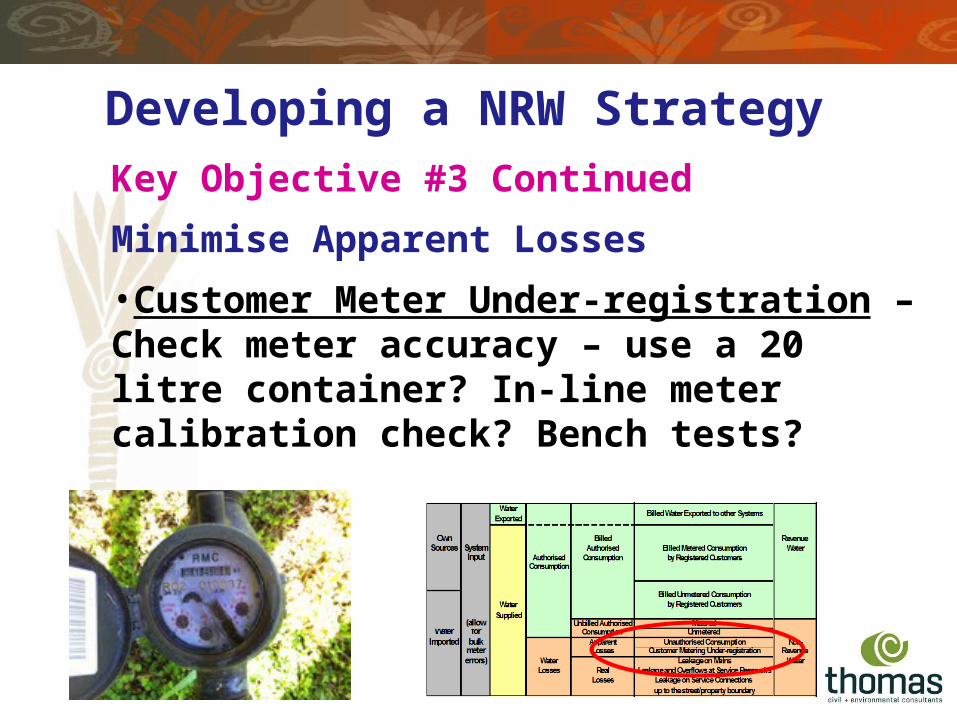
Key Objective #3 Continued
Minimise Apparent Losses
•Customer Meter Under-registration – Check meter accuracy – use a 20 litre container? In-line meter calibration check? Bench tests?
Developing a NRW Strategy
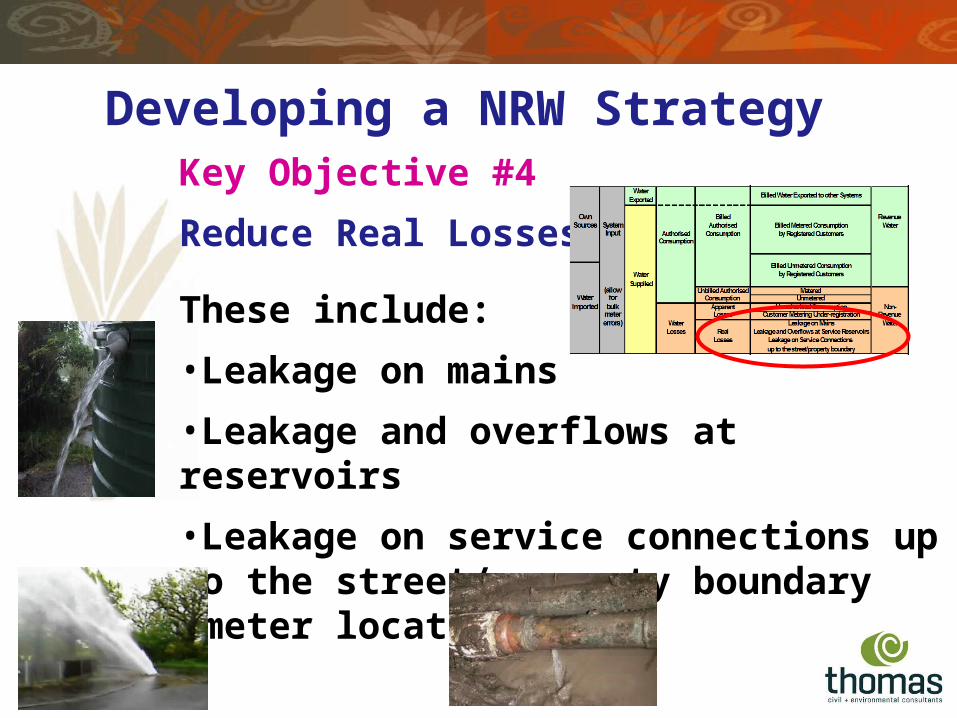
Key Objective #4
Reduce Real Losses
These include:
•Leakage on mains
•Leakage and overflows at reservoirs
•Leakage on service connections up to the street/property boundary (meter location)
Developing a NRW Strategy

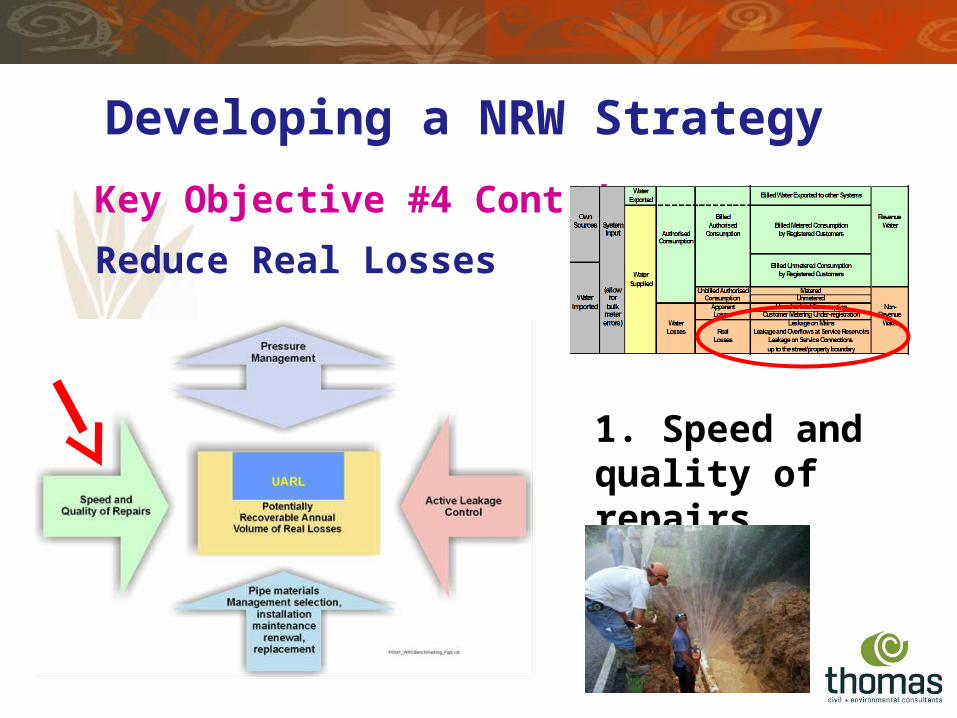
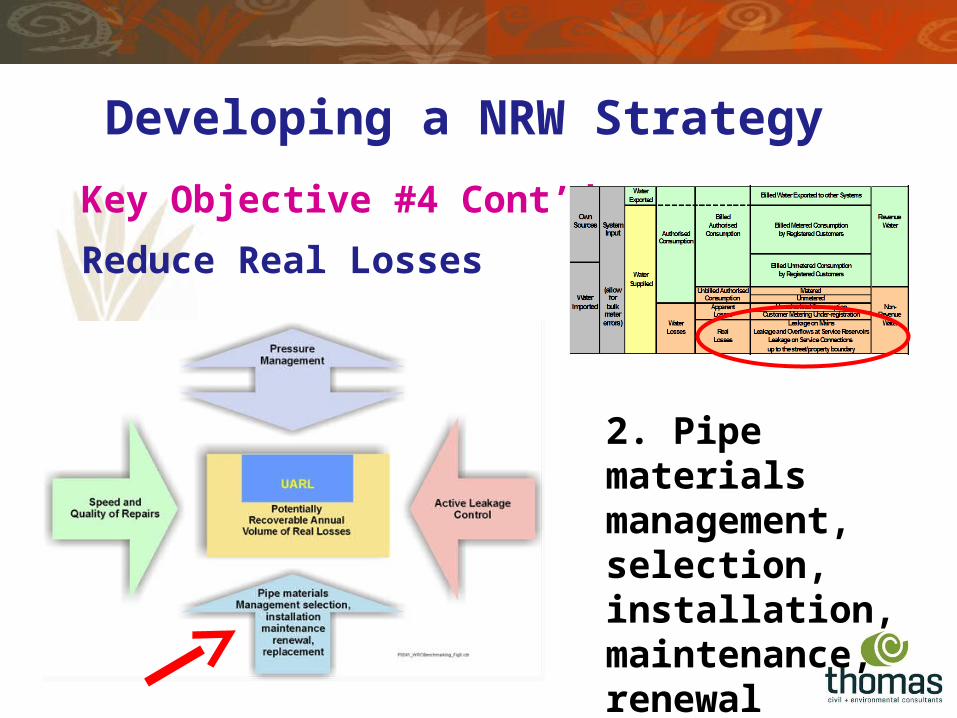
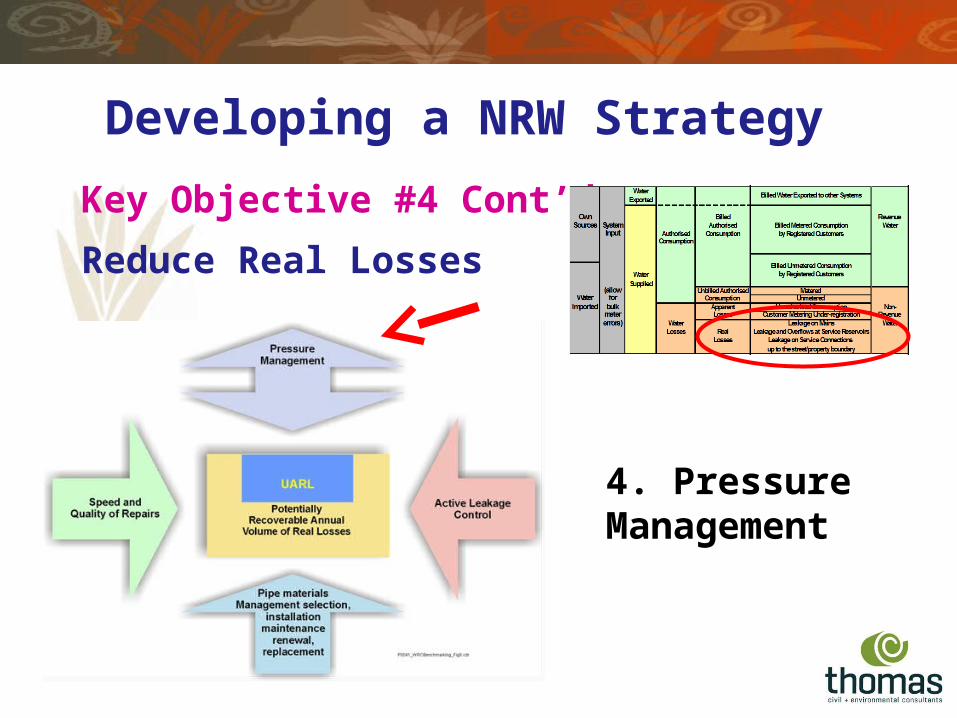
Key Objective #4 Cont’d
Reduce Real Losses
Developing a NRW Strategy
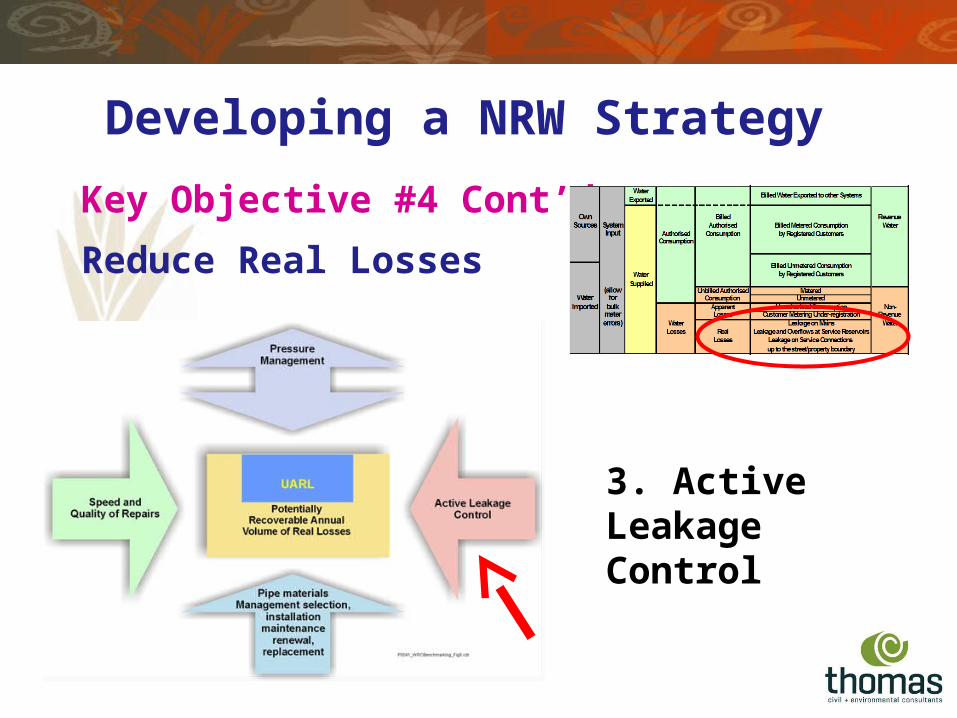
The Four ComplementaryLeakage Management Activities
Key Objective #4 Cont’d
Reduce Real Losses
Developing a NRW Strategy
1. Speed and quality of repairs
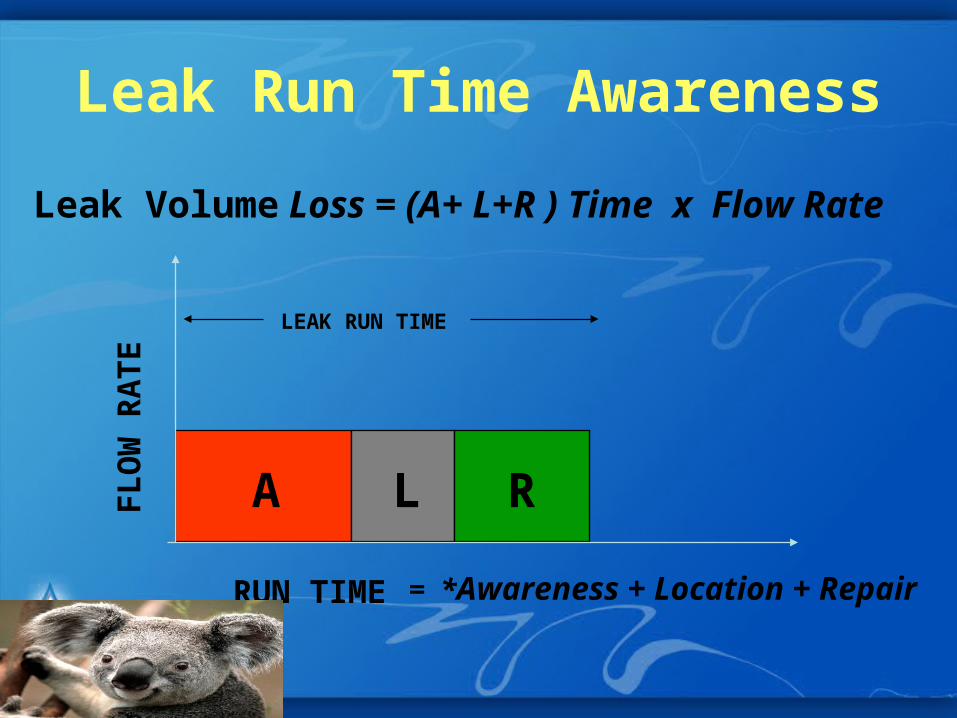
Leak Run Time Awareness
A L R
LEAK RUN TIME
FL
OW
RA
TE
RUN TIME
Leak Volume Loss = (A+ L+R ) Time x Flow Rate
= *Awareness + Location + Repair
m3
/ day
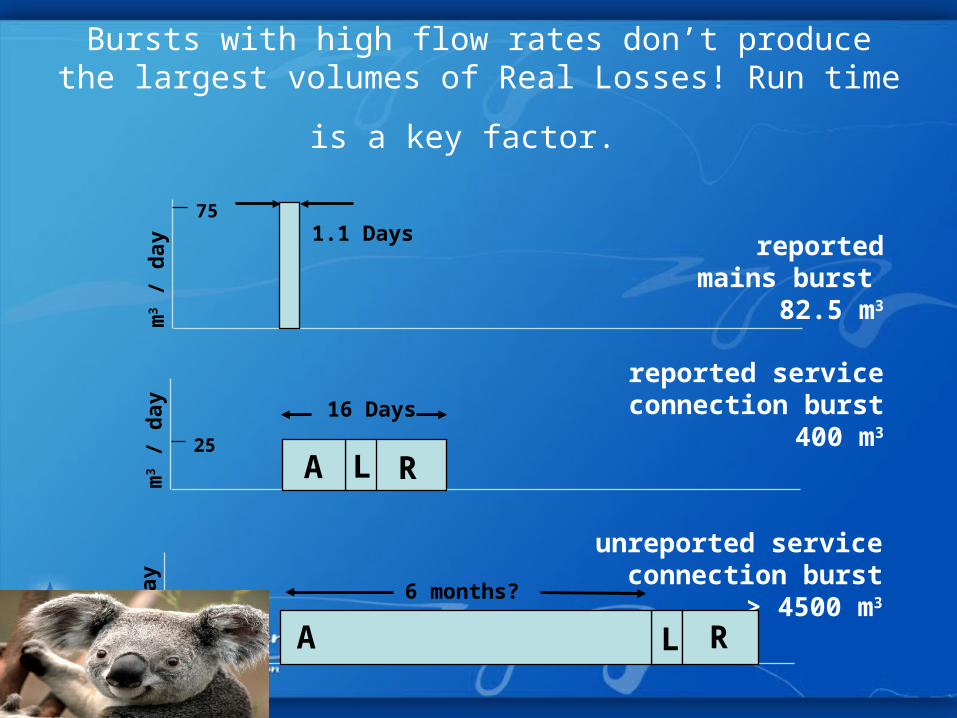
75
reported mains burst
82.5 m3
1.1 Days
Lm3
/ day
unreported serviceconnection burst
> 4500 m3256 months?
RA
m3
/ day 16 Days
reported service connection burst
400 m325
RLA
Bursts with high flow rates don’t produce the largest
volumes of Real Losses! Run time is a key factor.
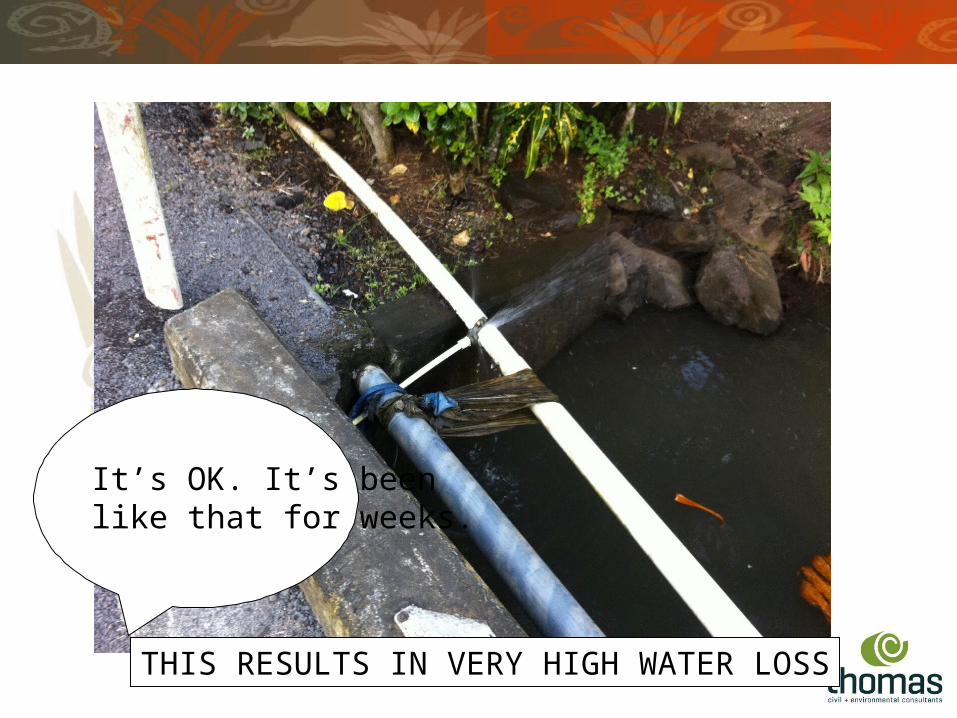
It’s OK. It’s been like that for weeks.
THIS RESULTS IN VERY HIGH WATER LOSS
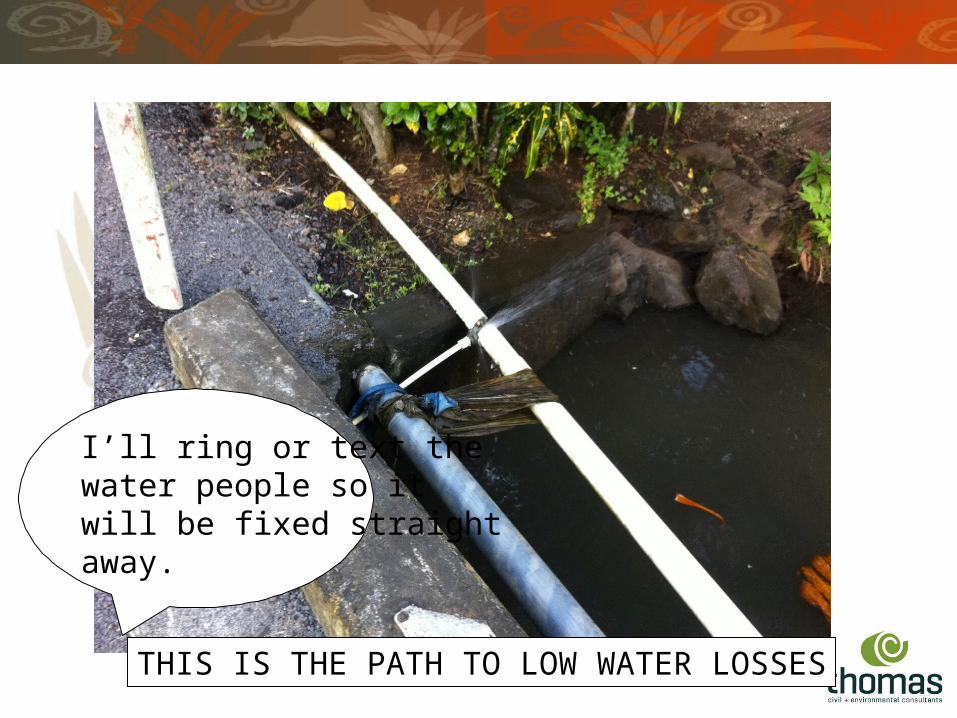
I’ll ring or text the water people so it will be fixed straight away.
THIS IS THE PATH TO LOW WATER LOSSES
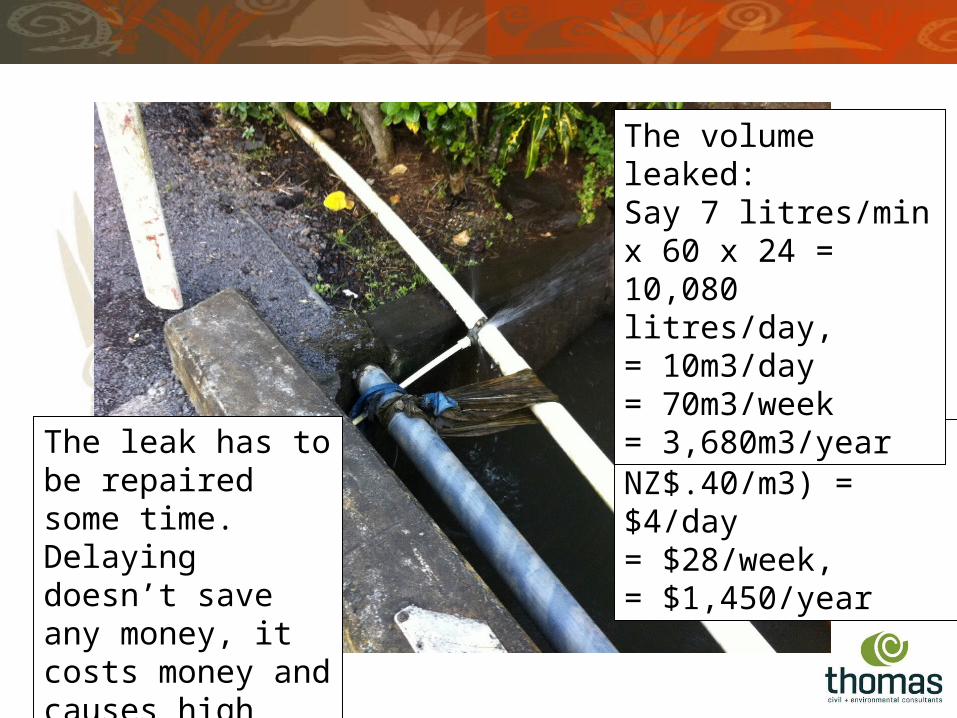
The cost (at NZ$.40/m3) = $4/day= $28/week, = $1,450/year
The leak has to be repaired some time. Delaying doesn’t save any money, it costs money and causes high leakage (and high NRW)
The volume leaked:Say 7 litres/min x 60 x 24 = 10,080 litres/day,= 10m3/day= 70m3/week = 3,680m3/year
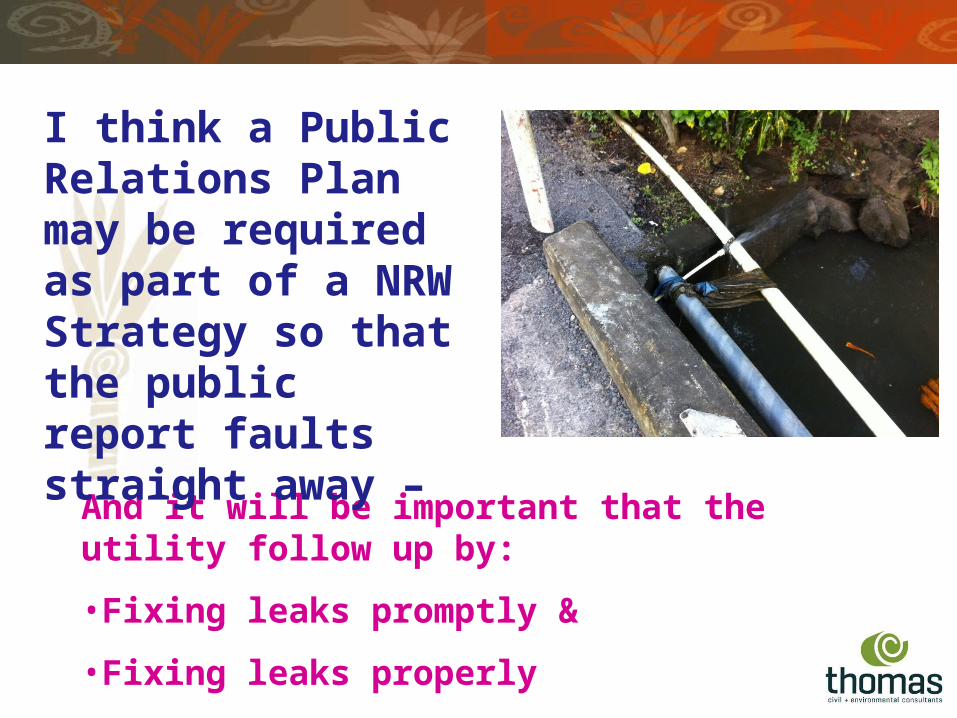
And it will be important that the utility follow up by:
•Fixing leaks promptly &
•Fixing leaks properly
I think a Public Relations Planmay be required as part of a NRW Strategy so that the public report faults straight away –
Key Objective #4 Cont’d
Reduce Real Losses
Developing a NRW Strategy
2. Pipe materials management, selection, installation, maintenance, renewal
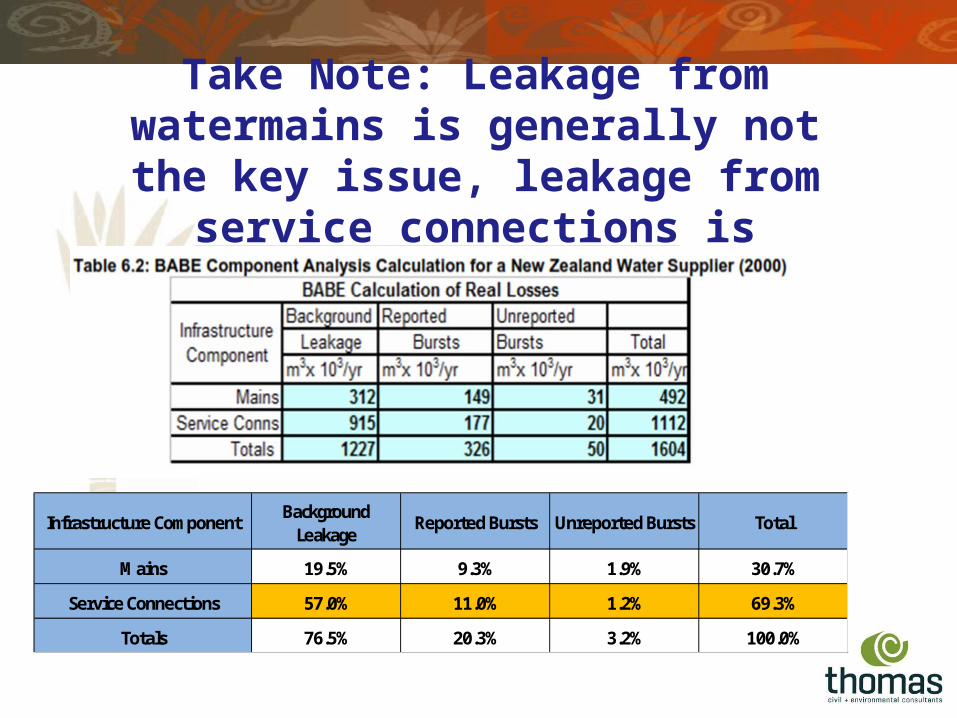
Take Note: Leakage from watermains is generally not the key issue, leakage
from service connections is
Infrastructure ComponentBackground
LeakageReported Bursts Unreported Bursts Total
Mains 19.5% 9.3% 1.9% 30.7%
Service Connections 57.0% 11.0% 1.2% 69.3%
Totals 76.5% 20.3% 3.2% 100.0%
Key Objective #4 Cont’d
Reduce Real Losses
Developing a NRW Strategy
3. Active Leakage Control
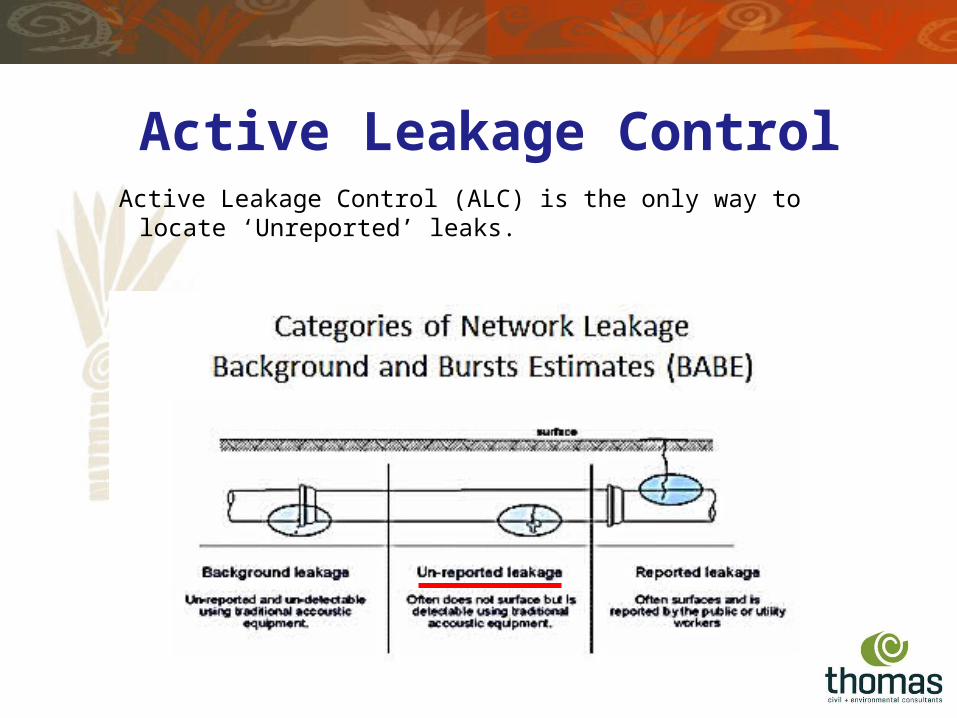
Active Leakage ControlActive Leakage Control (ALC) is the only way to locate ‘Unreported’
leaks.
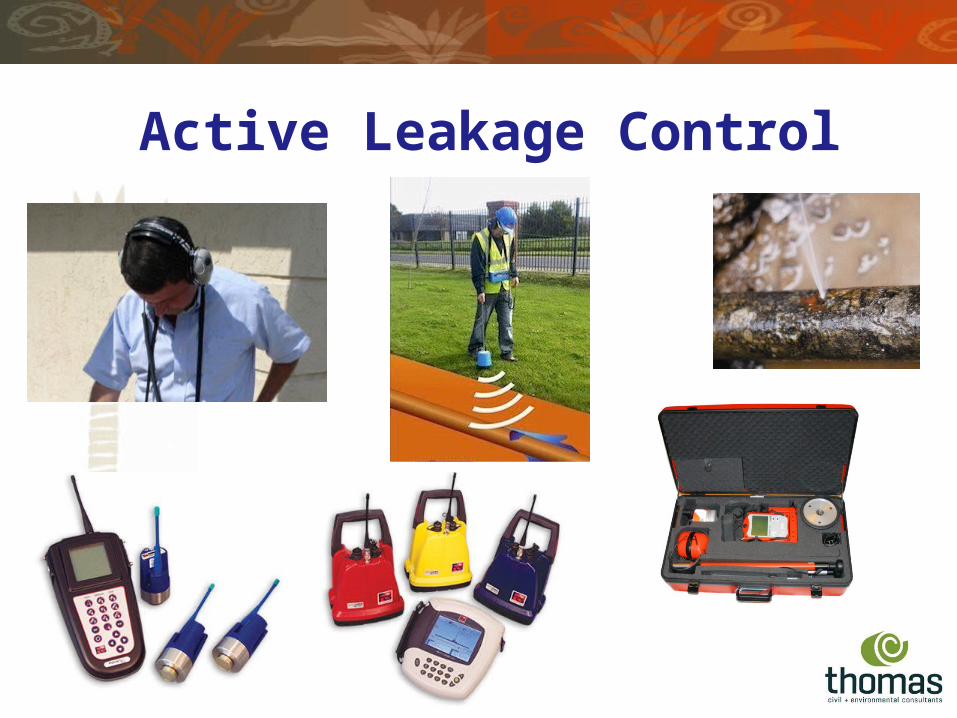
Active Leakage Control
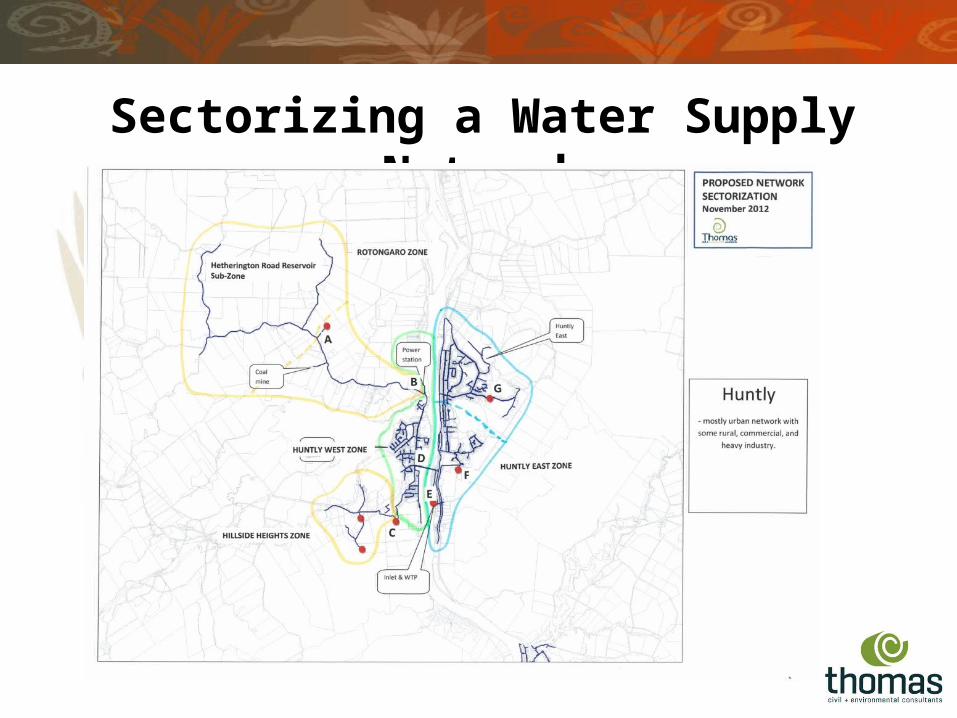
Sectorizing a Water Supply Network
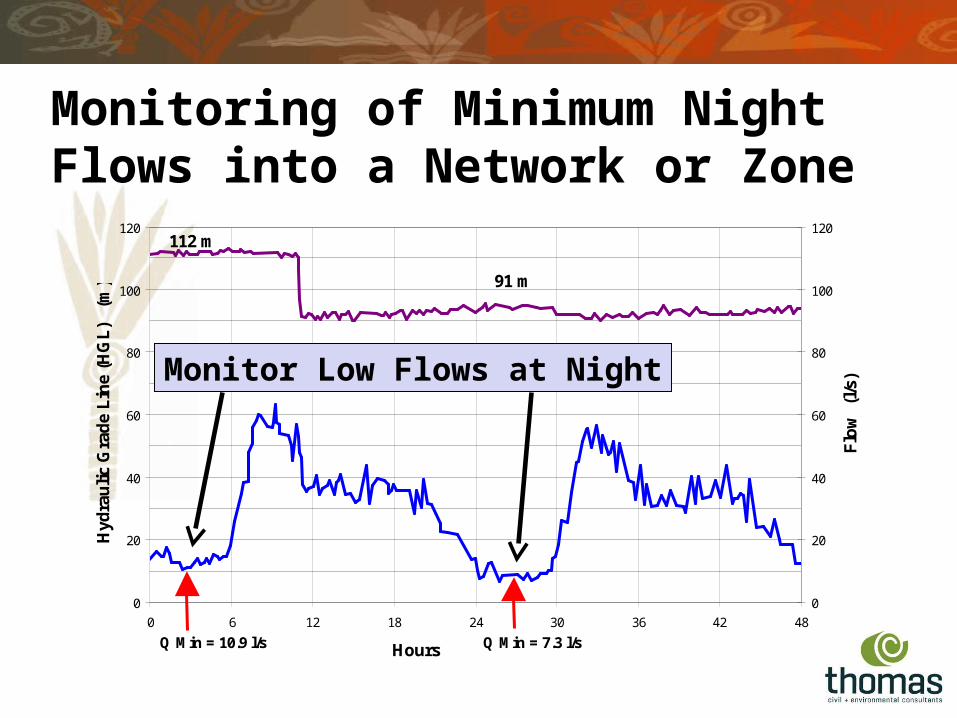
Monitoring of Minimum Night Flows into a Network or Zone
0
20
40
60
80
100
120
0 6 12 18 24 30 36 42 48
Hours
Hyd
rau
lic
Gra
de
Lin
e (H
GL
)
(m)
0
20
40
60
80
100
120
Flo
w
(l/s
)
112 m
91 m
Q Min = 10.9 l/s Q Min = 7.3 l/s
Monitor Low Flows at Night
Key Objective #4 Cont’d
Reduce Real Losses
Developing a NRW Strategy
4. Pressure Management
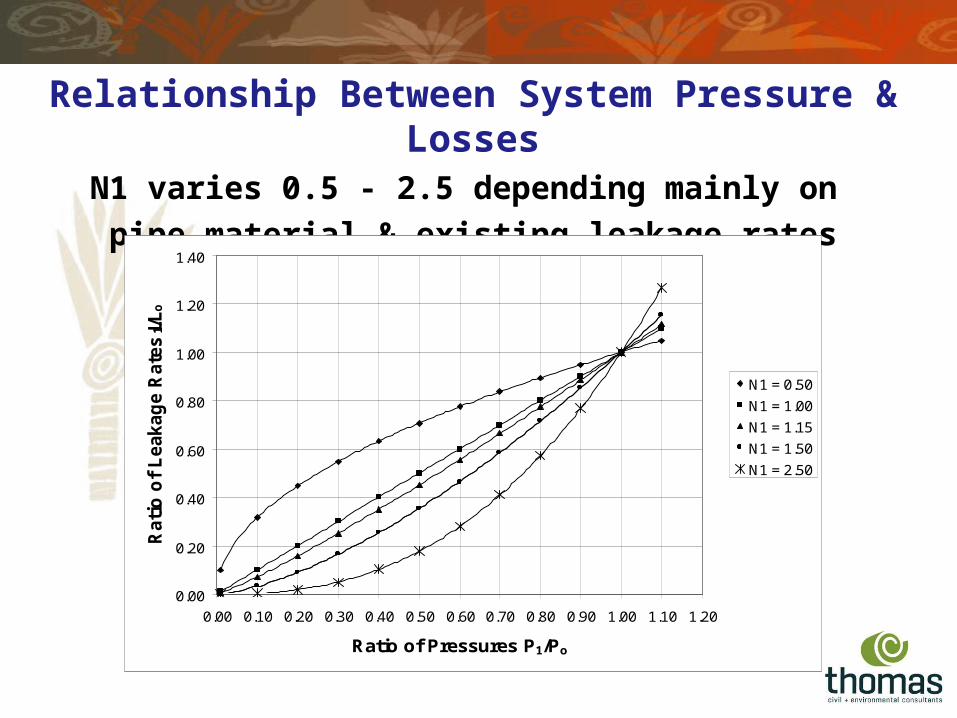
Relationship Between System Pressure & LossesN1 varies 0.5 - 2.5 depending mainly on
pipe material & existing leakage rates
0.00
0.20
0.40
0.60
0.80
1.00
1.20
1.40
0.00 0.10 0.20 0.30 0.40 0.50 0.60 0.70 0.80 0.90 1.00 1.10 1.20
Ratio of Pressures P1/Po
Rati
o o
f L
eakag
e R
ate
s L 1/
Lo
N1 = 0.50
N1 = 1.00
N1 = 1.15
N1 = 1.50
N1 = 2.50
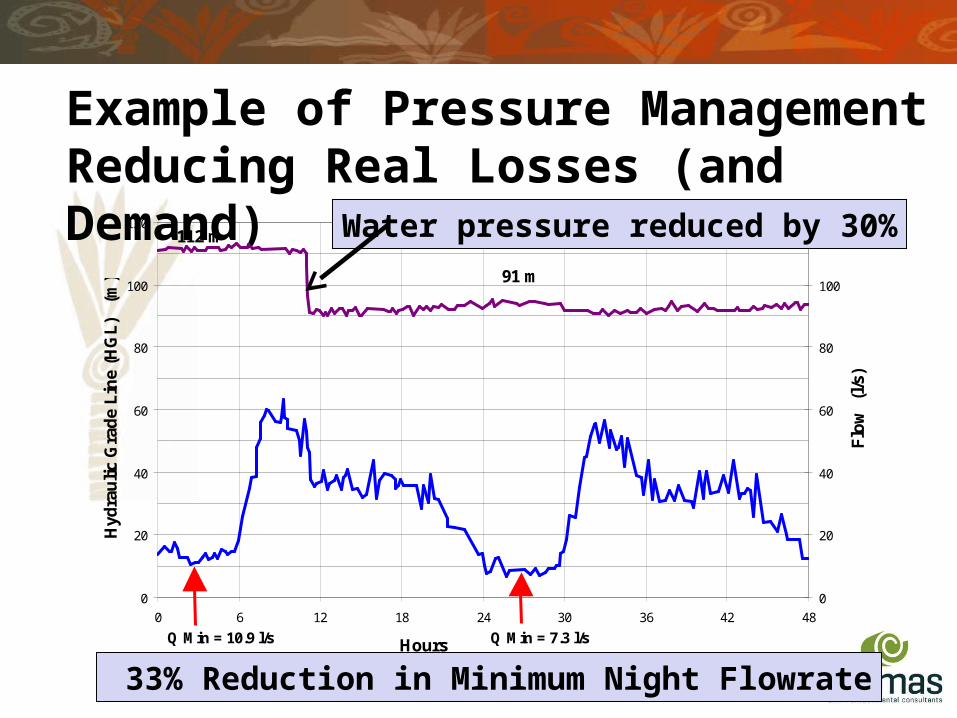
Example of Pressure Management Reducing Real Losses (and Demand)
0
20
40
60
80
100
120
0 6 12 18 24 30 36 42 48
Hours
Hyd
rau
lic
Gra
de
Lin
e (H
GL
)
(m)
0
20
40
60
80
100
120
Flo
w
(l/s
)
112 m
91 m
Q Min = 10.9 l/s Q Min = 7.3 l/s
Water pressure reduced by 30%
33% Reduction in Minimum Night Flowrate
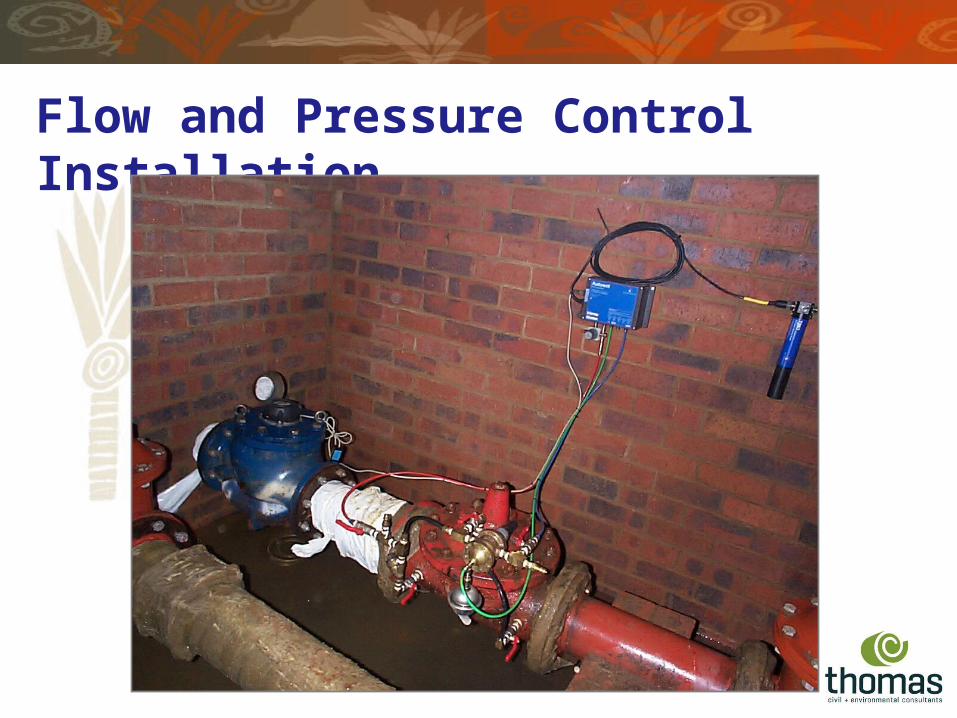
Flow and Pressure Control Installation
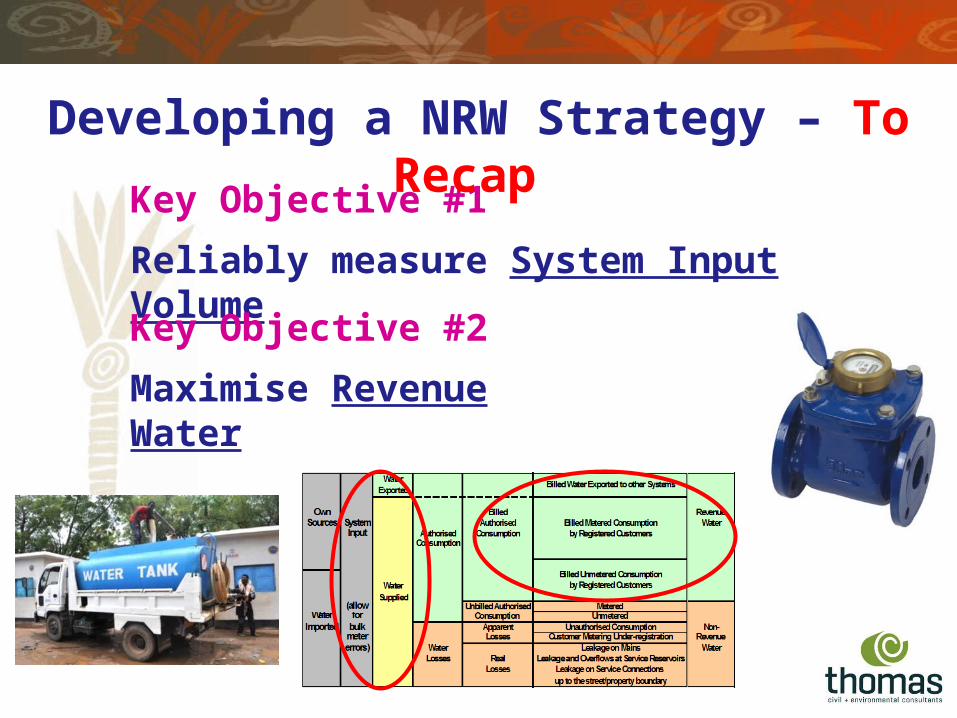
Key Objective #1
Reliably measure System Input Volume
Developing a NRW Strategy – To Recap
Key Objective #2
Maximise Revenue Water
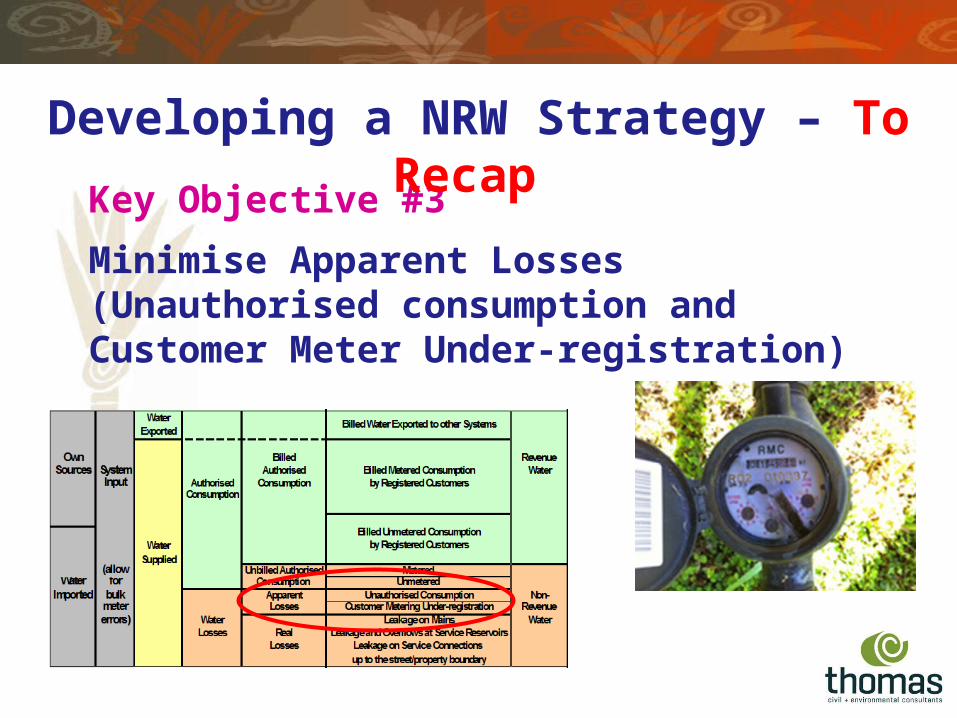
Key Objective #3
Minimise Apparent Losses (Unauthorised consumption and Customer Meter Under-registration)
Developing a NRW Strategy – To Recap
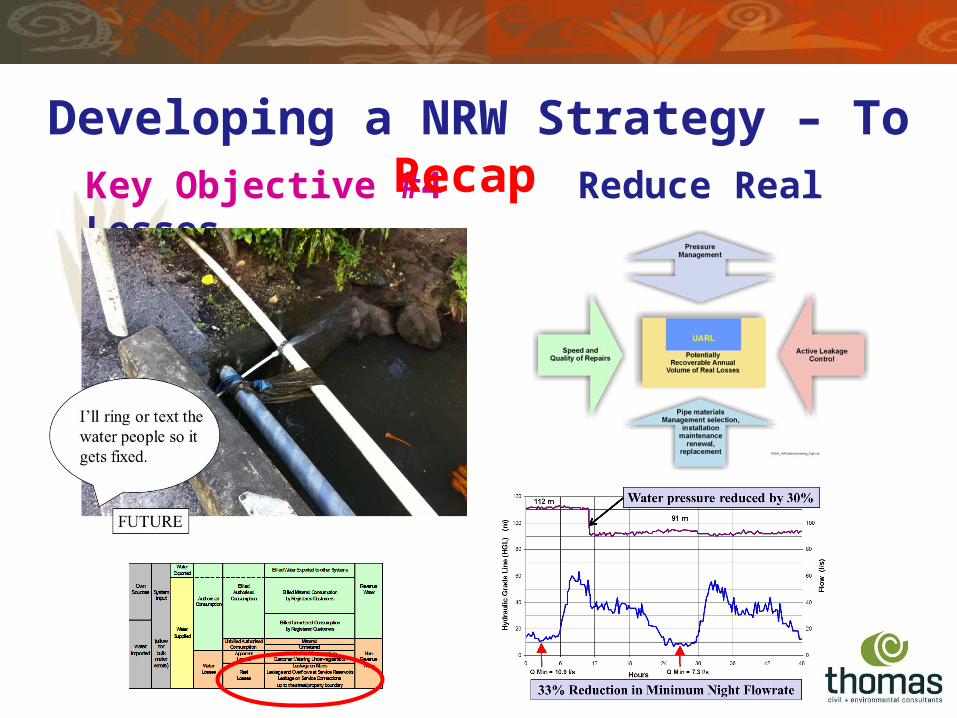
Key Objective #4 Reduce Real Losses
Developing a NRW Strategy – To Recap
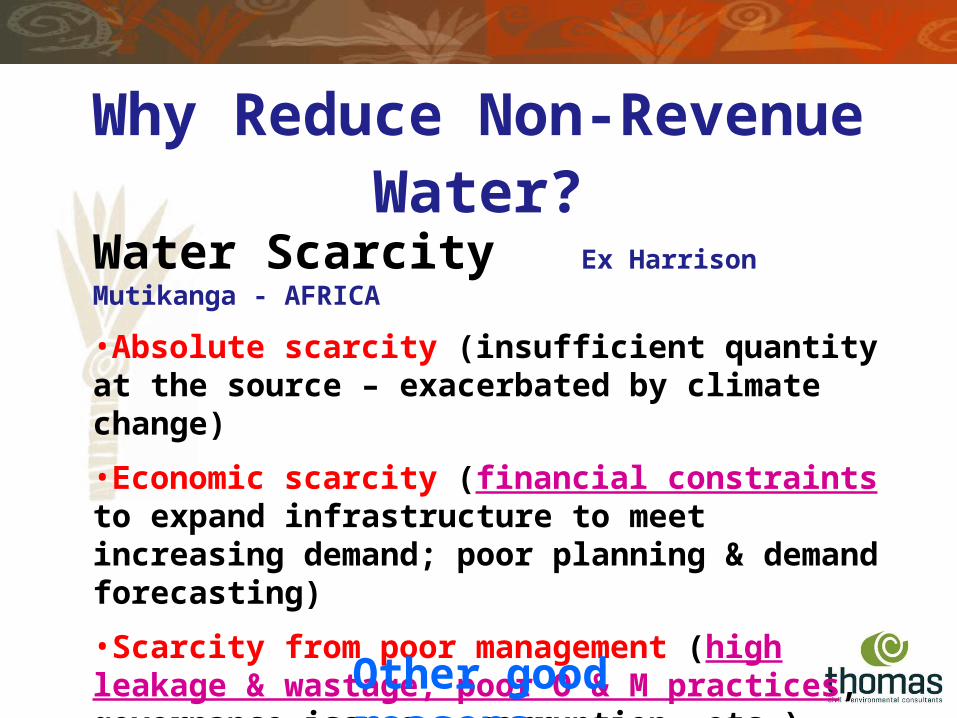
Water Scarcity Ex Harrison Mutikanga - AFRICA
•Absolute scarcity (insufficient quantity at the source – exacerbated by climate change)
•Economic scarcity (financial constraints to expand infrastructure to meet increasing demand; poor planning & demand forecasting)
•Scarcity from poor management (high leakage & wastage, poor O & M practices, governance issues – corruption, etc.)
Why Reduce Non-Revenue Water?
Other good reasons….
HAPPY CUSTOMERS
HAPPY WATER ENGINEERS
HAPPY WATER BOSSES
Why Reduce Non-Revenue Water?

Thank you
Any questions?