Embed Size (px)
Citation preview
Rice Global E&C Forum – July 11,2014
Rice Global E&C Forum – July 11,2014
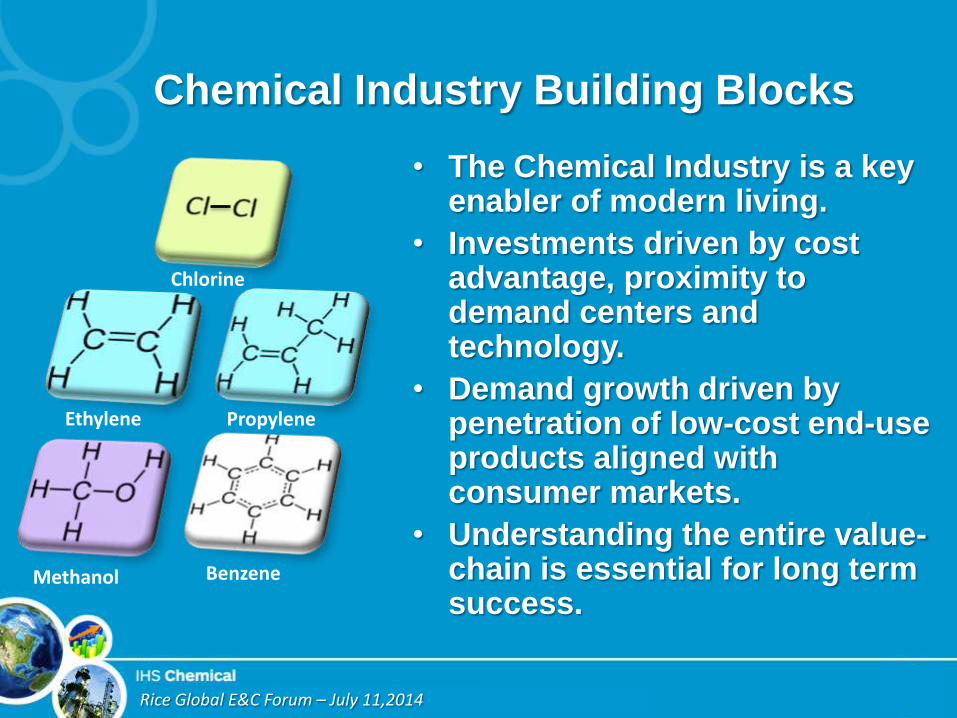
• The Chemical Industry is a key enabler of modern living.
• Investments driven by cost advantage, proximity to demand centers and technology.
• Demand growth driven by penetration of low-cost end-use products aligned with consumer markets.
• Understanding the entire value-chain is essential for long term success.
Chemical Industry Building Blocks
Ethylene Propylene
Benzene Methanol
Chlorine
Rice Global E&C Forum – July 11,2014
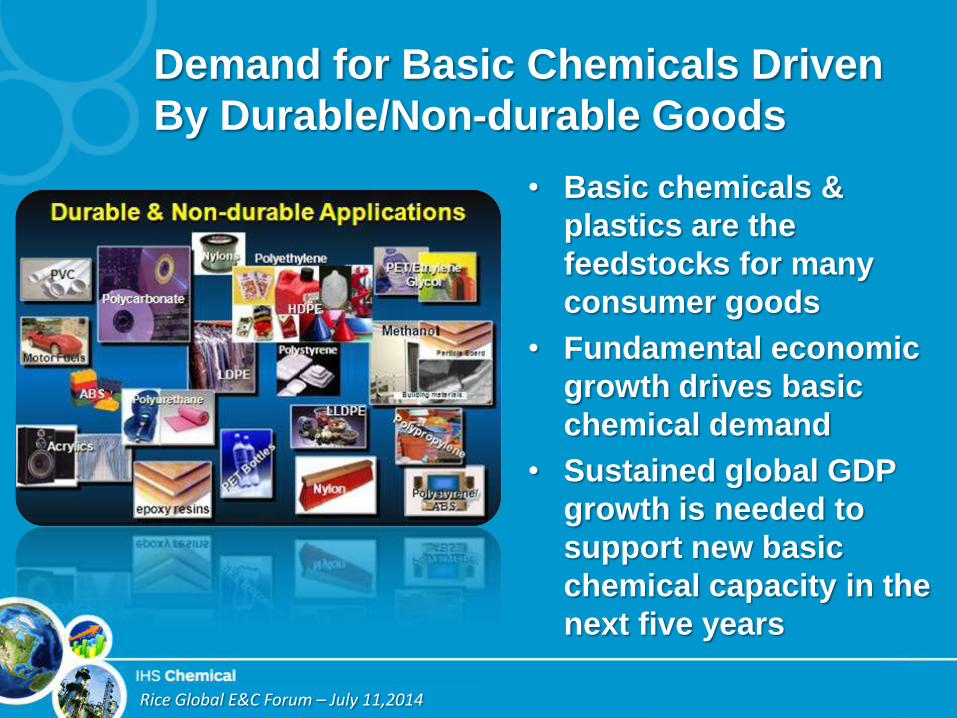
• Basic chemicals &
plastics are the
feedstocks for many
consumer goods
• Fundamental economic
growth drives basic
chemical demand
• Sustained global GDP
growth is needed to
support new basic
chemical capacity in the
next five years
Demand for Basic Chemicals Driven
By Durable/Non-durable Goods

The Demand Pull On Chemicals
Starts With Consumers
Energy Derivatives Petrochemicals
Consumers Retail Consumer
Goods
Rice Global E&C Forum – July 11,2014
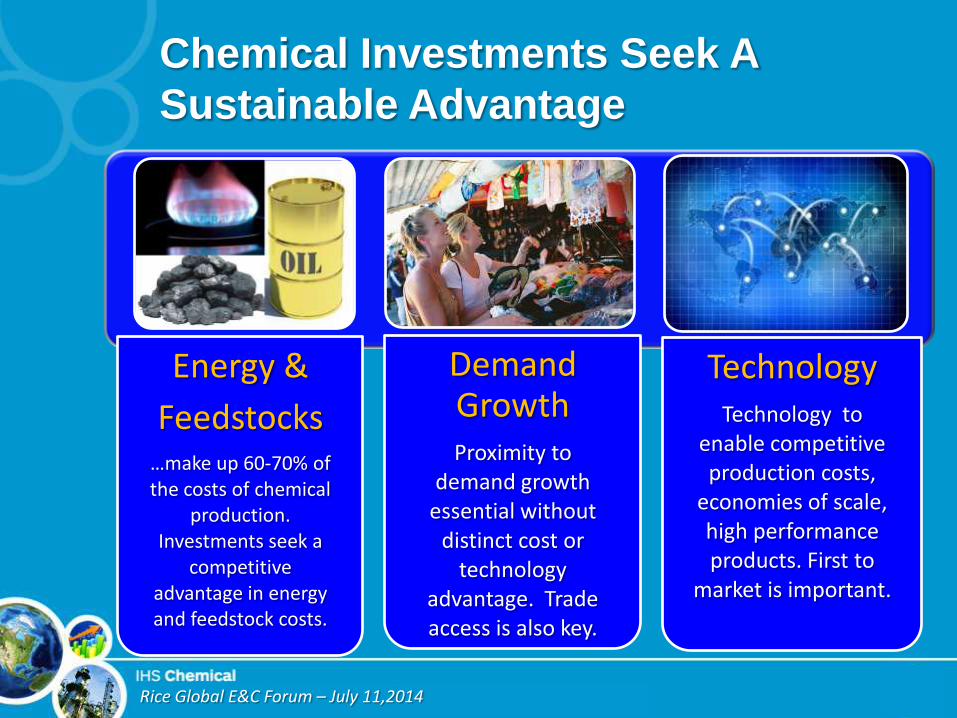
Energy &
Feedstocks …make up 60-70% of the costs of chemical
production. Investments seek a
competitive advantage in energy and feedstock costs.
Demand Growth Proximity to
demand growth essential without
distinct cost or technology
advantage. Trade access is also key.
Technology Technology to
enable competitive production costs,
economies of scale, high performance products. First to
market is important.
Chemical Investments Seek A
Sustainable Advantage

Energy and Hydrocarbon Feedstock Costs:
Key Drivers In Chemicals Manufacturing
Propylene
Ethylene
Butadiene Mixed Butylenes
Methane/Hydrogen
Benzene Toluene
Xylene
Propylene
Methanol
Naphtha
Gas Oil
Condensate
Propane
Ethane
Butane
Pygas Benzene
Toluene/Xylene
Heavy Aromatics
C5/C6 Non Aromatics
Fuel Oil
Ethylene
Unit
Gas Processing
Unit
REFORMER BTX Extraction
Raffinate FCC
Refinery
Steam
Reformer Methanol
Synthesis
SynGas
Gasifier
Gas
Coal
Rice Global E&C Forum – July 11,2014
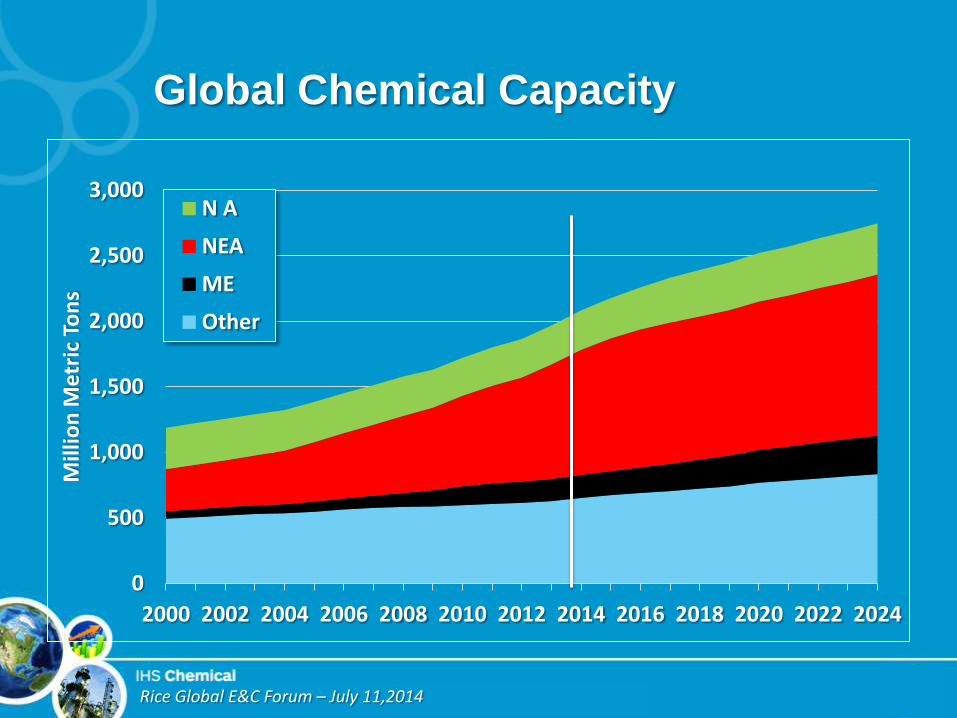
Global Chemical Capacity
0
500
1,000
1,500
2,000
2,500
3,000
2000 2002 2004 2006 2008 2010 2012 2014 2016 2018 2020 2022 2024
Mill
ion
Met
ric
Ton
s
N A
NEA
ME
Other
Rice Global E&C Forum – July 11,2014
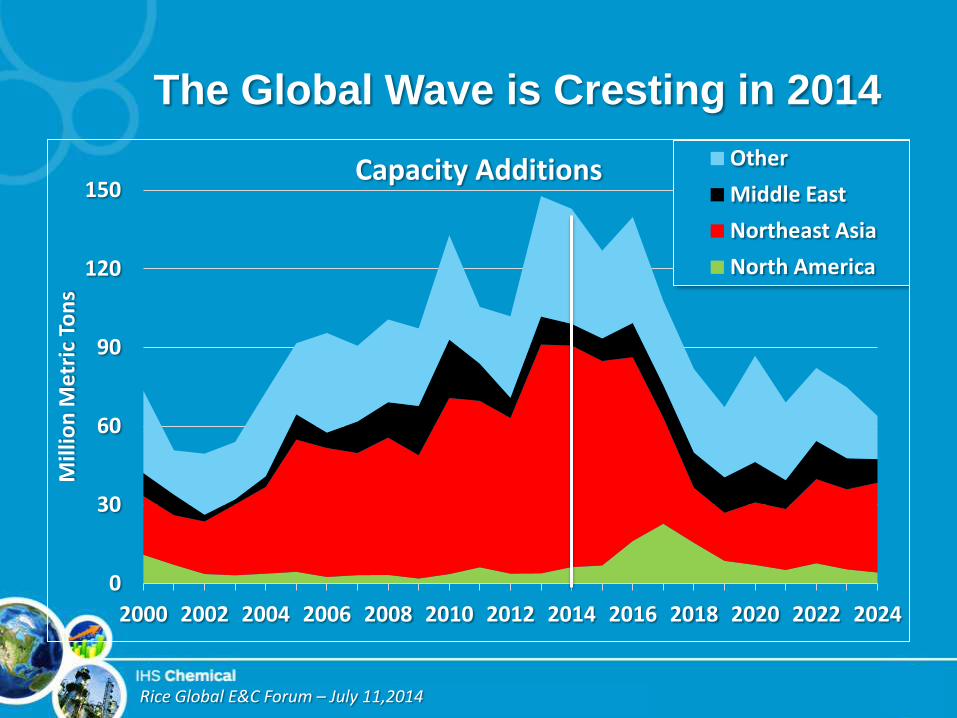
The Global Wave is Cresting in 2014
0
30
60
90
120
150
2000 2002 2004 2006 2008 2010 2012 2014 2016 2018 2020 2022 2024
Mill
ion
Met
ric
Ton
s
Capacity Additions Other
Middle East
Northeast Asia
North America

Rice Global E&C Forum – July 11,2014
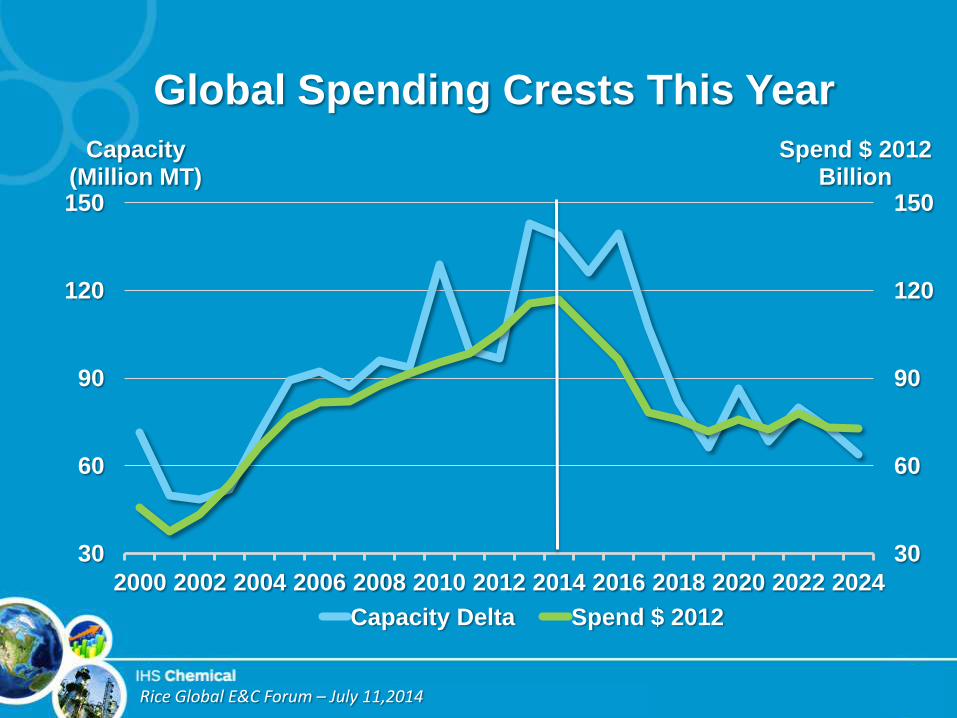
Global Spending Crests This Year
30
60
90
120
150
2000 2002 2004 2006 2008 2010 2012 2014 2016 2018 2020 2022 2024
Capacity (Million MT)
Capacity Delta
Rice Global E&C Forum – July 11,2014
Global Spending Crests This Year
30
60
90
120
150
30
60
90
120
150
2000 2002 2004 2006 2008 2010 2012 2014 2016 2018 2020 2022 2024
Spend $ 2012 Billion
Capacity (Million MT)
Capacity Delta Spend $ 2012
Rice Global E&C Forum – July 11,2014
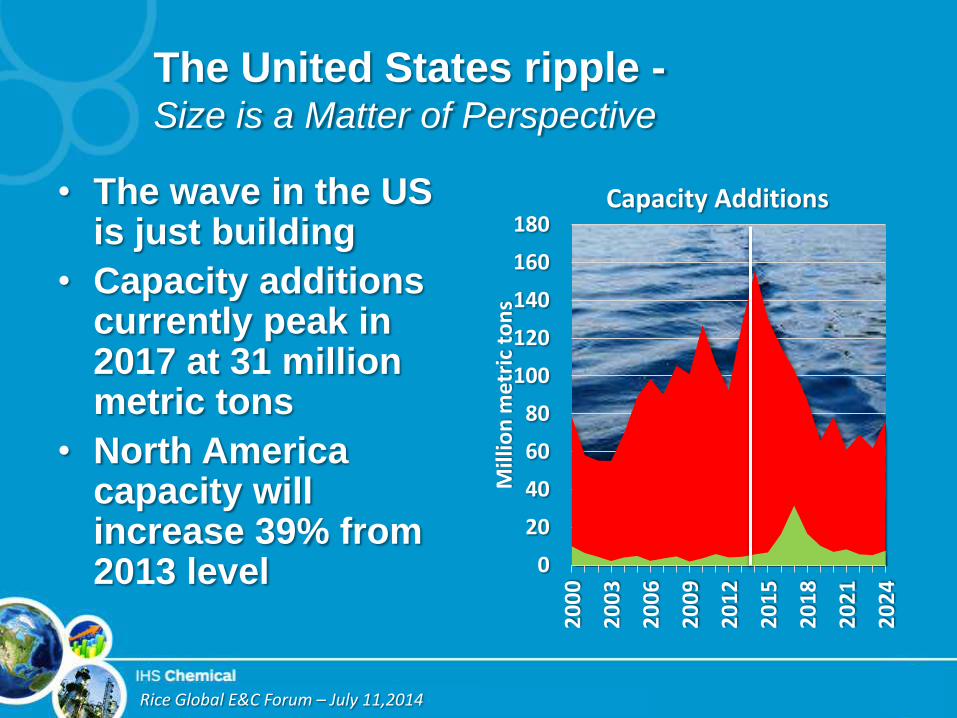
The United States ripple - Size is a Matter of Perspective
0
20
40
60
80
100
120
140
160
180
20
00
20
03
20
06
20
09
20
12
20
15
20
18
20
21
20
24
Mill
ion
me
tric
to
ns
Capacity Additions • The wave in the US is just building
• Capacity additions currently peak in 2017 at 31 million metric tons
• North America capacity will increase 39% from 2013 level
Rice Global E&C Forum – July 11,2014
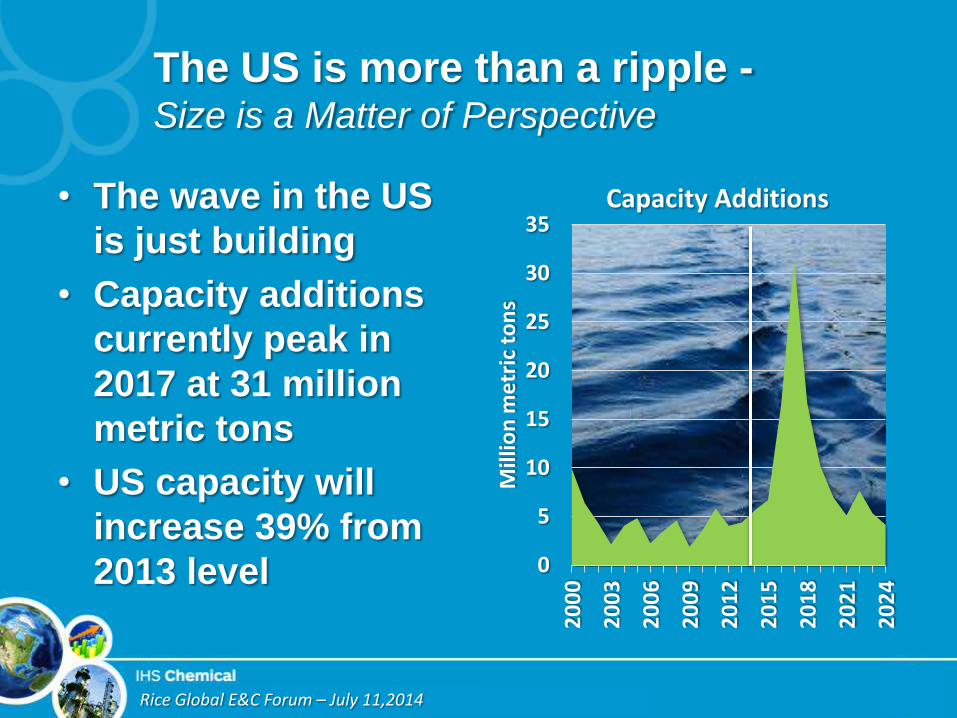
The US is more than a ripple - Size is a Matter of Perspective
0
5
10
15
20
25
30
35
20
00
20
03
20
06
20
09
20
12
20
15
20
18
20
21
20
24
Mill
ion
me
tric
to
ns
Capacity Additions • The wave in the US
is just building
• Capacity additions
currently peak in
2017 at 31 million
metric tons
• US capacity will
increase 39% from
2013 level
Rice Global E&C Forum – July 11,2014
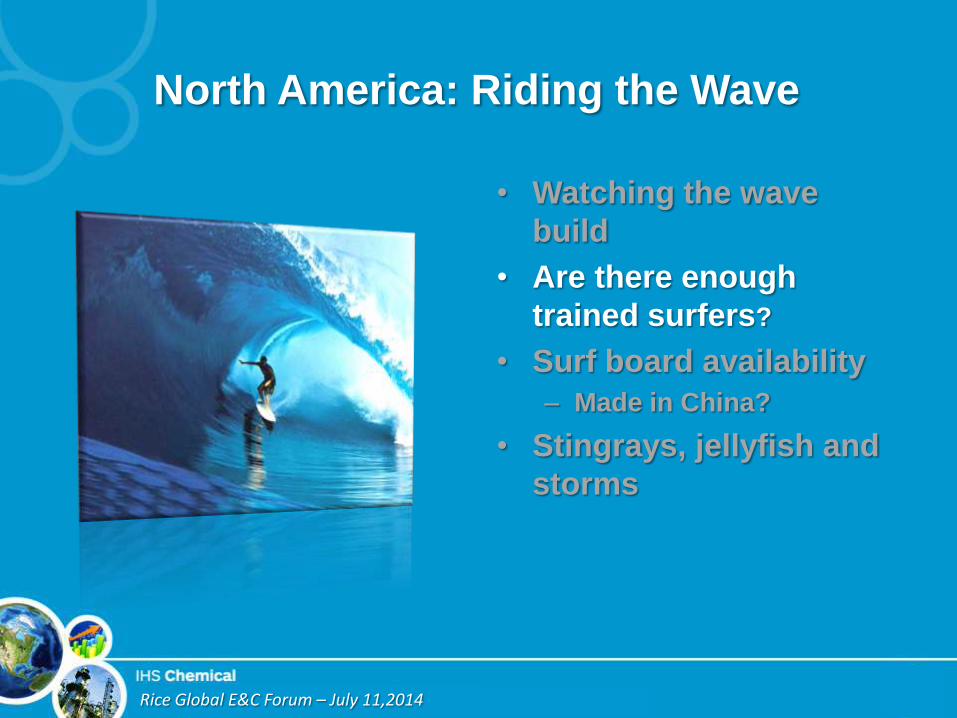
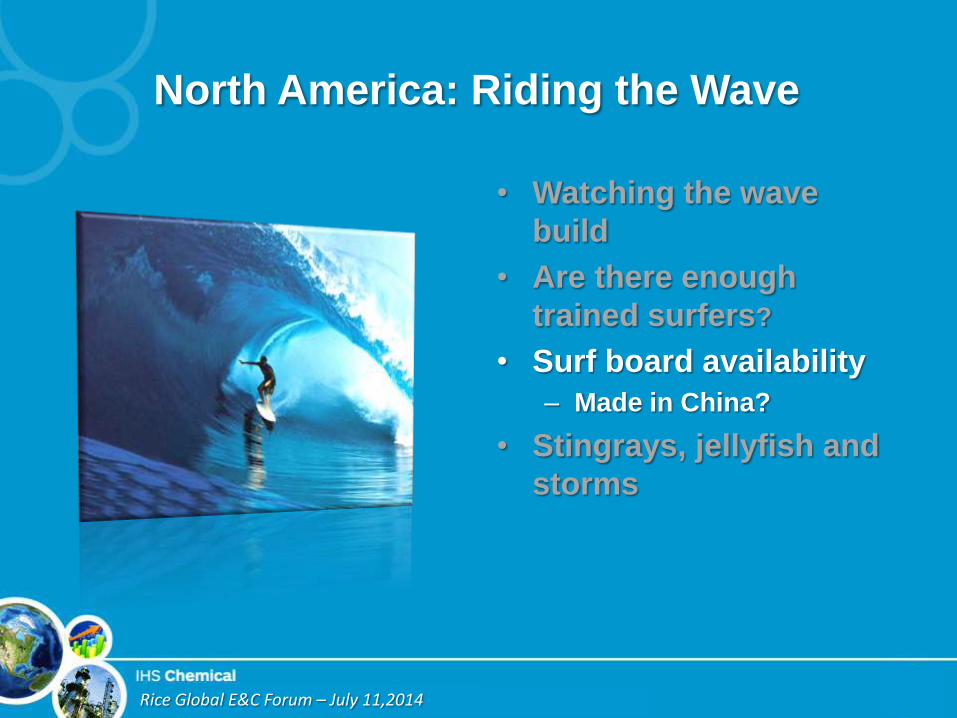
North America: Riding the Wave
• Watching the wave
build
• Are there enough
trained surfers?
• Surf board availability
– Made in China?
• Stingrays, jellyfish and
storms
Rice Global E&C Forum – July 11,2014
North America: Riding the Wave
• Watching the wave
build
• Are there enough
trained surfers?
• Surf board availability
– Made in China?
• Stingrays, jellyfish and
storms
Rice Global E&C Forum – July 11,2014
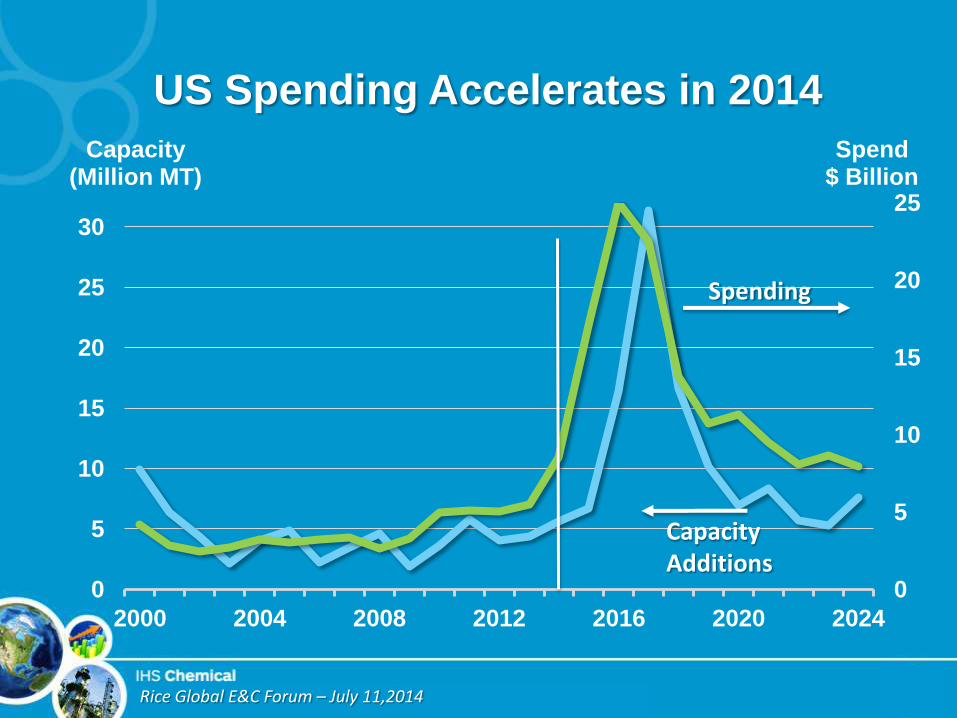
US Spending Accelerates in 2014
0
5
10
15
20
25
0
5
10
15
20
25
30
2000 2004 2008 2012 2016 2020 2024
Spend $ Billion
Capacity (Million MT)
Capacity Additions
Spending
Rice Global E&C Forum – July 11,2014
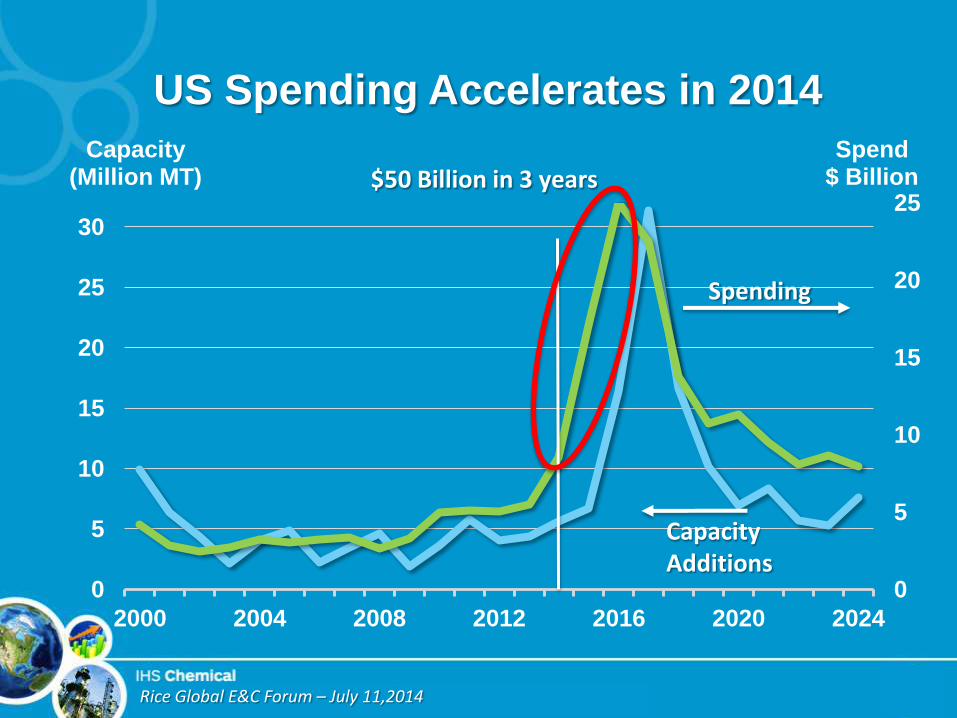
US Spending Accelerates in 2014
0
5
10
15
20
25
0
5
10
15
20
25
30
2000 2004 2008 2012 2016 2020 2024
Spend $ Billion
Capacity (Million MT)
Capacity Additions
Spending
$50 Billion in 3 years

Rice Global E&C Forum – July 11,2014
Why is this happening?
….Fracking
-
2
4
6
8
10
12
14
16
20
00
20
02
20
04
20
06
20
08
20
10
20
12
20
14
20
16
20
18
$/M
M B
tu
US Oil & Gas Prices
0
5
10
15
20
25
30
20
00
20
02
20
04
20
06
20
08
20
10
20
12
20
14
20
16
20
18
TCF
US Natural Gas Production
Rice Global E&C Forum – July 11,2014
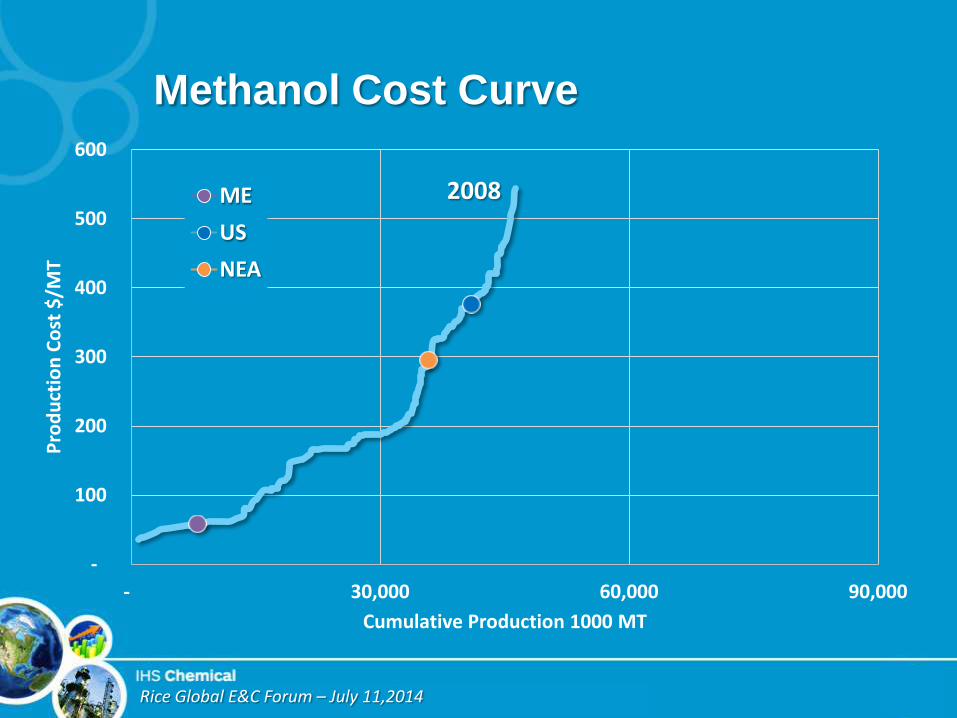
Methanol Cost Curve
-
100
200
300
400
500
600
- 30,000 60,000 90,000
Pro
du
ctio
n C
ost
$/M
T
Cumulative Production 1000 MT
ME
US
NEA
2008

Rice Global E&C Forum – July 11,2014
Methanol Cost Curve
-
100
200
300
400
500
600
- 30,000 60,000 90,000
Pro
du
ctio
n C
ost
$/M
T
Cumulative Production 1000 MT
ME
US
NEA
2008 2014
Rice Global E&C Forum – July 11,2014
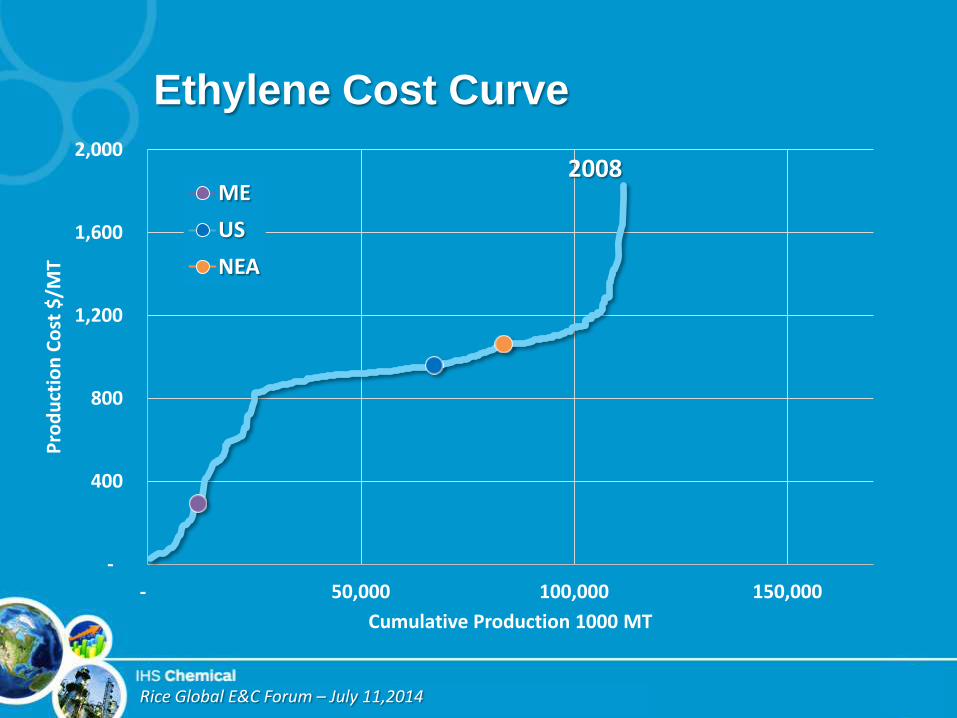
Ethylene Cost Curve
-
400
800
1,200
1,600
2,000
- 50,000 100,000 150,000
Pro
du
ctio
n C
ost
$/M
T
Cumulative Production 1000 MT
ME
US
NEA
2008
Rice Global E&C Forum – July 11,2014
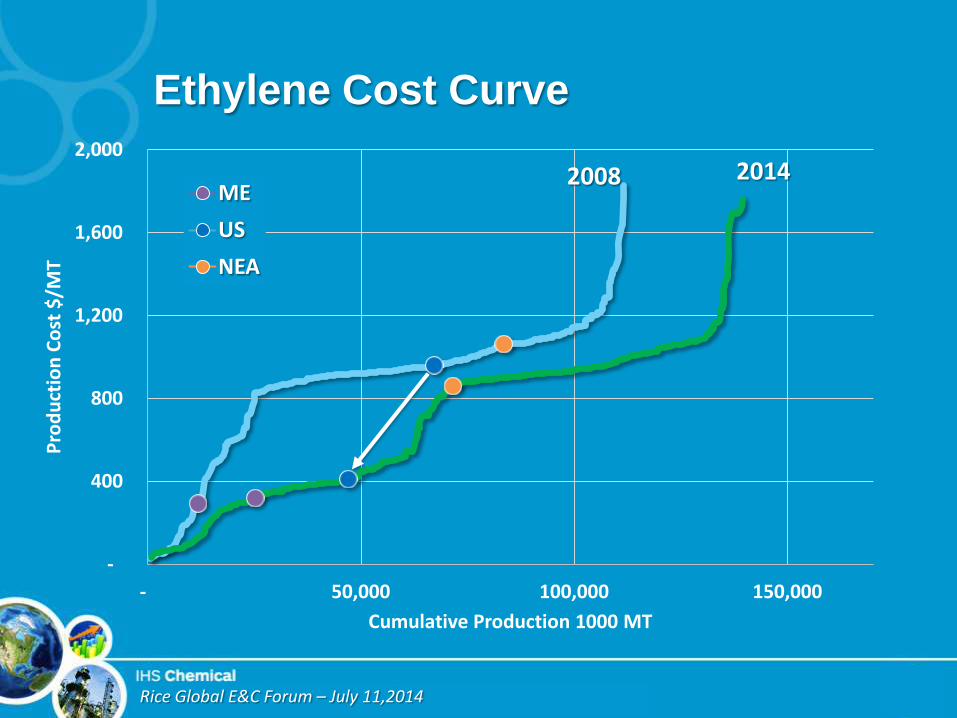
Ethylene Cost Curve
-
400
800
1,200
1,600
2,000
- 50,000 100,000 150,000
Pro
du
ctio
n C
ost
$/M
T
Cumulative Production 1000 MT
ME
US
NEA
2008 2014
Rice Global E&C Forum – July 11,2014
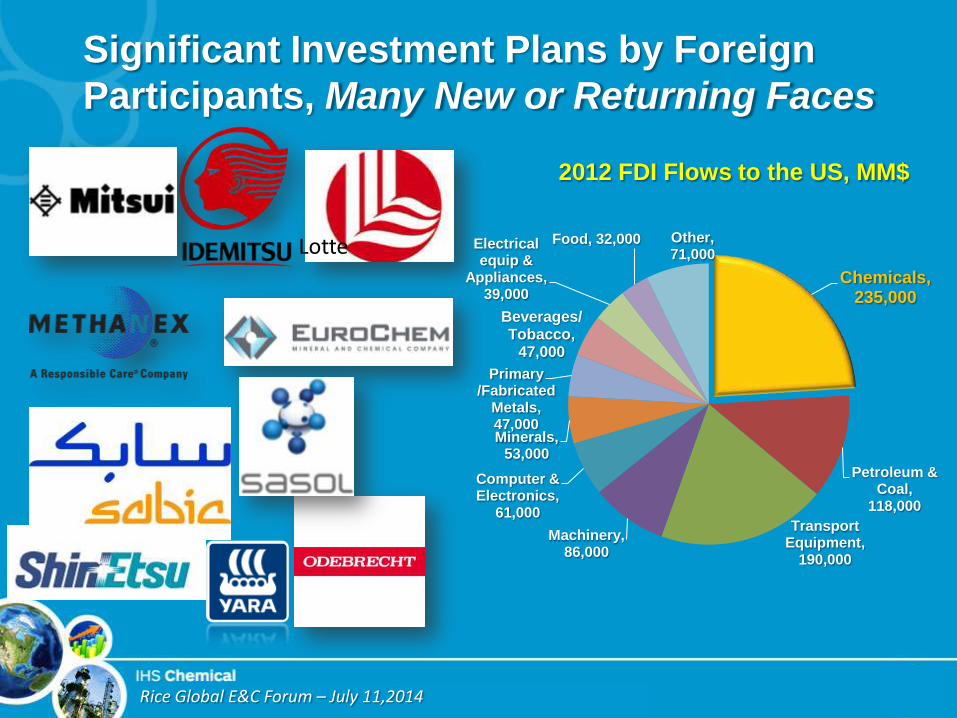
Significant Investment Plans by Foreign
Participants, Many New or Returning Faces
2012 FDI Flows to the US, MM$
Lotte Chemicals,
235,000
Petroleum & Coal,
118,000
Transport Equipment,
190,000
Machinery, 86,000
Computer & Electronics,
61,000
Minerals, 53,000
Primary /Fabricated
Metals, 47,000
Beverages/Tobacco,
47,000
Electrical equip &
Appliances, 39,000
Food, 32,000 Other, 71,000
Rice Global E&C Forum – July 11,2014
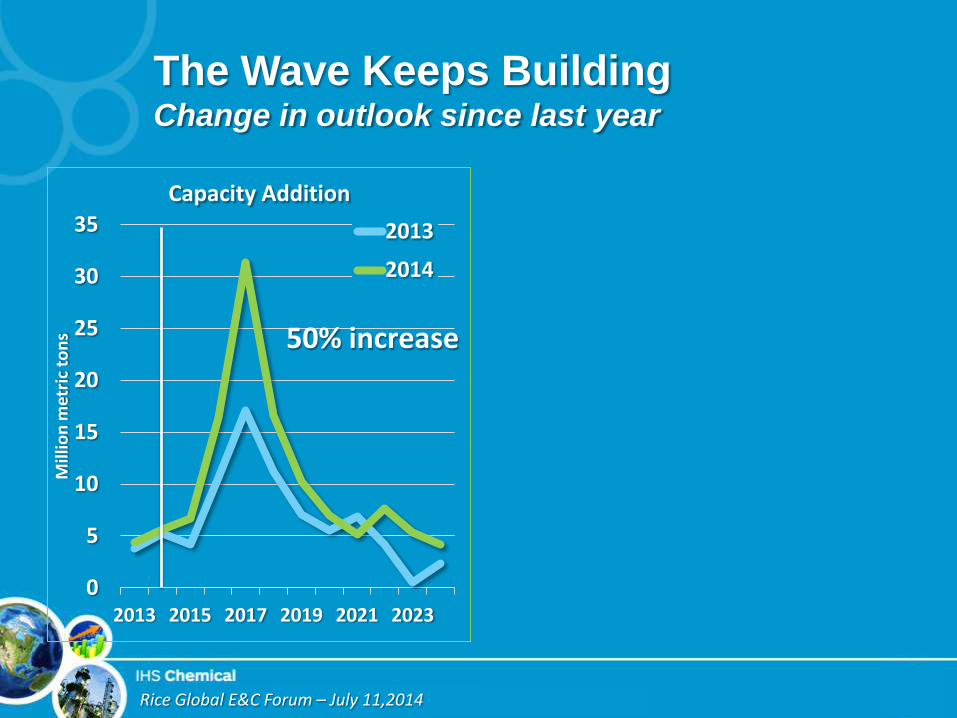
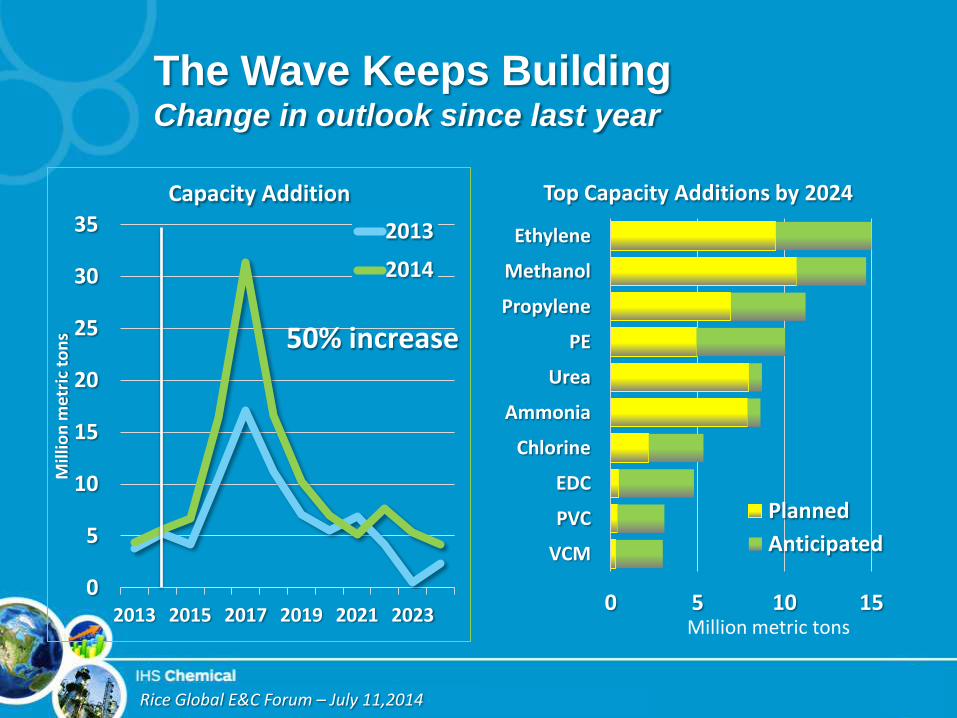
The Wave Keeps Building Change in outlook since last year
0
5
10
15
20
25
30
35
2013 2015 2017 2019 2021 2023
Mill
ion
met
ric
ton
s
Capacity Addition
2013
2014
50% increase
Rice Global E&C Forum – July 11,2014
The Wave Keeps Building Change in outlook since last year
0
5
10
15
20
25
30
35
2013 2015 2017 2019 2021 2023
Mill
ion
met
ric
ton
s
Capacity Addition
2013
2014
50% increase
0 5 10 15
VCM
PVC
EDC
Chlorine
Ammonia
Urea
PE
Propylene
Methanol
Ethylene
Million metric tons
Top Capacity Additions by 2024
Planned
Anticipated
Rice Global E&C Forum – July 11,2014
The Wave Crests in 2017 but…
• New players continue to enter the water
• Others remain on shore waiting to see how
good the surf is
• Feedstock availability continues to expand
keeping pricing attractive
• This wave has the potential to keep building
Rice Global E&C Forum – July 11,2014
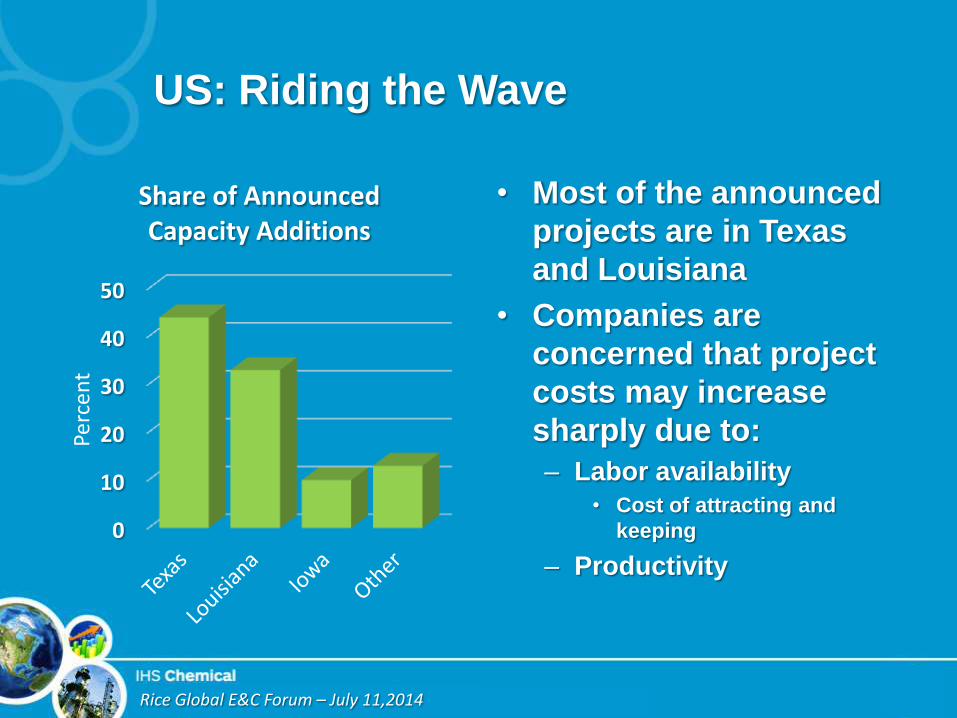
US: Riding the Wave
• Most of the announced
projects are in Texas
and Louisiana
• Companies are
concerned that project
costs may increase
sharply due to:
– Labor availability
• Cost of attracting and
keeping
– Productivity
0
10
20
30
40
50
Perc
ent
Share of Announced Capacity Additions
Rice Global E&C Forum – July 11,2014
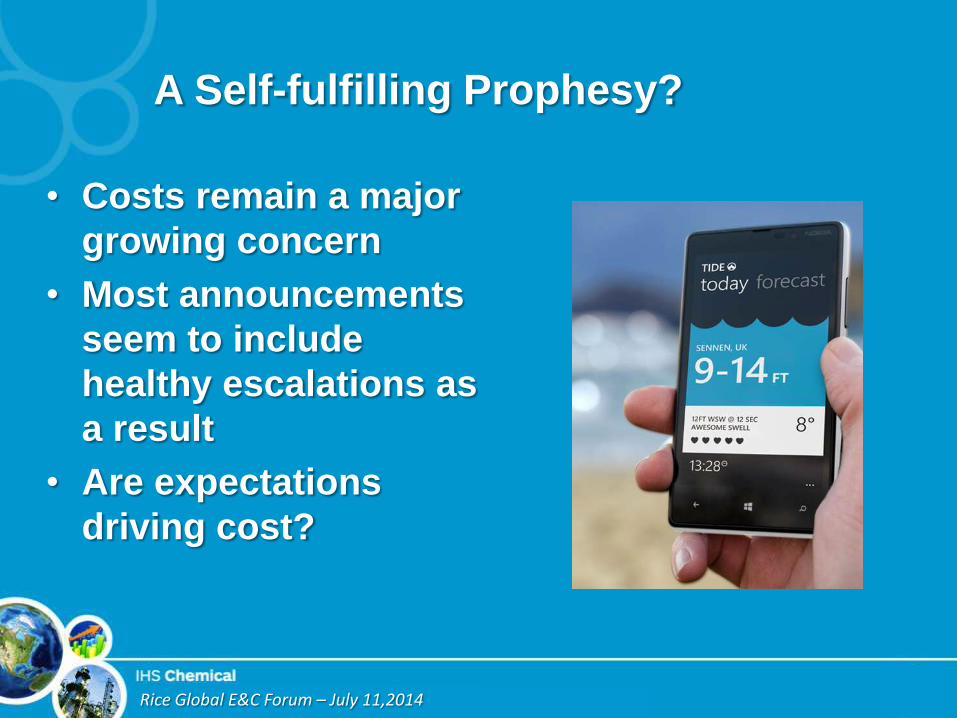
A Self-fulfilling Prophesy?
• Costs remain a major
growing concern
• Most announcements
seem to include
healthy escalations as
a result
• Are expectations
driving cost?
Rice Global E&C Forum – July 11,2014
North America: Riding the Wave
• Watching the wave
build
• Are there enough
trained surfers?
• Surf board availability
– Made in China?
• Stingrays, jellyfish and
storms
Rice Global E&C Forum – July 11,2014
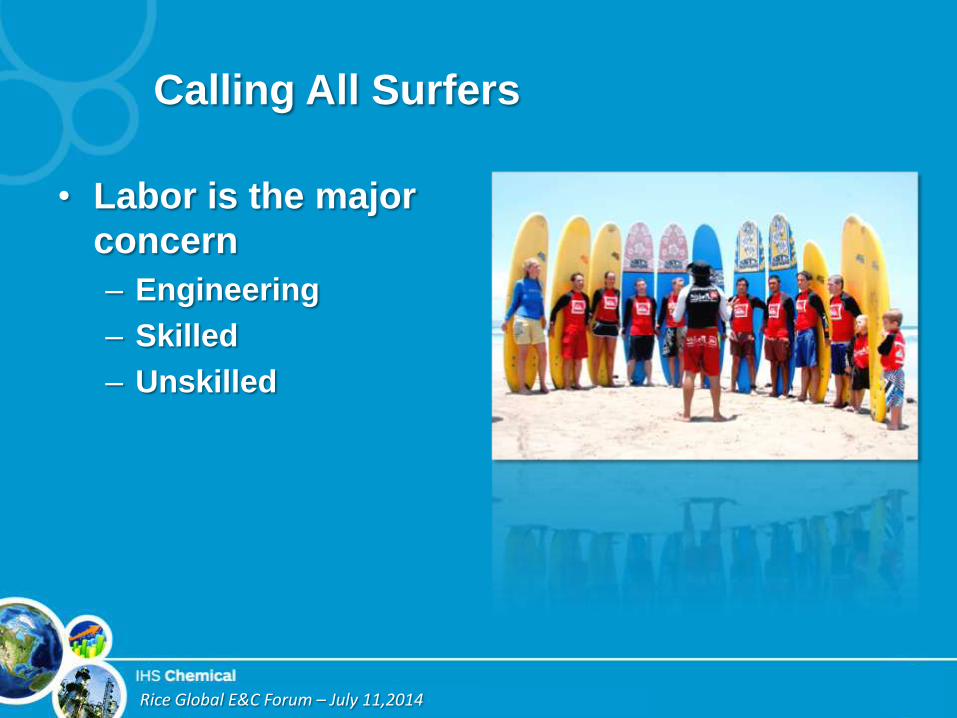
Calling All Surfers
• Labor is the major
concern
– Engineering
– Skilled
– Unskilled
Rice Global E&C Forum – July 11,2014
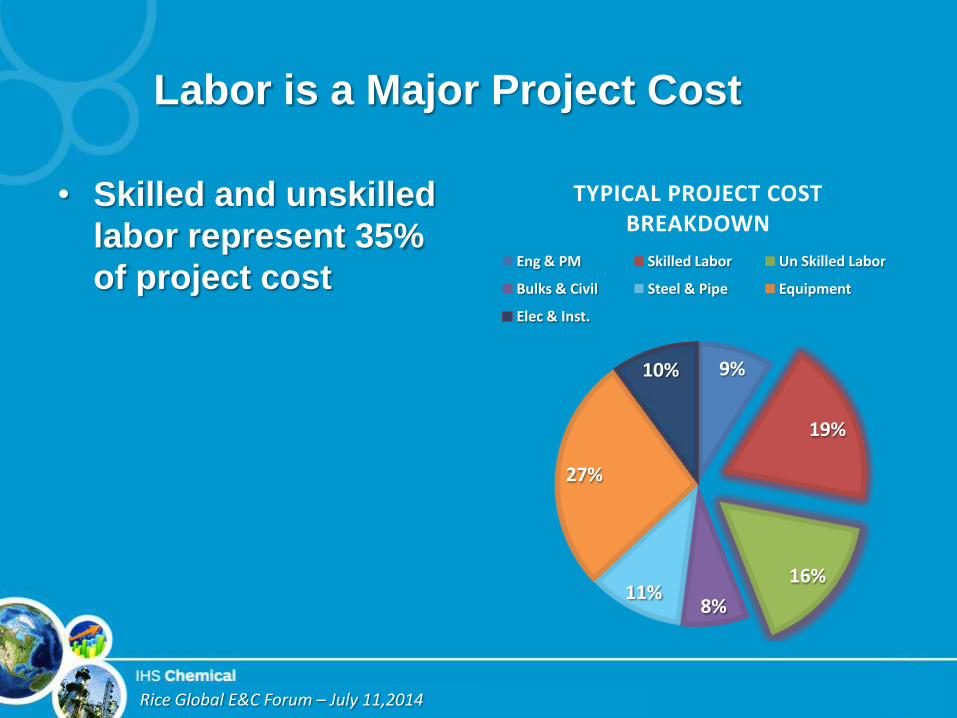
Labor is a Major Project Cost
• Skilled and unskilled
labor represent 35%
of project cost
9%
19%
16%
8% 11%
27%
10%
TYPICAL PROJECT COST BREAKDOWN
Eng & PM Skilled Labor Un Skilled Labor
Bulks & Civil Steel & Pipe Equipment
Elec & Inst.

Rice Global E&C Forum – July 11,2014
Labor is a Major Project Cost
• Skilled and unskilled
labor represent 35%
of project cost
• Add engineering and
project management
total labor related
costs total 46%
• Based on this it is
easy to see why this
is a major concern
9%
19%
16%
8% 11%
27%
10%
TYPICAL PROJECT COST BREAKDOWN
Eng & PM Skilled Labor Un Skilled Labor
Bulks & Civil Steel & Pipe Equipment
Elec & Inst.
Rice Global E&C Forum – July 11,2014
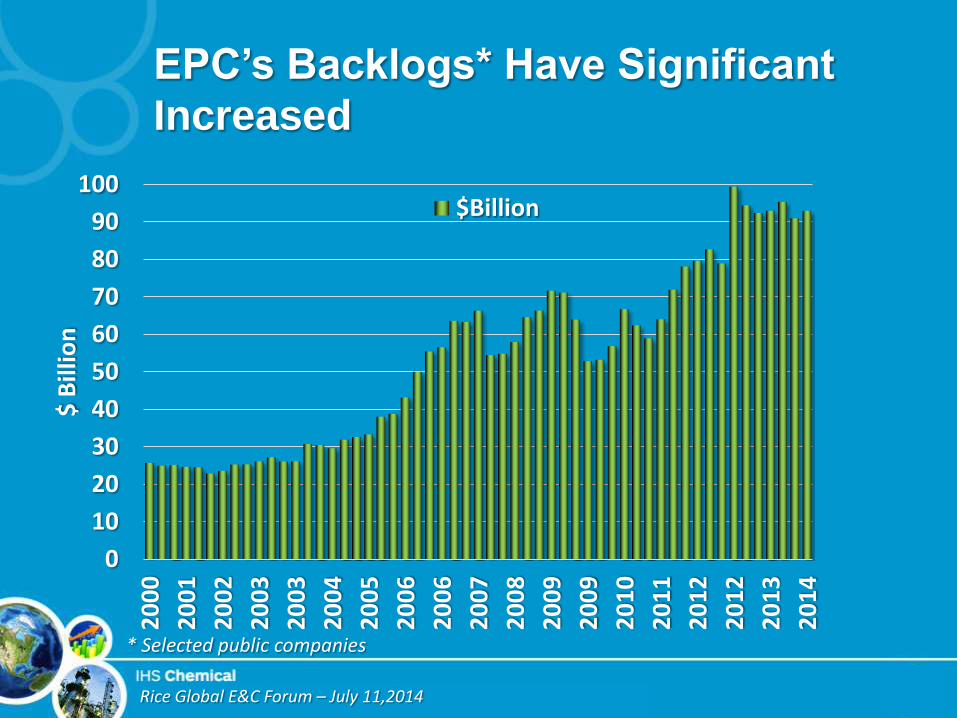
EPC’s Backlogs* Have Significant
Increased
0
10
20
30
40
50
60
70
80
90
100
20
00
20
01
20
02
20
03
20
03
20
04
20
05
20
06
20
06
20
07
20
08
20
09
20
09
20
10
20
11
20
12
20
12
20
13
20
14
$ B
illio
n
$Billion
* Selected public companies
Rice Global E&C Forum – July 11,2014
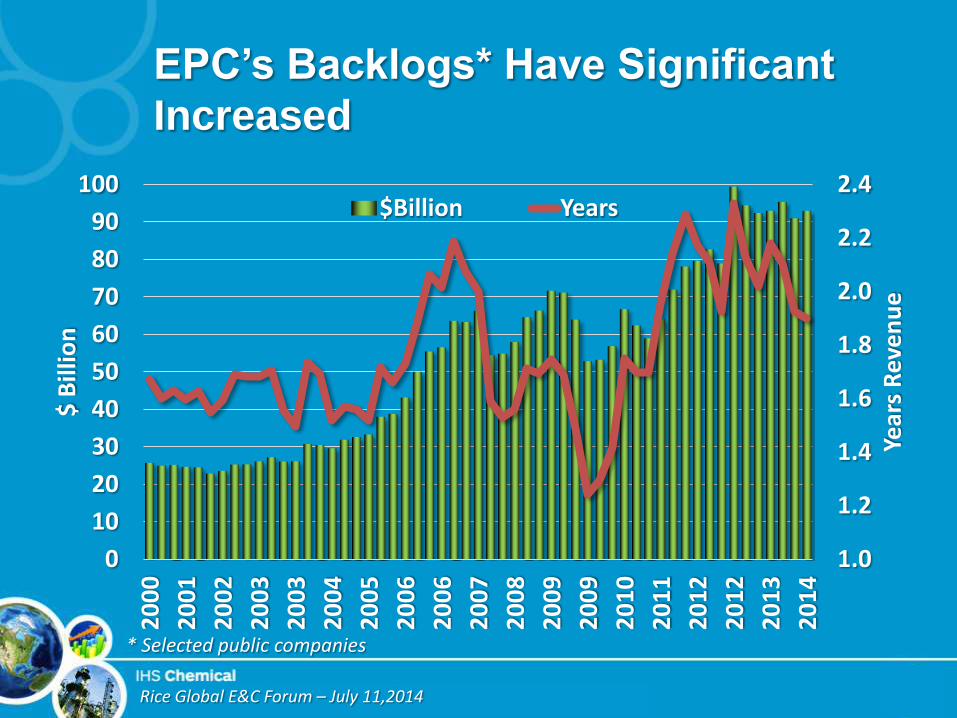
EPC’s Backlogs* Have Significant
Increased
1.0
1.2
1.4
1.6
1.8
2.0
2.2
2.4
0
10
20
30
40
50
60
70
80
90
100
20
00
20
01
20
02
20
03
20
03
20
04
20
05
20
06
20
06
20
07
20
08
20
09
20
09
20
10
20
11
20
12
20
12
20
13
20
14
Year
s R
eve
nu
e
$ B
illio
n
$Billion Years
* Selected public companies

Rice Global E&C Forum – July 11,2014
Skilled Labor is a Major Concern
• Key concerns
– Project foremen
– Welders
– Pipefitters
– Electricians
• Rates are rising
• Companies are being
proactive
• Higher rates encourage
relocations 0.9
1.0
1.1
1.2
1.3
1.4
1.5
1.6
20
05
20
06
20
07
20
08
20
09
20
10
20
11
20
12
20
13
20
14
Ind
ex 2
00
5 =
1.0
USGC Skilled Labor Index Welders Pipefitters Electricians
Rice Global E&C Forum – July 11,2014
Is the Sky Really Falling?
• Survey consistently
trending down
• 6 month expectation
always higher
• Are expectations
driving cost up?
50
55
60
65
70
75
May
-12
Au
g-1
2
No
v-1
2
Feb
-13
May
-13
Au
g-1
3
No
v-1
3
Feb
-14
May
-14
IHS/PEG ECCI Labor
Current
6 Month Out
Rice Global E&C Forum – July 11,2014
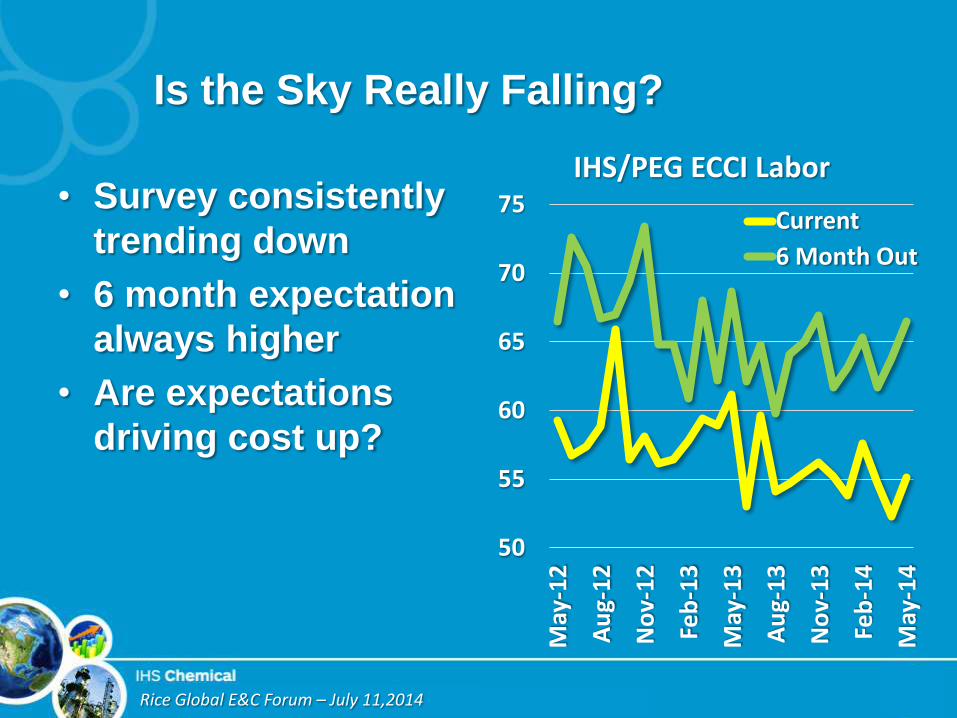
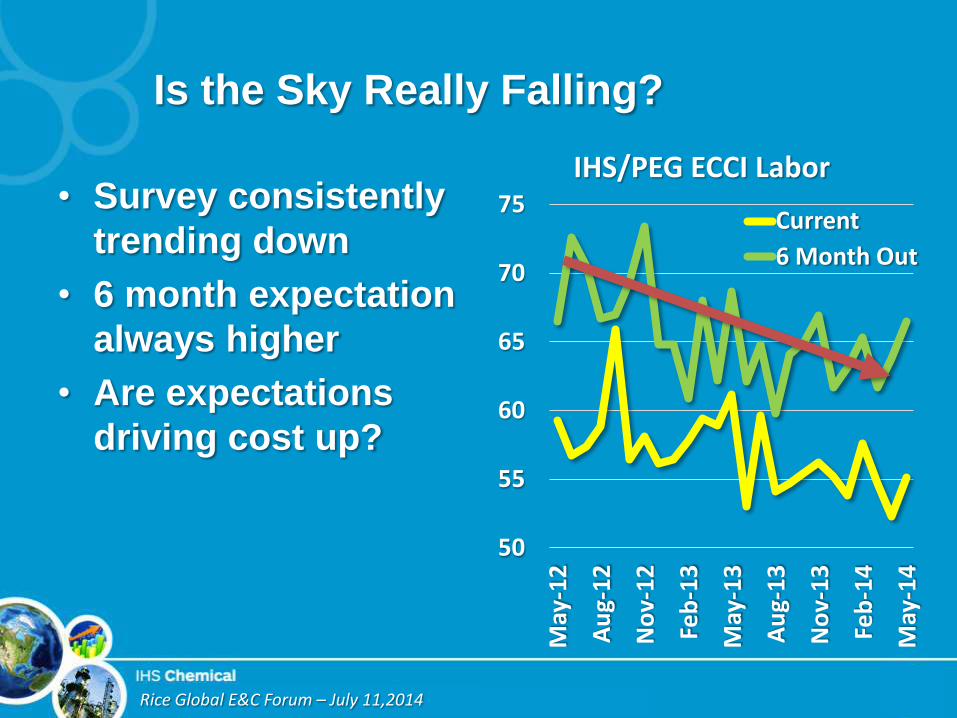
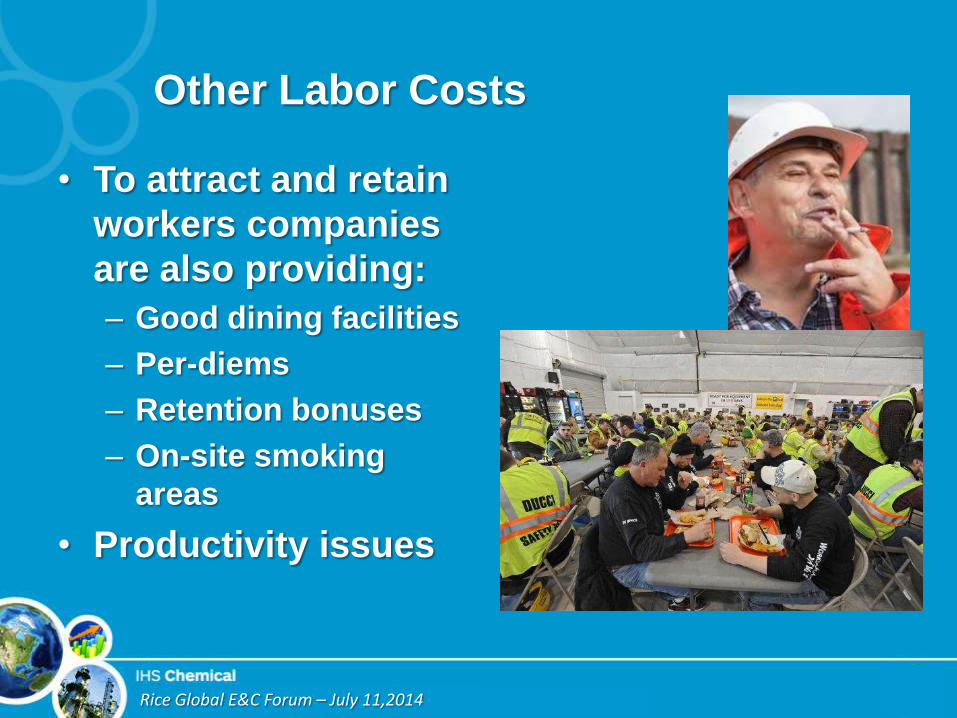
Other Labor Costs
• To attract and retain
workers companies
are also providing:
– Good dining facilities
– Per-diems
– Retention bonuses
– On-site smoking
areas
• Productivity issues
Rice Global E&C Forum – July 11,2014
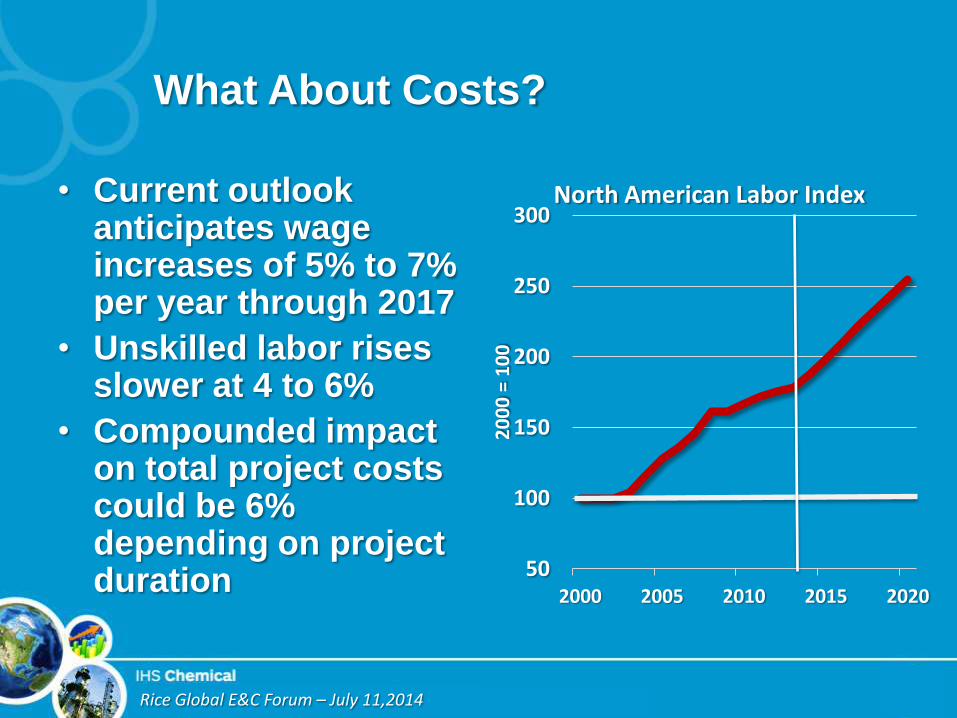
What About Costs?
• Current outlook anticipates wage increases of 5% to 7% per year through 2017
• Unskilled labor rises slower at 4 to 6%
• Compounded impact on total project costs could be 6% depending on project duration
50
100
150
200
250
300
2000 2005 2010 2015 2020
20
00
= 1
00
North American Labor Index
Rice Global E&C Forum – July 11,2014
North America: Riding the Wave
• Watching the wave
build
• Are there enough
trained surfers?
• Surf board availability
– Made in China?
• Stingrays, jellyfish and
storms

Rice Global E&C Forum – July 11,2014
Getting the Right Board When You
Need It
• Major concerns
– Lead times on major
items
– Some equipment has
limited suppliers
– Will metal prices
remain in check
Rice Global E&C Forum – July 11,2014
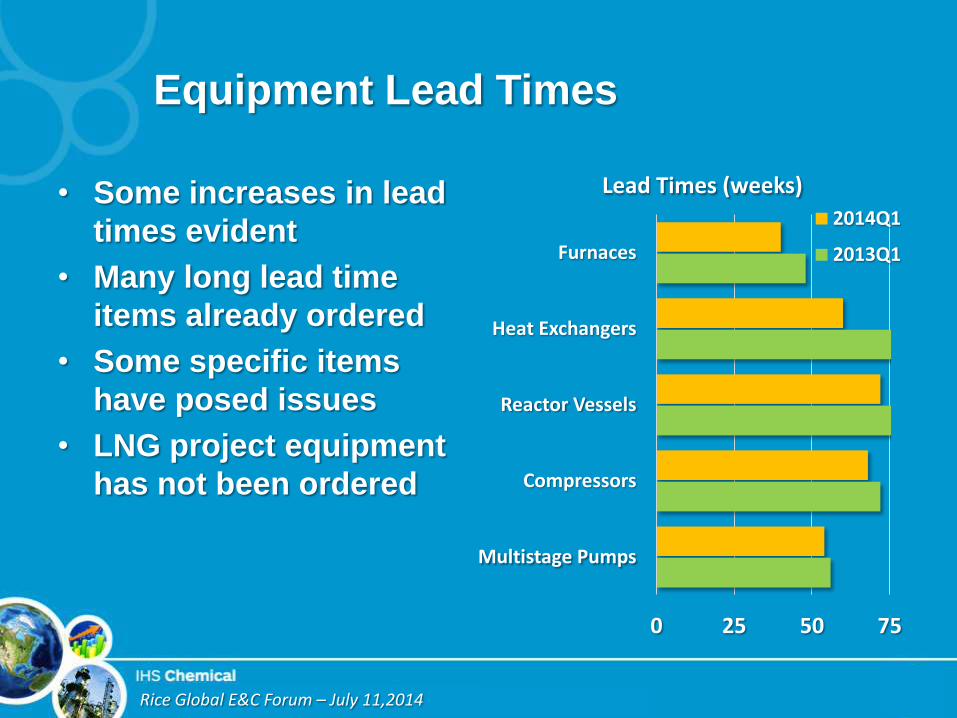
Equipment Lead Times
• Some increases in lead
times evident
• Many long lead time
items already ordered
• Some specific items
have posed issues
• LNG project equipment
has not been ordered
0 25 50 75
Multistage Pumps
Compressors
Reactor Vessels
Heat Exchangers
Furnaces
Lead Times (weeks)
2014Q1
2013Q1
Rice Global E&C Forum – July 11,2014
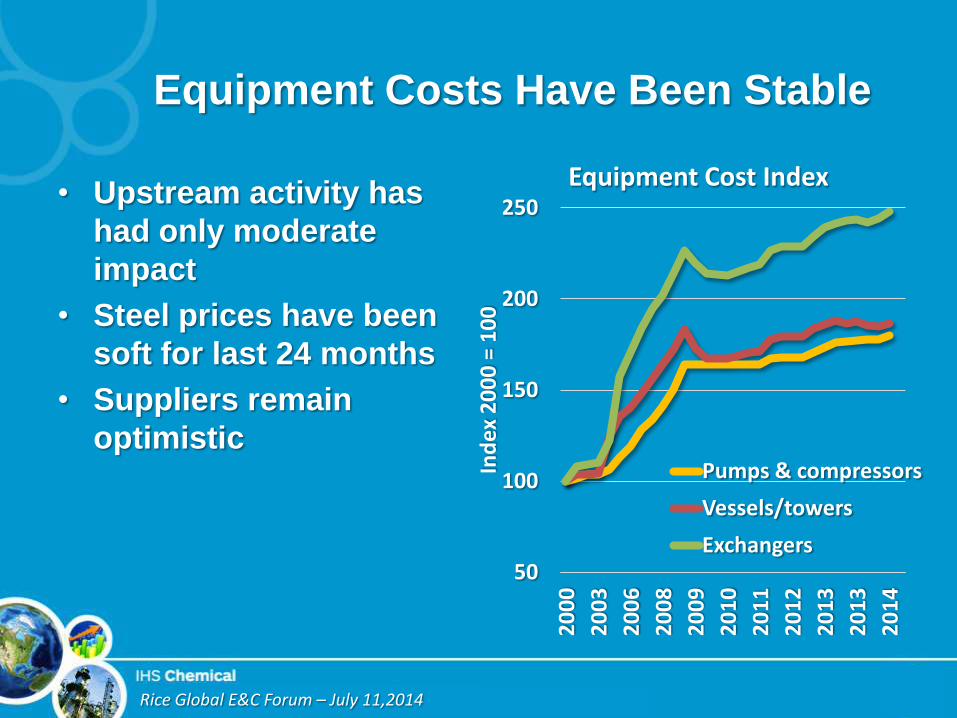
Equipment Costs Have Been Stable
• Upstream activity has
had only moderate
impact
• Steel prices have been
soft for last 24 months
• Suppliers remain
optimistic
50
100
150
200
250
20
00
20
03
20
06
20
08
20
09
20
10
20
11
20
12
20
13
20
13
20
14
Ind
ex 2
00
0 =
10
0
Equipment Cost Index
Pumps & compressors
Vessels/towers
Exchangers
Rice Global E&C Forum – July 11,2014
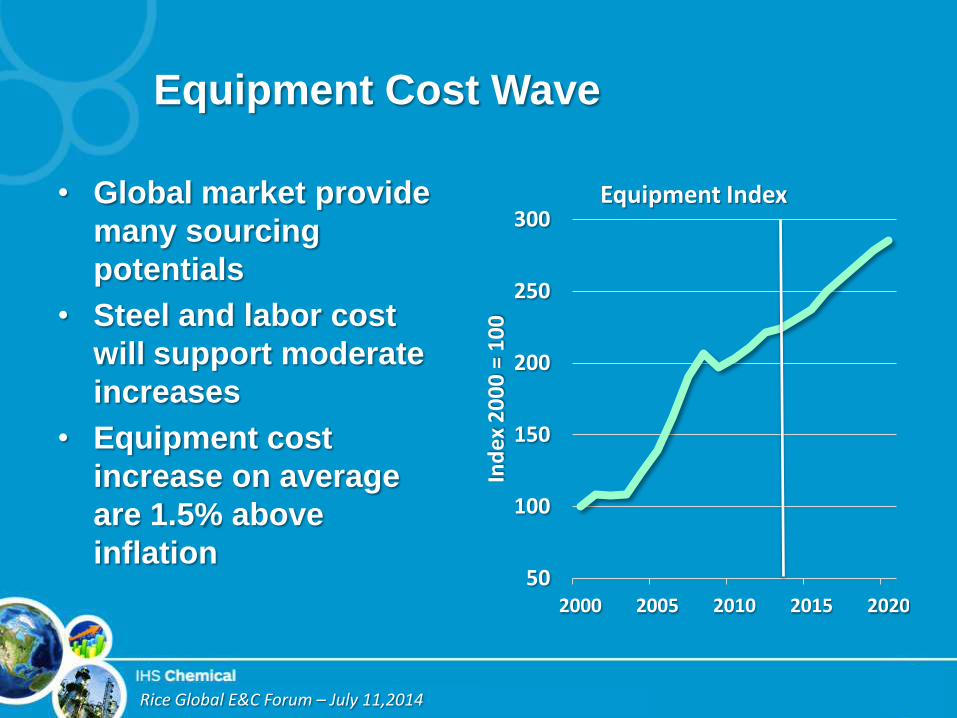
Equipment Cost Wave
• Global market provide
many sourcing
potentials
• Steel and labor cost
will support moderate
increases
• Equipment cost
increase on average
are 1.5% above
inflation 50
100
150
200
250
300
2000 2005 2010 2015 2020
Ind
ex 2
00
0 =
10
0
Equipment Index

Rice Global E&C Forum – July 11,2014
Can we Off-shore?
• Prefabrication offshore
is one countermeasure
• China growing as
alternate supply option
for some equipment
• Modularization option
provide one way to
move project forward
and reduce site labor
requirements
Rice Global E&C Forum – July 11,2014
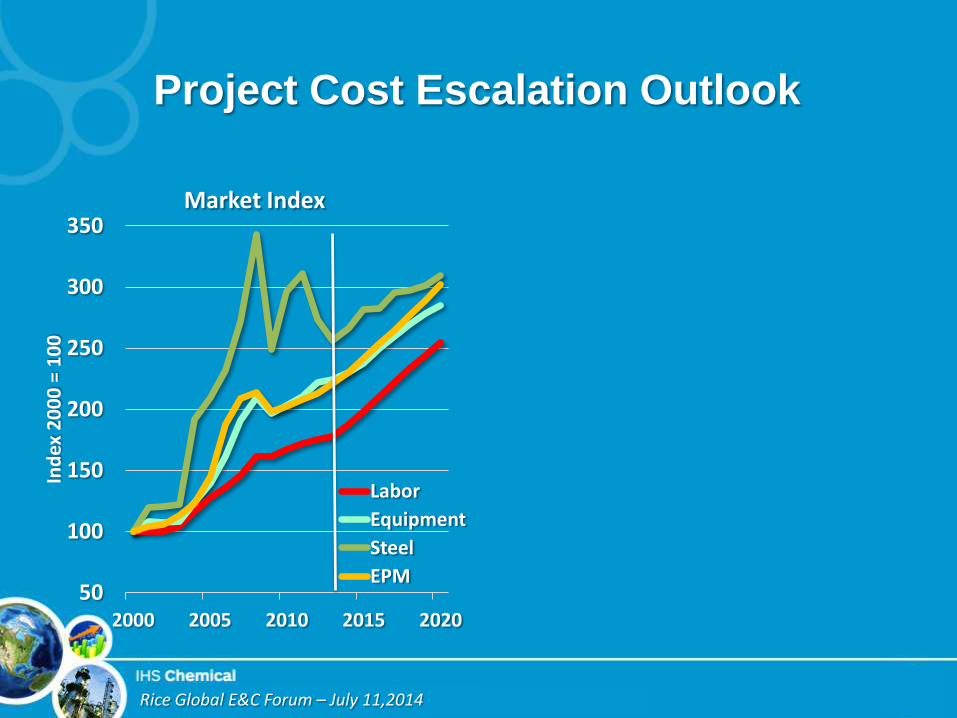
Project Cost Escalation Outlook
50
100
150
200
250
300
350
2000 2005 2010 2015 2020
Ind
ex 2
00
0 =
10
0
Market Index
Labor
Equipment
Steel
EPM
Rice Global E&C Forum – July 11,2014
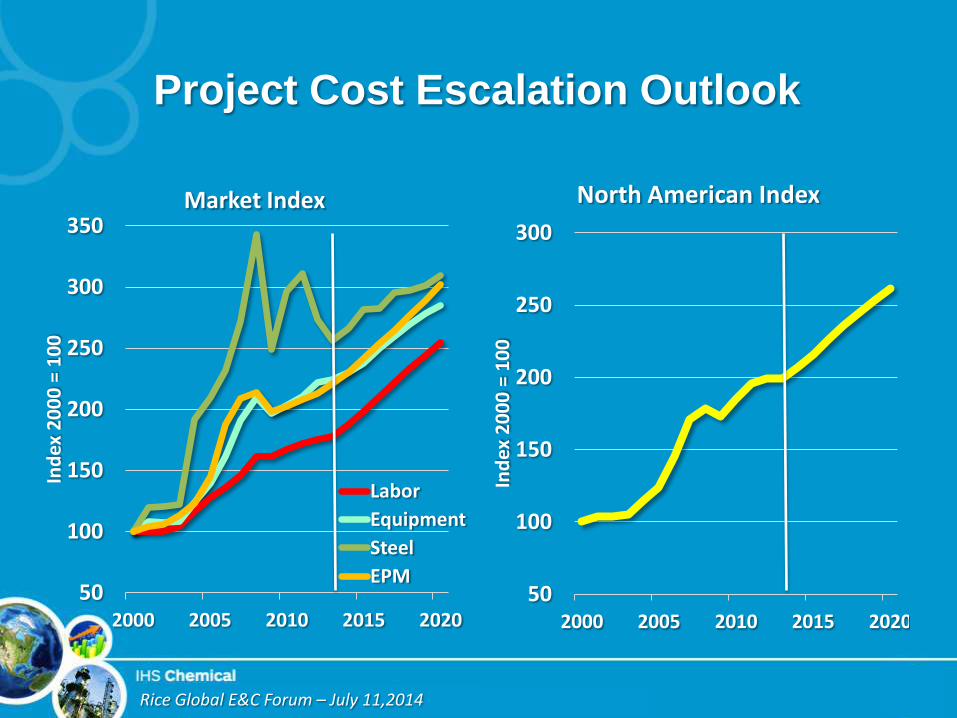
Project Cost Escalation Outlook
50
100
150
200
250
300
2000 2005 2010 2015 2020
Ind
ex 2
00
0 =
10
0
North American Index
50
100
150
200
250
300
350
2000 2005 2010 2015 2020
Ind
ex 2
00
0 =
10
0
Market Index
Labor
Equipment
Steel
EPM
Rice Global E&C Forum – July 11,2014
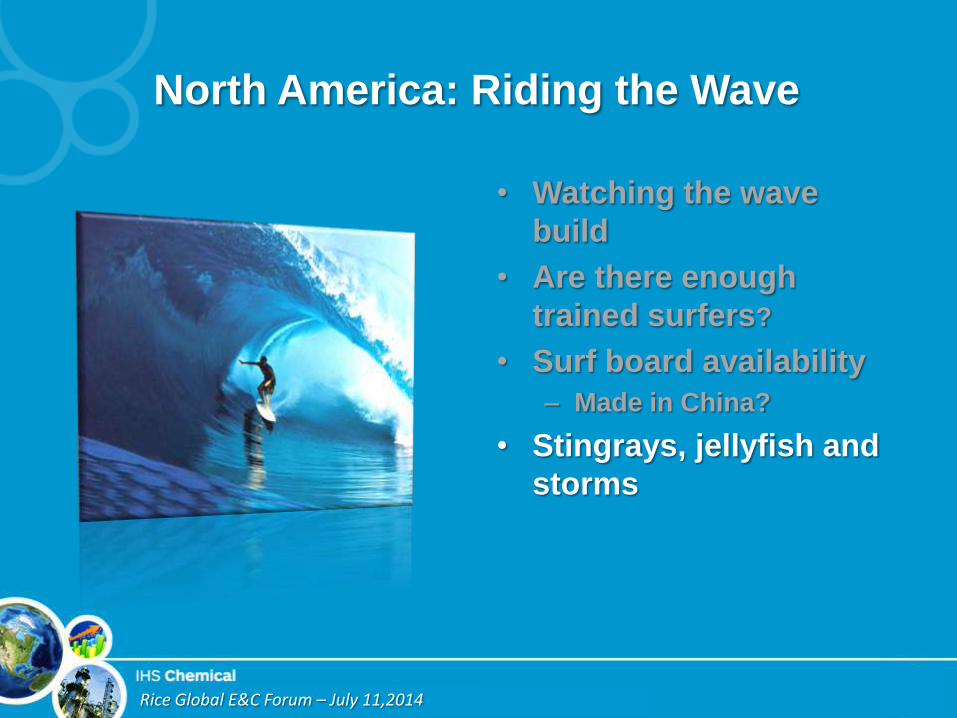
North America: Riding the Wave
• Watching the wave
build
• Are there enough
trained surfers?
• Surf board availability
– Made in China?
• Stingrays, jellyfish and
storms
Rice Global E&C Forum – July 11,2014
Hazards
• Factors that could
cause problems:
– Permit delays
– Regulatory changes
– Hurricanes
Rice Global E&C Forum – July 11,2014
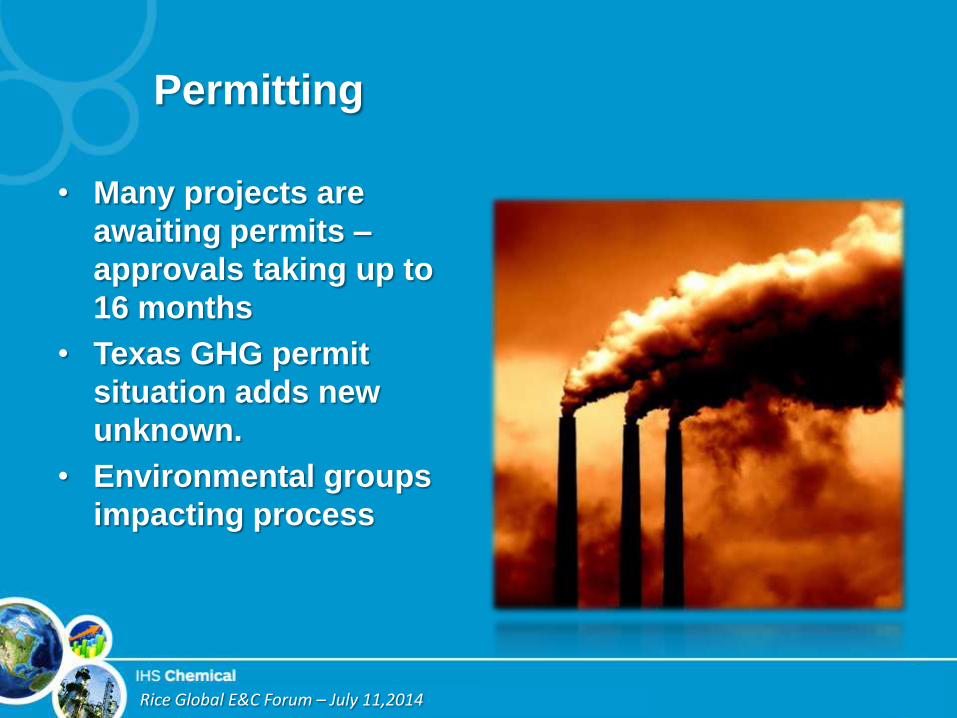
Permitting
• Many projects are
awaiting permits –
approvals taking up to
16 months
• Texas GHG permit
situation adds new
unknown.
• Environmental groups
impacting process
Rice Global E&C Forum – July 11,2014
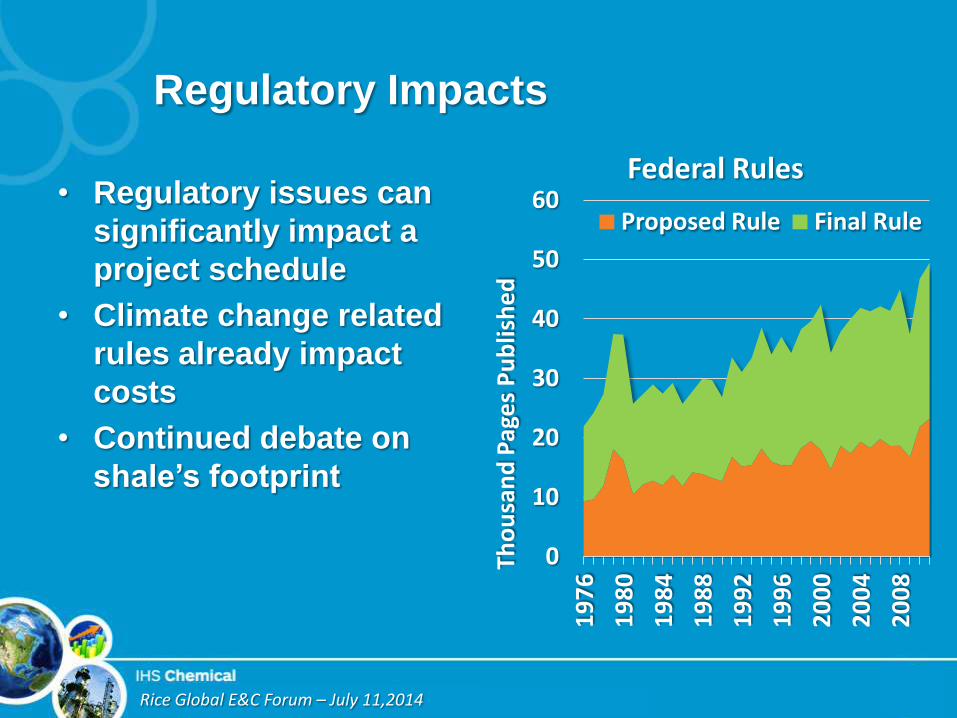
Regulatory Impacts
• Regulatory issues can
significantly impact a
project schedule
• Climate change related
rules already impact
costs
• Continued debate on
shale’s footprint
0
10
20
30
40
50
60
19
76
19
80
19
84
19
88
19
92
19
96
20
00
20
04
20
08
Tho
usa
nd
Pag
es
Pu
blis
he
d
Federal Rules
Proposed Rule Final Rule
Rice Global E&C Forum – July 11,2014
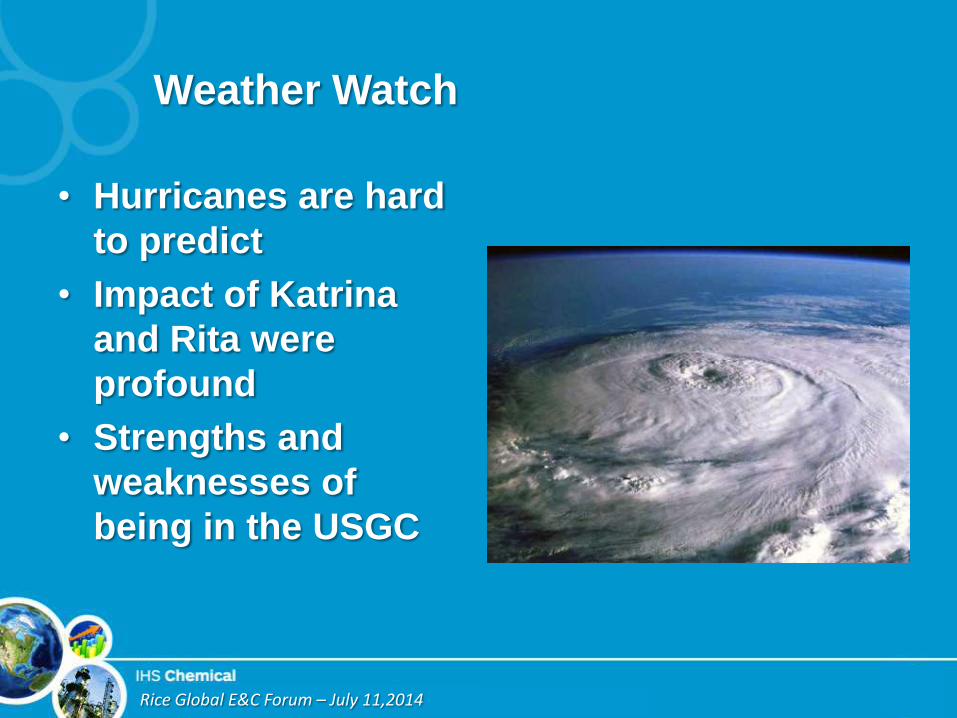
Weather Watch
• Hurricanes are hard
to predict
• Impact of Katrina
and Rita were
profound
• Strengths and
weaknesses of
being in the USGC
Rice Global E&C Forum – July 11,2014
Conclusions
• The wave will continue to build
– New project will be added
• Project delays can be anticipated
– Permitting is biggest risk here
• Project costs will increase from current levels
– Labor is the main risk factor
– Average project cost increases generally below levels
anticipated by many
• Modularization can help mitigate delays and
labor risks

Rice Global E&C Forum – July 11,2014
Better Hold On for a Good Ride
The Texas Outlook can be simply summed up in one word –
Great