Embed Size (px)
Citation preview

Leading Edge
Primer
Ribosome Footprint Profilingof Translation throughout the Genome
Nicholas T. Ingolia1,*1Department of Molecular and Cell Biology, Center for RNA Systems Biology, California Institute for Quantitative Biomedical Science,
Glenn Center for Aging Research, University of California, Berkeley, Berkeley, CA 94720, USA
*Correspondence: [email protected]
http://dx.doi.org/10.1016/j.cell.2016.02.066
Ribosome profiling has emerged as a technique for measuring translation comprehensively andquantitatively by deep sequencing of ribosome-protected mRNA fragments. By identifying theprecise positions of ribosomes, footprinting experiments have unveiled key insights into thecomposition and regulation of the expressed proteome, including delineating potentially functionalmicropeptides, revealing pervasive translation on cytosolic RNAs, and identifying differences inelongation rates driven by codon usage or other factors. This Primer looks at important experi-mental and analytical concerns for executing ribosome profiling experiments and surveys recentexamples where the approach was developed to explore protein biogenesis and homeostasis.
IntroductionTranslation is the fundamental biological process that decodes
genetic information into functional proteins. These proteins
comprise over half the dry weight of the cell, and so translation
is a major biosynthetic activity, consuming roughly half of the en-
ergy expended during rapid growth. The mechanics of the trans-
lational apparatus thus attract broad interest, and even subtle
defects in this machinery can affect human health. The protein
landscape of the cell shapes nearly every aspect of its physi-
ology, and protein production is tightly controlled. Cells rapidly
induce the production of specific proteins to mount protective
responses against stress and more slowly but thoroughly
remodel their proteome to adopt different fates during differenti-
ation. Comprehensive profiles of the proteins expressed by a cell
provide insights into its overall physiology and the roles of indi-
vidual genes. Ribosome profiling, a technique that measures
ribosome occupancy and translation genome-wide, addresses
the need for global expression measurements that integrate
translational regulation, as well as mRNA abundance, and pre-
cisely delineate translated regions in order to reveal the full cod-
ing potential of the genome.
Gene expression profiling has often focused on measuring
mRNA abundance and understanding its regulation by transcrip-
tional control. This focus was driven in part by the development
of powerful techniques to analyze nucleic acids, beginning with
microarrays (Brown and Botstein, 1999) and more recently by
high-throughput sequencing (Wang et al., 2009). Transcriptional
control greatly impacts the repertoire of proteins produced by
the cell, and mRNA profiling has provided insights into a wide
array of biological systems. Nonetheless, there are important
biological questions that cannot be addressed by mRNA mea-
surements alone. Proteomic mass spectrometry has emerged
as an approach to assess the protein content of the cell directly
(Aebersold and Mann, 2003; Vogel and Marcotte, 2012). Nucleic
acid sequencing remains more accessible and comprehensive
22 Cell 165, March 24, 2016 ª2016 Elsevier Inc.
than mass spectrometry, however, and benefits from dramatic
technological advances over the last decade (Reuter et al.,
2015). Furthermore, proteomics reports directly on the accumu-
lated abundance of a protein; the instantaneous production rate
is a distinct question.
Translational Control and Expression Profiling
Translational control of gene expression plays a prominent and
essential role throughout biology (Sonenberg and Hinnebusch,
2009). Regulated translation in early embryogenesis drives
gene expression changes in the absence of new transcription
(Curtis et al., 1995). Translational control of pre-existing mRNAs
changes protein productionmore quickly than the regulated syn-
thesis of new mRNAs, and this capacity for rapid response may
explain the prominence of translational regulation in stress re-
sponses (Spriggs et al., 2010). Translational control can also limit
protein production to specific locations within the cell, as seen in
neurons, where synaptic translation is required for long-term
potentiation and thus for memory formation (Buffington et al.,
2014).
Translation is the last stage of gene expression involving nu-
cleic acids, and so it is amenable to analysis by high-throughput
sequencing. Changes in the translation of an mRNA manifest as
differences in ribosome occupancy, which can be assessed by
fractionating polysome (i.e., poly-ribosome) structures accord-
ing to the number of ribosomes they contain. RNA profiling of
polysome fractions can determine the translational status of all
mRNAs in the cell (Arava et al., 2003), though polysome fraction-
ation provides limited quantitative resolution and cannot identify
the specific reading frames translated.
Ribosome profiling takes a ribosome-centric perspective in
order to provide a high-resolution, quantitative profile of transla-
tion across the transcriptome (Brar andWeissman, 2015; Ingolia,
2014; Ingolia et al., 2009). These profiles contain a variety of in-
formation about translation in vivo; this Primer will describe
how they are generated and how this information can be
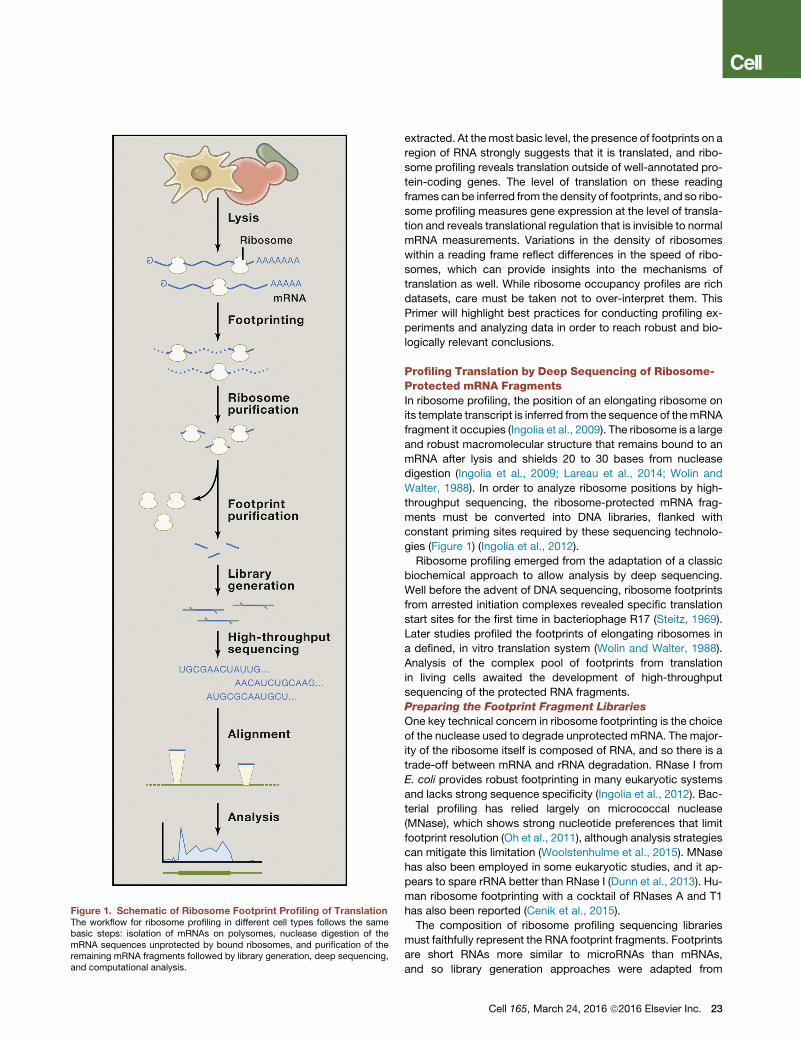
Figure 1. Schematic of Ribosome Footprint Profiling of TranslationThe workflow for ribosome profiling in different cell types follows the samebasic steps: isolation of mRNAs on polysomes, nuclease digestion of themRNA sequences unprotected by bound ribosomes, and purification of theremaining mRNA fragments followed by library generation, deep sequencing,and computational analysis.
extracted. At themost basic level, the presence of footprints on a
region of RNA strongly suggests that it is translated, and ribo-
some profiling reveals translation outside of well-annotated pro-
tein-coding genes. The level of translation on these reading
frames can be inferred from the density of footprints, and so ribo-
some profiling measures gene expression at the level of transla-
tion and reveals translational regulation that is invisible to normal
mRNA measurements. Variations in the density of ribosomes
within a reading frame reflect differences in the speed of ribo-
somes, which can provide insights into the mechanisms of
translation as well. While ribosome occupancy profiles are rich
datasets, care must be taken not to over-interpret them. This
Primer will highlight best practices for conducting profiling ex-
periments and analyzing data in order to reach robust and bio-
logically relevant conclusions.
Profiling Translation by Deep Sequencing of Ribosome-Protected mRNA FragmentsIn ribosome profiling, the position of an elongating ribosome on
its template transcript is inferred from the sequence of themRNA
fragment it occupies (Ingolia et al., 2009). The ribosome is a large
and robust macromolecular structure that remains bound to an
mRNA after lysis and shields 20 to 30 bases from nuclease
digestion (Ingolia et al., 2009; Lareau et al., 2014; Wolin and
Walter, 1988). In order to analyze ribosome positions by high-
throughput sequencing, the ribosome-protected mRNA frag-
ments must be converted into DNA libraries, flanked with
constant priming sites required by these sequencing technolo-
gies (Figure 1) (Ingolia et al., 2012).
Ribosome profiling emerged from the adaptation of a classic
biochemical approach to allow analysis by deep sequencing.
Well before the advent of DNA sequencing, ribosome footprints
from arrested initiation complexes revealed specific translation
start sites for the first time in bacteriophage R17 (Steitz, 1969).
Later studies profiled the footprints of elongating ribosomes in
a defined, in vitro translation system (Wolin and Walter, 1988).
Analysis of the complex pool of footprints from translation
in living cells awaited the development of high-throughput
sequencing of the protected RNA fragments.
Preparing the Footprint Fragment Libraries
One key technical concern in ribosome footprinting is the choice
of the nuclease used to degrade unprotected mRNA. The major-
ity of the ribosome itself is composed of RNA, and so there is a
trade-off between mRNA and rRNA degradation. RNase I from
E. coli provides robust footprinting in many eukaryotic systems
and lacks strong sequence specificity (Ingolia et al., 2012). Bac-
terial profiling has relied largely on micrococcal nuclease
(MNase), which shows strong nucleotide preferences that limit
footprint resolution (Oh et al., 2011), although analysis strategies
can mitigate this limitation (Woolstenhulme et al., 2015). MNase
has also been employed in some eukaryotic studies, and it ap-
pears to spare rRNA better than RNase I (Dunn et al., 2013). Hu-
man ribosome footprinting with a cocktail of RNases A and T1
has also been reported (Cenik et al., 2015).
The composition of ribosome profiling sequencing libraries
must faithfully represent the RNA footprint fragments. Footprints
are short RNAs more similar to microRNAs than mRNAs,
and so library generation approaches were adapted from
Cell 165, March 24, 2016 ª2016 Elsevier Inc. 23
microRNA-seq (Pfeffer et al., 2005) and optimized to streamline
themwhile reducing input RNA requirements (Ingolia et al., 2012)
(Figure 1). Current studies typically ligate a preadenylylated
oligonucleotide at the 30 terminus of the footprint fragment,
reverse transcribe, and then circularize first-strand cDNA prior
to amplification across the footprint. Ligation and circularization
seem to reduce, but not eliminate, sequence-dependent biases
in capturing RNA footprints (Levin et al., 2010).
Measuring in vivo translation also relies on preparing lysates
that give a representative snapshot of ribosome positions in
cells. Translation and ribosome occupancy can change in a mat-
ter of seconds following stress, whereas synthesis of newmRNA
occurs over many minutes (Andreev et al., 2015; Gerashchenko
et al., 2012; Liu et al., 2013; Reid et al., 2014; Shalgi et al., 2013;
Sidrauski et al., 2015). In cultured mammalian cells, rapid deter-
gent lysis suffices to stop translation. For other samples ranging
frommicrobes tomammalian tissue, rapid freezing in liquid nitro-
gen followed by cryogenic grinding captures physiologically
relevant states of translation.
Historically, polysomes were often stabilized by treating cells
with elongation inhibitors such as cycloheximide shortly before
lysis. The single-nucleotide precision offered by ribosome
profiling has revealed that these drugs are double-edged
swords, however. Ribosomes will accumulate at transcript posi-
tions that are more sensitive to drug inhibition. If the drug does
not block initiation, ribosomes will accumulate particularly at
start codons (Ingolia et al., 2011). Reversible inhibitors, such as
cycloheximide, seem to allow slow, concentration-dependent
elongation prior to lysis (Gerashchenko and Gladyshev, 2014;
Hussmann et al., 2015). Collectively, these effects can distort
codon-level ribosome profiles substantially.
Certain experimentsmay require cycloheximide pre-treatment
in order to capture the translational status of unperturbed cells.
Fortunately, these drug effects do not impact expression mea-
surements, which rely only on transcript-level ribosome occu-
pancy (Ingolia et al., 2011; Weinberg et al., 2016). Cycloheximide
does not create or destroy ribosome footprints in the middle of a
reading frame—it merely redistributes them (Hussmann et al.,
2015). Many studies employ inhibitor-free lysis to avoid this
redistribution (Lareau et al., 2014; Weinberg et al., 2016). As dis-
cussed below, drug-free samples contain a wider range of foot-
print sizes, at least in yeast, and this full range of footprints must
be sequenced (Lareau et al., 2014).
Measuring Expression Regulation
Most profiling experiments are designed to detect relative
expression changes, with experimental design and analysis
similar to mRNA-seq profiling. In both cases, expression
changes are inferred from sequencing read counts on transcripts
(for mRNA-seq) or coding sequences (for ribosome profiling),
which are subject to statistical, technical, and biological variation
(Anders et al., 2013; Wang et al., 2009). Replicate measurements
are essential to assess the magnitude of variation through com-
parisons within replicates of a single condition and to infer
expression changes when differences between conditions
exceed this variation. Like all genome-wide expression profiling,
these data include comparisons between thousands of genes
with only a few replicate measurements for each gene, and so
it is impossible to fit per-gene error models. Fortunately, it is
24 Cell 165, March 24, 2016 ª2016 Elsevier Inc.
theoretically and empirically justifiable to fit a single error model
across all genes and use it to identify expression differences be-
tween conditions, place confidence intervals on the magnitude
of the change, and exclude genes showing aberrantly high
variability.
Read count measurements in deep sequencing data require
normalization between samples. Trivially, greater sequencing
depth for one sample relative to another will yield more reads
counted for each gene. Statistical frameworks for read count
analysis typically account for this library size factor but rely on
the assumption that most genes show similar expression be-
tween different samples (Bullard et al., 2010). While this
approach is more robust than normalization against a few
selected ‘‘housekeeping’’ genes, it may fail in the case of broad
expression reprogramming (Loven et al., 2012). The global
translational status of cells can change quickly, through the inac-
tivation or the reactivation of ribosomes. Because inactive ribo-
somes produce no footprints, these global translational shifts
affect the denominator in the library size normalization. Tran-
scripts with unchanged translation during a global shift may
appear to increase or decrease translation, while the global shift
itself cannot be detected. In effect, normalized ribosome
profiling read counts indicate the fraction of all active ribosomes
that are translating a gene (Figure 3B).
Internal or exogenous standards may circumvent this limita-
tion and allow measurement of changes in overall translation.
While no universal strategy has emerged for tackling this prob-
lem, we have found that mitochondrial ribosome footprints pro-
vide an excellent internal standard for experiments that involve
short-term perturbations targeting cytosolic translation specif-
ically. This normalization is inapplicable when mitochondrial
abundance or activity changes, however, and bulk translational
changes remain a point of concern in. Synthetic oligonucleotides
can serve as internal standards that, when combinedwith careful
quantitation of RNA inputs, can likewise account for changes in
overall ribosome activity (Andreev et al., 2015).
Identifying Translated Regions of the GenomeIn the textbook view of eukaryotic translation, ribosomes initiate
at the first AUG on an mRNA and translate a single, long open
reading frame (Hinnebusch, 2014). Biologists appreciate many
individual exceptions, where translation may skip an AUG,
initiate at a non-AUG codon, shift the reading frame in themiddle
of translation, or read through the stop codon (Gesteland and
Atkins, 1996; Hinnebusch, 2014). The global view of translation
provided by ribosome profiling further complicates this picture,
revealing widespread and pervasive translation on cytosolic
RNAs, protein isoform variants of annotated genes, and specific
micropeptides overlooked by genome annotation (Bazzini et al.,
2014; Calviello et al., 2016; Chew et al., 2013; Crappe et al.,
2015; Dunn et al., 2013; Fields et al., 2015; Ingolia et al., 2011;
Ji et al., 2015; Michel et al., 2012). The functional impact of
much of this translation remains to be explored, and ribosome
profiling data provide a map to guide this exploration.
Redefining Translated Sequences
Eukaryotic ribosome profiling data have consistently revealed
unexpected ribosome occupancy outside of known protein-cod-
ing genes in patterns that fit accepted models of translation
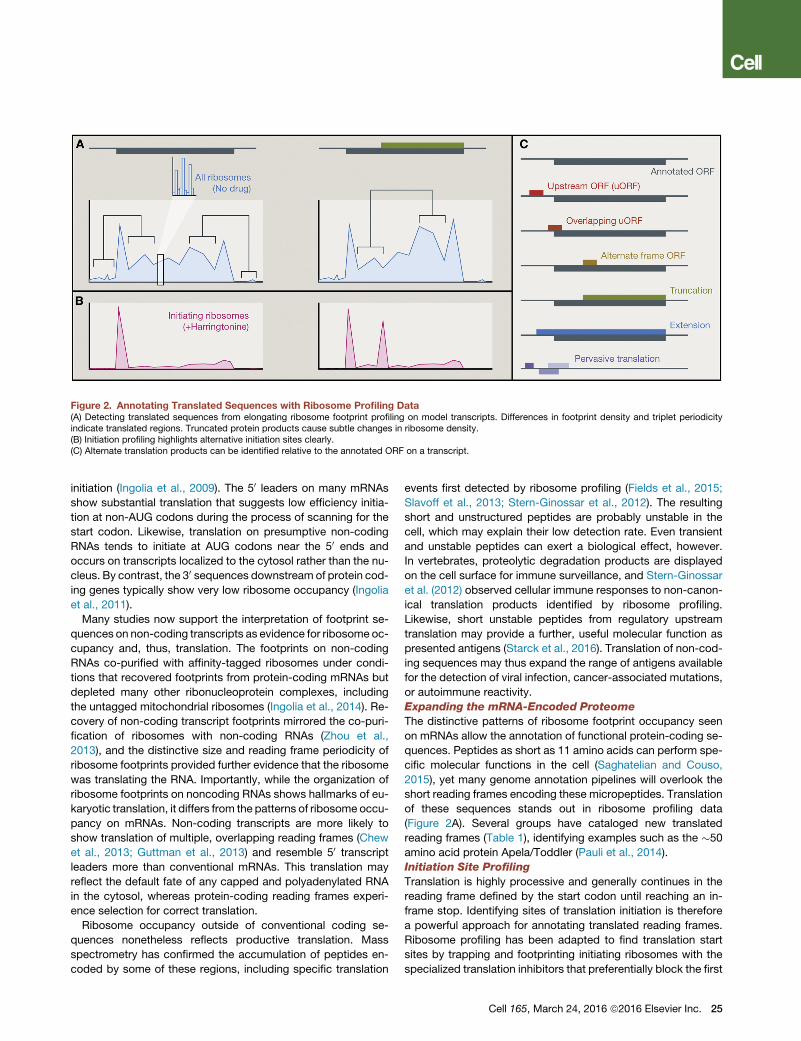
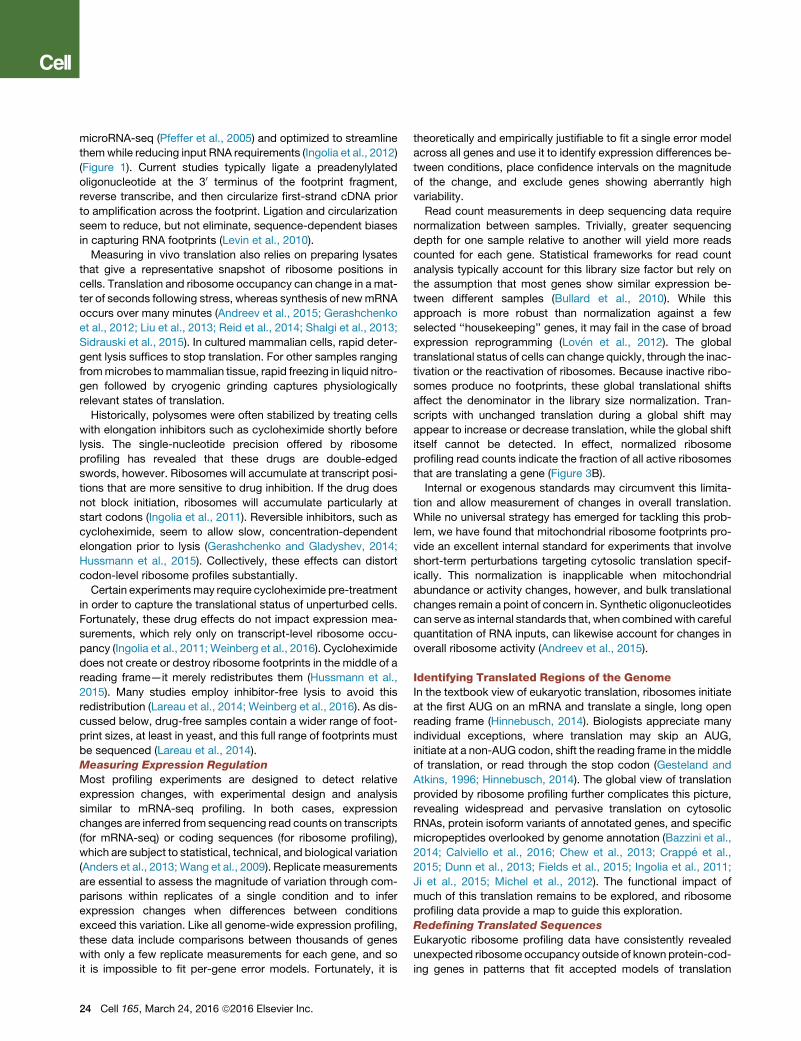
Figure 2. Annotating Translated Sequences with Ribosome Profiling Data(A) Detecting translated sequences from elongating ribosome footprint profiling on model transcripts. Differences in footprint density and triplet periodicityindicate translated regions. Truncated protein products cause subtle changes in ribosome density.(B) Initiation profiling highlights alternative initiation sites clearly.(C) Alternate translation products can be identified relative to the annotated ORF on a transcript.
initiation (Ingolia et al., 2009). The 50 leaders on many mRNAs
show substantial translation that suggests low efficiency initia-
tion at non-AUG codons during the process of scanning for the
start codon. Likewise, translation on presumptive non-coding
RNAs tends to initiate at AUG codons near the 50 ends and
occurs on transcripts localized to the cytosol rather than the nu-
cleus. By contrast, the 30 sequences downstream of protein cod-
ing genes typically show very low ribosome occupancy (Ingolia
et al., 2011).
Many studies now support the interpretation of footprint se-
quences on non-coding transcripts as evidence for ribosome oc-
cupancy and, thus, translation. The footprints on non-coding
RNAs co-purified with affinity-tagged ribosomes under condi-
tions that recovered footprints from protein-coding mRNAs but
depleted many other ribonucleoprotein complexes, including
the untagged mitochondrial ribosomes (Ingolia et al., 2014). Re-
covery of non-coding transcript footprints mirrored the co-puri-
fication of ribosomes with non-coding RNAs (Zhou et al.,
2013), and the distinctive size and reading frame periodicity of
ribosome footprints provided further evidence that the ribosome
was translating the RNA. Importantly, while the organization of
ribosome footprints on noncoding RNAs shows hallmarks of eu-
karyotic translation, it differs from the patterns of ribosome occu-
pancy on mRNAs. Non-coding transcripts are more likely to
show translation of multiple, overlapping reading frames (Chew
et al., 2013; Guttman et al., 2013) and resemble 50 transcriptleaders more than conventional mRNAs. This translation may
reflect the default fate of any capped and polyadenylated RNA
in the cytosol, whereas protein-coding reading frames experi-
ence selection for correct translation.
Ribosome occupancy outside of conventional coding se-
quences nonetheless reflects productive translation. Mass
spectrometry has confirmed the accumulation of peptides en-
coded by some of these regions, including specific translation
events first detected by ribosome profiling (Fields et al., 2015;
Slavoff et al., 2013; Stern-Ginossar et al., 2012). The resulting
short and unstructured peptides are probably unstable in the
cell, which may explain their low detection rate. Even transient
and unstable peptides can exert a biological effect, however.
In vertebrates, proteolytic degradation products are displayed
on the cell surface for immune surveillance, and Stern-Ginossar
et al. (2012) observed cellular immune responses to non-canon-
ical translation products identified by ribosome profiling.
Likewise, short unstable peptides from regulatory upstream
translation may provide a further, useful molecular function as
presented antigens (Starck et al., 2016). Translation of non-cod-
ing sequences may thus expand the range of antigens available
for the detection of viral infection, cancer-associated mutations,
or autoimmune reactivity.
Expanding the mRNA-Encoded Proteome
The distinctive patterns of ribosome footprint occupancy seen
on mRNAs allow the annotation of functional protein-coding se-
quences. Peptides as short as 11 amino acids can perform spe-
cific molecular functions in the cell (Saghatelian and Couso,
2015), yet many genome annotation pipelines will overlook the
short reading frames encoding these micropeptides. Translation
of these sequences stands out in ribosome profiling data
(Figure 2A). Several groups have cataloged new translated
reading frames (Table 1), identifying examples such as the �50
amino acid protein Apela/Toddler (Pauli et al., 2014).
Initiation Site Profiling
Translation is highly processive and generally continues in the
reading frame defined by the start codon until reaching an in-
frame stop. Identifying sites of translation initiation is therefore
a powerful approach for annotating translated reading frames.
Ribosome profiling has been adapted to find translation start
sites by trapping and footprinting initiating ribosomes with the
specialized translation inhibitors that preferentially block the first
Cell 165, March 24, 2016 ª2016 Elsevier Inc. 25
Table 1. Algorithms and Tools for Reading Frame Annotation and Discovery
Algorithm or Metric Input Data Output Classification Reference
Periodicity transition score elongating ribosome frame Dual-coding regions Michel et al. (2012)
Translated ORF classifier elongating ribosome density CDS ORF/50 UTR ORF/30 UTR ORF Chew et al. (2013)
Ribosome release score elongating ribosome density CDS-like Guttman et al. (2013)
Change point analysis elongating ribosome occupancy novel isoforms; alternate frames; drop-off Zupanic et al. (2014)
FLOSS footprint length true ribosome occupancy Ingolia et al. (2014)
ORF score elongating ribosome frame short ORFs Bazzini et al. (2014)
PROTEOFORMER elongating ribosome density; mass
spectrometry
short ORFs; novel isoforms Crappe et al. (2015)
N/A elongating ribosome density stop read-through Dunn et al. (2013)
RiboTaper elongating ribosome frame short ORFs; novel isoforms Calviello et al. (2016)
ORF-RATER elongating ribosome frame; footprint
length; Harr/LTM initiation
short ORFs; novel isoforms Fields et al. (2015)
RibORF elongating ribosome frame; elongating
ribosome evenness
Ji et al. (2015)
A variety of algorithms and metrics can use ribosome profiling data to annotate translated regions of the genome. These algorithms are listed, along
with the profiling data features they use (input data) and the output classification they provide.
step of elongation. Harringtonine almost immediately captures
initiating ribosomes, while depleting other ribosomes by run-off
elongation (Ingolia et al., 2011), and so ribosome profiling per-
formed after brief harringtonine treatment results in isolated foot-
print peaks at initiation codons (Figure 2B). Lactimidomycin acts
more gradually to trap initiating ribosomes (Lee et al., 2012). Initi-
ation sites can also be defined by depleting most elongating ri-
bosomes using the drug puromycin (Fritsch et al., 2012) or by
sequential treatment with lactimidomycin, to stabilize initiating ri-
bosomes, followed by puromycin, to destabilize other ribosomes
(Gao et al., 2015).
Initiation site profiling confirms that the unexpected ribosome
occupancy seen in many parts of the transcriptome reflects sub-
stantial levels of non-AUG initiation. Translation of a few specific
genes, including the oncogene c-Myc, has long been known to
initiate at certain ‘‘near-cognate’’ non-AUG codons that differ
from AUG by one nucleotide (Hann et al., 1988), but the preva-
lence of these alternative start sites was not previously appreci-
ated. Evidence for shorter and potentially less stable protein
products from non-AUG initiation has emerged in parallel with
ribosome profiling analysis of these initiation sites (Slavoff
et al., 2013; Starck et al., 2016).
Alternative Protein Isoforms
Initiation site detection synergizes with bioinformatic analysis of
elongating ribosome profiling data to robustly annotate trans-
lated sequences (Figure 2C). For example, integrative analysis
of profiling data in primary mouse cells revealed translation of
over a thousand upstream reading frames, along with hundreds
of translated reading frames on transcripts with no previous pro-
tein-coding annotation (Fields et al., 2015). Protein isoform vari-
ants of known genes were even more prevalent in the dataset,
resulting from alternative translation initiation or pre-mRNA
splicing. Initiation site footprinting is particularly important for
discovering these isoform variants because internal start sites
stand out dramatically after harringtonine treatment but cause
only a subtle increase in downstream elongating ribosome den-
sity (Figure 2B).
26 Cell 165, March 24, 2016 ª2016 Elsevier Inc.
Distinct protein isoform variants can display different and even
opposing functions, just as protein truncation mutations often
create dominant-negative alleles. Internal translation initiation
in C/EBP transcription factors creates truncated protein iso-
forms that lack the trans-activation domain but retain the DNA-
binding domains, and so they compete with full-length activator
protein at the same binding sites (Descombes and Schibler,
1991). In another example, ribosome profiling has confirmed
that internal initiation creates an analogous inhibitory truncation
in the innate immune signaling protein Mavs (Brubaker et al.,
2014), which oligomerizes with full-length protein but lacks
signaling domains and thus blocks interferon induction. The
wealth of truncations seen in ribosome profiling data suggests
that inhibitory isoforms may be quite widespread.
Amino-terminal extensions may cause more diverse and less
predictable changes to protein function. For example, the exten-
sion on the long isoform of the tumor suppressor PTEN may lead
to its secretion, or change its localization and activity within the
cell (Pulido et al., 2014). Such extensions generally result from
non-AUG initiation, which is inefficient and thus allows a large pro-
portion of scanning pre-initiation complexes to bypass the first
start siteand initiatedownstreamtoproduce thecanonicalprotein.
Profiling Gene Expression at the Level of TranslationGene expression profiling is a powerful discovery tool for con-
necting cellular physiology and gene function (Brown and Bot-
stein, 1999). Cells tightly control gene expression in response
to their physiological state, so the expression changes of well-
characterized genes reveal the molecular situation inside the
cell while co-regulation of uncharacterized genes links them
back to known pathways. Cells control gene expression in order
to modulate protein synthesis and ultimately protein abundance,
and so regulated translation can play a central role in determining
expression patterns.
Quantitative Translational Profiling
The density of ribosomes translating a reading frame reflects
the amount of the encoded protein produced. Each footprint
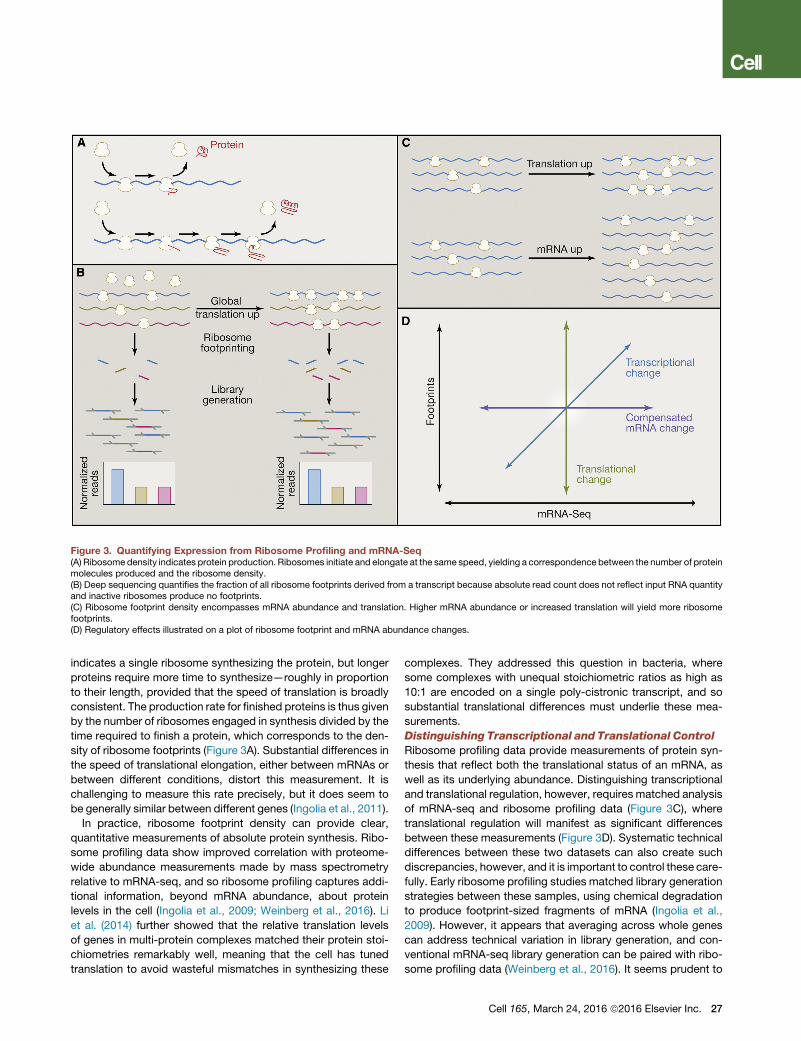
Figure 3. Quantifying Expression from Ribosome Profiling and mRNA-Seq(A) Ribosome density indicates protein production. Ribosomes initiate and elongate at the same speed, yielding a correspondence between the number of proteinmolecules produced and the ribosome density.(B) Deep sequencing quantifies the fraction of all ribosome footprints derived from a transcript because absolute read count does not reflect input RNA quantityand inactive ribosomes produce no footprints.(C) Ribosome footprint density encompasses mRNA abundance and translation. Higher mRNA abundance or increased translation will yield more ribosomefootprints.(D) Regulatory effects illustrated on a plot of ribosome footprint and mRNA abundance changes.
indicates a single ribosome synthesizing the protein, but longer
proteins require more time to synthesize—roughly in proportion
to their length, provided that the speed of translation is broadly
consistent. The production rate for finished proteins is thus given
by the number of ribosomes engaged in synthesis divided by the
time required to finish a protein, which corresponds to the den-
sity of ribosome footprints (Figure 3A). Substantial differences in
the speed of translational elongation, either between mRNAs or
between different conditions, distort this measurement. It is
challenging to measure this rate precisely, but it does seem to
be generally similar between different genes (Ingolia et al., 2011).
In practice, ribosome footprint density can provide clear,
quantitative measurements of absolute protein synthesis. Ribo-
some profiling data show improved correlation with proteome-
wide abundance measurements made by mass spectrometry
relative to mRNA-seq, and so ribosome profiling captures addi-
tional information, beyond mRNA abundance, about protein
levels in the cell (Ingolia et al., 2009; Weinberg et al., 2016). Li
et al. (2014) further showed that the relative translation levels
of genes in multi-protein complexes matched their protein stoi-
chiometries remarkably well, meaning that the cell has tuned
translation to avoid wasteful mismatches in synthesizing these
complexes. They addressed this question in bacteria, where
some complexes with unequal stoichiometric ratios as high as
10:1 are encoded on a single poly-cistronic transcript, and so
substantial translational differences must underlie these mea-
surements.
Distinguishing Transcriptional and Translational Control
Ribosome profiling data provide measurements of protein syn-
thesis that reflect both the translational status of an mRNA, as
well as its underlying abundance. Distinguishing transcriptional
and translational regulation, however, requires matched analysis
of mRNA-seq and ribosome profiling data (Figure 3C), where
translational regulation will manifest as significant differences
between these measurements (Figure 3D). Systematic technical
differences between these two datasets can also create such
discrepancies, however, and it is important to control these care-
fully. Early ribosome profiling studies matched library generation
strategies between these samples, using chemical degradation
to produce footprint-sized fragments of mRNA (Ingolia et al.,
2009). However, it appears that averaging across whole genes
can address technical variation in library generation, and con-
ventional mRNA-seq library generation can be paired with ribo-
some profiling data (Weinberg et al., 2016). It seems prudent to
Cell 165, March 24, 2016 ª2016 Elsevier Inc. 27
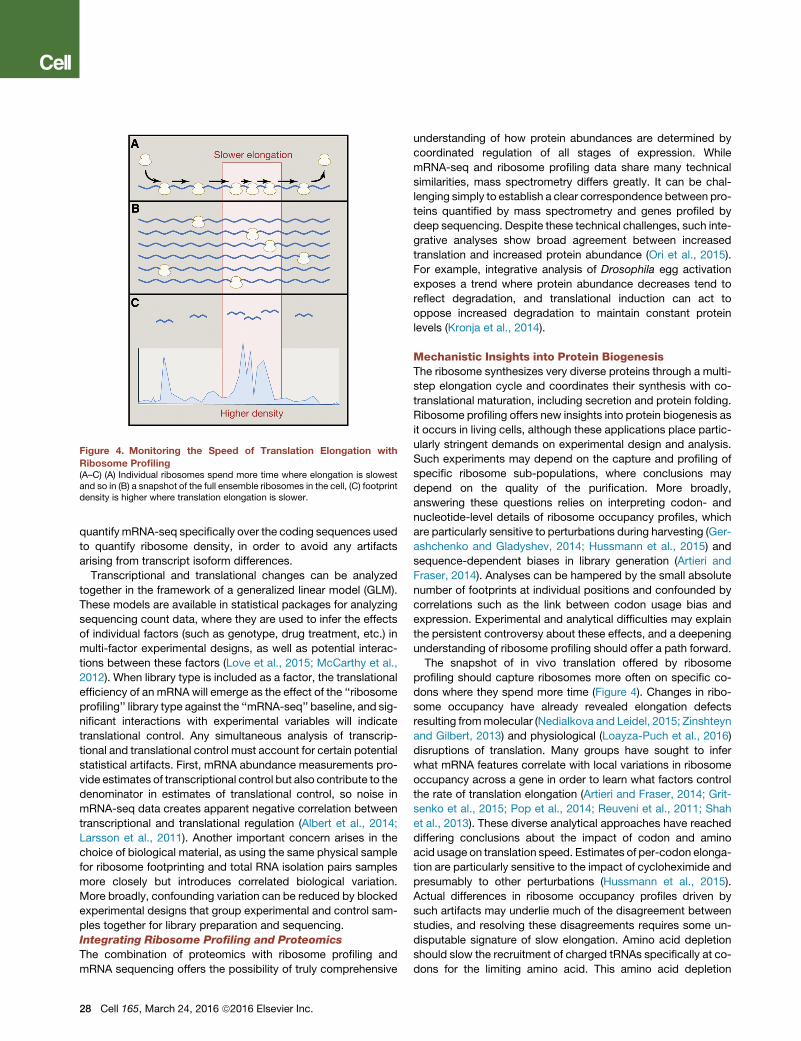
Figure 4. Monitoring the Speed of Translation Elongation with
Ribosome Profiling(A–C) (A) Individual ribosomes spend more time where elongation is slowestand so in (B) a snapshot of the full ensemble ribosomes in the cell, (C) footprintdensity is higher where translation elongation is slower.
quantify mRNA-seq specifically over the coding sequences used
to quantify ribosome density, in order to avoid any artifacts
arising from transcript isoform differences.
Transcriptional and translational changes can be analyzed
together in the framework of a generalized linear model (GLM).
These models are available in statistical packages for analyzing
sequencing count data, where they are used to infer the effects
of individual factors (such as genotype, drug treatment, etc.) in
multi-factor experimental designs, as well as potential interac-
tions between these factors (Love et al., 2015; McCarthy et al.,
2012). When library type is included as a factor, the translational
efficiency of an mRNA will emerge as the effect of the ‘‘ribosome
profiling’’ library type against the ‘‘mRNA-seq’’ baseline, and sig-
nificant interactions with experimental variables will indicate
translational control. Any simultaneous analysis of transcrip-
tional and translational control must account for certain potential
statistical artifacts. First, mRNA abundance measurements pro-
vide estimates of transcriptional control but also contribute to the
denominator in estimates of translational control, so noise in
mRNA-seq data creates apparent negative correlation between
transcriptional and translational regulation (Albert et al., 2014;
Larsson et al., 2011). Another important concern arises in the
choice of biological material, as using the same physical sample
for ribosome footprinting and total RNA isolation pairs samples
more closely but introduces correlated biological variation.
More broadly, confounding variation can be reduced by blocked
experimental designs that group experimental and control sam-
ples together for library preparation and sequencing.
Integrating Ribosome Profiling and Proteomics
The combination of proteomics with ribosome profiling and
mRNA sequencing offers the possibility of truly comprehensive
28 Cell 165, March 24, 2016 ª2016 Elsevier Inc.
understanding of how protein abundances are determined by
coordinated regulation of all stages of expression. While
mRNA-seq and ribosome profiling data share many technical
similarities, mass spectrometry differs greatly. It can be chal-
lenging simply to establish a clear correspondence between pro-
teins quantified by mass spectrometry and genes profiled by
deep sequencing. Despite these technical challenges, such inte-
grative analyses show broad agreement between increased
translation and increased protein abundance (Ori et al., 2015).
For example, integrative analysis of Drosophila egg activation
exposes a trend where protein abundance decreases tend to
reflect degradation, and translational induction can act to
oppose increased degradation to maintain constant protein
levels (Kronja et al., 2014).
Mechanistic Insights into Protein BiogenesisThe ribosome synthesizes very diverse proteins through a multi-
step elongation cycle and coordinates their synthesis with co-
translational maturation, including secretion and protein folding.
Ribosome profiling offers new insights into protein biogenesis as
it occurs in living cells, although these applications place partic-
ularly stringent demands on experimental design and analysis.
Such experiments may depend on the capture and profiling of
specific ribosome sub-populations, where conclusions may
depend on the quality of the purification. More broadly,
answering these questions relies on interpreting codon- and
nucleotide-level details of ribosome occupancy profiles, which
are particularly sensitive to perturbations during harvesting (Ger-
ashchenko and Gladyshev, 2014; Hussmann et al., 2015) and
sequence-dependent biases in library generation (Artieri and
Fraser, 2014). Analyses can be hampered by the small absolute
number of footprints at individual positions and confounded by
correlations such as the link between codon usage bias and
expression. Experimental and analytical difficulties may explain
the persistent controversy about these effects, and a deepening
understanding of ribosome profiling should offer a path forward.
The snapshot of in vivo translation offered by ribosome
profiling should capture ribosomes more often on specific co-
dons where they spend more time (Figure 4). Changes in ribo-
some occupancy have already revealed elongation defects
resulting frommolecular (Nedialkova and Leidel, 2015; Zinshteyn
and Gilbert, 2013) and physiological (Loayza-Puch et al., 2016)
disruptions of translation. Many groups have sought to infer
what mRNA features correlate with local variations in ribosome
occupancy across a gene in order to learn what factors control
the rate of translation elongation (Artieri and Fraser, 2014; Grit-
senko et al., 2015; Pop et al., 2014; Reuveni et al., 2011; Shah
et al., 2013). These diverse analytical approaches have reached
differing conclusions about the impact of codon and amino
acid usage on translation speed. Estimates of per-codon elonga-
tion are particularly sensitive to the impact of cycloheximide and
presumably to other perturbations (Hussmann et al., 2015).
Actual differences in ribosome occupancy profiles driven by
such artifacts may underlie much of the disagreement between
studies, and resolving these disagreements requires some un-
disputable signature of slow elongation. Amino acid depletion
should slow the recruitment of charged tRNAs specifically at co-
dons for the limiting amino acid. This amino acid depletion
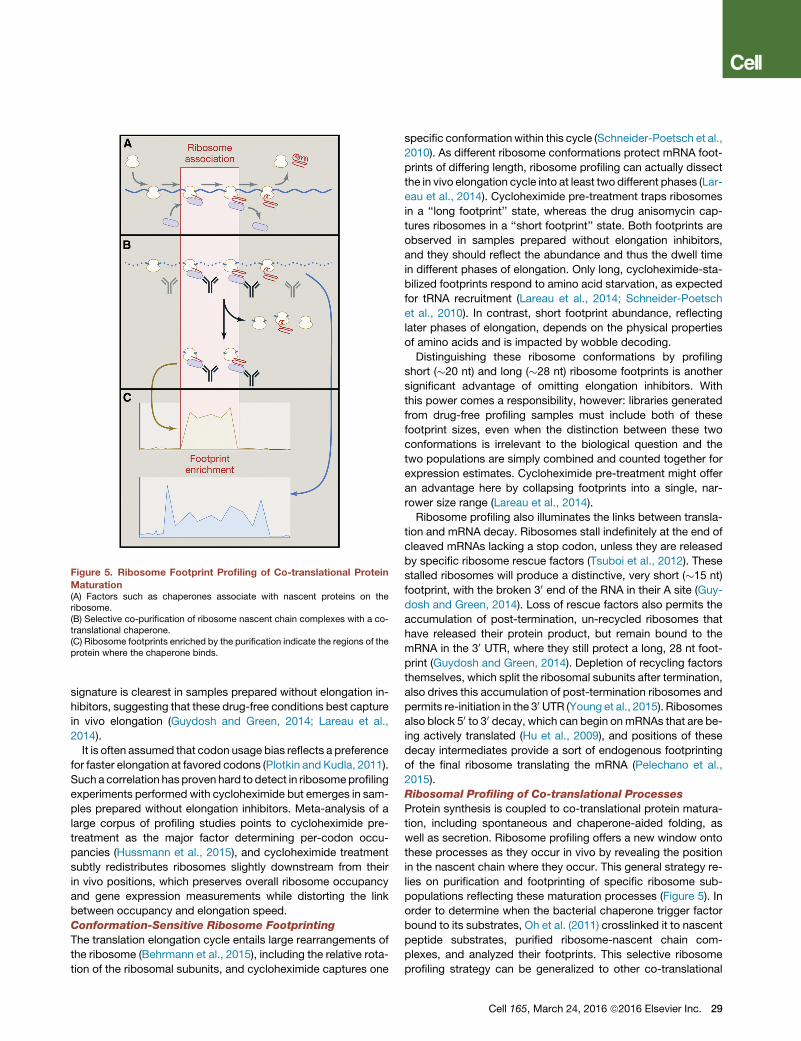
Figure 5. Ribosome Footprint Profiling of Co-translational Protein
Maturation(A) Factors such as chaperones associate with nascent proteins on theribosome.(B) Selective co-purification of ribosome nascent chain complexes with a co-translational chaperone.(C) Ribosome footprints enriched by the purification indicate the regions of theprotein where the chaperone binds.
signature is clearest in samples prepared without elongation in-
hibitors, suggesting that these drug-free conditions best capture
in vivo elongation (Guydosh and Green, 2014; Lareau et al.,
2014).
It is often assumed that codon usage bias reflects a preference
for faster elongation at favored codons (Plotkin and Kudla, 2011).
Such a correlation has proven hard to detect in ribosomeprofiling
experiments performed with cycloheximide but emerges in sam-
ples prepared without elongation inhibitors. Meta-analysis of a
large corpus of profiling studies points to cycloheximide pre-
treatment as the major factor determining per-codon occu-
pancies (Hussmann et al., 2015), and cycloheximide treatment
subtly redistributes ribosomes slightly downstream from their
in vivo positions, which preserves overall ribosome occupancy
and gene expression measurements while distorting the link
between occupancy and elongation speed.
Conformation-Sensitive Ribosome Footprinting
The translation elongation cycle entails large rearrangements of
the ribosome (Behrmann et al., 2015), including the relative rota-
tion of the ribosomal subunits, and cycloheximide captures one
specific conformationwithin this cycle (Schneider-Poetsch et al.,
2010). As different ribosome conformations protect mRNA foot-
prints of differing length, ribosome profiling can actually dissect
the in vivo elongation cycle into at least two different phases (Lar-
eau et al., 2014). Cycloheximide pre-treatment traps ribosomes
in a ‘‘long footprint’’ state, whereas the drug anisomycin cap-
tures ribosomes in a ‘‘short footprint’’ state. Both footprints are
observed in samples prepared without elongation inhibitors,
and they should reflect the abundance and thus the dwell time
in different phases of elongation. Only long, cycloheximide-sta-
bilized footprints respond to amino acid starvation, as expected
for tRNA recruitment (Lareau et al., 2014; Schneider-Poetsch
et al., 2010). In contrast, short footprint abundance, reflecting
later phases of elongation, depends on the physical properties
of amino acids and is impacted by wobble decoding.
Distinguishing these ribosome conformations by profiling
short (�20 nt) and long (�28 nt) ribosome footprints is another
significant advantage of omitting elongation inhibitors. With
this power comes a responsibility, however: libraries generated
from drug-free profiling samples must include both of these
footprint sizes, even when the distinction between these two
conformations is irrelevant to the biological question and the
two populations are simply combined and counted together for
expression estimates. Cycloheximide pre-treatment might offer
an advantage here by collapsing footprints into a single, nar-
rower size range (Lareau et al., 2014).
Ribosome profiling also illuminates the links between transla-
tion and mRNA decay. Ribosomes stall indefinitely at the end of
cleaved mRNAs lacking a stop codon, unless they are released
by specific ribosome rescue factors (Tsuboi et al., 2012). These
stalled ribosomes will produce a distinctive, very short (�15 nt)
footprint, with the broken 30 end of the RNA in their A site (Guy-
dosh and Green, 2014). Loss of rescue factors also permits the
accumulation of post-termination, un-recycled ribosomes that
have released their protein product, but remain bound to the
mRNA in the 30 UTR, where they still protect a long, 28 nt foot-
print (Guydosh and Green, 2014). Depletion of recycling factors
themselves, which split the ribosomal subunits after termination,
also drives this accumulation of post-termination ribosomes and
permits re-initiation in the 30 UTR (Young et al., 2015). Ribosomes
also block 50 to 30 decay, which can begin onmRNAs that are be-
ing actively translated (Hu et al., 2009), and positions of these
decay intermediates provide a sort of endogenous footprinting
of the final ribosome translating the mRNA (Pelechano et al.,
2015).
Ribosomal Profiling of Co-translational Processes
Protein synthesis is coupled to co-translational protein matura-
tion, including spontaneous and chaperone-aided folding, as
well as secretion. Ribosome profiling offers a new window onto
these processes as they occur in vivo by revealing the position
in the nascent chain where they occur. This general strategy re-
lies on purification and footprinting of specific ribosome sub-
populations reflecting these maturation processes (Figure 5). In
order to determine when the bacterial chaperone trigger factor
bound to its substrates, Oh et al. (2011) crosslinked it to nascent
peptide substrates, purified ribosome-nascent chain com-
plexes, and analyzed their footprints. This selective ribosome
profiling strategy can be generalized to other co-translational
Cell 165, March 24, 2016 ª2016 Elsevier Inc. 29
Table 2. Databases for Ribosome Profiling Data
Database Data Collected Reference
TISdb translation initiation sites Wan and Qian, 2014
GWIPS-viz footprint genome browser;
mRNA-seq genome
browser
Michel et al., 2014
RPFdb footprint genome browser;
expression measurements
Xie et al., 2016
http://sORFs.org short ORF annotations Olexiouk et al., 2016
Several databases now collect ribosome profiling data and genome
annotations derived from this data.
factors in bacteria and in eukaryotes (Becker et al., 2013) and
applied to monitor spontaneous protein folding by conforma-
tion-specific nascent chain purification (Han et al., 2012).
Selective ribosome profiling is limited by its dependence on
the biochemical purification of targeted ribosome populations.
Important features of translation, such as sub-cellular localiza-
tion, are generally disrupted during lysis. In certain cases, ribo-
somes can be fractionated by differential extraction, allowing
comparison of footprints from ribosomes released by limited
permeabilization to those retained until membranes are fully
solubilized (Reid and Nicchitta, 2012). Such fractionation is tech-
nically challenging and cannot resolve, e.g., differentmembrane-
bound organelles or different cytosolic locations within polarized
cells. To circumvent this limitation, Jan and colleagues tagged
ribosome sub-populations in vivo for subsequent purification us-
ing proximity-dependent biotinylation (Jan et al., 2014; Williams
et al., 2014). They expressed a bacterial biotin ligase on the
membranes of organelles within the cell and fused the cognate
biotin acceptor peptide to a ribosomal protein. Ribosome bio-
tinylation was spatially restricted to the region of the membrane
and temporally controlled by the addition and removal of exoge-
nous biotin. Such precise selection of ribosomes provided new
insights into protein targeting and offers similar possibilities for
other biological systems where suitable biotin ligase fusions
can be encoded genetically.
The Next Steps for FootprintingRibosome profiling offers precise and quantitative measure-
ments of translation and coupled processes in vivo. It can
already be applied to the wide array of biological questions
that can be addressed by gene expression profiling and offers
particular insights when translational control is important.
Ongoing technical advances will simplify library construction
and decrease input material requirements, which are already
compatible with simple cell culture experiments and small tissue
samples. Ultimately, ribosome profiling may reach the single-cell
resolution that has recently been achieved formRNA sequencing
and chromatin immunoprecipitation (Grun and van Oudenaar-
den, 2015), though technical challenges remain for single-cell
translational measurements. Profiling specific lineages within
heterogeneous tissues seems more immediately accessible.
Cell-type-specific profiling can be accomplished by tagging
ribosomes in a lineage of interest and purifying these tagged ri-
bosomes from a whole-tissue lysate containing untagged ribo-
30 Cell 165, March 24, 2016 ª2016 Elsevier Inc.
somes from other cells (Heiman et al., 2008). This translating
ribosome affinity purification (TRAP), and the related RiboTag
approach (Sanz et al., 2009), have already enabled whole tran-
script profiling from very specific neuronal sub-types, and they
seem compatible with ribosome footprinting. Ribosome bio-
tinylation in specific lineages by regulated expression of the
bacterial ligase could likewise allow recovery of ribosomes
from specific cell types. Innovative strategies for selective ribo-
some purification, combined with a continuing push for higher
quality data from fewer cells, will underlie many emerging appli-
cations of ribosome profiling.
New tools tailored specifically for analyzing profiling data, im-
plementing more sophisticated statistical approaches, should
complement these experimental developments. Computational
advances will particularly impact our understanding of the varia-
tion in ribosome density across single transcripts and its connec-
tion to elongation speed (Artieri and Fraser, 2014; Gardin et al.,
2014; Gritsenko et al., 2015; Lareau et al., 2014; Pop et al.,
2014; Reuveni et al., 2011; Shah et al., 2013). Occupancy pat-
terns are particularly sensitive to statistical fluctuation and tech-
nical biases because they rely on counting small absolute
numbers of reads and do not allow averaging overmany different
positions. However, as in the case of analyzing mRNA-seq data,
better handling of confounding factors can improve expression
estimates and detect changes more reliably (Roberts et al.,
2011). The variety of alternative translation products detected
by ribosome profiling also raises new challenges for genome
annotation (Table 2). Databases and analysis workflows now ac-
count for transcript variants produced by alternative mRNA pro-
cessing. Protein-level variants resulting from alternative transla-
tion on a single transcript now further complicate our catalog of
functional elements in the genome.
REFERENCES
Aebersold, R., and Mann, M. (2003). Mass spectrometry-based proteomics.
Nature 422, 198–207.
Albert, F.W., Muzzey, D., Weissman, J.S., and Kruglyak, L. (2014). Genetic in-
fluences on translation in yeast. PLoS Genet. 10, e1004692.
Anders, S., McCarthy, D.J., Chen, Y., Okoniewski, M., Smyth, G.K., Huber, W.,
and Robinson, M.D. (2013). Count-based differential expression analysis of
RNA sequencing data using R and Bioconductor. Nat. Protoc. 8, 1765–1786.
Andreev, D.E., O’Connor, P.B., Fahey, C., Kenny, E.M., Terenin, I.M., Dmitriev,
S.E., Cormican, P., Morris, D.W., Shatsky, I.N., and Baranov, P.V. (2015).
Translation of 50 leaders is pervasive in genes resistant to eIF2 repression. eLife
4, e03971.
Arava, Y., Wang, Y., Storey, J.D., Liu, C.L., Brown, P.O., and Herschlag, D.
(2003). Genome-wide analysis of mRNA translation profiles in Saccharomyces
cerevisiae. Proc. Natl. Acad. Sci. USA 100, 3889–3894.
Artieri, C.G., and Fraser, H.B. (2014). Accounting for biases in riboprofiling data
indicates a major role for proline in stalling translation. Genome Res. 24, 2011–
2021.
Bazzini, A.A., Johnstone, T.G., Christiano, R., Mackowiak, S.D., Obermayer,
B., Fleming, E.S., Vejnar, C.E., Lee, M.T., Rajewsky, N., Walther, T.C., and Gir-
aldez, A.J. (2014). Identification of small ORFs in vertebrates using ribosome
footprinting and evolutionary conservation. EMBO J. 33, 981–993.
Becker, A.H., Oh, E., Weissman, J.S., Kramer, G., and Bukau, B. (2013). Selec-
tive ribosome profiling as a tool for studying the interaction of chaperones and
targeting factors with nascent polypeptide chains and ribosomes. Nat. Protoc.
8, 2212–2239.
Behrmann, E., Loerke, J., Budkevich, T.V., Yamamoto, K., Schmidt, A., Penc-
zek, P.A., Vos, M.R., Burger, J., Mielke, T., Scheerer, P., and Spahn, C.M.
(2015). Structural snapshots of actively translating human ribosomes. Cell
161, 845–857.
Brar, G.A., and Weissman, J.S. (2015). Ribosome profiling reveals the what,
when, where and how of protein synthesis. Nat. Rev. Mol. Cell Biol. 16,
651–664.
Brown, P.O., and Botstein, D. (1999). Exploring the new world of the genome
with DNA microarrays. Nat. Genet. 21 (1, Suppl), 33–37.
Brubaker, S.W., Gauthier, A.E., Mills, E.W., Ingolia, N.T., and Kagan, J.C.
(2014). A bicistronic MAVS transcript highlights a class of truncated variants
in antiviral immunity. Cell 156, 800–811.
Buffington, S.A., Huang, W., and Costa-Mattioli, M. (2014). Translational con-
trol in synaptic plasticity and cognitive dysfunction. Annu. Rev. Neurosci. 37,
17–38.
Bullard, J.H., Purdom, E., Hansen, K.D., and Dudoit, S. (2010). Evaluation of
statistical methods for normalization and differential expression in mRNA-
Seq experiments. BMC Bioinformatics 11, 94.
Calviello, L., Mukherjee, N., Wyler, E., Zauber, H., Hirsekorn, A., Selbach, M.,
Landthaler, M., Obermayer, B., and Ohler, U. (2016). Detecting actively trans-
lated open reading frames in ribosome profiling data. Nat. Methods 13,
165–170.
Cenik, C., Cenik, E.S., Byeon, G.W., Grubert, F., Candille, S.I., Spacek, D.,
Alsallakh, B., Tilgner, H., Araya, C.L., Tang, H., et al. (2015). Integrative analysis
of RNA, translation, and protein levels reveals distinct regulatory variation
across humans. Genome Res. 25, 1610–1621.
Chew, G.L., Pauli, A., Rinn, J.L., Regev, A., Schier, A.F., and Valen, E. (2013).
Ribosome profiling reveals resemblance between long non-coding RNAs and
50 leaders of coding RNAs. Development 140, 2828–2834.
Crappe, J., Ndah, E., Koch, A., Steyaert, S., Gawron, D., De Keulenaer, S., De
Meester, E., De Meyer, T., Van Criekinge, W., Van Damme, P., and Men-
schaert, G. (2015). PROTEOFORMER: deep proteome coverage through ribo-
some profiling and MS integration. Nucleic Acids Res. 43, e29.
Curtis, D., Lehmann, R., and Zamore, P.D. (1995). Translational regulation in
development. Cell 81, 171–178.
Descombes, P., and Schibler, U. (1991). A liver-enriched transcriptional acti-
vator protein, LAP, and a transcriptional inhibitory protein, LIP, are translated
from the same mRNA. Cell 67, 569–579.
Dunn, J.G., Foo, C.K., Belletier, N.G., Gavis, E.R., and Weissman, J.S. (2013).
Ribosome profiling reveals pervasive and regulated stop codon readthrough in
Drosophila melanogaster. eLife 2, e01179.
Fields, A.P., Rodriguez, E.H., Jovanovic, M., Stern-Ginossar, N., Haas, B.J.,
Mertins, P., Raychowdhury, R., Hacohen, N., Carr, S.A., Ingolia, N.T., et al.
(2015). A Regression-Based Analysis of Ribosome-Profiling Data Reveals a
Conserved Complexity to Mammalian Translation. Mol. Cell 60, 816–827.
Fritsch, C., Herrmann, A., Nothnagel, M., Szafranski, K., Huse, K., Schumann,
F., Schreiber, S., Platzer, M., Krawczak, M., Hampe, J., and Brosch, M. (2012).
Genome-wide search for novel human uORFs and N-terminal protein exten-
sions using ribosomal footprinting. Genome Res. 22, 2208–2218.
Gao, X., Wan, J., Liu, B., Ma, M., Shen, B., and Qian, S.B. (2015). Quantitative
profiling of initiating ribosomes in vivo. Nat. Methods 12, 147–153.
Gardin, J., Yeasmin, R., Yurovsky, A., Cai, Y., Skiena, S., and Futcher, B.
(2014).Measurement of average decoding rates of the 61 sense codons in vivo.
eLife 3, e03735.
Gerashchenko, M.V., and Gladyshev, V.N. (2014). Translation inhibitors cause
abnormalities in ribosome profiling experiments. Nucleic Acids Res. 42, e134.
Gerashchenko, M.V., Lobanov, A.V., and Gladyshev, V.N. (2012). Genome-
wide ribosome profiling reveals complex translational regulation in response
to oxidative stress. Proc. Natl. Acad. Sci. USA 109, 17394–17399.
Gesteland, R.F., and Atkins, J.F. (1996). Recoding: dynamic reprogramming of
translation. Annu. Rev. Biochem. 65, 741–768.
Gritsenko, A.A., Hulsman, M., Reinders, M.J., and de Ridder, D. (2015). Unbi-
ased Quantitative Models of Protein Translation Derived from Ribosome
Profiling Data. PLoS Comput. Biol. 11, e1004336.
Grun, D., and van Oudenaarden, A. (2015). Design and Analysis of Single-Cell
Sequencing Experiments. Cell 163, 799–810.
Guttman, M., Russell, P., Ingolia, N.T., Weissman, J.S., and Lander, E.S.
(2013). Ribosome profiling provides evidence that large noncoding RNAs do
not encode proteins. Cell 154, 240–251.
Guydosh, N.R., and Green, R. (2014). Dom34 rescues ribosomes in 30 untrans-lated regions. Cell 156, 950–962.
Han, Y., David, A., Liu, B., Magadan, J.G., Bennink, J.R., Yewdell, J.W., and
Qian, S.B. (2012). Monitoring cotranslational protein folding in mammalian
cells at codon resolution. Proc. Natl. Acad. Sci. USA 109, 12467–12472.
Hann, S.R., King, M.W., Bentley, D.L., Anderson, C.W., and Eisenman, R.N.
(1988). A non-AUG translational initiation in c-myc exon 1 generates an
N-terminally distinct protein whose synthesis is disrupted in Burkitt’s lym-
phomas. Cell 52, 185–195.
Heiman, M., Schaefer, A., Gong, S., Peterson, J.D., Day, M., Ramsey, K.E.,
Suarez-Farinas, M., Schwarz, C., Stephan, D.A., Surmeier, D.J., et al. (2008).
A translational profiling approach for the molecular characterization of CNS
cell types. Cell 135, 738–748.
Hinnebusch, A.G. (2014). The scanning mechanism of eukaryotic translation
initiation. Annu. Rev. Biochem. 83, 779–812.
Hu, W., Sweet, T.J., Chamnongpol, S., Baker, K.E., and Coller, J. (2009).
Co-translational mRNA decay in Saccharomyces cerevisiae. Nature 461,
225–229.
Hussmann, J.A., Patchett, S., Johnson, A., Sawyer, S., and Press,W.H. (2015).
Understanding Biases in Ribosome Profiling Experiments Reveals Signatures
of Translation Dynamics in Yeast. PLoS Genet. 11, e1005732.
Ingolia, N.T. (2014). Ribosome profiling: new views of translation, from single
codons to genome scale. Nat. Rev. Genet. 15, 205–213.
Ingolia, N.T., Ghaemmaghami, S., Newman, J.R., and Weissman, J.S. (2009).
Genome-wide analysis in vivo of translation with nucleotide resolution using
ribosome profiling. Science 324, 218–223.
Ingolia, N.T., Lareau, L.F., and Weissman, J.S. (2011). Ribosome profiling of
mouse embryonic stem cells reveals the complexity and dynamics of mamma-
lian proteomes. Cell 147, 789–802.
Ingolia, N.T., Brar, G.A., Rouskin, S., McGeachy, A.M., and Weissman, J.S.
(2012). The ribosome profiling strategy for monitoring translation in vivo by
deep sequencing of ribosome-protected mRNA fragments. Nat. Protoc. 7,
1534–1550.
Ingolia, N.T., Brar, G.A., Stern-Ginossar, N., Harris, M.S., Talhouarne, G.J.,
Jackson, S.E., Wills, M.R., and Weissman, J.S. (2014). Ribosome profiling re-
veals pervasive translation outside of annotated protein-coding genes. Cell
Rep. 8, 1365–1379.
Jan, C.H., Williams, C.C., andWeissman, J.S. (2014). Principles of ER cotrans-
lational translocation revealed by proximity-specific ribosome profiling. Sci-
ence 346, 1257521.
Ji, Z., Song, R., Regev, A., and Struhl, K. (2015). Many lncRNAs, 50UTRs, andpseudogenes are translated and some are likely to express functional proteins.
Elife 4, e08890.
Kronja, I., Yuan, B., Eichhorn, S.W., Dzeyk, K., Krijgsveld, J., Bartel, D.P., and
Orr-Weaver, T.L. (2014). Widespread changes in the posttranscriptional land-
scape at the Drosophila oocyte-to-embryo transition. Cell Rep. 7, 1495–1508.
Lareau, L.F., Hite, D.H., Hogan, G.J., andBrown, P.O. (2014). Distinct stages of
the translation elongation cycle revealed by sequencing ribosome-protected
mRNA fragments. eLife 3, e01257.
Larsson, O., Sonenberg, N., and Nadon, R. (2011). anota: Analysis of differen-
tial translation in genome-wide studies. Bioinformatics 27, 1440–1441.
Lee, S., Liu, B., Lee, S., Huang, S.X., Shen, B., and Qian, S.B. (2012). Global
mapping of translation initiation sites in mammalian cells at single-nucleotide
resolution. Proc. Natl. Acad. Sci. USA 109, E2424–E2432.
Cell 165, March 24, 2016 ª2016 Elsevier Inc. 31

Levin, J.Z., Yassour, M., Adiconis, X., Nusbaum, C., Thompson, D.A., Fried-
man, N., Gnirke, A., and Regev, A. (2010). Comprehensive comparative anal-
ysis of strand-specific RNA sequencing methods. Nat. Methods 7, 709–715.
Li, G.W., Burkhardt, D., Gross, C., and Weissman, J.S. (2014). Quantifying ab-
solute protein synthesis rates reveals principles underlying allocation of
cellular resources. Cell 157, 624–635.
Liu, B., Han, Y., and Qian, S.B. (2013). Cotranslational response to proteotoxic
stress by elongation pausing of ribosomes. Mol. Cell 49, 453–463.
Loayza-Puch, F., Rooijers, K., Buil, L.C., Zijlstra, J., Oude Vrielink, J.F., Lopes,
R., Ugalde, A.P., van Breugel, P., Hofland, I., Wesseling, J., et al. (2016).
Tumour-specific proline vulnerability uncovered by differential ribosome
codon reading. Nature 530, 490–494.
Love, M.I., Anders, S., Kim, V., and Huber, W. (2015). RNA-Seq workflow:
gene-level exploratory analysis and differential expression. F1000Res. 4,
1070.
Loven, J., Orlando, D.A., Sigova, A.A., Lin, C.Y., Rahl, P.B., Burge, C.B., Lev-
ens, D.L., Lee, T.I., and Young, R.A. (2012). Revisiting global gene expression
analysis. Cell 151, 476–482.
McCarthy, D.J., Chen, Y., and Smyth, G.K. (2012). Differential expression anal-
ysis of multifactor RNA-Seq experiments with respect to biological variation.
Nucleic Acids Res. 40, 4288–4297.
Michel, A.M., Fox, G., M Kiran, A., De Bo, C., O’Connor, P.B., Heaphy, S.M.,
Mullan, J.P., Donohue, C.A., Higgins, D.G., and Baranov, P.V. (2014).
GWIPS-viz: development of a ribo-seq genome browser. Nucleic Acids Res.
42, D859–D864.
Michel, A.M., Choudhury, K.R., Firth, A.E., Ingolia, N.T., Atkins, J.F., and Bar-
anov, P.V. (2012). Observation of dually decoded regions of the human
genome using ribosome profiling data. Genome Res. 22, 2219–2229.
Nedialkova, D.D., and Leidel, S.A. (2015). Optimization of Codon Translation
Rates via tRNA Modifications Maintains Proteome Integrity. Cell 161, 1606–
1618.
Oh, E., Becker, A.H., Sandikci, A., Huber, D., Chaba, R., Gloge, F., Nichols,
R.J., Typas, A., Gross, C.A., Kramer, G., et al. (2011). Selective ribosome
profiling reveals the cotranslational chaperone action of trigger factor in vivo.
Cell 147, 1295–1308.
Olexiouk, V., Crappe, J., Verbruggen, S., Verhegen, K., Martens, L., and Men-
schaert, G. (2016). sORFs.org: a repository of small ORFs identified by ribo-
some profiling. Nucleic Acids Res. 44 (D1), D324–D329.
Ori, A., Toyama, B.H., Harris, M.S., Bock, T., Iskar, M., Bork, P., Ingolia, N.T.,
Hetzer, M.W., and Beck, M. (2015). Integrated transcriptome and proteome
analyses reveal organ-specific proteome deterioration in old rats. Cell Syst.
1, 224–237.
Pauli, A., Norris, M.L., Valen, E., Chew, G.L., Gagnon, J.A., Zimmerman, S.,
Mitchell, A., Ma, J., Dubrulle, J., Reyon, D., et al. (2014). Toddler: an embryonic
signal that promotes cell movement via Apelin receptors. Science 343,
1248636.
Pelechano, V., Wei, W., and Steinmetz, L.M. (2015). Widespread co-transla-
tional RNA decay reveals ribosome dynamics. Cell 161, 1400–1412.
Pfeffer, S., Lagos-Quintana, M., and Tuschl, T. (2005). Cloning of small RNA
molecules. Curr. Protoc. Mol. Biol. Chapter 26, Unit 26.24.
Plotkin, J.B., and Kudla, G. (2011). Synonymous but not the same: the causes
and consequences of codon bias. Nat. Rev. Genet. 12, 32–42.
Pop, C., Rouskin, S., Ingolia, N.T., Han, L., Phizicky, E.M.,Weissman, J.S., and
Koller, D. (2014). Causal signals between codon bias, mRNA structure, and the
efficiency of translation and elongation. Mol. Syst. Biol. 10, 770.
Pulido, R., Baker, S.J., Barata, J.T., Carracedo, A., Cid, V.J., Chin-Sang, I.D.,
Dave, V., den Hertog, J., Devreotes, P., Eickholt, B.J., et al. (2014). A unified
nomenclature and amino acid numbering for human PTEN. Sci. Signal. 7,
pe15.
Reid, D.W., and Nicchitta, C.V. (2012). Primary role for endoplasmic reticulum-
bound ribosomes in cellular translation identified by ribosome profiling. J. Biol.
Chem. 287, 5518–5527.
32 Cell 165, March 24, 2016 ª2016 Elsevier Inc.
Reid, D.W., Chen, Q., Tay, A.S., Shenolikar, S., and Nicchitta, C.V. (2014). The
unfolded protein response triggers selective mRNA release from the endo-
plasmic reticulum. Cell 158, 1362–1374.
Reuter, J.A., Spacek, D.V., and Snyder, M.P. (2015). High-throughput
sequencing technologies. Mol. Cell 58, 586–597.
Reuveni, S., Meilijson, I., Kupiec,M., Ruppin, E., and Tuller, T. (2011). Genome-
scale analysis of translation elongation with a ribosome flow model. PLoS
Comput. Biol. 7, e1002127.
Roberts, A., Trapnell, C., Donaghey, J., Rinn, J.L., and Pachter, L. (2011).
Improving RNA-Seq expression estimates by correcting for fragment bias.
Genome Biol. 12, R22.
Saghatelian, A., and Couso, J.P. (2015). Discovery and characterization of
smORF-encoded bioactive polypeptides. Nat. Chem. Biol. 11, 909–916.
Sanz, E., Yang, L., Su, T., Morris, D.R., McKnight, G.S., and Amieux, P.S.
(2009). Cell-type-specific isolation of ribosome-associated mRNA from com-
plex tissues. Proc. Natl. Acad. Sci. USA 106, 13939–13944.
Schneider-Poetsch, T., Ju, J., Eyler, D.E., Dang, Y., Bhat, S., Merrick, W.C.,
Green, R., Shen, B., and Liu, J.O. (2010). Inhibition of eukaryotic transla-
tion elongation by cycloheximide and lactimidomycin. Nat. Chem. Biol. 6,
209–217.
Shah, P., Ding, Y., Niemczyk, M., Kudla, G., and Plotkin, J.B. (2013). Rate-
limiting steps in yeast protein translation. Cell 153, 1589–1601.
Shalgi, R., Hurt, J.A., Krykbaeva, I., Taipale, M., Lindquist, S., and Burge, C.B.
(2013). Widespread regulation of translation by elongation pausing in heat
shock. Mol. Cell 49, 439–452.
Sidrauski, C., McGeachy, A.M., Ingolia, N.T., and Walter, P. (2015). The small
molecule ISRIB reverses the effects of eIF2a phosphorylation on translation
and stress granule assembly. eLife 4, e05033.
Slavoff, S.A., Mitchell, A.J., Schwaid, A.G., Cabili, M.N., Ma, J., Levin, J.Z.,
Karger, A.D., Budnik, B.A., Rinn, J.L., and Saghatelian, A. (2013). Peptidomic
discovery of short open reading frame-encoded peptides in human cells. Nat.
Chem. Biol. 9, 59–64.
Sonenberg, N., and Hinnebusch, A.G. (2009). Regulation of translation initia-
tion in eukaryotes: mechanisms and biological targets. Cell 136, 731–745.
Spriggs, K.A., Bushell, M., and Willis, A.E. (2010). Translational regulation of
gene expression during conditions of cell stress. Mol. Cell 40, 228–237.
Starck, S.R., Tsai, J.C., Chen, K., Shodiya, M., Wang, L., Yahiro, K., Martins-
Green, M., Shastri, N., and Walter, P. (2016). Translation from the 50 untrans-lated region shapes the integrated stress response. Science 351, aad3867.
Steitz, J.A. (1969). Polypeptide chain initiation: nucleotide sequences of
the three ribosomal binding sites in bacteriophage R17 RNA. Nature 224,
957–964.
Stern-Ginossar, N., Weisburd, B., Michalski, A., Le, V.T., Hein, M.Y., Huang,
S.X., Ma, M., Shen, B., Qian, S.B., Hengel, H., et al. (2012). Decoding human
cytomegalovirus. Science 338, 1088–1093.
Tsuboi, T., Kuroha, K., Kudo, K., Makino, S., Inoue, E., Kashima, I., and Inada,
T. (2012). Dom34:hbs1 plays a general role in quality-control systems by
dissociation of a stalled ribosome at the 30 end of aberrant mRNA. Mol. Cell
46, 518–529.
Vogel, C., and Marcotte, E.M. (2012). Insights into the regulation of protein
abundance from proteomic and transcriptomic analyses. Nat. Rev. Genet.
13, 227–232.
Wan, J., and Qian, S.B. (2014). TISdb: a database for alternative translation
initiation in mammalian cells. Nucleic Acids Res. 42, D845–D850.
Wang, Z., Gerstein, M., and Snyder, M. (2009). RNA-Seq: a revolutionary tool
for transcriptomics. Nat. Rev. Genet. 10, 57–63.
Weinberg, D.E.S., Shah, P., Eichhorn, S.W., Hussmann, J.A., Plotkin, J.B., and
Bartel, D.P. (2016). Improved Ribosome-Footprint and mRNA Measurements
Provide Insights into Dynamics and Regulation of Yeast Translation. Cell Rep.
14, 1787–1799.

Williams, C.C., Jan, C.H., and Weissman, J.S. (2014). Targeting and plasticity
of mitochondrial proteins revealed by proximity-specific ribosome profiling.
Science 346, 748–751.
Wolin, S.L., and Walter, P. (1988). Ribosome pausing and stacking during
translation of a eukaryotic mRNA. EMBO J. 7, 3559–3569.
Woolstenhulme, C.J., Guydosh, N.R., Green, R., and Buskirk, A.R. (2015).
High-precision analysis of translational pausing by ribosome profiling in bacte-
ria lacking EFP. Cell Rep. 11, 13–21.
Xie, S.Q., Nie, P., Wang, Y., Wang, H., Li, H., Yang, Z., Liu, Y., Ren, J., and
Xie, Z. (2016). RPFdb: a database for genome wide information of translated
mRNA generated from ribosome profiling. Nucleic Acids Res. 44 (D1), D254–
D258.
Young, D.J., Guydosh, N.R., Zhang, F., Hinnebusch, A.G., and Green, R.
(2015). Rli1/ABCE1 recycles terminating ribosomes and controls translation
reinitiation in 3’UTRs in vivo. Cell 162, 872–884.
Zhou, P., Zhang, Y., Ma, Q., Gu, F., Day, D.S., He, A., Zhou, B., Li, J., Stevens,
S.M., Romo, D., and Pu, W.T. (2013). Interrogating translational efficiency and
lineage-specific transcriptomes using ribosome affinity purification. Proc. Natl.
Acad. Sci. USA 110, 15395–15400.
Zinshteyn, B., and Gilbert, W.V. (2013). Loss of a conserved tRNA anticodon
modification perturbs cellular signaling. PLoS Genet. 9, e1003675.
Zupanic, A., Meplan, C., Grellscheid, S.N., Mathers, J.C., Kirkwood, T.B., He-
sketh, J.E., and Shanley, D.P. (2014). Detecting translational regulation by
change point analysis of ribosome profiling data sets. RNA 20, 1507–1518.
Cell 165, March 24, 2016 ª2016 Elsevier Inc. 33


![Ribosome Stoichiometry: From Form to Function · Ribosome abundance: A major model, also termed the ribosome concentration hypothesis [3], that explains how ribosomes could exert](https://img.pdfslide.us/doc/110x75/60de31e56d30fc4fb30719b8/ribosome-stoichiometry-from-form-to-function-ribosome-abundance-a-major-model.jpg)