Embed Size (px)
Citation preview

Article
Jiangning Wan
0022-2836/© 2015 Elsevi
Ribosomal Initiation Complex-DrivenChanges in the Stability and Dynamics ofInitiation Factor 2 Regulate the Fidelity ofTranslation Initiation
g, Kelvin Caban and Rube
n L. Gonzalez Jr.Department of Chemistry, Columbia University, 3000 Broadway, MC3126, New York, NY 10027, USA
Correspondence to Ruben L. Gonzalez: [email protected]://dx.doi.org/10.1016/j.jmb.2014.12.025Edited by S. A. Woodson
Abstract
Joining of the large, 50S, ribosomal subunit to the small, 30S, ribosomal subunit initiation complex (IC) duringbacterial translation initiation is catalyzed by the initiation factor (IF) IF2. Because the rate of subunit joining iscoupled to the IF, transfer RNA (tRNA), and mRNA codon compositions of the 30S IC, the subunit joiningreaction functions as a kinetic checkpoint that regulates the fidelity of translation initiation. Recent structuralstudies suggest that the conformational dynamics of the IF2·tRNA sub-complex forming on the intersubunitsurface of the 30S IC may play a significant role in the mechanisms that couple the rate of subunit joining tothe IF, tRNA, and codon compositions of the 30S IC. To test this hypothesis, we have developed asingle-molecule fluorescence resonance energy transfer signal between IF2 and tRNA that has enabled us tomonitor the conformational dynamics of the IF2·tRNA sub-complex across a series of 30S ICs. Our resultsdemonstrate that 30S ICs undergoing rapid subunit joining display a high affinity for IF2 and an IF2·tRNAsub-complex that primarily samples a single conformation. In contrast, 30S ICs that undergo slower subunitjoining exhibit a decreased affinity for IF2 and/or a change in the conformational dynamics of the IF2·tRNAsub-complex. These results strongly suggest that 30S IC-driven changes in the stability of IF2 and theconformational dynamics of the IF2·tRNA sub-complex regulate the efficiency and fidelity of subunit joiningduring translation initiation.
© 2015 Elsevier Ltd. All rights reserved.
Introduction
In bacteria, translation initiation proceeds through amulti-step pathway that can be divided into two majorstages (Fig. 1a) [1–4]. In the first stage, three essentialinitiation factors (IFs; IF1, IF2, and IF3), a specializedinitiator transfer RNA (tRNA) (N-formylmethionyl-transfer RNA; fMet-tRNAfMet), and a small, or 30S,ribosomal subunit assemble into a 30S initiationcomplex (IC) at the start codon (usually AUG) of anmRNA. In the second stage, a large, or 50S, ribosomalsubunit joins to the 30S IC to form an elongation-competent 70S IC. The fidelity of fMet-tRNAfMet andthe start codon selection during this process areessential for ensuring the integrity of gene expression,asmis-initiation using anelongator tRNAor an internalsense codon leads to proteins containing aberrantN-termini or to frame-shifting errors that yield truncat-ed, and possibly mis-folded, proteins [1,5–8]. Exten-sive genetic, biochemical, and structural studies of
er Ltd. All rights reserved.
translation initiation suggest that the IFs play crucialand highly complementary roles in regulating thefidelity and the efficiency of translation initiation.During initiation, IF2 functions synergistically
with IF1 and IF3 to selectively accelerate therate of fMet-tRNAfMet binding into the start-codon-programmed peptidyl-tRNA binding (P) site of the 30Ssubunit [9]. Subsequently, in a reaction that isregulated by all three IFs, IF2 accelerates the rate ofsubunit joining to “canonical” 30S ICs carrying anfMet-tRNAfMet that is base paired to a cognate startcodon within the P-site [10,11]. Highlighting theselectivity with which the IFs regulate the subunitjoining reaction, “pseudo” 30S ICs carrying either anon-formylated initiator tRNA (Met-tRNAfMet) oran elongator tRNA (e.g., Phe-tRNAPhe) [10,12] and“non-canonical” 30S ICs formed at a near-cognatestart codon (e.g., an AUU codon) [13,14] exhibit amarkedly reduced rate of subunit joining relative tocanonical 30S ICs. Despite its importance for
J Mol Biol (2015) 427, 1819–1834
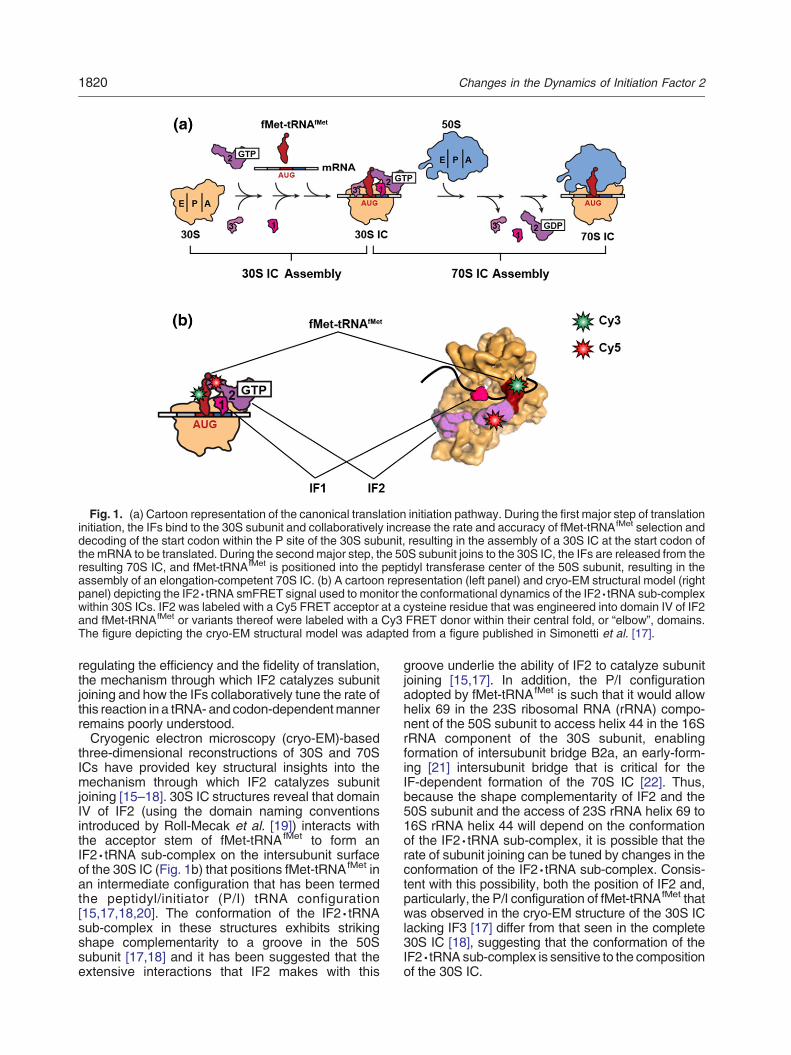
Fig. 1. (a) Cartoon representation of the canonical translation initiation pathway. During the first major step of translationinitiation, the IFs bind to the 30S subunit and collaboratively increase the rate and accuracy of fMet-tRNAfMet selection anddecoding of the start codon within the P site of the 30S subunit, resulting in the assembly of a 30S IC at the start codon ofthe mRNA to be translated. During the secondmajor step, the 50S subunit joins to the 30S IC, the IFs are released from theresulting 70S IC, and fMet-tRNAfMet is positioned into the peptidyl transferase center of the 50S subunit, resulting in theassembly of an elongation-competent 70S IC. (b) A cartoon representation (left panel) and cryo-EM structural model (rightpanel) depicting the IF2·tRNA smFRET signal used to monitor the conformational dynamics of the IF2·tRNA sub-complexwithin 30S ICs. IF2 was labeled with a Cy5 FRET acceptor at a cysteine residue that was engineered into domain IV of IF2and fMet-tRNAfMet or variants thereof were labeled with a Cy3 FRET donor within their central fold, or “elbow”, domains.The figure depicting the cryo-EM structural model was adapted from a figure published in Simonetti et al. [17].
1820 Changes in the Dynamics of Initiation Factor 2
regulating the efficiency and the fidelity of translation,the mechanism through which IF2 catalyzes subunitjoining and how the IFs collaboratively tune the rate ofthis reaction in a tRNA- and codon-dependentmannerremains poorly understood.Cryogenic electron microscopy (cryo-EM)-based
three-dimensional reconstructions of 30S and 70SICs have provided key structural insights into themechanism through which IF2 catalyzes subunitjoining [15–18]. 30S IC structures reveal that domainIV of IF2 (using the domain naming conventionsintroduced by Roll-Mecak et al. [19]) interacts withthe acceptor stem of fMet-tRNAfMet to form anIF2·tRNA sub-complex on the intersubunit surfaceof the 30S IC (Fig. 1b) that positions fMet-tRNAfMet inan intermediate configuration that has been termedthe peptidyl/initiator (P/I) tRNA configuration[15,17,18,20]. The conformation of the IF2·tRNAsub-complex in these structures exhibits strikingshape complementarity to a groove in the 50Ssubunit [17,18] and it has been suggested that theextensive interactions that IF2 makes with this
groove underlie the ability of IF2 to catalyze subunitjoining [15,17]. In addition, the P/I configurationadopted by fMet-tRNAfMet is such that it would allowhelix 69 in the 23S ribosomal RNA (rRNA) compo-nent of the 50S subunit to access helix 44 in the 16SrRNA component of the 30S subunit, enablingformation of intersubunit bridge B2a, an early-form-ing [21] intersubunit bridge that is critical for theIF-dependent formation of the 70S IC [22]. Thus,because the shape complementarity of IF2 and the50S subunit and the access of 23S rRNA helix 69 to16S rRNA helix 44 will depend on the conformationof the IF2·tRNA sub-complex, it is possible that therate of subunit joining can be tuned by changes in theconformation of the IF2·tRNA sub-complex. Consis-tent with this possibility, both the position of IF2 and,particularly, the P/I configuration of fMet-tRNAfMet thatwas observed in the cryo-EM structure of the 30S IClacking IF3 [17] differ from that seen in the complete30S IC [18], suggesting that the conformation of theIF2·tRNAsub-complex is sensitive to the compositionof the 30S IC.
1821Changes in the Dynamics of Initiation Factor 2
Based on the foregoing structural analysis, wehypothesized that IF-, tRNA-, and codon-dependentchanges in the conformational dynamics of theIF2·tRNA sub-complex might provide the mecha-nistic basis for coupling the rate of subunit joining tothe IF, tRNA, and codon compositions of the 30S IC.To investigate this hypothesis, we have developedan intermolecular IF2·tRNA single-molecule fluo-rescence resonance energy transfer (smFRET)signal and have used it to characterize the confor-mational dynamics of the IF2·tRNA sub-complexwithin a series of canonical, pseudo, andnon-canonical30S ICs that exhibit different rates of subunit joining.Our results show that canonical 30S ICs lacking IF3,which have been shown to undergo relatively rapidsubunit joining in ensemble kinetic studies, bind IF2with a relatively high affinity and yield an IF2·tRNAsub-complex that primarily samples a single conforma-tion. On the other hand, 30S ICs that have beenshown to undergo slower subunit joining in ensem-ble kinetic studies, including canonical 30S ICs thatcontain IF3, pseudo 30S ICs carrying a non-formylatedMet-tRNAfMet or Phe-tRNAPhe, and non-canonical30S ICs assembled on an AUU near-cognate startcodon, exhibit a decreased affinity for IF2 and/or achange in the conformational dynamics of theIF2·tRNA sub-complex. Interpreted within the contextof previous structural and biochemical studies, thesmFRET results presented here strongly suggest thatIF-, tRNA-, and codon-dependent changes in thestructure of the 30S IC regulate the efficiency andfidelity of the subunit joining reaction bymodulating thestability of IF2 and the conformational dynamics of theIF2·tRNA sub-complex.
Results
Development of an intermolecular IF2·tRNAsmFRET signal
Bacterial IF2 is composed of a non-conservedN-terminal region of variable length and a coreC-terminal region composed of four conserveddomains of which domain IV directly contacts thefMet-tRNAfMet acceptor stem and formyl moiety[15,17,18]. In order to characterize the real-timedynamics of the interaction between domain IV of IF2and various P-site-bound tRNAs within 30S ICs, wedeveloped an IF2·tRNA smFRET signal between acyanine 5 (Cy5) fluorescence resonance energytransfer (FRET) acceptor-labeled IF2 variant[IF2(Cy5)] and various cyanine 3 (Cy3) FRET donor-labeled tRNA variants, including fMet-tRNA(Cy3)fMet,non-formylated Met-tRNA(Cy3)fMet, and elongatorPhe-tRNA(Cy3)Phe (Fig. 1b). IF2(Cy5)was constructedusing a mutant IF2 variant that was Cy5-labeled at asurface-exposed cysteine residue that was engineered
into domain IV (Supplementary Fig. 1). Using astandard IF2 activity assay based on primer extensioninhibition, or “toeprinting” [23], we have demonstratedthat IF2(Cy5) can select fMet-tRNAfMet over elongatortRNAs within the 30S IC in a manner that isindistinguishable from wild-type IF2 (SupplementaryFig. 2). tRNA(Cy3) fMet and tRNA(Cy3)Phe wereconstructed using wild-type tRNAfMet and tRNAPhe
that were Cy3-labeled at naturally occurring, chemi-cally unique, post-transcriptionally modified baseswithin their central fold, or “elbow”, domains in amanner that has been previously shown to not impairtheir functions in translation [24].Using our highly purified, reconstituted in vitro
translation system [25], we assembled 30S ICscontaining IF2(Cy5) and variants of tRNA(Cy3)fMet
or tRNA(Cy3)Phe on 5′-biotinylated mRNAs contain-ing either an AUG or an AUU start codon that isfollowed by a UUU triplet encoding Phe. Aspreviously described [26], 30S ICs were thentethered to the polyethylene glycol (PEG)/biotinyla-ted-PEG-derivatized surface of a quartz microfluidicflowcell using a biotin-streptavidin-biotin bridge andimaged at single-molecule resolution at a timeresolution of 100 ms per frame using a total internalreflection fluorescence (TIRF) microscope. Controlexperiments demonstrated that N98% of the singletRNA(Cy3) molecules imaged in our experimentswere bound to 30S ICs that were specificallytethered to the PEG/biotinylated-PEG-derivatizedsurface of the flowcell via biotin-streptavidin-biotinbridges to their 5′-biotinylated mRNAs (Supplemen-tary Fig. 3). As an additional control, we used anovel, TIRF-based assay to measure the affinity offMet-tRNA(Cy3)fMet and Phe-tRNA(Cy3)Phe bindingto a series of canonical, pseudo, and non-canonical30S ICs containing different combinations of the IFs.These experiments showed that the IF compositionof the 30S IC and the identity of the codon in the Psite modulate the stabilities of fMet-tRNA(Cy3)fMet
and Phe-tRNA(Cy3)Phe binding to surface-tethered30S ICs in a manner that is consistent with previousbiochemical studies [10,27], thus validating thebiochemical activities of our purified IFs and theability of our surface-tethered 30S IC- and TIRF-based experimental system to report on biochemicalevents during translation initiation (SupplementaryFig. 4).
30S IC−1/3 exhibits transient binding of IF2 and anIF2·tRNA sub-complex that is conformationallydynamic
We began our investigation by collecting FRETefficiency (EFRET) versus time trajectories on acanonical 30S IC prepared using fMet-tRNA(Cy3)fMet,IF2(Cy5), and an mRNA containing an AUG startcodon but lacking IF1 and IF3 (30S IC−1/3). Ensemblekinetic studies have shown that the rate of subunit

1822 Changes in the Dynamics of Initiation Factor 2
joining to 30S IC−1/3 is extremely fast relative to therate of subunit joining to canonical 30S ICs thatcontain IF3 [9]. Initial attempts to collect 30S IC−1/3EFRET trajectories using an imaging buffer lacking freeIF2(Cy5) suggested that IF2 readily dissociates from30S IC−1/3 during surface tethering and TIRF imaging.Thus, unless otherwise specified, we supplementedthe imaging buffer used in all IF2·tRNA smFRET
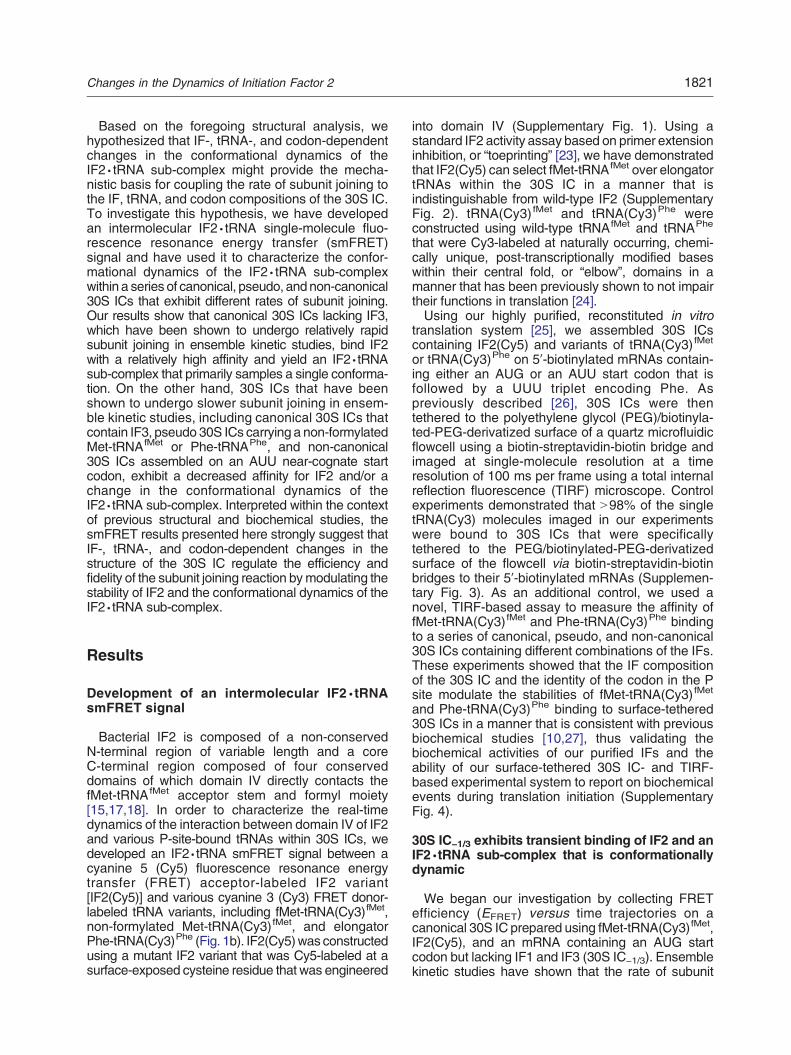
Fig. 2. The effect of IF1 and IF3 on the stability of IF2 and thCartoon representations of each of the 30S ICs investigated astate of the 30S IC is depicted. Representative Cy3 (green) andshown in the second row, and the corresponding EFRET versusresults in an increase in Cy5 intensity and an anti-correlatedIF2-bound state of the 30S IC corresponds to the nonPost-synchronized surface contour plots of the time evolutioncontour plots were generated as described in Results and inEFRET versus time trajectories for each 30S IC and “n” indicasurface contours were plotted from tan (lowest population plotpopulation color bar. TDPs are shown in the fifth row. TDPs w“Ending EFRET” for each transition identified in the idealiztwo-dimensional EFRET histogram as described in Supplementawere used to generate each TDP. Surface contours are plopopulation plotted) as indicated in the population color bar. (a
experiments with 50 nM IF2(Cy5) such that freeIF2(Cy5) from the imaging buffer could rebind to 30SICs from which IF2(Cy5) may have dissociated.Steady-state 30S IC−1/3 EFRET trajectories collectedin the presence of free IF2(Cy5) in the imaging bufferexhibited reversible fluctuations between variousFRET states that, according to an EFRET histogramof the raw EFRET trajectories and a subsequent
e conformational dynamics of the IF2·tRNA sub-complex.re shown along the top row. In each case, the IF2-boundCy5 (red) emission intensities versus time trajectories aretime trajectories are shown in the third row. Binding of IF2decrease in Cy3 intensity due to FRET. Accordingly, the-zero portions of the EFRET versus time trajectories.of population FRET are shown in the fourth row. SurfaceSupplementary Fig. 5d. “N” indicates the total number oftes the total number of individual IF2 binding events. Theted) to red (highest population plotted) as indicated in theere generated by plotting the “Starting EFRET” versus theed EFRET trajectories as a surface contour plot of ary Fig. 5e. “n” indicates the total number of transitions thattted from tan (lowest population plotted) to red (highest) 30S IC−1/3, (b) 30S IC−3, (c) 30S IC−1, and (d) 30S ICC.

Table 1. The association rate constant (ka,app), dissociationrate constant (kd,app), and dissociation equilibrium constant(Kd,app) for the interaction of IF2with each of various 30S ICscarrying different combinations of IFs, tRNAs, and startcodons
Complex ka,app (μM−1 s−1)a kd,app (s−1)a Kd,app (nM)
30S IC−1/3 13 ± 1b 0.6 ± 0.2 50 ± 2030S IC−3 10 ± 2b 0.20 ± 0.01 20 ± 430S IC−1 3.32 ± 0.03 2.1 ± 0.3 600 ± 10030S ICC 8.9 ± 0.7c 0.013 ±
0.002d1.6 ± 0.3
30S ICC,Met N.D.e N.D. N.D.30S ICC,Phe N.D. N.D. N.D.30S IC−1/3,Met 0.019 ± 0.002f 1.3 ± 0.3 70,000 ±
20,00030S IC−3,Met 0.29 ± 0.02f 1.5 ± 0.1 5000 ± 50030S IC−3,Phe 0.18 ± 0.01f 1.3 ± 0.2 7000 ± 100030S IC−1/3,AUU 8.7 ± 0.8 0.59 ± 0.04 68 ± 830S IC−3,AUU 5.5 ± 0.2 0.35 ± 0.02 63 ± 430S IC−1,AUU 4.27 ± 0.04 2.0 ± 0.3 470 ± 7030S ICC,AUU 4.2 ± 0.1 0.65 ± 0.06 160 ± 20
a ka,app and kd,app were determined using curve-fitting-basedpopulation decay analyses as described in Materials and Methodsand in Supplementary Notes 3 and 4.
b ka,app was determined from an experiment in which the rate ofIF2 association was measured as a function of free IF2concentration as described in Results and Supplementary Fig. 6.
c ka,app was determined from a pre-steady-state smFRETexperiment as described in Materials and Methods andSupplementary Notes 3 and 4.
d kd,app was determined from an experiment performed withshuttering of the laser excitation source as described in Materialsand Methods and in Supplementary Notes 3 and 4.
e N.D. stands for “not detected”.f ka,app was obtained using a transition probability matrix-based
population decay analysis as described in Materials and Methodsand in Supplementary Notes 3 and 4.
1823Changes in the Dynamics of Initiation Factor 2
idealization of the raw EFRET trajectories using hiddenMarkov modeling, encompassed a zero FRET stateand at least two non-zero FRET states with EFRETdistributions centered at EFRET values of 0.5 ± 0.2and 0.8 ± 0.1 (hereafter referred to as IF2-tRNA0.5,cand IF2-tRNA0.8,c where the subscript c denotes thatthese states are associated with canonical 30S ICs)(Fig. 2a and Supplementary Fig. 5).Curve-fitting-based population decay analyses
(Supplementary Fig. 5f) of the idealized 30S IC−1/3EFRET trajectories obtained as a function of IF2(Cy5)concentration revealed that the rate of transitionsbetween the zero FRET state and the aggregatenon-zero FRET state (i.e., the rate of zero → non-zero FRET transitions) increased as a function ofincreasing IF2(Cy5) concentration, suggesting thatzero → non-zero FRET transitions represent a bi-molecular association process. In contrast, the rateof non-zero → zero FRET transitions remainedconstant as the IF2(Cy5) concentration was in-creased, suggesting that non-zero → zero FRETtransitions represent a unimolecular dissociationprocess (Supplementary Fig. 6). Thus, we concludethat the zero FRET state corresponds to the IF2-freestate of the 30S IC, the aggregate non-zero FRETstate corresponds to the IF2-bound state of the 30SIC, and the rates of zero → non-zero and non-zero →zero FRET transitions therefore report on thekinetics of IF2 binding to fMet-tRNAfMet-containing30S IC−1/3. Given this interpretation, the apparentrate of IF2 association to 30S IC−1/3 (ka,app) is 13 ±1 μM−1 s−1, the rate of IF2 dissociation from 30SIC−1/3 (kd,app) is 0.6 ± 0.2 s−1, and the equilibriumdissociation constant for IF2 binding to 30S IC−1/3(Kd,app) is 50 ± 20 nM (Table 1), values that are inexcellent agreement with the results of a comple-mentary, transition probability matrix-based popula-tion decay analysis of the 30S IC−1/3 EFRETtrajectories (Supplementary Table 1).The stability of the IF2-bound state (i.e., the
aggregate non-zero FRET state) for the ensembleof single 30S ICs observed can be visualized as apost-synchronized surface contour plot of the timeevolution of population FRET [24]. These surfacecontour plots were generated by thresholding eachraw EFRET trajectory using an EFRET of 0.2 to identifyindividual IF2 binding and dissociation events (seeSupplementary Fig. 5d), post-synchronizing eachbinding event such that the first time point thatcrosses the EFRET of 0.2 threshold is reassigned tothe 1-s time point on the plot, and then generating asurface contour plot that effectively superimposes allof the post-synchronized binding events at the 1-stime point. In such plots, the stability of theIF2-bound state can be easily visualized by asses-sing the length of time that, starting from the 1-s timepoint, the IF2·tRNA sub-complex persists in theaggregate non-zero FRET states prior to transition-ing to the zero FRET state. Similarly, reversible
fluctuations between zero and non-zero FRET states(i.e., the reversibility of binding) or between twonon-zero FRET states (i.e., fluctuations betweendifferent conformational states) can be visualized asa transition density plot (TDP) in which the startingEFRET value (x-axis) and the final EFRET value(y-axis) for each transition identified in the idealizedEFRET trajectories are plotted as a surface contourplot [28] (see Supplementary Fig. 5e).The observation of reversible fluctuations between
IF2-tRNA0.5,c and IF2-tRNA0.8,c, defining a dynamicIF2-tRNA0.8,c ⇄ IF2-tRNA0.5,c conformational equilib-rium, demonstrates that the IF2·tRNA sub-complexwithin 30S IC−1/3 exists in a dynamic equilibriumbetween at least two conformational states in whichthe distance between our labeling positions differ by~10 Å (assuming a Förster radius of 55 Å for theCy3-Cy5 FRET donor–acceptor pair [29,30]). Theobservation that the IF2·tRNA sub-complex within a30S IC can occupy at least two conformational statesis consistent with, and likely reveals the physical basisfor, the biphasic behavior that is typically observedin ensemble kinetic studies of IF2 binding to 30S ICs

1824 Changes in the Dynamics of Initiation Factor 2
[11,13,31,32]. Within 30S IC−1/3, the IF2·tRNA sub--complex almost exclusively occupies IF2-tRNA0.8,c,only rarely and transiently occupying IF2-tRNA0.5,c(Fig. 2a and Supplementary Table 2).
Addition of IF1 and IF3 to 30S IC−1/3 modulatesthe affinity of IF2 and alters the conformationaldynamics of the IF2·tRNA sub-complex
In ensemble kinetic studies of subunit joining, thepresence of IF1 on the 30S IC has been shown tomarginally increase the rate of IF2-catalyzed sub-unit joining whereas IF3, when present alone oralong with IF1, has been shown to decrease it [9]. Todetermine the effect that IF1 and/or IF3 exert on theconformational dynamics of the IF2·tRNA sub-complex, we collected EFRET trajectories usingcanonical 30S ICs that were prepared in a manneranalogous to 30S IC−1/3 but in the presence of IF1(30S IC−3), IF3 (30S IC−1), or IF1 and IF3 (30S ICC)(Fig. 2b–d and Table 1). To ensure that surface-teth-ered 30S ICs were imaged in the presence of boundIF1 and/or IF3, we supplemented the imaging bufferwith saturating concentrations (~1 μM) of each ofthese factors. Interestingly, when present indepen-dently of each other, we discovered that IF1 and IF3have opposing effects on the affinity of IF2 for the 30SIC, with IF1 increasing the affinity of IF2 to 30S IC−3 bydecreasing Kd,app by ~2.5-fold relative to 30S IC−1/3and IF3 decreasing the affinity of IF2 to 30S IC−1 byincreasing Kd,app ~12-fold relative to 30S IC−1/3. Theincreased affinity of IF2 for 30S IC−3 is kineticallydriven by an ~3-fold reduction in kd,app, indicating that,relative to 30S IC−1/3, an IF1-induced structuralrearrangement of 30S IC−3 strengthens IF2's interac-tions with 30S IC−3. In contrast, the decreased affinityof IF2 for 30S IC−1 is kinetically driven by an ~4-folddecrease in ka,app and an ~4-fold increase in kd,app.The decrease in ka,app suggests that, relative to 30SIC−1/3, an IF3-induced structural rearrangement of30S IC−1 decreases the number of IF2-30S IC−1collisions that lead to productive binding of IF2 to 30SIC−1, whereas the increase in kd,app suggests that thesame IF3-induced rearrangement of 30S IC−1weakens the interactions that IF2 makes with 30SIC−1 even for collisions that result in productivebinding. When present simultaneously, however, IF1and IF3 result in a dramatic increase in the affinity ofIF2 for 30S ICC that, relative to 30S IC−1/3, yields adecrease in Kd,app of more than ~30-fold. Thisincreased affinity is kinetically driven by a 1.5-folddecrease in ka,app and an ~50-fold decrease in kd,app.Thus, maximizing the strength of the interactions thatIF2 makes with a canonical 30S IC likely requires astructural rearrangement of the 30S IC that is inducedby the synergistic action of IF1 and IF3.Relative to 30S IC−1/3, the exceedingly transient
binding of IF2 to 30S IC−1 yielded a large numberof EFRET trajectories in which one or more of the
observed excursions to non-zero FRET states werecaptured by only a single frame of the cameradetector of the TIRF microscope. To minimize thetime-averaging of the EFRET that can result fromexcursions to non-zero FRET states that are shorterthan the exposure time of a single frame [33–35], wecalculated EFRET using only those EFRET trajectories(~16%) in which all of the observed excursions tonon-zero FRET states lasted at least three frames.Analysis of these select EFRET trajectories results inthe identification of a single, non-zero FRET statewith an EFRET distribution centered at an EFRET of0.7 ± 0.1 (hereafter referred to as IF2-tRNA0.7,c).Although the ~0.1 difference between the means ofthe EFRET distributions for IF2-tRNA0.8,c andIF2-tRNA0.7,c is within the error of our measurement,it is possible that the slightly lower mean of the EFRETdistribution arises from an IF3-induced structuralrearrangement of 30S IC−1 that results in a smallchange in the conformation of the IF2·tRNA sub-complex relative to 30S IC−1/3. Consistent with thispossibility, the 12-fold decrease in the affinity of IF2to 30S IC−1 relative to 30S IC−1/3 strongly suggeststhat the IF2·tRNA sub-complexes in these two 30SICs are indeed different.Relative to 30S IC−1/3, the longer-lived binding of
IF2 to 30S IC−3 and 30S ICC yielded reversiblefluctuations between at least two non-zero FRETstates with EFRET distributions that are centered atEFRET values consistent with those of IF2-tRNA0.8,cand IF2-tRNA0.5,c (Fig. 2d, Supplementary Fig. 7b,and Supplementary Table 2). Interestingly, thepresence of IF1 in 30S IC−3 preferentially stabilizesIF2-tRNA0.8,c in a manner similar to what isobserved in 30S IC−1/3, whereas the simultaneouspresence of IF1 and IF3 in 30S ICC shifts theIF2-tRNA0.8,c ⇄ IF2-tRNA0.5,c equilibrium towardIF2-tRNA0.5,c. Thus, the structural rearrangement ofthe canonical 30S IC that is induced by the synergisticaction of IF1 and IF3 not only maximizes the strengthof the interactions that IF2 makes with the 30S IC butalso modulates the conformational dynamics of theIF2·tRNA sub-complex such that the relative stabil-ities of the IF2-tRNA0.5,c and IF2-tRNA0.8,c conforma-tions of the IF2·tRNA sub-complex within the 30S ICare altered.
Pseudo 30S ICs exhibit a decreased affinity forIF2 and an altered conformation of the IF2·tRNAsub-complex
Thus far, we have examined the kinetics of IF2binding and the conformational dynamics of theIF2·tRNA sub-complex on canonical 30S ICs con-taining fMet-tRNAfMet. As noted earlier, however,pseudo 30S ICs containing either non-formylatedMet-tRNAfMet or an elongator tRNA exhibit a signifi-cant reduction in the rate of IF2-catalyzed subunitjoining [10,12]. To determine how these tRNAs might

1825Changes in the Dynamics of Initiation Factor 2
influence the affinity of IF2 for the 30S IC and/or theIF2-tRNA0.8,c ⇄ IF2-tRNA0.5,c conformational equi-librium, we collected EFRET trajectories for pseudo30S ICs that were prepared in a manner analogousto 30S ICC but replacing fMet-tRNA(Cy3)fMet with eitherMet-tRNA(Cy3)fMet (30S ICC,Met) or Phe-tRNA(Cy3)
Phe
(30S ICC,Phe). Surprisingly, the EFRET trajectoriescollected for these pseudo 30S ICs did not exhibitany detectable excursions to non-zero FRET states,suggesting that, under our experimental conditions, IF2binds to these 30S ICs (i) too rarely to be detectedwithin the limits imposed by the rate of Cy3 photo-bleaching and/or IF3-induced Met-tRNA(Cy3)fMet orPhe-tRNA(Cy3)Phe dissociation [10], (ii) too transientlyto be detected within the time resolution of our TIRFmicroscope (100 ms per frame), and/or (iii) in aconformation in which the distance between ourlabeling positions on IF2 and tRNA is too large to resultin a detectable EFRET.Given that IF3 is known to perturb the stability of
the P-site tRNA [9,10], we attempted to stabilize theP-site tRNA and increase the probability of observ-ing excursions to non-zero FRET states correspond-ing to the IF2-bound state of the 30S IC by excludingIF3 from the pseudo 30S ICs. As expected,exclusion of IF3 from 30S ICC,Met and 30S ICC,Phe,generating 30S IC−3,Met and 30S IC−3,Phe, yieldeddetectable, albeit rare and exceedingly transient,excursions to non-zero FRET states correspondingto the IF2-bound state of the 30S IC, resulting in Kd,
app values that are 250- to 350-fold larger than Kd,appfor 30S IC−3 (Fig. 3 and Table 1). After correcting formissing IF2 binding events, we determined thatthese effects are kinetically driven by ~30- to 60-folddecreases in ka,app and ~7- to 8-fold increases in kd,app for 30S IC−3,Met and 30S IC−3,Phe, relative to 30SIC−3. Here, the large decrease in ka,app suggeststhat, relative to the structure of a canonical 30S IC−3carrying fMet-tRNAfMet, the structures of the pseudo30S IC−3,Met carrying Met-tRNAfMet and the pseudo30S IC−3,Phe carrying Phe-tRNAPhe are such that thenumber of IF2-30S IC collisions leading to productivebinding of IF2 to these pseudo 30S ICs is greatlydecreased. Moreover, the increase in kd,app suggeststhat the same structures of these pseudo 30S ICsresult in a weakening of the interactions that IF2makes with these pseudo 30S ICs even for collisionsthat result in productive binding. Indeed, it is likelythat the structures of these pseudo 30S ICs are suchthat the strength of the interactions that domain IV ofIF2 makes with Met-tRNAfMet or Phe-tRNAPhe in 30SIC−3,Met and 30S IC−3,Phe, respectively, are greatlyweakened relative to the interactions that domain IV ofIF2 makes with fMet-tRNAfMet in 30S IC−3.Consistent with the structural interpretation present-
ed in the previous paragraph, the exceedingly transientbinding of IF2 to 30S IC−3,Met and 30S IC−3,Phe resultsin broad EFRET distributions of non-zero FRET statesthat are sampledwithEFRET values in the range0.2–1.0
but lacking any distinct peaks. The broad EFRETdistributions lacking any distinct peaks indicate thatthe IF2 and tRNA components of the IF2·tRNAsub-complexes that are formed within pseudo 30SICs can sample a wide range of relative positions butfail to adopt a well-defined, thermodynamically stableconformation. It is unlikely that our inability to observeany distinct peaks in theEFRET distributions arises fromthe time-averaging of EFRET values that can result fromexcursions to non-zero FRET states that are shorterthan the exposure timeof a single frame [33–35], as thesame broad EFRET distribution lacking any distinctpeaks is observed even when EFRET values werecalculated using only those EFRET trajectories in whichall of the observed excursions to non-zero FRET stateslasted at least three frames.We note that, in the case of30S IC−3,Phe, the three-nucleotide increase in thelength of the spacer between the SD and the UUUcodon may contribute to the defect in IF2 bindingand the altered EFRET distribution. However, thestrong similarity between the results obtained with30S IC−3,Met and 30S IC−3,Phe (compare Fig. 3a and band the corresponding entries in Table 1) stronglyargues that these results arise principally from the lackof an fMet-tRNAfMet at the P-site of these pseudo 30SICs.
Non-canonical 30S ICs exhibit a decreasedaffinity for IF2 and an altered conformation ofthe IF2·tRNA sub-complex
IF3 plays a central role in start codon recognition[13,14,26,27,36–39] and, in collaboration with IF1,has been shown to regulate the rate of subunitjoining in a codon-dependent manner. Indeed, whenpresent simultaneously, IF1 and IF3 significantlyreduce the rate of subunit joining to a non-canonical30S IC assembled on an AUU near-cognate startcodon relative to a canonical 30S IC assembled onan AUG start codon [13,14]. When either IF1 or IF3 isexcluded from the 30S IC, however, the rate ofsubunit joining to the non-canonical 30S IC approx-imates that which is observed for the canonical 30SIC. To explore the possibility that IF1 and IF3 impartcodon dependence to the rate of subunit joining bymodulating the stability of IF2 within the 30S IC and/or by altering the conformational dynamics of theIF2·tRNA sub-complex, we collected EFRET trajecto-ries for a series of 30S ICs that were prepared in amanner analogous to that of 30S IC−1/3, 30S IC−3, 30SIC−1, and 30S ICC, with the exception that they wereassembled on an mRNA containing an AUU near-cognate start codon instead of a cognate AUG startcodon (30S IC−1/3,AUU, 30S IC−3,AUU, 30S IC−1,AUU,and 30S ICC,AUU, respectively) (Fig. 4, SupplementaryFig. 8b and c, and Table 1).The results of these experiments show that theKd,app
values, the EFRET distributions, and the conformationaldynamics of the IF2·tRNA sub-complex observed for

Fig. 3. The effect of the P-site tRNA on the stability of IF2 and the conformational dynamics of the IF2·tRNAsub-complex. The layout of rows in this figure is identical with that in Fig. 2. (a) 30S IC−3,Met and (b) 30S IC−3,Phe.
1826 Changes in the Dynamics of Initiation Factor 2
30S IC−1/3,AUU, 30S IC−3,AUU, and 30S IC−1,AUU werealmost indistinguishable from those of the correspond-ing 30S ICs assembled at the AUG codon (compareFig. 4b and Supplementary Fig. 8b and cwith Fig. 2a–cand the corresponding entries in Table 1). In contrast,Kd,app for 30S ICC,AUU increases by ~100-fold relativeto 30S ICC. This decrease in the affinity of IF2 for 30SICC,AUU is kinetically driven by an ~50-fold increase inkd,app, indicating that, relative to 30S ICC, the structureof the non-canonical 30S ICC,AUU programmed with an
AUUnear-cognate start codon is such that the strengthof the interactions that IF2 makes with 30S ICC,AUU aregreatly reduced.In addition to the increased Kd,app and kd,app, the
transient binding of IF2 to 30S ICC,AUU results insampling of non-zero FRET states (SupplementaryFig. 9) with EFRET distributions centered at EFRETvalues of 0.4 ± 0.3 and 0.7 ± 0.1 (hereafter referredto as IF2-tRNA0.4,nc and IF2-tRNA0.7,nc, where the ncsubscript denotes that these states are associated

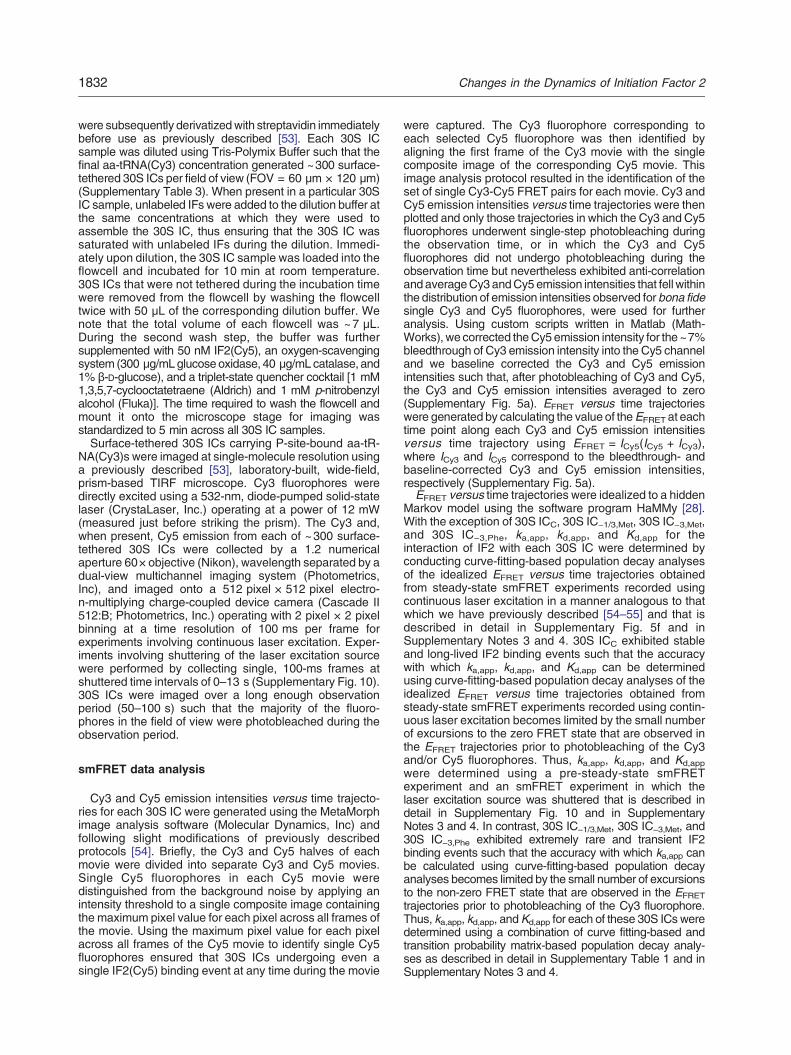
Fig. 4. The effect of the P-site codon on the stability of IF2 and the conformational dynamics of the IF2·tRNAsub-complex. The layout of rows in this figure is identical with that in Fig. 2. (a) 30S IC−3,AUU and (b) 30S ICC,AUU.
1827Changes in the Dynamics of Initiation Factor 2
with non-canonical 30S ICs). Relative toIF2-tRNA0.5,c and IF2-tRNA0.8,c, the means of thedistributions for IF2-tRNA0.4,nc and IF2-tRNA0.7,nc arereduced, and at least in the case of IF2-tRNA0.4,nc, thedistributions are broadened. Within 30S ICC,AUU, theIF2·tRNA sub-complex only rarely and transientlysamples IF2-tRNA0.4,nc, almost exclusively occupyingIF2-tRNA0.7,nc (Fig. 4a and Supplementary Fig. 9).This is in stark contrast to what we observe and
described earlier for the corresponding canonical 30SIC (30S ICC), which exhibits more frequent and stableexcursions between IF2-tRNA0.5,c and IF2-tRNA0.8,c(compare the TDPs in Figs. 2d and 4a). In the case ofIF2-tRNA0.7,nc, it is unlikely that the reducedmean ofthe EFRET distribution, relative to IF2-tRNA0.8,c,arises from the time-averaging of EFRET valuesthat can result from excursions to non-zeroFRET states that are shorter than the exposure

1828 Changes in the Dynamics of Initiation Factor 2
time of a single frame [33–35], as essentially thesameEFRET distribution is observed evenwhenEFRETvalues were calculated using only those EFRETtrajectories in which all of the observed excursionsto non-zero FRET states lasted at least three frames.Thus, it is more likely that the reduced mean of theEFRET distribution in 30S ICC,AUU relative to 30S ICCinstead arises from a codon-dependent differencebetween the conformation of the IF2·tRNA sub-com-plex within 30S ICC,AUU and 30S ICC. Although the~0.1 differences between the means of the EFRETdistributions for IF2-tRNA0.5,c and IF2-tRNA0.4,ncand for IF2-tRNA0.8,c and IF2-tRNA0.7,nc are withinthe error of our measurements, it is possible thatthese slightly lower means of the EFRET distributionsarise from differences in the relative positions ofdomain IV of IF2 and fMet-tRNAfMet in 30S ICC,AUUrelative to 30S ICC. Consistent with this possibility,the 100-fold decrease in the affinity of IF2 and thesignificantly altered frequency and stability oft ransi t ions into IF2-tRNA0.4 ,nc relat ive toIF2-tRNA0.5,c that we only observe when comparing30S ICC,AUU and 30S ICC strongly suggest that theIF2·tRNA sub-complexes in these two 30S ICs areindeed different.
Table 2. Comparison of the ensemble rate of subunitjoining reported in the literature and the occupancy of IF2on the 30S IC estimated from the present work for various30S ICs
Complex Rate of subunitjoining (s−1)a,b
IF2 occupancy (%)c
30S IC−1/3 36a 8830S IC−3 42a 9430S IC−1 8.7a 5030S ICC 2.9a 10030S IC−1/3,Met 0.51a 1.330S IC−3,Met 5.2a 1430S IC−3,Phe 4.0a 1130S ICC 5.4b 9830S ICC,AUU 0.06b 50
a Rate of subunit joining reported by Antoun et al. [10].b Rate of subunit joining reported by Milon et al. [14].c IF2 occupancy = ([IF2/30S]/[30S]), where [IF2/30S] was
calculated by applying the quadratic binding equation [40] to theapparent equilibrium dissociation constants reported in Table 1and the concentrations of IF2 and 30S subunits used in thecorresponding ensemble kinetic studies from which the subunitjoining rates in column 2 of the present table were obtained.
Discussion
Joining of the 50S subunit to the 30S IC serves asa kinetic checkpoint during translation initiation thatis regulated in order to maximize the accuracy offMet-tRNAfMet and start codon selection [9,10,12–14]. The rate of subunit joining is also regulated inorder to control the translational efficiency of mRNAsthat initiate with non-cognate start codons [13,14].Although significant strides have been made inunderstanding the structural basis for IF2's subunitjoining activity [15–18], a complete mechanisticdescription explaining how the rate of the subunitjoining reaction is coupled to the IF, tRNA, andcodon compositions of the 30S IC is currentlyunavailable. Here, we have examined the possibilitythat IF-, tRNA-, and codon-dependent changes tothe conformational dynamics of the IF2·tRNAsub-complex may contribute to the mechanism thatunderlies this coupling. The results of our smFRETstudies reveal that the stability of IF2 within a 30S ICand/or the conformational dynamics of the resultingIF2·tRNA sub-complex are significantly dependenton the IF, tRNA, and codon compositions of the 30SIC. As is described in further detail below, interpre-tation of our results within the context of the availablestructural and biochemical data strongly suggeststhat IF-, tRNA-, and codon-dependent changes tothe structure of the 30S IC regulate the efficiencyand fidelity of subunit joining reaction by modulatingthe stability of IF2 and the conformational dynamicsof the IF2·tRNA sub-complex.
IF2-tRNA0.8,c represents a conformation of theIF2·tRNA sub-complex within canonical 30S ICsthat is associated with rapid subunit joining
Ensemble kinetic studies have shown that the rateof subunit joining to canonical 30S ICs that lack IF3(30S IC−1/3 and 30S IC−3) is fast compared toanalogous canonical 30S ICs containing IF3 (30SIC−1 and 30S ICC) [9,10]. The largest difference(~15-fold) in the rate of subunit joining is seen whencomparing 30S IC−3 and 30S ICC (Tables 2 and 3).Despite the faster rate of subunit joining, we showhere that IF2 binds ~13-fold less tightly to 30S IC−3than to 30S ICC (Table 1), suggesting that IF2 makesweaker interactions with 30S IC−3. These resultsindicate that rapid subunit joining does not neces-sarily require that the strength of the interactions thatanchor IF2 to the 30S IC be maximized. Notably,given the Kd,app values for IF2 binding to 30S IC−3and 30S ICC obtained here (Table 1) and theconcentrations of IF2 and other 30S IC componentsused in ensemble kinetic studies of subunit joining tocanonical 30S ICs [9,10], both 30S IC−3 and 30S ICCare predicted to have been N90% saturated with IF2in the ensemble kinetic studies of subunit joining(Table 2). Collectively, these observations demon-strate that saturation of 30S ICs with IF2 is notsufficient to maximize the rate of subunit joining andsuggest that the conformation of the resultingIF2·tRNA sub-complex is an equally importantfactor.Consistent with this possibility, our results dem-
onstrate that the conformational dynamics of theIF2·tRNA sub-complex differs across a series ofcanonical 30S ICs (Fig. 2). The IF2·tRNA sub-
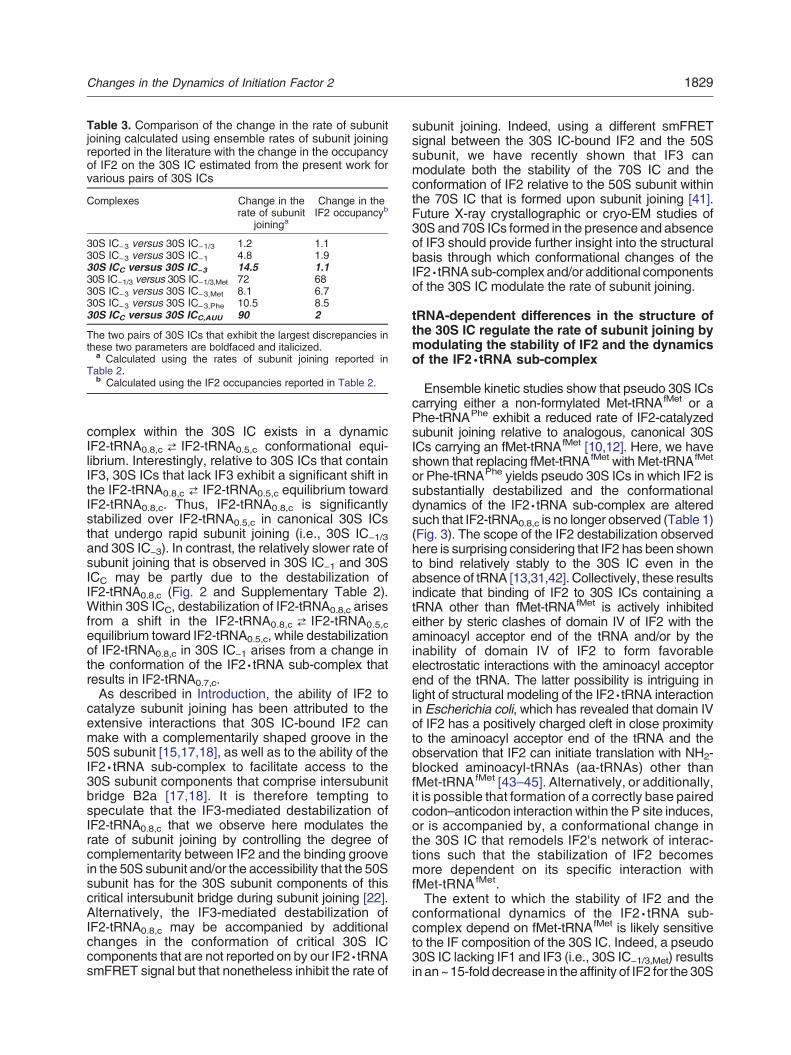
Table 3. Comparison of the change in the rate of subunitjoining calculated using ensemble rates of subunit joiningreported in the literature with the change in the occupancyof IF2 on the 30S IC estimated from the present work forvarious pairs of 30S ICs
Complexes Change in therate of subunit
joininga
Change in theIF2 occupancyb
30S IC−3 versus 30S IC−1/3 1.2 1.130S IC−3 versus 30S IC−1 4.8 1.930S ICC versus 30S IC−3 14.5 1.130S IC−1/3 versus 30S IC−1/3,Met 72 6830S IC−3 versus 30S IC−3,Met 8.1 6.730S IC−3 versus 30S IC−3,Phe 10.5 8.530S ICC versus 30S ICC,AUU 90 2
The two pairs of 30S ICs that exhibit the largest discrepancies inthese two parameters are boldfaced and italicized.
a Calculated using the rates of subunit joining reported inTable 2.
b Calculated using the IF2 occupancies reported in Table 2.
1829Changes in the Dynamics of Initiation Factor 2
complex within the 30S IC exists in a dynamicIF2-tRNA0.8,c ⇄ IF2-tRNA0.5,c conformational equi-librium. Interestingly, relative to 30S ICs that containIF3, 30S ICs that lack IF3 exhibit a significant shift inthe IF2-tRNA0.8,c ⇄ IF2-tRNA0.5,c equilibrium towardIF2-tRNA0.8,c. Thus, IF2-tRNA0.8,c is significantlystabilized over IF2-tRNA0.5,c in canonical 30S ICsthat undergo rapid subunit joining (i.e., 30S IC−1/3and 30S IC−3). In contrast, the relatively slower rate ofsubunit joining that is observed in 30S IC−1 and 30SICC may be partly due to the destabilization ofIF2-tRNA0.8,c (Fig. 2 and Supplementary Table 2).Within 30S ICC, destabilization of IF2-tRNA0.8,c arisesfrom a shift in the IF2-tRNA0.8,c ⇄ IF2-tRNA0.5,cequilibrium toward IF2-tRNA0.5,c, while destabilizationof IF2-tRNA0.8,c in 30S IC−1 arises from a change inthe conformation of the IF2·tRNA sub-complex thatresults in IF2-tRNA0.7,c.As described in Introduction, the ability of IF2 to
catalyze subunit joining has been attributed to theextensive interactions that 30S IC-bound IF2 canmake with a complementarily shaped groove in the50S subunit [15,17,18], as well as to the ability of theIF2·tRNA sub-complex to facilitate access to the30S subunit components that comprise intersubunitbridge B2a [17,18]. It is therefore tempting tospeculate that the IF3-mediated destabilization ofIF2-tRNA0.8,c that we observe here modulates therate of subunit joining by controlling the degree ofcomplementarity between IF2 and the binding groovein the 50S subunit and/or the accessibility that the 50Ssubunit has for the 30S subunit components of thiscritical intersubunit bridge during subunit joining [22].Alternatively, the IF3-mediated destabilization ofIF2-tRNA0.8,c may be accompanied by additionalchanges in the conformation of critical 30S ICcomponents that are not reported on by our IF2·tRNAsmFRET signal but that nonetheless inhibit the rate of
subunit joining. Indeed, using a different smFRETsignal between the 30S IC-bound IF2 and the 50Ssubunit, we have recently shown that IF3 canmodulate both the stability of the 70S IC and theconformation of IF2 relative to the 50S subunit withinthe 70S IC that is formed upon subunit joining [41].Future X-ray crystallographic or cryo-EM studies of30S and 70S ICs formed in the presence and absenceof IF3 should provide further insight into the structuralbasis through which conformational changes of theIF2·tRNAsub-complex and/or additional componentsof the 30S IC modulate the rate of subunit joining.
tRNA-dependent differences in the structure ofthe 30S IC regulate the rate of subunit joining bymodulating the stability of IF2 and the dynamicsof the IF2·tRNA sub-complex
Ensemble kinetic studies show that pseudo 30S ICscarrying either a non-formylated Met-tRNAfMet or aPhe-tRNAPhe exhibit a reduced rate of IF2-catalyzedsubunit joining relative to analogous, canonical 30SICs carrying an fMet-tRNAfMet [10,12]. Here, we haveshown that replacing fMet-tRNAfMet with Met-tRNAfMet
or Phe-tRNAPhe yields pseudo 30S ICs in which IF2 issubstantially destabilized and the conformationaldynamics of the IF2·tRNA sub-complex are alteredsuch that IF2-tRNA0.8,c is no longer observed (Table 1)(Fig. 3). The scope of the IF2 destabilization observedhere is surprising considering that IF2 has been shownto bind relatively stably to the 30S IC even in theabsence of tRNA [13,31,42]. Collectively, these resultsindicate that binding of IF2 to 30S ICs containing atRNA other than fMet-tRNAfMet is actively inhibitedeither by steric clashes of domain IV of IF2 with theaminoacyl acceptor end of the tRNA and/or by theinability of domain IV of IF2 to form favorableelectrostatic interactions with the aminoacyl acceptorend of the tRNA. The latter possibility is intriguing inlight of structural modeling of the IF2·tRNA interactionin Escherichia coli, which has revealed that domain IVof IF2 has a positively charged cleft in close proximityto the aminoacyl acceptor end of the tRNA and theobservation that IF2 can initiate translation with NH2-blocked aminoacyl-tRNAs (aa-tRNAs) other thanfMet-tRNAfMet [43–45]. Alternatively, or additionally,it is possible that formation of a correctly base pairedcodon–anticodon interaction within the P site induces,or is accompanied by, a conformational change inthe 30S IC that remodels IF2's network of interac-tions such that the stabilization of IF2 becomesmore dependent on its specific interaction withfMet-tRNAfMet.The extent to which the stability of IF2 and the
conformational dynamics of the IF2·tRNA sub-complex depend on fMet-tRNAfMet is likely sensitiveto the IF composition of the 30S IC. Indeed, a pseudo30S IC lacking IF1 and IF3 (i.e., 30S IC−1/3,Met) resultsin an~15-fold decrease in the affinity of IF2 for the 30S

1830 Changes in the Dynamics of Initiation Factor 2
IC relative to what is observed in the analogouspseudo 30S IC containing IF1 (i.e., 30S IC−3,Met)(Table 1 and Supplementary Fig. 8a), a result that isconsistentwith the stabilizing effect that IF1 has on IF2binding (Fig. 2 and Table 1).It is important to note that, given the Kd,app values
reported in Table 1 and the concentrations of IF2 andother 30S IC components that have been used inensemble kinetic studies of subunit joining to pseudo30S ICs analogous to those studied here [10,12], wepredict that the pseudo 30S ICs in the ensemblekinetic studies of subunit joining were not saturatedwith IF2 (Tables 2 and 3). Thus, from the currentlyavailable data, it is not possible to distinguish to whatextent the decreased rate of subunit joining that isobserved in ensemble kinetic studies of subunitjoining to pseudo versus canonical 30S ICs resultsfrom the reduced occupancy of IF2 on the 30S IC orfrom the altered conformation that the IF2·tRNAsub-complex adopts in the presence of tRNAs otherthan fMet-tRNAfMet. In order to determine the extentto which subunit joining to pseudo 30S ICs is ratelimited by the conformation of the IF2·tRNA sub-complex, it will be important to conduct futureensemble kinetic studies of subunit joining in whichhigh enough concentrations of IF2 have been usedto ensure that pseudo 30S ICs are saturated withIF2.
IF1- and IF3-induced, codon-dependentdifferencesin the structure of the 30S IC regulate the rate ofsubunit joining by modulating the stability of IF2and the dynamics of the IF2·tRNA sub-complex
Non-canonical 30S ICs assembled on an mRNAcontaining an AUU near-cognate start codon (30SICC,AUU) exhibit an IF1- and IF3-dependent de-crease in the rate of IF2-catalyzed subunit joining[13,14]. Here, we have shown that replacing an AUGcognate start codon in 30S ICC with an AUUnear-cognate start codon in 30S ICC,AUU yieldsnon-canonical 30S ICs in which IF2 is significantlydestabilized and the conformational dynamics of theIF2·tRNA sub-complex are altered (compareFigs. 2d and 4a and see Table 1). It is likely thatthe destabilization of IF2 and the change in theconformational dynamics of the IF2·tRNA sub-com-plex that are observed in 30S ICC,AUU originate fromthe altered position that fMet-tRNAfMet occupieswithin 30S ICs formed on near-cognate start codons,as has recently been proposed [46]. Notably, giventhe Kd,app values reported in Table 1 and theconcentrations of IF2 and the other 30S IC compo-nents that have been used in ensemble kineticstudies of subunit joining to non-canonical 30S ICsanalogous to those studied here [14], we predict that,in the ensemble kinetic studies of subunit joining, thepopulation of IF2-bound non-canonical 30S ICs wasdecreased by a factor of only 2-fold relative to the
population of the IF2-bound canonical 30S ICs(Table 2 and 3). This modest, 2-fold decrease inthe population of IF2-bound non-canonical 30S ICsversus IF2-bound canonical 30S ICs is insufficient toexplain the ~90-fold decrease in the rate of subunitjoining to non-canonical versus canonical 30S ICs inthe ensemble kinetic studies of subunit joining. Thus,we propose that IF1 and IF3 collaboratively exerttheir fidelity function and discriminate against near-cognate start codons within non-canonical 30S ICs,at least in part, by perturbing the conformationaldynamics of the IF2·tRNA sub-complex. Consistentwith this interpretation, Grigoriadou et al. havedemonstrated that non-canonical 30S ICs formedon AUU near-cognate start codons exhibit a large,18-fold decrease in the rate of subunit joining [13]even when using saturating concentrations of athermophilic IF2 variant that is reported to have ahigher affinity than E. coli IF2 for E. coli 30S ICs [47].
Materials and Methods
Preparation andpurification of translational components
E. coli IF1, the γ-isoform of IF2 (referred to as IF2throughout this work), and IF3 were overexpressed inBL21(DE3) cells and purified as described previously [25].5′-Biotinylated mRNAs were variants of the mRNAencoding gene product 32 from T4 bacteriophage andwere chemically synthesized (Dharmacon, Inc.). Additionalinformation on the mRNAs used in this work can be found inSupplementary Note 1. tRNAPhe (Sigma) was aminoacy-lated using a fractionated E. coli S100 cellular extractcontaining a mixture of aa-tRNA synthetases following apreviously described procedure [25,48]. tRNAfMet (MPBiomedicals) was aminoacylated and formylated usingpurified methionyl-tRNA synthetase (prepared as describedbyFourmy et al. [49]) andmethionyl-tRNA formyltransferase(prepared as described by Schmitt et al. [50]) followingpreviously published protocols [25]. Met-tRNAfMet wasprepared using the same protocol that was used to preparefMet-tRNAfMet with the exception that the methionyl-tRNAformyltransferase and the 10-formyltetrahydrofolate formy-lation substrate were not added to the tRNAfMet aminoacyla-tion reaction. Aminoacylated/formylated, aminoacylated,and unacylated tRNAs were separated by hydrophobicinteraction chromatography (HIC) on a TSKgel Phenyl-5PWHIC column (Tosoh Bioscience) following a previouslydescribed protocol [25].30S subunits were purified from E. coli strain MRE600
using a combination of protocols [51–53]. Briefly, sucrosedensity gradient ultracentrifugation was used to purifytight-coupled 70S ribosomes from an E. coliMRE600 lysate.Tight-coupled 70S ribosomes were subsequently dissociatedinto 30S and 50S subunits by dialysis against RibosomeDissociation Buffer [10 mM tris(hydroxymethyl)amino-methane acetate (pH4 °C of 7.5), 60 mM ammonium chloride,1 mM magnesium chloride, 0.5 mM ethylenediamine tetra-acetic acid, and 6 mM β-mercaptoethanol]. The resulting 30Sand50Ssubunitswere separated by sucrose density gradientultracentrifugation in Ribosome Dissociation Buffer. The

1831Changes in the Dynamics of Initiation Factor 2
sucrose density gradient fractions corresponding to the 30Ssubunits were collected, placed into centrifuge tubes, andadjusted to 5 mMMg2+ using 1 Mmagnesium acetate. Thecentrifuge tubeswere then filledwithRibosomeDissociationBuffer that had been adjusted to 7.5 mM Mg2+ with 1 Mmagnesium chloride and ultracentrifuged to pellet thepurified 30S and 50S subunits. The 30S subunit pelletswere resuspended in Ribosome Dissociation Buffer, adjust-ed to 7.5 mM Mg2+ with 1 M magnesium chloride, andstored at −80 °C until further use.
Fluorophore labeling of IF2 and tRNAs
Wild-type E. coli IF2 has three cysteines at amino acidpositions 599, 815, and 861 (note that the IF2 amino acidnumbering used throughout this work corresponds to theα-isoform of IF2). Attempts to generate a cysteine-lessvariant of IF2 resulted in an IF2 mutant that significantlyaggregates during purification and that does not exhibitdetectable function in a standard, toeprinting-based assaydesigned to test the ability of IF2 to select fMet-tRNAfMet
over elongator tRNAs within the 30S IC [23] (data notshown). Using the QuikChange II-E Site-Directed Muta-genesis Kit (Agilent Technologies) and the mutagenicprimers 5′-CGCCGAAATTTTGTGCCATCGCAGGCTG-TATG-3′ and 5′-CATACAGCCTGCGATGGCACAAAATTTCGGCG-3′, we introduced a fourth cysteine via aglycine-to-cysteine mutation at amino acid position 810(G810C). IF2(G810C) was purified and subsequentlyfluorescence labeled using a thiol-reactive, maleimide-derivatized Cy5 (GE Life Sciences). By systematicallytesting fluorescence labeling reaction conditions usingIF2(G810C) versus wild-type IF2 as a control andquantifying the labeling efficiency using the ratio of IF2and Cy5 concentrations calculated from the ultravioletabsorbance and molar extinction coefficient at 280 nm ofIF2 (ε280 nm = 27,390 M−1 cm−1; calculated using theProtParam tool on the ExPASy Proteomics Server†) andthe visible absorbance and molar extinction coefficient at649 nm of Cy5 (ε649 nm = 250,000 M−1 cm−1; as reportedon the Cy5 mono-reactive maleimide product specificationsheet from GE Life Sciences), we found that obtainingselective and efficient labeling of C810 versus the threewild-type cysteines was principally a matter of optimizingthe Cy5:IF2(G810C) ratio. When the Cy5:IF2(G810C) ratioexceeded 15:1, we began to observe labeling of thewild-type cysteines. However, when the Cy5:IF2(G810C)ratio was 10:1, C810 was selectively labeled with a highefficiency (N95%) while an insignificant level (~2%,essentially background levels) of labeling was observedfor the wild-type cysteines (Supplementary Fig. 1). Thefinal, optimized labeling procedure was as follows.IF2(G810C) was buffer exchanged into IF2 Labeling Buffer[10 mM tris(hydroxymethyl)amino methane acetate(pH4 °C of 7.5) and 50 mM potassium chloride] usingMicro Bio-Spin 6 gel-filtration spin columns (Bio-Rad) andwas diluted using IF2 Labeling Buffer to a final concentrationof 30 μM. Tris(2-carboxyethyl)phosphine hydrochloride(TCEP-HCl) was added to the IF2(G810C) solution to afinal concentration of 300 μMand the IF2(G810C)-TCEP-HClsolution was incubated at room temperature for 30 min tocompletely reduce any disulfide bonds in IF2(G810C). Astock solution of 12 mM Cy5 was prepared immediatelybefore use by dissolving Cy5 mono-reactive maleimide (GE
Life Sciences) in anhydrous dimethyl sulfoxide (Sigma)following this incubation, and an appropriate volume of thisCy5 stock solution was immediately added to theIF2(G810C)-TCEP-HCl solution to obtain a final Cy5 con-centration of 300 μM. The reactionwasmixed thoroughly andincubated overnight at 4 °C. The mixture was then loadeddirectly onto a Superdex 200 size-exclusion column (GELife Sciences) that had been pre-equilibrated using IF2Size-Exclusion Buffer [40 mM tris(hydroxymethyl)aminomethane hydrochloride, 80 mM sodium chloride, 40 mMammonium chloride, 5 mM magnesium chloride, and 2 mMβ-mercaptoethanol] in order to separate Cy5-labeled IF2[IF2(Cy5)] fromunreactedCy5. The final IF2(G810C) labelingefficiency, which was N95%, was quantified using the ratio ofIF2 and Cy5 concentrations calculated using the ultravioletabsorbance and molar extinction coefficient at 280 nm of IF2and the visible absorbance andmolar extinction coefficient at649 nm of Cy5 (Supplementary Fig. 1).tRNAfMet and tRNAPhe were fluorescently labeled and
purified following previously published protocols [25]. Briefly,Cy3-labeled tRNAfMet [tRNA(Cy3)fMet] was prepared byreacting maleimide-derivatized Cy3 (GE Life Sciences)with the naturally occurring 4-thiouridine at nucleotideposition 8 within tRNAfMet. Cy3-labeled tRNAPhe
[tRNA(Cy3)Phe] was prepared by reacting N-hydroxysucci-midyl ester-derivatized Cy3 (GE Life Sciences) with the3-(3-amino-3-carboxypropyl)uridine at nucleotide position 47within tRNAPhe. Unreacted Cy3 was removed from thelabeling reactions by extensive phenol extraction, the tRNAswere ethanol precipitated, and the Cy3-labeled tRNAs wereseparated from unlabeled tRNAs on a TSKgel Phenyl-5PWHIC column (Tosoh Bioscience) as previously described[25]. Fractions containing Cy3-labeled tRNAs were pooled,buffer exchanged into NanoPure water using Amiconultracentrifugal filters, and stored at −20 °C. Since theCy3-labeled tRNAs had been purified from the unlabeledtRNAs by HIC, the labeling efficiency of the labeled tRNAsprepared in this manner was ~100%.
Preparation of 30S ICs
30S ICs were prepared by combining final concentra-tions of 0.6 μM aa-tRNA(Cy3), 0.9 μM IF1 (when present),0.9 μM IF3 (when present), 1.8 μM 5′-biotinylated mRNA,and 0.6 μM purified E. coli 30S subunits in a Tris-PolymixBuffer in which the salt concentration has been optimizedas previously described [26] [10 mM tris(hydroxymethyl)aminomethane acetate (pH25 °C of 7.0), 20 mM potassiumchloride, 1 mM ammonium acetate, 0.1 mM calciumacetate, 5 mM magnesium acetate, 0.1 mM ethylenedia-mine tetraacetic acid, 6 mM β-mercaptoethanol, 5 mMputrescine dihydrochloride, 1 mM spermidine free base,and 1 mM GTP] and incubating the reaction mixture at37 °C for 10 min. The 30S IC sample was then transferreddirectly to ice and incubated for 5 min. Finally, the 30S ICsample was divided into small aliquots that were flashfrozen in liquid nitrogen, stored at −80 °C, and thawed andimaged within 24 h of preparation.
TIRF microscopy and smFRET experiments
Quartz microfluidic flowcells were passivated using amixture of PEG and biotinylated PEG (biotin-PEG) and
1832 Changes in the Dynamics of Initiation Factor 2
were subsequently derivatizedwith streptavidin immediatelybefore use as previously described [53]. Each 30S ICsample was diluted using Tris-Polymix Buffer such that thefinal aa-tRNA(Cy3) concentration generated ~300 surface-tethered 30S ICs per field of view (FOV = 60 μm × 120 μm)(Supplementary Table 3). When present in a particular 30SIC sample, unlabeled IFs were added to the dilution buffer atthe same concentrations at which they were used toassemble the 30S IC, thus ensuring that the 30S IC wassaturated with unlabeled IFs during the dilution. Immedi-ately upon dilution, the 30S IC sample was loaded into theflowcell and incubated for 10 min at room temperature.30S ICs that were not tethered during the incubation timewere removed from the flowcell by washing the flowcelltwice with 50 μL of the corresponding dilution buffer. Wenote that the total volume of each flowcell was ~7 μL.During the second wash step, the buffer was furthersupplemented with 50 nM IF2(Cy5), an oxygen-scavengingsystem (300 μg/mLglucose oxidase, 40 μg/mLcatalase, and1% β-D-glucose), and a triplet-state quencher cocktail [1 mM1,3,5,7-cyclooctatetraene (Aldrich) and 1 mM p-nitrobenzylalcohol (Fluka)]. The time required to wash the flowcell andmount it onto the microscope stage for imaging wasstandardized to 5 min across all 30S IC samples.Surface-tethered 30S ICs carrying P-site-bound aa-tR-
NA(Cy3)s were imaged at single-molecule resolution usinga previously described [53], laboratory-built, wide-field,prism-based TIRF microscope. Cy3 fluorophores weredirectly excited using a 532-nm, diode-pumped solid-statelaser (CrystaLaser, Inc.) operating at a power of 12 mW(measured just before striking the prism). The Cy3 and,when present, Cy5 emission from each of ~300 surface-tethered 30S ICs were collected by a 1.2 numericalaperture 60× objective (Nikon), wavelength separated by adual-view multichannel imaging system (Photometrics,Inc), and imaged onto a 512 pixel × 512 pixel electro-n-multiplying charge-coupled device camera (Cascade II512:B; Photometrics, Inc.) operating with 2 pixel × 2 pixelbinning at a time resolution of 100 ms per frame forexperiments involving continuous laser excitation. Exper-iments involving shuttering of the laser excitation sourcewere performed by collecting single, 100-ms frames atshuttered time intervals of 0–13 s (Supplementary Fig. 10).30S ICs were imaged over a long enough observationperiod (50–100 s) such that the majority of the fluoro-phores in the field of view were photobleached during theobservation period.
smFRET data analysis
Cy3 and Cy5 emission intensities versus time trajecto-ries for each 30S IC were generated using the MetaMorphimage analysis software (Molecular Dynamics, Inc) andfollowing slight modifications of previously describedprotocols [54]. Briefly, the Cy3 and Cy5 halves of eachmovie were divided into separate Cy3 and Cy5 movies.Single Cy5 fluorophores in each Cy5 movie weredistinguished from the background noise by applying anintensity threshold to a single composite image containingthe maximum pixel value for each pixel across all frames ofthe movie. Using the maximum pixel value for each pixelacross all frames of the Cy5 movie to identify single Cy5fluorophores ensured that 30S ICs undergoing even asingle IF2(Cy5) binding event at any time during the movie
were captured. The Cy3 fluorophore corresponding toeach selected Cy5 fluorophore was then identified byaligning the first frame of the Cy3 movie with the singlecomposite image of the corresponding Cy5 movie. Thisimage analysis protocol resulted in the identification of theset of single Cy3-Cy5 FRET pairs for each movie. Cy3 andCy5 emission intensities versus time trajectories were thenplotted and only those trajectories in which the Cy3 and Cy5fluorophores underwent single-step photobleaching duringthe observation time, or in which the Cy3 and Cy5fluorophores did not undergo photobleaching during theobservation time but nevertheless exhibited anti-correlationandaverageCy3 andCy5 emission intensities that fell withinthe distribution of emission intensities observed for bona fidesingle Cy3 and Cy5 fluorophores, were used for furtheranalysis. Using custom scripts written in Matlab (Math-Works), we corrected theCy5 emission intensity for the ~7%bleedthrough of Cy3 emission intensity into the Cy5 channeland we baseline corrected the Cy3 and Cy5 emissionintensities such that, after photobleaching of Cy3 and Cy5,the Cy3 and Cy5 emission intensities averaged to zero(Supplementary Fig. 5a). EFRET versus time trajectorieswere generated by calculating the value of theEFRET at eachtime point along each Cy3 and Cy5 emission intensitiesversus time trajectory using EFRET = ICy5(ICy5 + ICy3),where ICy3 and ICy5 correspond to the bleedthrough- andbaseline-corrected Cy3 and Cy5 emission intensities,respectively (Supplementary Fig. 5a).EFRET versus time trajectories were idealized to a hidden
Markov model using the software program HaMMy [28].With the exception of 30S ICC, 30S IC−1/3,Met, 30S IC−3,Met,and 30S IC−3,Phe, ka,app, kd,app, and Kd,app for theinteraction of IF2 with each 30S IC were determined byconducting curve-fitting-based population decay analysesof the idealized EFRET versus time trajectories obtainedfrom steady-state smFRET experiments recorded usingcontinuous laser excitation in a manner analogous to thatwhich we have previously described [54–55] and that isdescribed in detail in Supplementary Fig. 5f and inSupplementary Notes 3 and 4. 30S ICC exhibited stableand long-lived IF2 binding events such that the accuracywith which ka,app, kd,app, and Kd,app can be determinedusing curve-fitting-based population decay analyses of theidealized EFRET versus time trajectories obtained fromsteady-state smFRET experiments recorded using contin-uous laser excitation becomes limited by the small numberof excursions to the zero FRET state that are observed inthe EFRET trajectories prior to photobleaching of the Cy3and/or Cy5 fluorophores. Thus, ka,app, kd,app, and Kd,appwere determined using a pre-steady-state smFRETexperiment and an smFRET experiment in which thelaser excitation source was shuttered that is described indetail in Supplementary Fig. 10 and in SupplementaryNotes 3 and 4. In contrast, 30S IC−1/3,Met, 30S IC−3,Met, and30S IC−3,Phe exhibited extremely rare and transient IF2binding events such that the accuracy with which ka,app canbe calculated using curve-fitting-based population decayanalyses becomes limited by the small number of excursionsto the non-zero FRET state that are observed in the EFRETtrajectories prior to photobleaching of the Cy3 fluorophore.Thus, ka,app, kd,app, andKd,app for each of these 30S ICs weredetermined using a combination of curve fitting-based andtransition probability matrix-based population decay analy-ses as described in detail in Supplementary Table 1 and inSupplementary Notes 3 and 4.

1833Changes in the Dynamics of Initiation Factor 2
Acknowledgements
This work was supported by funds to R.L.G. fromthe BurroughsWellcome Fund (CABS 1004856) andthe National Institutes of Health (R01 GM 084288).K.C. was supported by an American Cancer Societypostdoctoral fellowship (125201). We would like tothank Dr. Daniel MacDougall, Dr. Margaret Elvekrog,Mr. Colin Kinz Thompson, and Ms. Bridget Huang forinsightful discussions and advice and Mr. CoreyPerez for managing the Gonzalez laboratory.Author Contributions: J.W. and R.L.G. designed
the research; J.W. performed the experiments; J.W.,K.C., and R.L.G. analyzed the data; J.W., K.C., andR.L.G. wrote the manuscript; and all three authorsapproved the final manuscript.
Appendix A. Supplementary data
Supplementary data to this article can be foundonline at http://dx.doi.org/10.1016/j.jmb.2014.12.025.
Received 31 August 2014;Received in revised form 12 December 2014;
Accepted 29 December 2014Available online 14 January 2015
Keywords:translation initiation;
smFRET;30S IC;
binding kinetics;conformational dynamics
†http://ca.expasy.org/tools/protparam.html
Abbreviations used:IF, initiation factor; IC, initiation complex; smFRET, single-molecule fluorescence resonance energy transfer; TIRF,total internal reflection fluorescence; cryo-EM, cryogenicelectron microscopy; PEG, polyethylene glycol; FRET,
fluorescence resonance energy transfer; TDP, transitiondensity plot; HIC, hydrophobic interaction chromatography;
TCEP-HCl, tris(2-carboxyethyl)phosphine hydrochloride.
References
[1] Laursen BS, Sørensen HP, Mortensen KK, Sperling-Petersen HU. Initiation of protein synthesis in bacteria.Microbiol Mol Biol Rev 2005;69:101–23.
[2] Simonetti A, Marzi S, Jenner L, Myasnikov A, Romby P,Yusupova G, et al. A structural view of translation initiation inbacteria. Cell Mol Life Sci 2009;66:423–36.
[3] Gualerzi C, Fabbretti A, Brandi L, Milon P, Pon C. Role of theinitiation factors in mRNA start site selection and fMet-tRNA
recruitment by bacterial ribosomes. Israel J Chem 2010;50:80–94.
[4] Milón P, RodninaMV. Kinetic control of translation initiation inbacteria. Crit Rev Biochem Mol Biol 2012;47:334–48.
[5] Farabaugh PJ, Björk GR. How translational accuracy influ-ences reading framemaintenance.EMBOJ1999;18:1427–34.
[6] Clemens MJ, Bommer UA. Translational control: the cancerconnection. Int J Biochem Cell Biol 1999;31:1–23.
[7] Farabaugh PJ. Translational frameshifting: implications forthe mechanism of translational frame maintenance. ProgNucleic Acid Res Mol Biol 2000;64:131–70.
[8] Watkins SJ, Norbury CJ. Translation initiation and itsderegulation during tumorigenesis. Br J Cancer 2002;86:1023–7.
[9] Antoun A, PavlovMY, LovmarM, Ehrenberg M. How initiationfactors tune the rate of initiation of protein synthesis inbacteria. EMBO J 2006;25:2539–50.
[10] Antoun A, PavlovMY, LovmarM, Ehrenberg M. How initiationfactors maximize the accuracy of tRNA selection in initiationof bacterial protein synthesis. Mol Cell 2006;23:183–93.
[11] Grigoriadou C, Marzi S, Kirillov S, Gualerzi CO, CoopermanBS. A quantitative kinetic scheme for 70S translation initiationcomplex formation. J Mol Biol 2007;373:562–72.
[12] Pavlov MY, Zorzet A, Andersson DI, Ehrenberg M. Activationof initiation factor 2 by ligands and mutations for rapiddocking of ribosomal subunits. EMBO J 2011;30:289–301.
[13] Grigoriadou C, Marzi S, Pan D, Gualerzi CO, Cooperman BS.The translational fidelity function of IF3 during transition fromthe 30S initiation complex to the 70S initiation complex. J MolBiol 2007;373:551–61.
[14] Milon P, Konevega AL, Gualerzi CO, Rodnina MV. Kineticcheckpoint at a late step in translation initiation. Mol Cell2008;30:712–20.
[15] Allen GS, Zavialov A, Gursky R, Ehrenberg M, Frank J. Thecryo-EM structure of a translation initiation complex fromEscherichia coli. Cell 2005;121:703–12.
[16] Myasnikov AG, Marzi S, Simonetti A, Giuliodori AM, GualerziCO, Yusupova G, et al. Conformational transition of initiationfactor 2 from the GTP- to GDP-bound state visualized on theribosome. Nat Struct Mol Biol 2005;12:1145–9.
[17] Simonetti A, Marzi S, Myasnikov AG, Fabbretti A, YusupovM, Gualerzi CO, et al. Structure of the 30S translationinitiation complex. Nature 2008;455:416–20.
[18] Julián P, Milon P, Agirrezabala X, Lasso G, Gil D, RodninaMV, et al. The cryo-EM structure of a complete 30Stranslation initiation complex from Escherichia coli. PLoSBiol 2011;9:e1001095.
[19] Roll-Mecak A, Cao C, Dever TE, Burley SK. X-ray structuresof the universal translation initiation factor IF2/eIF5B:conformational changes on GDP and GTP binding. Cell2000;103:781–92.
[20] Graifer DM, Babkina GT, Matasova NB, Vladimirov SN,Karpova GG, Vlassov VV. Structural arrangement of tRNAbinding sites on Escherichia coli ribosomes, as revealed fromdata on affinity labelling with photoactivatable tRNA deriva-tives. Biochim Biophys Acta (BBA) Gene Struct Expr 1989;1008:146–56.
[21] Hennelly SP, Antoun A, Ehrenberg M, Gualerzi CO, KnightW, Lodmell JS, et al. A time-resolved investigation ofribosomal subunit association. J Mol Biol 2005;346:1243–58.
[22] Kipper K, Hetényi C, Sild S, Remme J, Liiv A. Ribosomalintersubunit bridge B2a is involved in factor-dependenttranslation initiation and translational processivity. J MolBiol 2009;385:405–22.

1834 Changes in the Dynamics of Initiation Factor 2
[23] Hartz D, McPheeters DS, Gold L. Selection of the initiatortRNA by Escherichia coli initiation factors. Genes Dev 1989;3:1899–912.
[24] Blanchard SC, Gonzalez RL, Kim HD, Chu S, Puglisi JD.tRNA selection and kinetic proofreading in translation. NatStruct Mol Biol 2004;11:1008–14.
[25] Fei J, Wang J, Sternberg SH, MacDougall DD, Elvekrog MM,Pulukkunat DK, et al. A highly purified, fluorescently labeledin vitro translation system for single-molecule studies ofprotein synthesis. Methods Enzymol 2010;472:221–59.
[26] Elvekrog MM, Gonzalez RL. Conformational selection oftranslation initiation factor 3 signals proper substrate selec-tion. Nat Struct Mol Biol 2013;20:628–33.
[27] La Teana A, Pon CL, Gualerzi CO. Translation of mRNAswith degenerate initiation triplet AUU displays high initiationfactor 2 dependence and is subject to initiation factor 3repression. Proc Natl Acad Sci USA 1993;90:4161–5.
[28] McKinney SA, Joo C, Ha T. Analysis of single-moleculeFRET trajectories using hidden Markov modeling. Biophys J2006;91:1941–51.
[29] Bastiaens PI, Jovin TM. Microspectroscopic imaging tracksthe intracellular processing of a signal transduction protein:fluorescent-labeled protein kinase C beta I. Proc Natl AcadSci USA 1996;93:8407–12.
[30] Hohng S, Joo C, Ha T. Single-molecule three-color FRET.Biophys J 2004;87:1328–37.
[31] Milon P, Carotti M, Konevega AL, Wintermeyer W, RodninaMV, Gualerzi CO. The ribosome-bound initiation factor 2recruits initiator tRNA to the 30S initiation complex. EMBORep 2010;11:312–6.
[32] Milón P, Maracci C, Filonava L, Gualerzi CO, Rodnina MV.Real-time assembly landscape of bacterial 30S translationinitiation complex. Nat Struct Mol Biol 2012;19:609–15.
[33] Bronson JE, Fei J, Hofman JM, Gonzalez RL, Wiggins CH.Learning rates and states from biophysical time series: aBayesian approach to model selection and single-moleculeFRET data. Biophys J 2009;97:3196–205.
[34] van de Meent JW, Bronson JE, Wiggins CH, Gonzalez RL.Empirical Bayes methods enable advanced population-levelanalyses of single-molecule FRET experiments. Biophys J2014;106:1327–37.
[35] Kinz-Thompson CD, Gonzalez RL. smFRET studies of the“encounter” complexes and subsequent intermediate statesthat regulate the selectivity of ligand binding. FEBS Lett 2014;588:3526–38.
[36] Butler J, Springer M, Dondon J, Graffe M, Grunberg-ManagoM. Escherichia coli protein synthesis initiation factor IF3controls its own gene expression at the translational levelin vivo. J Mol Biol 1986;192:767–80.
[37] Butler JS, Springer M, Grunberg-Manago M. AUU-to-AUGmutation in the initiator codon of the translation initiationfactor IF3 abolishes translational autocontrol of its own gene(infC) in vivo. Proc Natl Acad Sci USA 1987;84:4022–5.
[38] Hartz D, Binkley J, Hollingsworth T, Gold L. Domains of initiatortRNA and initiation codon crucial for initiator tRNA selection byEscherichia coli IF3. Genes Dev 1990;4:1790–800.
[39] Meinnel T, Sacerdot C, Graffe M, Blanquet S, Springer M.Discrimination by Escherichia coli initiation factor IF3 againstinitiation on non-canonical codons relies on complementarityrules. J Mol Biol 1999;290:825–37.
[40] Copeland RA. Enzymes a practical introduction to structure,mechanism, and data analysis. New York: Wiley; 200076–108.
[41] MacDougall DD, Gonzalez RL. Translation initiation factor 3regulates switching between different modes of ribosomalsubunit joining. J Mol Biol 2015;427:1801–18.
[42] Weiel J, Hershey JW. The binding of fluorescein-labeledprotein synthesis initiation factor 2 to Escherichia coli 30Sribosomal subunits determined by fluorescence polarization.J Biol Chem 1982;257:1215–20.
[43] Wintermeyer W, Gualerzi C. Effect of Escherichia coliinitiation factors on the kinetics ofN-AcPhe-tRNAPhe bindingto 30S ribosomal subunits. A fluorescence stopped-flowstudy. Biochemistry 1983;22:690–4.
[44] Gualerzi CO, Wintermeyer W. Prokaryotic initiation factor 2acts at the level of the 30S ribosomal subunit: a fluorescencestopped-flow study. FEBS Lett 1986;202:1–6.
[45] Steiner-Mosonyi M, Creuzenet C, Keates RA, Strub BR,Mangroo D. The Pseudomonas aeruginosa initiation factorIF-2 is responsible for formylation-independent proteininitiation in P. aeruginosa. J Biol Chem 2004;279:52262–9.
[46] Qin D, Liu Q, Devaraj A, Fredrick K. Role of helix 44 of 16SrRNA in the fidelity of translation initiation. RNA 2012;18:485–95.
[47] Qin H, Grigoriadou C, Cooperman BS. Interaction of IF2 withthe ribosomal GTPase-associated center during 70S initia-tion complex formation. Biochemistry 2009;48:4699–706.
[48] Carbon J, David H. Studies on the thionucleotides in transferribonucleic acid. Addition of N-ethylmaleimide and formationof mixed disulfides with thiol compounds. Biochemistry 1968;7:3851–8.
[49] Fourmy D, Mechulam Y, Brunie S, Blanquet S, Fayat G.Identification of residues involved in the binding of methio-nine by Escherichia coli methionyl-tRNA synthetase. FEBSLett 1991;292:259–63.
[50] Schmitt E, Blanquet S, Mechulam Y. Crystallization andpreliminary X-ray analysis of Escherichia coli methionyl-tRNAMet(f) formyltransferase complexed with formyl-methio-nyl-tRNAMet(f). Acta Crystallogr D Biol Crystallogr 1999;55:332–4.
[51] Paulsen H, Robertson JM, Wintermeyer W. Effect ofribosome binding and translocation on the anticodon oftRNAPhe as studied by wybutine fluorescence. NucleicAcids Res 1982;10:2651–63.
[52] Powers T, Noller HF. A functional pseudoknot in 16Sribosomal RNA. EMBO J 1991;10:2203–14.
[53] Blanchard SC, Kim HD, Gonzalez RL, Puglisi JD, Chu S.tRNA dynamics on the ribosome during translation. Proc NatlAcad Sci USA 2004;101:12893–8.
[54] Fei J, Kosuri P, MacDougall DD, Gonzalez RL. Coupling ofribosomal L1 stalk and tRNA dynamics during translationelongation. Mol Cell 2008;30:348–59.
[55] Fei J, Bronson JE, Hofman JM, Srinivas RL, Wiggins CH,Gonzalez RL. Allosteric collaboration between elongationfactor G and the ribosomal L1 stalk directs tRNA movementsduring translation. Proc Natl Acad Sci USA 2009;106:15702–7.