Embed Size (px)
Citation preview
RECEPTION AND INTEGRATION AGENCY
MONTHLY STATISTICS REPORT
January 2017

1. Table of Contents 2. Applications for declaration as a Refugee 3. Top five countries of Origin 4. Return of EU13 Accession State Nationals 5. Accommodation Status of RIA Residents 6. Age profile of RIA Residents 7. Overview of Direct Provision 8. Profile of new RIA applicants accommodated 9. Capacity/Occupancy by county 10. Capacity/Occupancy by HSE area 11. Capacity/Occupancy 2000 to date 12. Capacity/Occupancy charts 2010 to date 13. Dispersal and breakdown of RIA Accommodation Centres 14. Accommodation Centres 15. Accommodation Centre Portfolio 16. Nationality and Geographical breakdown of RIA Residents 17. Breakdown of family groups in RIA Accommodation 18. Duration of stay by applicants in Direct Provision 19. Dispersal Statistics
RIA Monthly Report January 2017 1
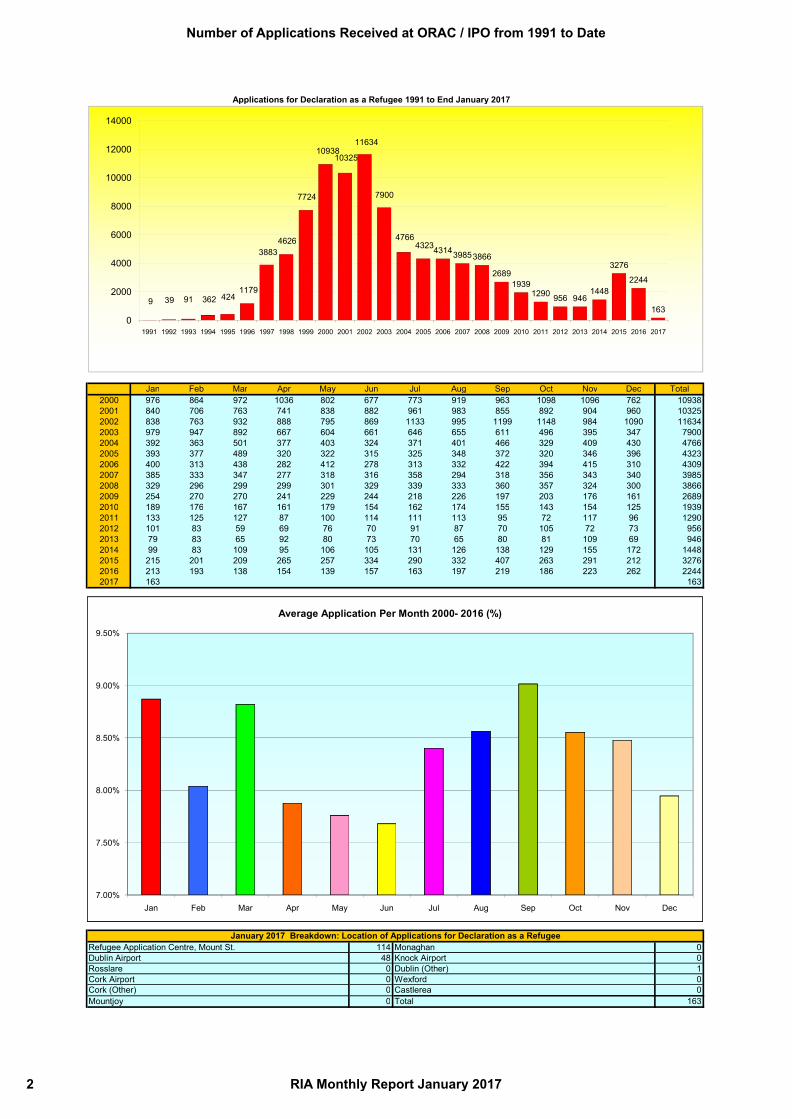
Jan Feb Mar Apr May Jun Jul Aug Sep Oct Nov Dec Total2000 976 864 972 1036 802 677 773 919 963 1098 1096 762 109382001 840 706 763 741 838 882 961 983 855 892 904 960 103252002 838 763 932 888 795 869 1133 995 1199 1148 984 1090 116342003 979 947 892 667 604 661 646 655 611 496 395 347 79002004 392 363 501 377 403 324 371 401 466 329 409 430 47662005 393 377 489 320 322 315 325 348 372 320 346 396 43232006 400 313 438 282 412 278 313 332 422 394 415 310 43092007 385 333 347 277 318 316 358 294 318 356 343 340 39852008 329 296 299 299 301 329 339 333 360 357 324 300 38662009 254 270 270 241 229 244 218 226 197 203 176 161 26892010 189 176 167 161 179 154 162 174 155 143 154 125 1939
Applications for Declaration as a Refugee 1991 to End January 2017
9 39 91 362 4241179
38834626
7724
1093810325
11634
7900
47664323431439853866
26891939
1290 956 9461448
3276
2244
1630
2000
4000
6000
8000
10000
12000
14000
1991 1992 1993 1994 1995 1996 1997 1998 1999 2000 2001 2002 2003 2004 2005 2006 2007 2008 2009 2010 2011 2012 2013 2014 2015 2016 2017
2010 189 176 167 161 179 154 162 174 155 143 154 125 19392011 133 125 127 87 100 114 111 113 95 72 117 96 12902012 101 83 59 69 76 70 91 87 70 105 72 73 9562013 79 83 65 92 80 73 70 65 80 81 109 69 9462014 99 83 109 95 106 105 131 126 138 129 155 172 14482015 215 201 209 265 257 334 290 332 407 263 291 212 32762016 213 193 138 154 139 157 163 197 219 186 223 262 22442017 163 163
114 048 0
0 10 00 00 163
Cork Airport WexfordCastlerea
Mountjoy
January 2017 Breakdown: Location of Applications for Declaration as a Refugee
Total
Refugee Application Centre, Mount St. Monaghan
Cork (Other)
Dublin Airport Knock AirportRosslare Dublin (Other)
7.00%
7.50%
8.00%
8.50%
9.00%
9.50%
Jan Feb Mar Apr May Jun Jul Aug Sep Oct Nov Dec
Average Application Per Month 2000- 2016 (%)
Number of Applications Received at ORAC / IPO from 1991 to Date
2 RIA Monthly Report January 2017
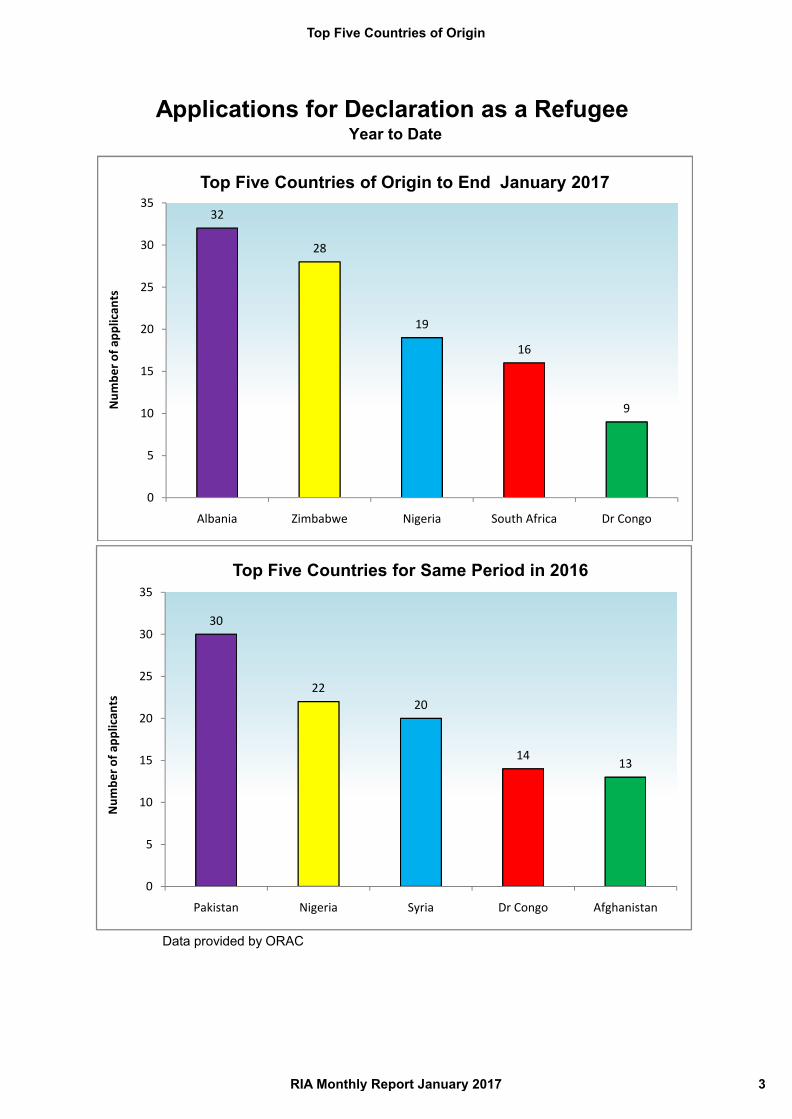
Applications for Declaration as a Refugee Year to Date
32
28
19
16
9
0
5
10
15
20
25
30
35
Num
ber o
f app
lican
ts
Top Five Countries of Origin to End January 2017
Data provided by ORAC
Albania Zimbabwe Nigeria South Africa Dr Congo
30
2220
14 13
0
5
10
15
20
25
30
35
Pakistan Nigeria Syria Dr Congo Afghanistan
Num
ber o
f app
lican
ts
Top Five Countries for Same Period in 2016
Top Five Countries of Origin
RIA Monthly Report January 2017 3
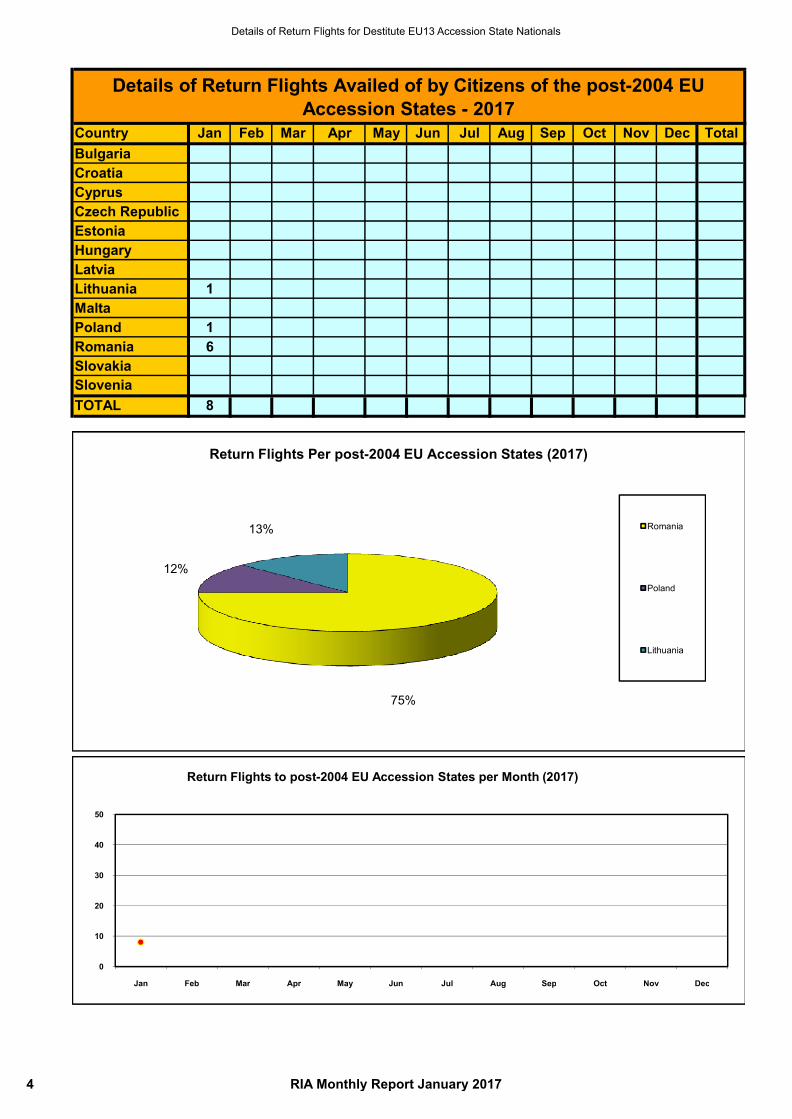
Country Jan Feb Mar Apr May Jun Jul Aug Sep Oct Nov Dec TotalBulgariaCroatiaCyprusCzech RepublicEstoniaHungaryLatviaLithuania 1MaltaPoland 1Romania 6SlovakiaSloveniaTOTAL 8
Details of Return Flights Availed of by Citizens of the post-2004 EU Accession States - 2017
Return Flights Per post-2004 EU Accession States (2017)
75%
12%
13% Romania
Poland
Lithuania
0
10
20
30
40
50
Jan Feb Mar Apr May Jun Jul Aug Sep Oct Nov Dec
Return Flights to post-2004 EU Accession States per Month (2017)
Details of Return Flights for Destitute EU13 Accession State Nationals
4 RIA Monthly Report January 2017
485
66
500
510
1670
400
600
800
1000
1200
1400
1600
1800
Num
ber o
f Res
iden
ts
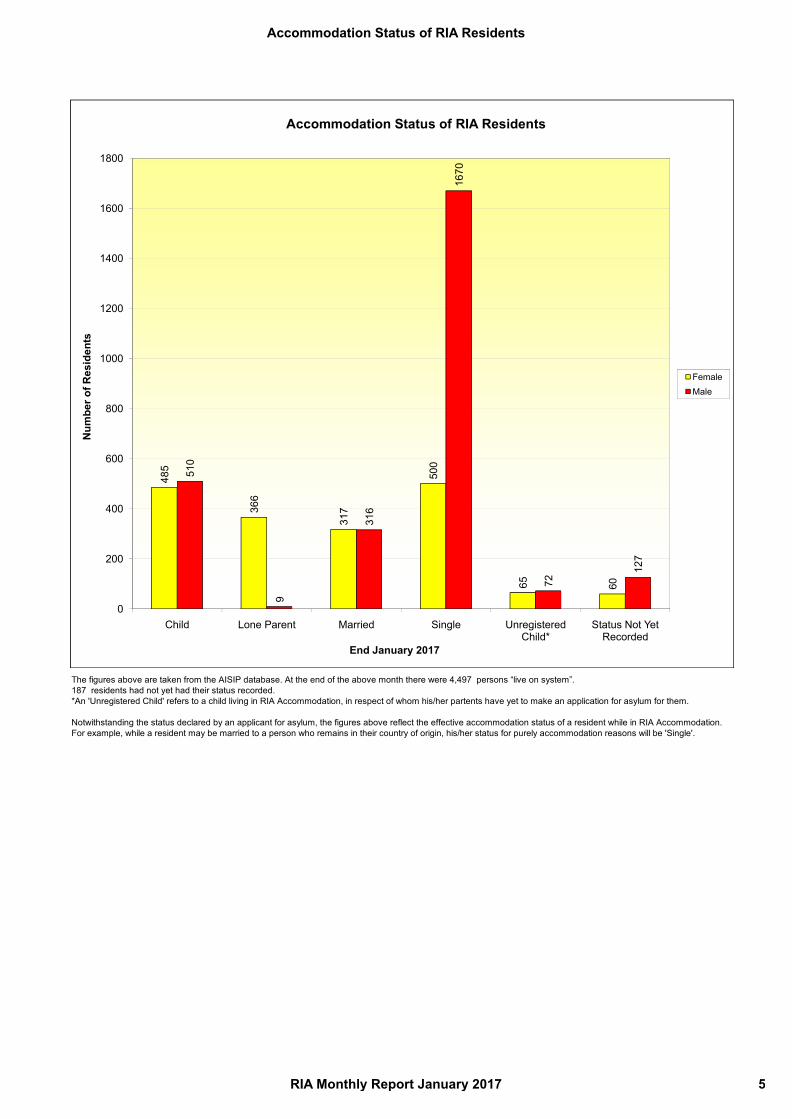
Accommodation Status of RIA Residents
FemaleMale
The figures above are taken from the AISIP database. At the end of the above month there were 4,497 persons “live on system”.187 residents had not yet had their status recorded. *An 'Unregistered Child' refers to a child living in RIA Accommodation, in respect of whom his/her partents have yet to make an application for asylum for them.
Notwithstanding the status declared by an applicant for asylum, the figures above reflect the effective accommodation status of a resident while in RIA Accommodation. For example, while a resident may be married to a person who remains in their country of origin, his/her status for purely accommodation reasons will be 'Single'.
36
317
65 60
9
316
72
127
0
200
400
Child Lone Parent Married Single Unregistered Child*
Status Not Yet Recorded
End January 2017
Accommodation Status of RIA Residents
RIA Monthly Report January 2017 5
443529
167
637
1450
884
289
7325
0
200
400
600
800
1000
1200
1400
1600
0-4 5-12 13-17 18-25 26-35 36-45 46-55 56-65 66+
Num
ber o
f Res
iden
ts
Age
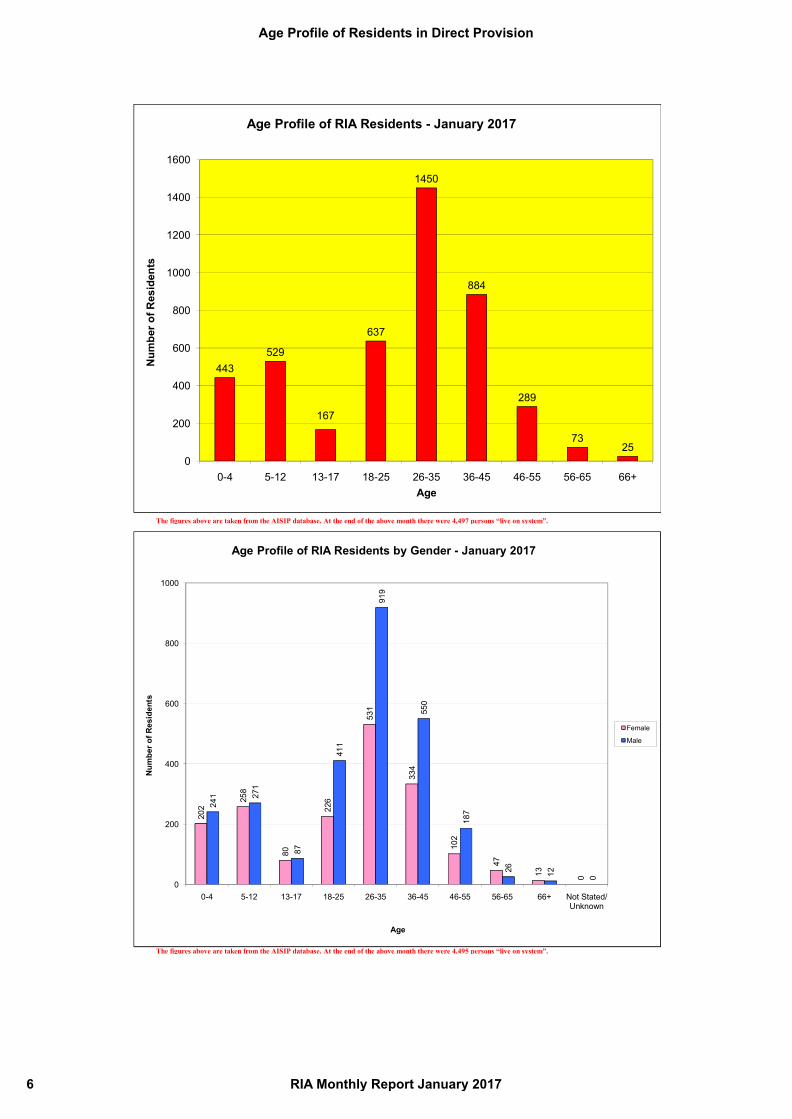
Age Profile of RIA Residents - January 2017
The figures above are taken from the AISIP database. At the end of the above month there were 4,497 persons “live on system”.
The figures above are taken from the AISIP database. At the end of the above month there were 4,495 persons “live on system”.
202
258
80
226
531
334
102
47
13 0
241 27
1
87
411
919
550
187
26 12 0
0
200
400
600
800
1000
0-4 5-12 13-17 18-25 26-35 36-45 46-55 56-65 66+ Not Stated/ Unknown
Num
ber o
f Res
iden
ts
Age
Age Profile of RIA Residents by Gender - January 2017
Female
Male
Age Profile of Residents in Direct Provision
6 RIA Monthly Report January 2017
25/12/2016 - 29/01/2017 Year to 29/01/201710 April 2000 to
29/01/2017*
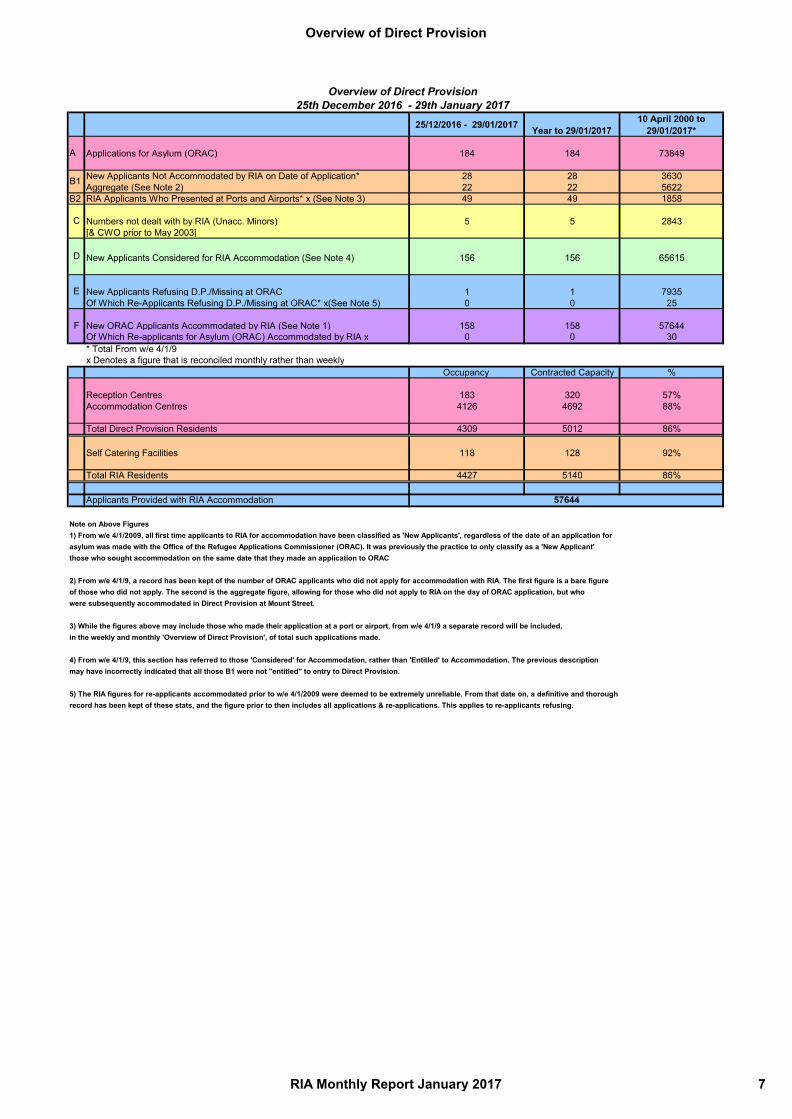
Applications for Asylum (ORAC) 184 184 73849
New Applicants Not Accommodated by RIA on Date of Application* 28 28 3630Aggregate (See Note 2) 22 22 5622
B2 RIA Applicants Who Presented at Ports and Airports* x (See Note 3) 49 49 1858
Numbers not dealt with by RIA (Unacc. Minors) 5 5 2843[& CWO prior to May 2003]
New Applicants Considered for RIA Accommodation (See Note 4) 156 156 65615
New Applicants Refusing D.P./Missing at ORAC 1 1 7935Of Which Re-Applicants Refusing D.P./Missing at ORAC* x(See Note 5) 0 0 25
New ORAC Applicants Accommodated by RIA (See Note 1) 158 158 57644Of Which Re-applicants for Asylum (ORAC) Accommodated by RIA x 0 0 30* Total From w/e 4/1/9 x Denotes a figure that is reconciled monthly rather than weekly
Occupancy Contracted Capacity %
Reception Centres 183 320 57%Accommodation Centres 4126 4692 88%
Total Direct Provision Residents 4309 5012 86%
Self Catering Facilities 118 128 92%
Total RIA Residents 4427 5140 86%
Applicants Provided with RIA Accommodation
Note on Above Figures1) From w/e 4/1/2009, all first time applicants to RIA for accommodation have been classified as 'New Applicants', regardless of the date of an application forasylum was made with the Office of the Refugee Applications Commissioner (ORAC). It was previously the practice to only classify as a 'New Applicant' those who sought accommodation on the same date that they made an application to ORAC
2) From w/e 4/1/9, a record has been kept of the number of ORAC applicants who did not apply for accommodation with RIA. The first figure is a bare figureof those who did not apply. The second is the aggregate figure, allowing for those who did not apply to RIA on the day of ORAC application, but who were subsequently accommodated in Direct Provision at Mount Street.
3) While the figures above may include those who made their application at a port or airport, from w/e 4/1/9 a separate record will be included,in the weekly and monthly 'Overview of Direct Provision', of total such applications made.
4) From w/e 4/1/9, this section has referred to those 'Considered' for Accommodation, rather than 'Entitled' to Accommodation. The previous descriptionmay have incorrectly indicated that all those B1 were not "entitled" to entry to Direct Provision.
5) The RIA figures for re-applicants accommodated prior to w/e 4/1/2009 were deemed to be extremely unreliable. From that date on, a definitive and thoroughrecord has been kept of these stats, and the figure prior to then includes all applications & re-applications. This applies to re-applicants refusing.
F
57644
Overview of Direct Provision 25th December 2016 - 29th January 2017
A
B1
C
D
E
Overview of Direct Provision
RIA Monthly Report January 2017 7
Date Male Female Parent Child
Couple with
Child(ren)Child of Couple
Couple(s), No
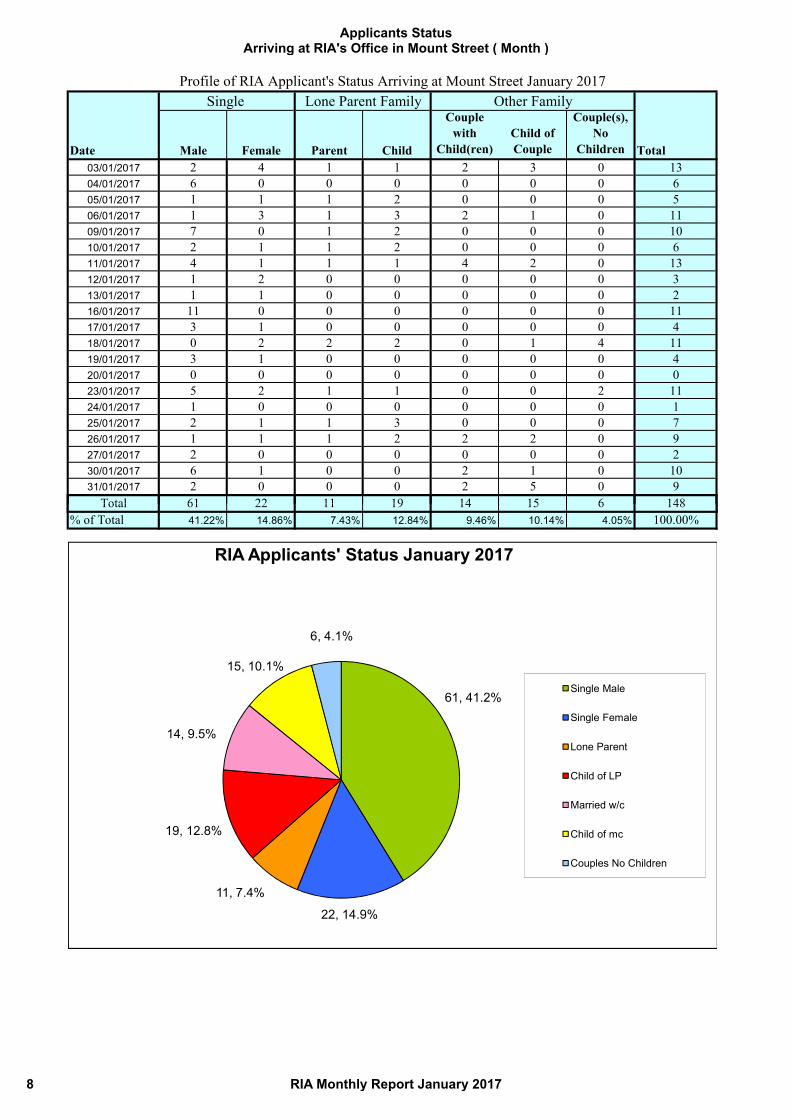
Children Total03/01/2017 2 4 1 1 2 3 0 1304/01/2017 6 0 0 0 0 0 0 605/01/2017 1 1 1 2 0 0 0 506/01/2017 1 3 1 3 2 1 0 1109/01/2017 7 0 1 2 0 0 0 1010/01/2017 2 1 1 2 0 0 0 611/01/2017 4 1 1 1 4 2 0 1312/01/2017 1 2 0 0 0 0 0 313/01/2017 1 1 0 0 0 0 0 216/01/2017 11 0 0 0 0 0 0 1117/01/2017 3 1 0 0 0 0 0 418/01/2017 0 2 2 2 0 1 4 1119/01/2017 3 1 0 0 0 0 0 420/01/2017 0 0 0 0 0 0 0 023/01/2017 5 2 1 1 0 0 2 1124/01/2017 1 0 0 0 0 0 0 125/01/2017 2 1 1 3 0 0 0 726/01/2017 1 1 1 2 2 2 0 927/01/2017 2 0 0 0 0 0 0 230/01/2017 6 1 0 0 2 1 0 1031/01/2017 2 0 0 0 2 5 0 9
Total 61 22 11 19 14 15 6 148
Profile of RIA Applicant's Status Arriving at Mount Street January 2017Single Lone Parent Family Other Family
Total 61 22 11 19 14 15 6 148% of Total 41.22% 14.86% 7.43% 12.84% 9.46% 10.14% 4.05% 100.00%
61, 41.2%
22, 14.9%
11, 7.4%
19, 12.8%
14, 9.5%
15, 10.1%
6, 4.1%
RIA Applicants' Status January 2017
Single Male
Single Female
Lone Parent
Child of LP
Married w/c
Child of mc
Couples No Children
Arriving at RIA's Office in Mount Street ( Month )Applicants Status
8 RIA Monthly Report January 2017
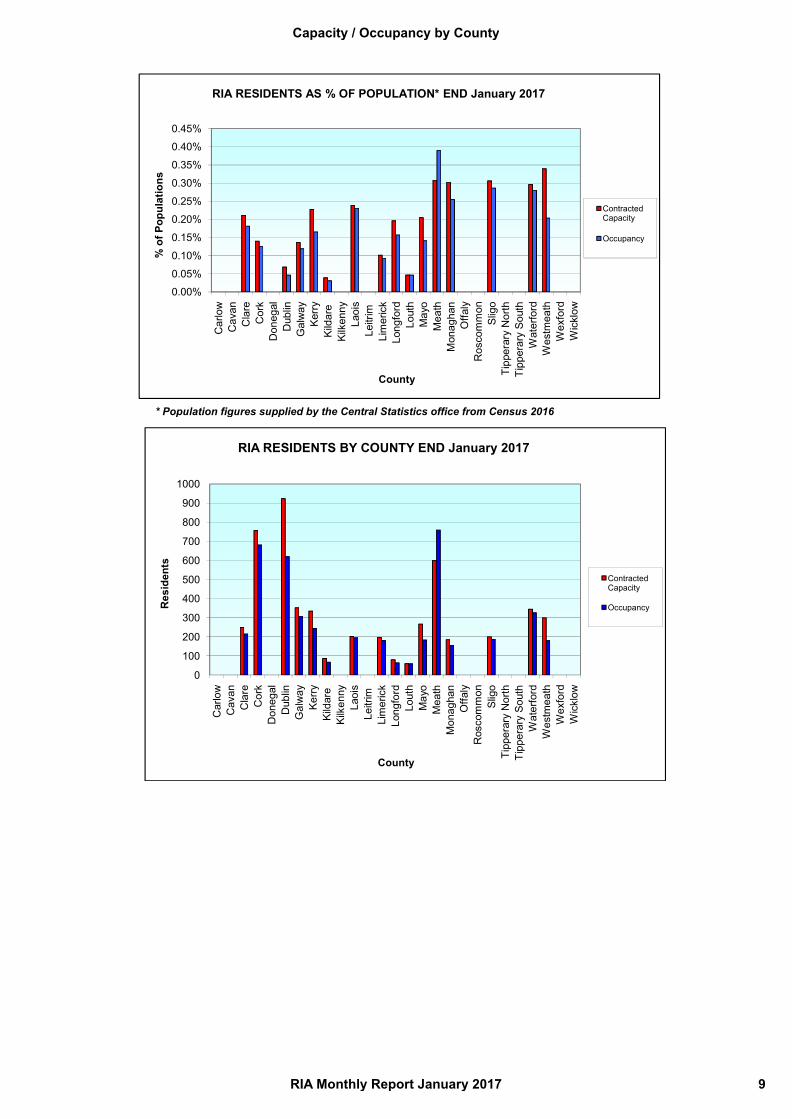
* Population figures supplied by the Central Statistics office from Census 2016
0.00%
0.05%
0.10%
0.15%
0.20%
0.25%
0.30%
0.35%
0.40%
0.45%
Car
low
Cav
anC
lare
Cor
kD
oneg
alD
ublin
Gal
way
Kerr
yKi
ldar
e Ki
lken
nyLa
ois
Leitr
im
Lim
eric
kLo
ngfo
rdLo
uth
May
oM
eath
Mon
agha
nO
ffaly
Ros
com
mon
Slig
oTi
pper
ary
Nor
thTi
pper
ary
Sout
hW
ater
ford
Wes
tmea
thW
exfo
rdW
ickl
ow
% o
f Pop
ulat
ions
County
RIA RESIDENTS AS % OF POPULATION* END January 2017
Contracted Capacity
Occupancy
900
1000
RIA RESIDENTS BY COUNTY END January 2017
0
100
200
300
400
500
600
700
800
900
Car
low
Cav
anC
lare
Cor
kD
oneg
alD
ublin
Gal
way
Kerry
Kild
are
Kilk
enny
Laoi
sLe
itrim
Li
mer
ick
Long
ford
Lout
hM
ayo
Mea
thM
onag
han
Offa
lyR
osco
mm
onSl
igo
Tipp
erar
y N
orth
Tipp
erar
y So
uth
Wat
erfo
rdW
estm
eath
Wex
ford
Wic
klow
Res
iden
ts
County
Contracted Capacity
Occupancy
Capacity / Occupancy by County
RIA Monthly Report January 2017 9
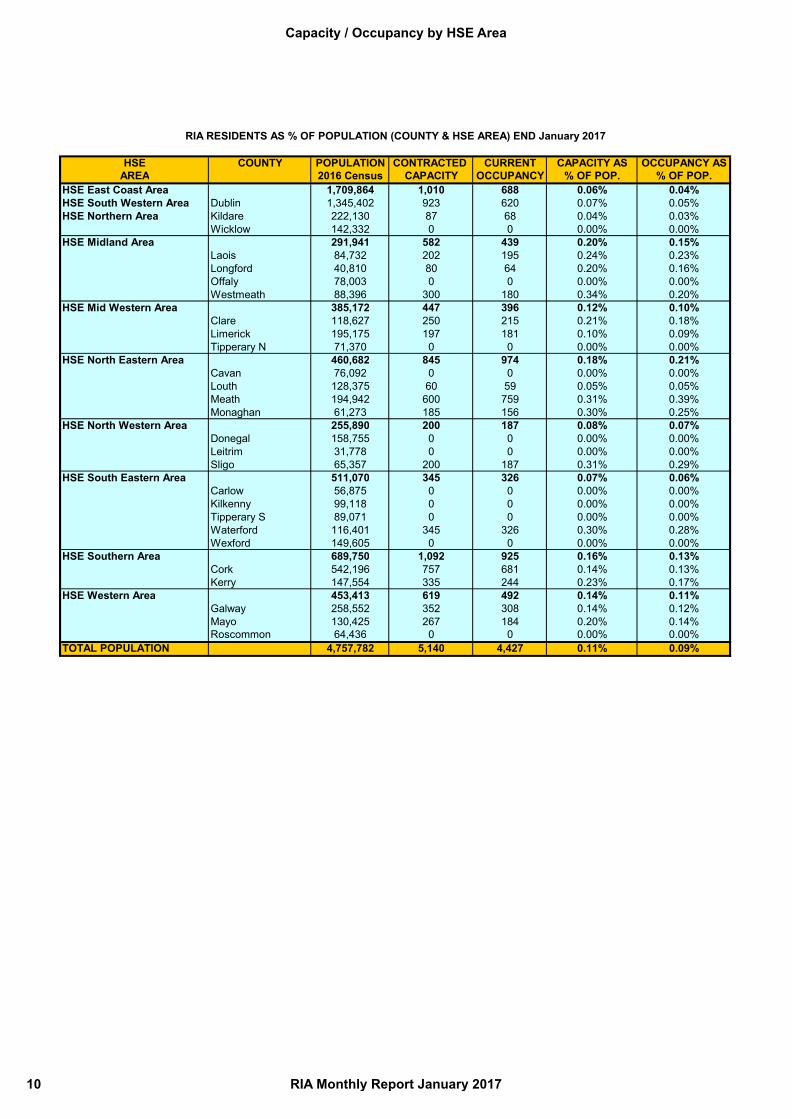
HSE COUNTY POPULATION CONTRACTED CURRENT CAPACITY AS OCCUPANCY ASAREA 2016 Census CAPACITY OCCUPANCY % OF POP. % OF POP.
HSE East Coast Area 1,709,864 1,010 688 0.06% 0.04%HSE South Western Area Dublin 1,345,402 923 620 0.07% 0.05%HSE Northern Area Kildare 222,130 87 68 0.04% 0.03%
Wicklow 142,332 0 0 0.00% 0.00%HSE Midland Area 291,941 582 439 0.20% 0.15%
Laois 84,732 202 195 0.24% 0.23%Longford 40,810 80 64 0.20% 0.16%Offaly 78,003 0 0 0.00% 0.00%Westmeath 88,396 300 180 0.34% 0.20%
HSE Mid Western Area 385,172 447 396 0.12% 0.10%Clare 118,627 250 215 0.21% 0.18%Limerick 195,175 197 181 0.10% 0.09%Tipperary N 71,370 0 0 0.00% 0.00%
HSE North Eastern Area 460,682 845 974 0.18% 0.21%Cavan 76,092 0 0 0.00% 0.00%Louth 128,375 60 59 0.05% 0.05%Meath 194,942 600 759 0.31% 0.39%Monaghan 61,273 185 156 0.30% 0.25%
HSE North Western Area 255,890 200 187 0.08% 0.07%Donegal 158,755 0 0 0.00% 0.00%Leitrim 31,778 0 0 0.00% 0.00%Sligo 65,357 200 187 0.31% 0.29%
HSE South Eastern Area 511,070 345 326 0.07% 0.06%Carlow 56,875 0 0 0.00% 0.00%Kilkenny 99,118 0 0 0.00% 0.00%Tipperary S 89,071 0 0 0.00% 0.00%Waterford 116,401 345 326 0.30% 0.28%Wexford 149,605 0 0 0.00% 0.00%
HSE Southern Area 689,750 1,092 925 0.16% 0.13%Cork 542,196 757 681 0.14% 0.13%Kerry 147,554 335 244 0.23% 0.17%
HSE Western Area 453,413 619 492 0.14% 0.11%Galway 258,552 352 308 0.14% 0.12%Mayo 130,425 267 184 0.20% 0.14%Roscommon 64,436 0 0 0.00% 0.00%
TOTAL POPULATION 4,757,782 5,140 4,427 0.11% 0.09%
RIA RESIDENTS AS % OF POPULATION (COUNTY & HSE AREA) END January 2017
Capacity / Occupancy by HSE Area
10 RIA Monthly Report January 2017
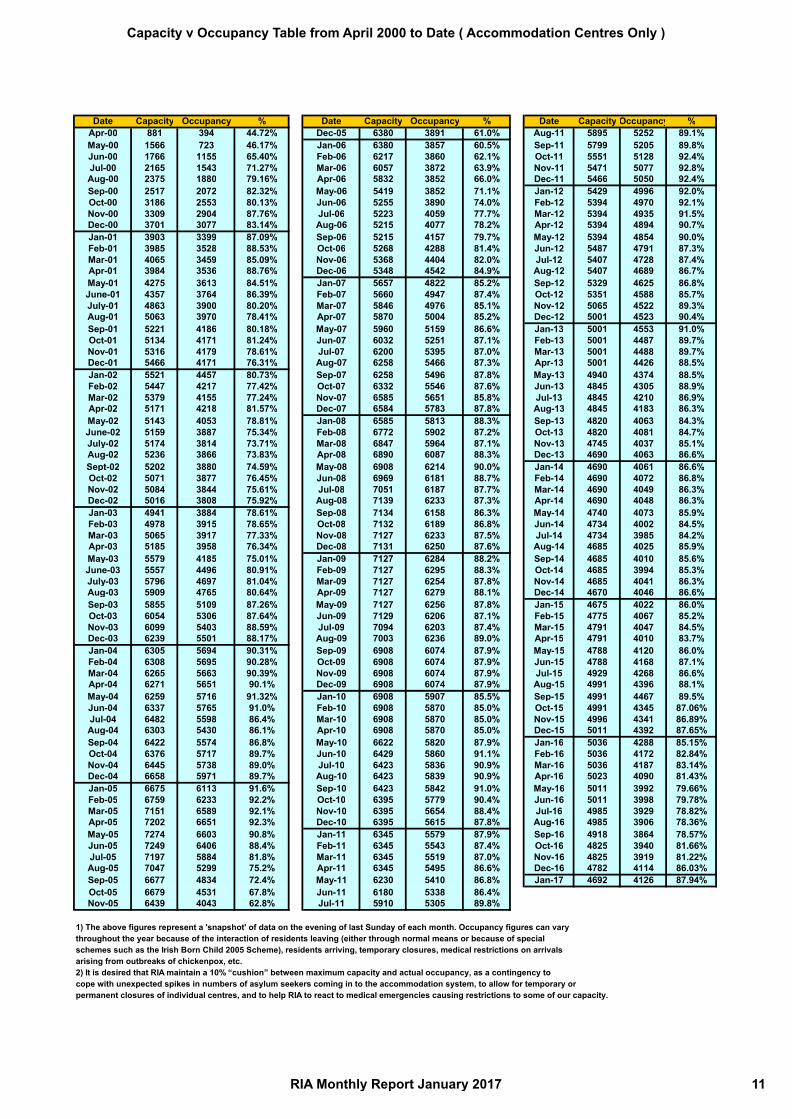
Date Capacity Occupancy % Date Capacity Occupancy % Date Capacity Occupancy %Apr-00 881 394 44.72% Dec-05 6380 3891 61.0% Aug-11 5895 5252 89.1%May-00 1566 723 46.17% Jan-06 6380 3857 60.5% Sep-11 5799 5205 89.8%Jun-00 1766 1155 65.40% Feb-06 6217 3860 62.1% Oct-11 5551 5128 92.4%Jul-00 2165 1543 71.27% Mar-06 6057 3872 63.9% Nov-11 5471 5077 92.8%Aug-00 2375 1880 79.16% Apr-06 5832 3852 66.0% Dec-11 5466 5050 92.4%Sep-00 2517 2072 82.32% May-06 5419 3852 71.1% Jan-12 5429 4996 92.0%Oct-00 3186 2553 80.13% Jun-06 5255 3890 74.0% Feb-12 5394 4970 92.1%Nov-00 3309 2904 87.76% Jul-06 5223 4059 77.7% Mar-12 5394 4935 91.5%Dec-00 3701 3077 83.14% Aug-06 5215 4077 78.2% Apr-12 5394 4894 90.7%Jan-01 3903 3399 87.09% Sep-06 5215 4157 79.7% May-12 5394 4854 90.0%Feb-01 3985 3528 88.53% Oct-06 5268 4288 81.4% Jun-12 5487 4791 87.3%Mar-01 4065 3459 85.09% Nov-06 5368 4404 82.0% Jul-12 5407 4728 87.4%Apr-01 3984 3536 88.76% Dec-06 5348 4542 84.9% Aug-12 5407 4689 86.7%May-01 4275 3613 84.51% Jan-07 5657 4822 85.2% Sep-12 5329 4625 86.8%June-01 4357 3764 86.39% Feb-07 5660 4947 87.4% Oct-12 5351 4588 85.7%July-01 4863 3900 80.20% Mar-07 5846 4976 85.1% Nov-12 5065 4522 89.3%Aug-01 5063 3970 78.41% Apr-07 5870 5004 85.2% Dec-12 5001 4523 90.4%Sep-01 5221 4186 80.18% May-07 5960 5159 86.6% Jan-13 5001 4553 91.0%Oct-01 5134 4171 81.24% Jun-07 6032 5251 87.1% Feb-13 5001 4487 89.7%Nov-01 5316 4179 78.61% Jul-07 6200 5395 87.0% Mar-13 5001 4488 89.7%Dec-01 5466 4171 76.31% Aug-07 6258 5466 87.3% Apr-13 5001 4426 88.5%Jan-02 5521 4457 80.73% Sep-07 6258 5496 87.8% May-13 4940 4374 88.5%Feb-02 5447 4217 77.42% Oct-07 6332 5546 87.6% Jun-13 4845 4305 88.9%Mar-02 5379 4155 77.24% Nov-07 6585 5651 85.8% Jul-13 4845 4210 86.9%Apr-02 5171 4218 81.57% Dec-07 6584 5783 87.8% Aug-13 4845 4183 86.3%May-02 5143 4053 78.81% Jan-08 6585 5813 88.3% Sep-13 4820 4063 84.3%June-02 5159 3887 75.34% Feb-08 6772 5902 87.2% Oct-13 4820 4081 84.7%July-02 5174 3814 73.71% Mar-08 6847 5964 87.1% Nov-13 4745 4037 85.1%Aug-02 5236 3866 73.83% Apr-08 6890 6087 88.3% Dec-13 4690 4063 86.6%Sept-02 5202 3880 74.59% May-08 6908 6214 90.0% Jan-14 4690 4061 86.6%Oct-02 5071 3877 76.45% Jun-08 6969 6181 88.7% Feb-14 4690 4072 86.8%Nov-02 5084 3844 75.61% Jul-08 7051 6187 87.7% Mar-14 4690 4049 86.3%Dec-02 5016 3808 75.92% Aug-08 7139 6233 87.3% Apr-14 4690 4048 86.3%Jan-03 4941 3884 78.61% Sep-08 7134 6158 86.3% May-14 4740 4073 85.9%Feb-03 4978 3915 78.65% Oct-08 7132 6189 86.8% Jun-14 4734 4002 84.5%Mar-03 5065 3917 77.33% Nov-08 7127 6233 87.5% Jul-14 4734 3985 84.2%Apr-03 5185 3958 76.34% Dec-08 7131 6250 87.6% Aug-14 4685 4025 85.9%May-03 5579 4185 75.01% Jan-09 7127 6284 88.2% Sep-14 4685 4010 85.6%June-03 5557 4496 80.91% Feb-09 7127 6295 88.3% Oct-14 4685 3994 85.3%July-03 5796 4697 81.04% Mar-09 7127 6254 87.8% Nov-14 4685 4041 86.3%Aug-03 5909 4765 80.64% Apr-09 7127 6279 88.1% Dec-14 4670 4046 86.6%Sep-03 5855 5109 87.26% May-09 7127 6256 87.8% Jan-15 4675 4022 86.0%Oct-03 6054 5306 87.64% Jun-09 7129 6206 87.1% Feb-15 4775 4067 85.2%Nov-03 6099 5403 88.59% Jul-09 7094 6203 87.4% Mar-15 4791 4047 84.5%Dec-03 6239 5501 88.17% Aug-09 7003 6236 89.0% Apr-15 4791 4010 83.7%Jan-04 6305 5694 90.31% Sep-09 6908 6074 87.9% May-15 4788 4120 86.0%Feb-04 6308 5695 90.28% Oct-09 6908 6074 87.9% Jun-15 4788 4168 87.1%Mar-04 6265 5663 90.39% Nov-09 6908 6074 87.9% Jul-15 4929 4268 86.6%Apr-04 6271 5651 90.1% Dec-09 6908 6074 87.9% Aug-15 4991 4396 88.1%May-04 6259 5716 91.32% Jan-10 6908 5907 85.5% Sep-15 4991 4467 89.5%Jun-04 6337 5765 91.0% Feb-10 6908 5870 85.0% Oct-15 4991 4345 87.06%Jul-04 6482 5598 86.4% Mar-10 6908 5870 85.0% Nov-15 4996 4341 86.89%Aug-04 6303 5430 86.1% Apr-10 6908 5870 85.0% Dec-15 5011 4392 87.65%Sep-04 6422 5574 86.8% May-10 6622 5820 87.9% Jan-16 5036 4288 85.15%Oct-04 6376 5717 89.7% Jun-10 6429 5860 91.1% Feb-16 5036 4172 82.84%Nov-04 6445 5738 89.0% Jul-10 6423 5836 90.9% Mar-16 5036 4187 83.14%Dec-04 6658 5971 89.7% Aug-10 6423 5839 90.9% Apr-16 5023 4090 81.43%Jan-05 6675 6113 91.6% Sep-10 6423 5842 91.0% May-16 5011 3992 79.66%Feb-05 6759 6233 92.2% Oct-10 6395 5779 90.4% Jun-16 5011 3998 79.78%Mar-05 7151 6589 92.1% Nov-10 6395 5654 88.4% Jul-16 4985 3929 78.82%Apr-05 7202 6651 92.3% Dec-10 6395 5615 87.8% Aug-16 4985 3906 78.36%May-05 7274 6603 90.8% Jan-11 6345 5579 87.9% Sep-16 4918 3864 78.57%Jun-05 7249 6406 88.4% Feb-11 6345 5543 87.4% Oct-16 4825 3940 81.66%Jul-05 7197 5884 81.8% Mar-11 6345 5519 87.0% Nov-16 4825 3919 81.22%Aug-05 7047 5299 75.2% Apr-11 6345 5495 86.6% Dec-16 4782 4114 86.03%Sep-05 6677 4834 72.4% May-11 6230 5410 86.8% Jan-17 4692 4126 87.94%Oct-05 6679 4531 67.8% Jun-11 6180 5338 86.4%Nov-05 6439 4043 62.8% Jul-11 5910 5305 89.8%
1) The above figures represent a 'snapshot' of data on the evening of last Sunday of each month. Occupancy figures can vary throughout the year because of the interaction of residents leaving (either through normal means or because of special schemes such as the Irish Born Child 2005 Scheme), residents arriving, temporary closures, medical restrictions on arrivals arising from outbreaks of chickenpox, etc.2) It is desired that RIA maintain a 10% “cushion” between maximum capacity and actual occupancy, as a contingency to cope with unexpected spikes in numbers of asylum seekers coming in to the accommodation system, to allow for temporary or permanent closures of individual centres, and to help RIA to react to medical emergencies causing restrictions to some of our capacity.
Capacity v Occupancy Table from April 2000 to Date ( Accommodation Centres Only )
RIA Monthly Report January 2017 11
6358
6360
6352
6354
6249
6107
5975
5888
5752
5674
5467
5423
5293
5179
5071
4989
4914
4841
4826
4707
4571
4483
4342
4360
4332
4287
4324
4337
4310 4364 4435
4376 45
66 4760 4811
4729
4705
4696
4587
4521
4461
4371
4282
4284
4208
4203
4209 4272
4279 44
254427
0
1000
2000
3000
4000
5000
6000
7000
Feb-10
Apr-10
Jun-10
Aug-10
Oct-10
Dec-10
Feb-11
Apr-11
Jun-11
Aug-11
Oct-11
Dec-11
Feb-12
Apr-12
Jun-12
Aug-12
Oct-12
Dec-12
Feb-13
Apr-13
Jun-13
Aug-13
Oct-13
Dec-13
Feb-14
Apr-14
Jun-14
Aug-14
Oct-14
Dec-14
Feb-15
Apr-15
Jun-15
Aug-15
Oct-15
Dec-15
Feb-16
Apr-16
Jun-16
Aug-16
Oct-16
Dec-16
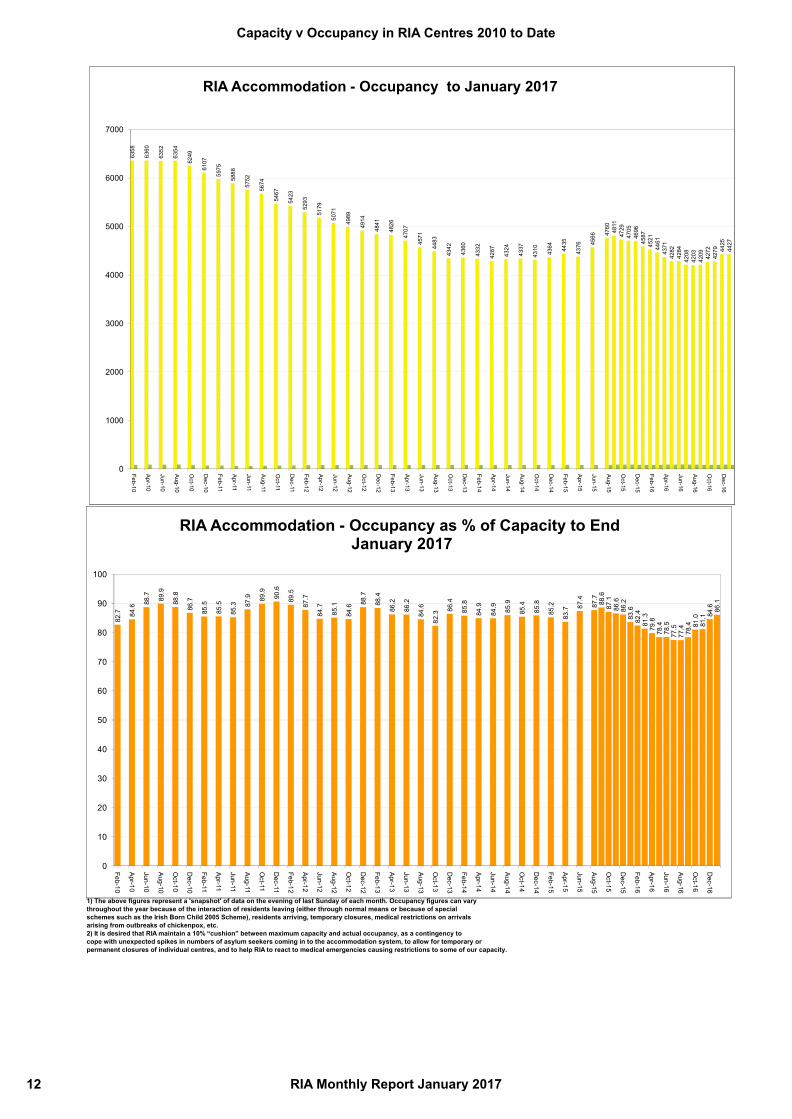
RIA Accommodation - Occupancy to January 2017
1) The above figures represent a 'snapshot' of data on the evening of last Sunday of each month. Occupancy figures can vary throughout the year because of the interaction of residents leaving (either through normal means or because of special schemes such as the Irish Born Child 2005 Scheme), residents arriving, temporary closures, medical restrictions on arrivals arising from outbreaks of chickenpox, etc.2) It is desired that RIA maintain a 10% “cushion” between maximum capacity and actual occupancy, as a contingency to cope with unexpected spikes in numbers of asylum seekers coming in to the accommodation system, to allow for temporary or permanent closures of individual centres, and to help RIA to react to medical emergencies causing restrictions to some of our capacity.
82.7 84.6
88.7 89.9
88.8
86.7
85.5
85.5
85.3 87.9 89.9
90.6
89.5
87.7
84.7
85.1
84.6
88.7
88.4
86.2
86.2
84.6
82.3
86.4
85.8
84.9
84.9 85.9
85.4
85.8
85.2
83.7 87
.4
87.7
88.6
87.1
86.6
86.2
83.6
82.4
81.3
79.8
78.4
78.5
77.5
77.4 78.4 81.0
81.1 84
.6 86.1
0
10
20
30
40
50
60
70
80
90
100
Feb-10
Apr-10
Jun-10
Aug-10
Oct-10
Dec-10
Feb-11
Apr-11
Jun-11
Aug-11
Oct-11
Dec-11
Feb-12
Apr-12
Jun-12
Aug-12
Oct-12
Dec-12
Feb-13
Apr-13
Jun-13
Aug-13
Oct-13
Dec-13
Feb-14
Apr-14
Jun-14
Aug-14
Oct-14
Dec-14
Feb-15
Apr-15
Jun-15
Aug-15
Oct-15
Dec-15
Feb-16
Apr-16
Jun-16
Aug-16
Oct-16
Dec-16
RIA Accommodation - Occupancy as % of Capacity to EndJanuary 2017
Capacity v Occupancy in RIA Centres 2010 to Date
12 RIA Monthly Report January 2017
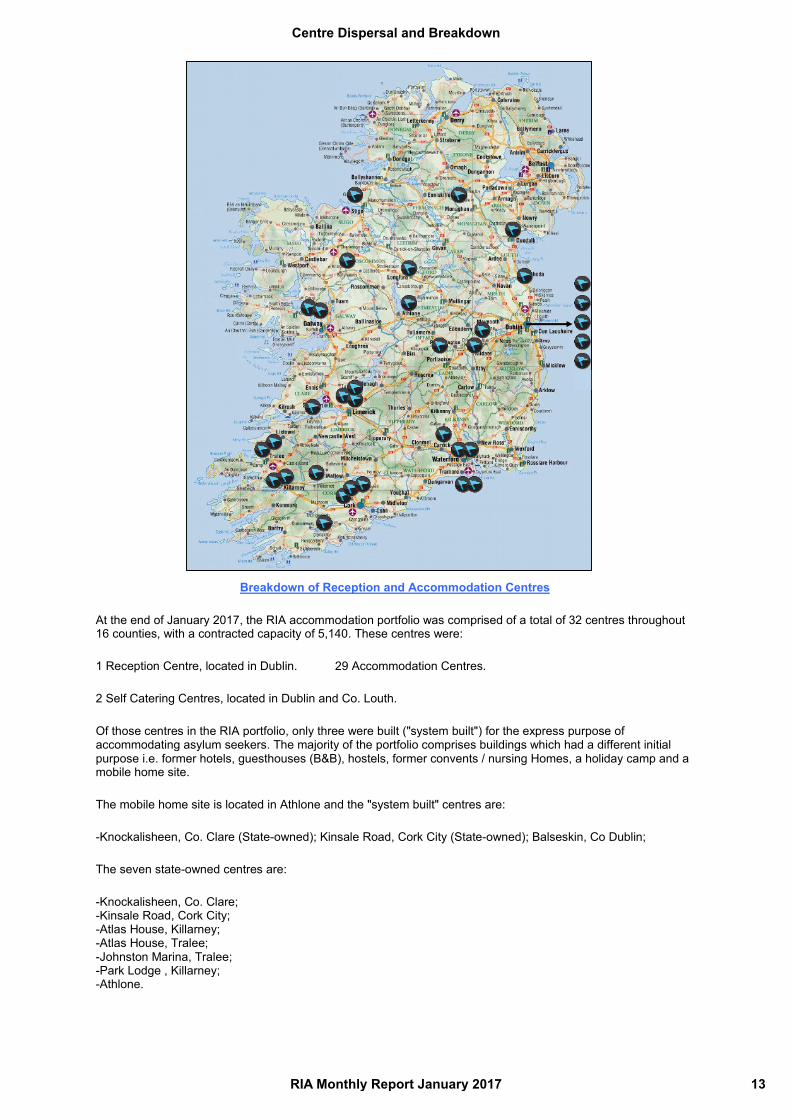
Breakdown of Reception and Accommodation Centres
At the end of January 2017, the RIA accommodation portfolio was comprised of a total of 32 centres throughout 16 counties, with a contracted capacity of 5,140. These centres were:
1 Reception Centre, located in Dublin. 29 Accommodation Centres.
2 Self Catering Centres, located in Dublin and Co. Louth.
Of those centres in the RIA portfolio, only three were built ("system built") for the express purpose of accommodating asylum seekers. The majority of the portfolio comprises buildings which had a different initial purpose i.e. former hotels, guesthouses (B&B), hostels, former convents / nursing Homes, a holiday camp and a mobile home site.
The mobile home site is located in Athlone and the "system built" centres are:
-Knockalisheen, Co. Clare (State-owned); Kinsale Road, Cork City (State-owned); Balseskin, Co Dublin;
The seven state-owned centres are:
-Knockalisheen, Co. Clare; -Kinsale Road, Cork City; -Atlas House, Killarney; -Atlas House, Tralee; -Johnston Marina, Tralee; -Park Lodge , Killarney; -Athlone.
Centre Dispersal and Breakdown
RIA Monthly Report January 2017 13
COUNTY CENTRE ADDRESS
CURRENT CONTRACTED
CAPACITYCURRENT
OCCUPANCYCURRENT
VACANCIES
UNAVAILABLE DUE TO ILLNESS
OTHER UNAVAILABLE
RESIDENT TYPE ACC. TYPE
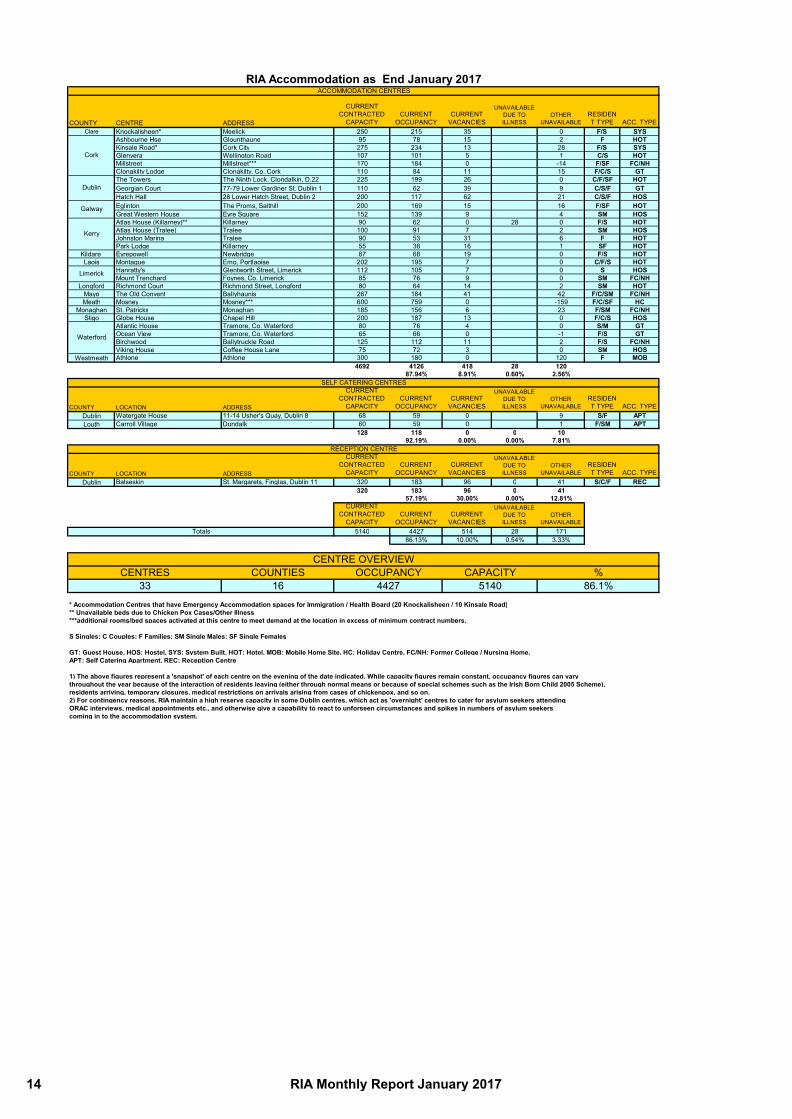
Clare Knockalisheen* Meelick 250 215 35 0 F/S SYSAshbourne Hse Glounthaune 95 78 15 2 F HOTKinsale Road* Cork City 275 234 13 28 F/S SYSGlenvera Wellington Road 107 101 5 1 C/S HOTMillstreet Millstreet*** 170 184 0 -14 F/SF FC/NHClonakilty Lodge Clonakilty, Co. Cork 110 84 11 15 F/C/S GTThe Towers The Ninth Lock, Clondalkin, D.22 225 199 26 0 C/F/SF HOTGeorgian Court 77-79 Lower Gardiner St. Dublin 1 110 62 39 9 C/S/F GTHatch Hall 28 Lower Hatch Street, Dublin 2 200 117 62 21 C/S/F HOSEglinton The Proms, Salthill 200 169 15 16 F/SF HOTGreat Western House Eyre Square 152 139 9 4 SM HOSAtlas House (Killarney)** Killarney 90 62 0 28 0 F/S HOTAtlas House (Tralee) Tralee 100 91 7 2 SM HOSJohnston Marina Tralee 90 53 31 6 F HOTPark Lodge Killarney 55 38 16 1 SF HOT
Kildare Eyrepowell Newbridge 87 68 19 0 F/S HOTLaois Montague Emo, Portlaoise 202 195 7 0 C/F/S HOT
Hanratty's Glentworth Street, Limerick 112 105 7 0 S HOSMount Trenchard Foynes, Co. Limerick 85 76 9 0 SM FC/NH
Longford Richmond Court Richmond Street, Longford 80 64 14 2 SM HOTMayo The Old Convent Ballyhaunis 267 184 41 42 F/C/SM FC/NHMeath Mosney Mosney*** 600 759 0 -159 F/C/SF HC
Monaghan St. Patricks Monaghan 185 156 6 23 F/SM FC/NHSligo Globe House Chapel Hill 200 187 13 0 F/C/S HOS
Atlantic House Tramore, Co. Waterford 80 76 4 0 S/M GTOcean View Tramore, Co. Waterford 65 66 0 -1 F/S GTBirchwood Ballytruckle Road 125 112 11 2 F/S FC/NHViking House Coffee House Lane 75 72 3 0 SM HOS
Westmeath Athlone Athlone 300 180 0 120 F MOB4692 4126 418 28 120
87.94% 8.91% 0.60% 2.56%
COUNTY LOCATION ADDRESS
CURRENT CONTRACTED
CAPACITYCURRENT
OCCUPANCYCURRENT
VACANCIES
UNAVAILABLE DUE TO ILLNESS
OTHER UNAVAILABLE
RESIDENT TYPE ACC. TYPE
Dublin Watergate House 11-14 Usher's Quay, Dublin 8 68 59 0 9 S/F APTLouth Carroll Village Dundalk 60 59 0 1 F/SM APT
128 118 0 0 1092.19% 0.00% 0.00% 7.81%
COUNTY LOCATION ADDRESS
CURRENT CONTRACTED
CAPACITYCURRENT
OCCUPANCYCURRENT
VACANCIES
UNAVAILABLE DUE TO ILLNESS
OTHER UNAVAILABLE
RESIDENT TYPE ACC. TYPE
Dublin Balseskin St. Margarets, Finglas, Dublin 11 320 183 96 0 41 S/C/F REC320 183 96 0 41
57.19% 30.00% 0.00% 12.81%CURRENT
CONTRACTED CAPACITY
CURRENTOCCUPANCY
CURRENTVACANCIES
UNAVAILABLE DUE TO ILLNESS
OTHER UNAVAILABLE
5140 4427 514 28 17186.13% 10.00% 0.54% 3.33%
COUNTIES16
* Accommodation Centres that have Emergency Accommodation spaces for Immigration / Health Board (20 Knockalisheen / 10 Kinsale Road)** Unavailable beds due to Chicken Pox Cases/Other Illness***additional rooms/bed spaces activated at this centre to meet demand at the location in excess of minimum contract numbers.
S Singles; C Couples; F Families; SM Single Males; SF Single Females
GT: Guest House, HOS: Hostel, SYS: System Built, HOT: Hotel, MOB: Mobile Home Site, HC: Holiday Centre, FC/NH: Former College / Nursing Home, APT: Self Catering Apartment, REC: Reception Centre
1) The above figures represent a 'snapshot' of each centre on the evening of the date indicated. While capacity figures remain constant, occupancy figures can vary throughout the year because of the interaction of residents leaving (either through normal means or because of special schemes such as the Irish Born Child 2005 Scheme),residents arriving, temporary closures, medical restrictions on arrivals arising from cases of chickenpox, and so on. 2) For contingency reasons, RIA maintain a high reserve capacity in some Dublin centres, which act as 'overnight' centres to cater for asylum seekers attending ORAC interviews, medical appointments etc., and otherwise give a capability to react to unforseen circumstances and spikes in numbers of asylum seekers coming in to the accommodation system.
CENTRES OCCUPANCY CAPACITY %33 4427 5140 86.1%
Limerick
Waterford
SELF CATERING CENTRES
RECEPTION CENTRE
Totals
CENTRE OVERVIEW
RIA Accommodation as End January 2017ACCOMMODATION CENTRES
Cork
Dublin
Galway
Kerry
14 RIA Monthly Report January 2017
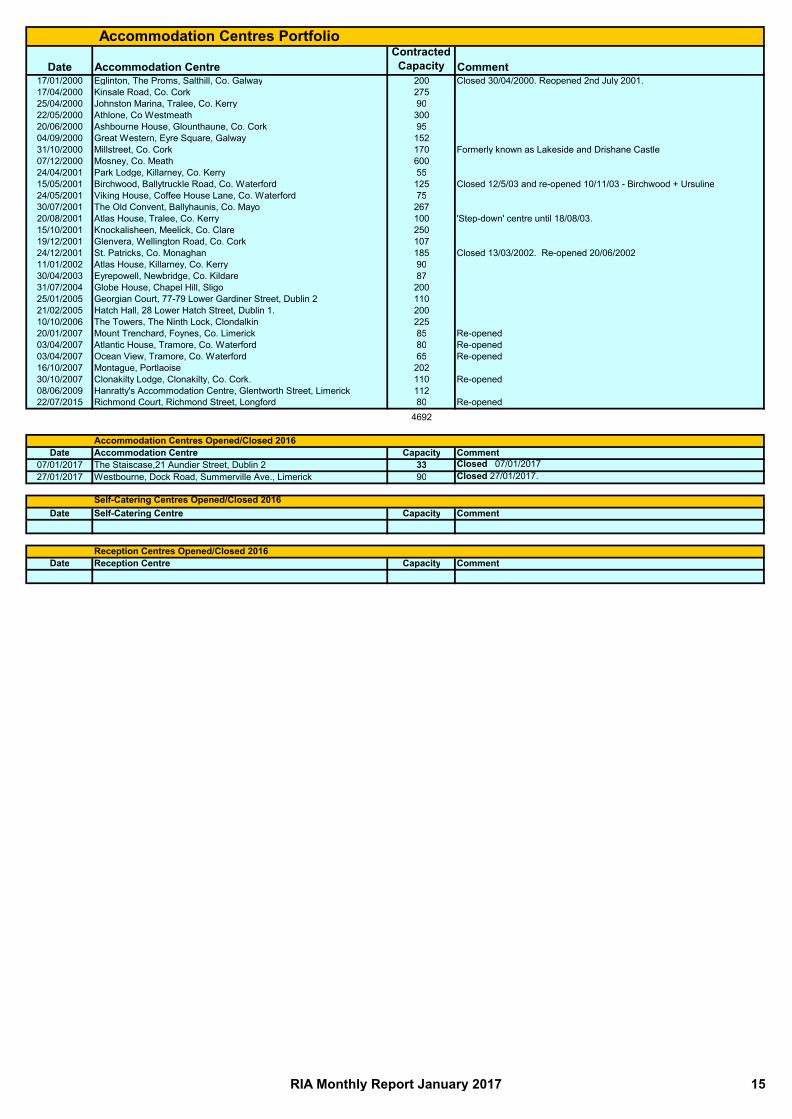
Accommodation Centres Portfolio
Date Accommodation CentreContracted
Capacity Comment17/01/2000 Eglinton, The Proms, Salthill, Co. Galway 200 Closed 30/04/2000. Reopened 2nd July 2001.17/04/2000 Kinsale Road, Co. Cork 27525/04/2000 Johnston Marina, Tralee, Co. Kerry 9022/05/2000 Athlone, Co Westmeath 30020/06/2000 Ashbourne House, Glounthaune, Co. Cork 9504/09/2000 Great Western, Eyre Square, Galway 15231/10/2000 Millstreet, Co. Cork 170 Formerly known as Lakeside and Drishane Castle07/12/2000 Mosney, Co. Meath 60024/04/2001 Park Lodge, Killarney, Co. Kerry 5515/05/2001 Birchwood, Ballytruckle Road, Co. Waterford 125 Closed 12/5/03 and re-opened 10/11/03 - Birchwood + Ursuline24/05/2001 Viking House, Coffee House Lane, Co. Waterford 7530/07/2001 The Old Convent, Ballyhaunis, Co. Mayo 26720/08/2001 Atlas House, Tralee, Co. Kerry 100 'Step-down' centre until 18/08/03. 15/10/2001 Knockalisheen, Meelick, Co. Clare 25019/12/2001 Glenvera, Wellington Road, Co. Cork 10724/12/2001 St. Patricks, Co. Monaghan 185 Closed 13/03/2002. Re-opened 20/06/200211/01/2002 Atlas House, Killarney, Co. Kerry 9030/04/2003 Eyrepowell, Newbridge, Co. Kildare 8731/07/2004 Globe House, Chapel Hill, Sligo 20025/01/2005 Georgian Court, 77-79 Lower Gardiner Street, Dublin 2 11021/02/2005 Hatch Hall, 28 Lower Hatch Street, Dublin 1. 20010/10/2006 The Towers, The Ninth Lock, Clondalkin 22520/01/2007 Mount Trenchard, Foynes, Co. Limerick 85 Re-opened03/04/2007 Atlantic House, Tramore, Co. Waterford 80 Re-opened03/04/2007 Ocean View, Tramore, Co. Waterford 65 Re-opened16/10/2007 Montague, Portlaoise 20230/10/2007 Clonakilty Lodge, Clonakilty, Co. Cork. 110 Re-opened08/06/2009 Hanratty's Accommodation Centre, Glentworth Street, Limerick 11222/07/2015 Richmond Court, Richmond Street, Longford 80 Re-opened
4692
Accommodation Centres Opened/Closed 2016Date Accommodation Centre Capacity Comment
07/01/2017 The Staiscase,21 Aundier Street, Dublin 2 33 Closed 07/01/201727/01/2017 Westbourne, Dock Road, Summerville Ave., Limerick 90 Closed 27/01/2017.
Self-Catering Centres Opened/Closed 2016Date Self-Catering Centre Capacity Comment
Reception Centres Opened/Closed 2016Date Reception Centre Capacity Comment
RIA Monthly Report January 2017 15
The above figures refer to the Number of individuals in RIA accommodation if a person has more
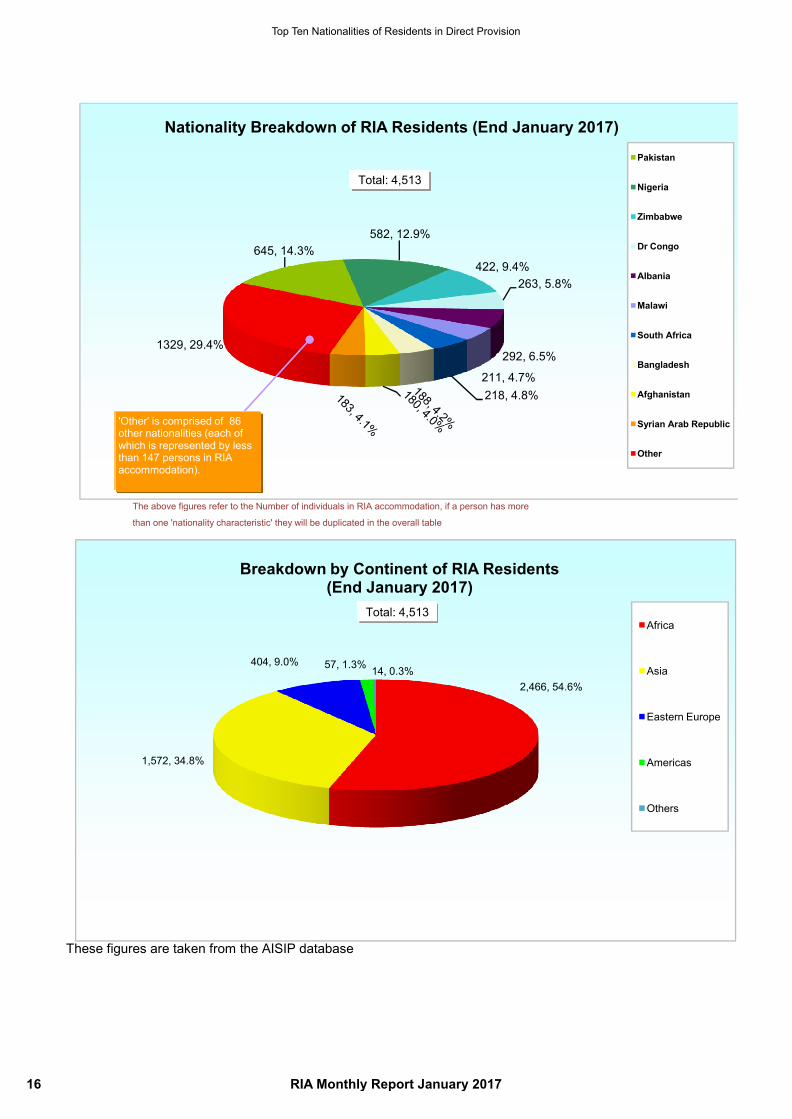
645, 14.3%582, 12.9%
422, 9.4%263, 5.8%
292, 6.5%
211, 4.7%218, 4.8%
1329, 29.4%
Nationality Breakdown of RIA Residents (End January 2017)
Pakistan
Nigeria
Zimbabwe
Dr Congo
Albania
Malawi
South Africa
Bangladesh
Afghanistan
Syrian Arab Republic
Other
Total: 4,513
'Other' is comprised of 86 other nationalities (each of which is represented by less than 147 persons in RIA accommodation).
The above figures refer to the Number of individuals in RIA accommodation, if a person has more
than one 'nationality characteristic' they will be duplicated in the overall table
These figures are taken from the AISIP database
2,466, 54.6%
1,572, 34.8%
404, 9.0% 57, 1.3% 14, 0.3%
Breakdown by Continent of RIA Residents (End January 2017)
Africa
Asia
Eastern Europe
Americas
Others
Total: 4,513
Top Ten Nationalities of Residents in Direct Provision
16 RIA Monthly Report January 2017
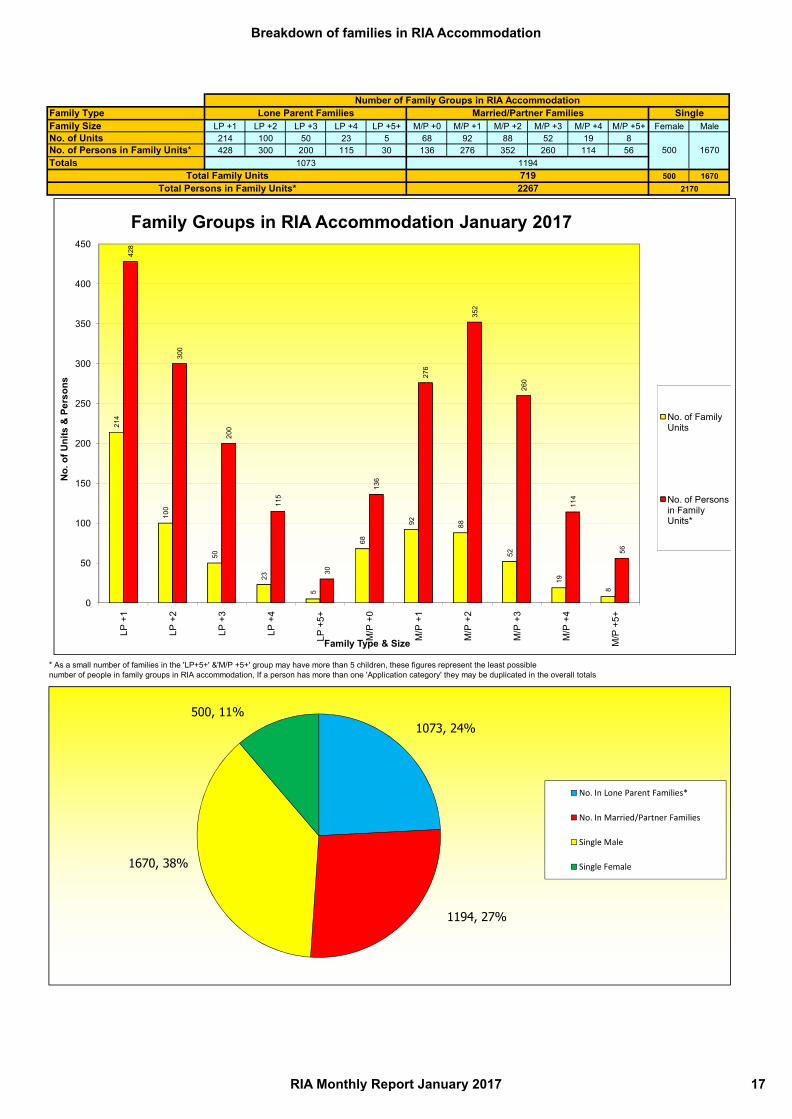
Family TypeFamily Size LP +1 LP +2 LP +3 LP +4 LP +5+ M/P +0 M/P +1 M/P +2 M/P +3 M/P +4 M/P +5+ Female MaleNo. of Units 214 100 50 23 5 68 92 88 52 19 8No. of Persons in Family Units* 428 300 200 115 30 136 276 352 260 114 56Totals
500 1670
SingleNumber of Family Groups in RIA Accommodation
Total Family Units 719
Lone Parent Families Married/Partner Families
1194500 1670
1073
Total Persons in Family Units* 2267 2170
214
428
300
200
115
136
276
352
260
114
150
200
250
300
350
400
450
No.
of U
nits
& P
erso
ns
Family Groups in RIA Accommodation January 2017
No. of Family Units
No. of Persons
* As a small number of families in the 'LP+5+' &'M/P +5+' group may have more than 5 children, these figures represent the least possible number of people in family groups in RIA accommodation, If a person has more than one 'Application category' they may be duplicated in the overall totals
100
50
23
5
68
92 88
52
19
8
1
30
1
56
0
50
100
LP +
1
LP +
2
LP +
3
LP +
4
LP +
5+
M/P
+0
M/P
+1
M/P
+2
M/P
+3
M/P
+4
M/P
+5+
Family Type & Size
in Family Units*
1073, 24%
1194, 27%
1670, 38%
500, 11%
No. In Lone Parent Families*
No. In Married/Partner Families
Single Male
Single Female
Breakdown of families in RIA Accommodation
RIA Monthly Report January 2017 17
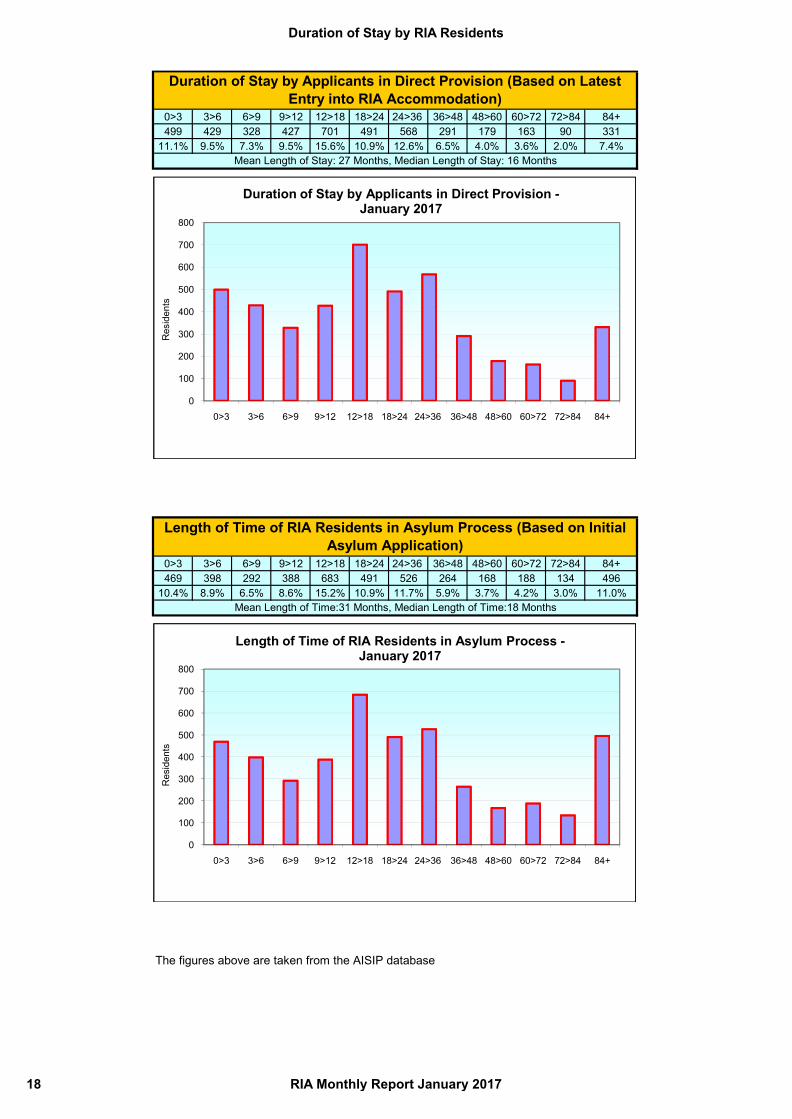
0>3 3>6 6>9 9>12 12>18 18>24 24>36 36>48 48>60 60>72 72>84 84+499 429 328 427 701 491 568 291 179 163 90 331
11.1% 9.5% 7.3% 9.5% 15.6% 10.9% 12.6% 6.5% 4.0% 3.6% 2.0% 7.4%Mean Length of Stay: 27 Months, Median Length of Stay: 16 Months
Duration of Stay by Applicants in Direct Provision (Based on Latest Entry into RIA Accommodation)
0
100
200
300
400
500
600
700
800
0>3 3>6 6>9 9>12 12>18 18>24 24>36 36>48 48>60 60>72 72>84 84+
Res
iden
ts
Duration of Stay by Applicants in Direct Provision -January 2017
0>3 3>6 6>9 9>12 12>18 18>24 24>36 36>48 48>60 60>72 72>84 84+469 398 292 388 683 491 526 264 168 188 134 496
10.4% 8.9% 6.5% 8.6% 15.2% 10.9% 11.7% 5.9% 3.7% 4.2% 3.0% 11.0%
The figures above are taken from the AISIP database
Mean Length of Time:31 Months, Median Length of Time:18 Months
Length of Time of RIA Residents in Asylum Process (Based on Initial Asylum Application)
0
100
200
300
400
500
600
700
800
0>3 3>6 6>9 9>12 12>18 18>24 24>36 36>48 48>60 60>72 72>84 84+
Res
iden
ts
Length of Time of RIA Residents in Asylum Process -January 2017
Duration of Stay by RIA Residents
18 RIA Monthly Report January 2017
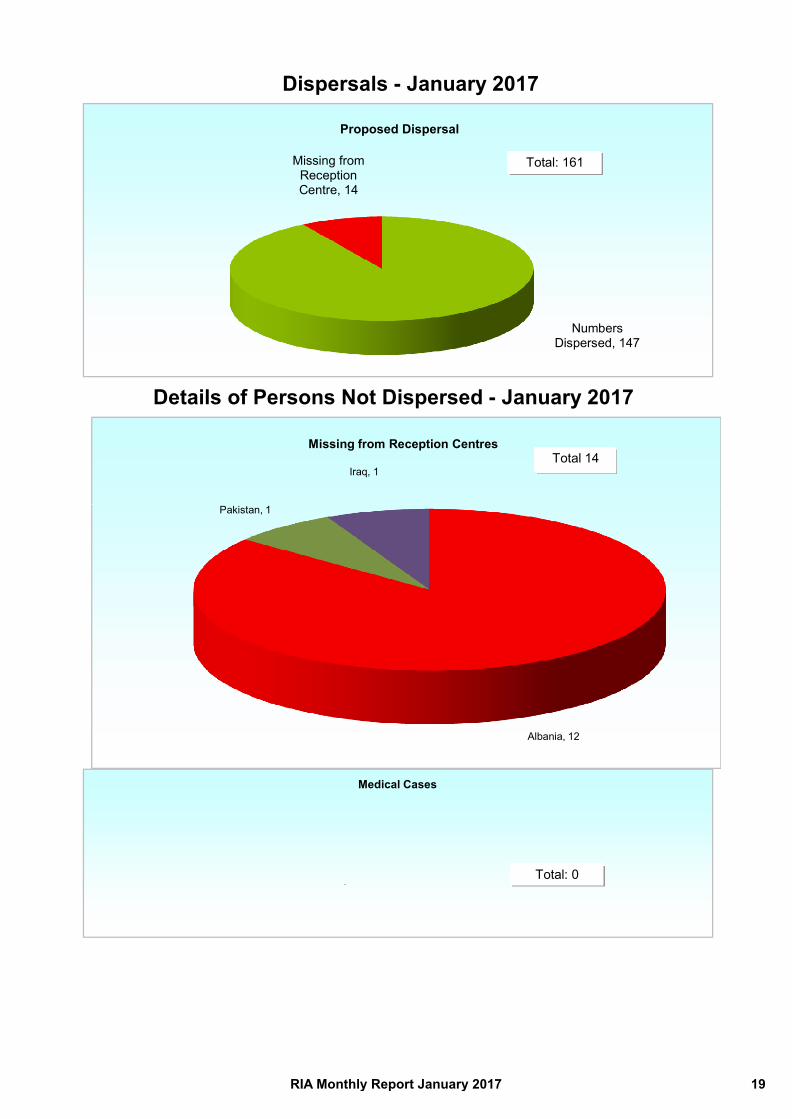
Dispersals - January 2017
Details of Persons Not Dispersed - January 2017
Numbers Dispersed, 147
Missing from Reception Centre, 14
Proposed Dispersal
Iraq, 1
Missing from Reception CentresTotal 14
Total: 161
Medical Cases
2
Albania, 12
Pakistan, 1
Total: 0
RIA Monthly Report January 2017 19
Note on Source of Statistics in this Report
The statistics with regards to numbers and demographics of those in RIA accommodation in this report are primarily drawn from two sources. The first source is from centre weekly returns, based on a ‘snapshot’ of occupancy each Sunday evening. These are the most accurate way we have of gauging the numbers in our centres, as well as vacancies available to us. Many of the statistics in this report are based on those returns, such as the ‘Profile of RIA Accommodation’ (p.13), ‘RIA Residents by County etc.’(p.9-10), Occupancy & Capacity in RIA Accommodation’ (p.12). In other cases, in order to get a demographic breakdown of RIA residents, statistics are produced by RIA’s database, AISIP. These give us, for example, the breakdown of RIA residents by family status (p.17), accommodation status (p.5), nationality (p.16), age (p.6) and duration of stay (p.18). As a matter of course, there is usually a slight discrepancy between the numbers sourced by both methods, as the daily numbers “on the ground” in centres, as per the centre returns, has to be processed by RIA staff and subsequently reflected “live on system” on AISIP. The statistics given in this report in relation to asylum applications are sourced from the International Protection Office (IPO ). Due to the implementation and roll out of the International Protection Office the Statistics on Cases Processed to Completion will not be included in the monthly report until further notice.
PRODUCED BY STATISTICS UNIT, RECEPTION & INTEGRATION AGENCY
20 RIA Monthly Report January 2017
AN ROINN DLÍ agus CIRT agus COMHIONANNAIS
DEPARTMENT OF JUSTICE and EQUALITY
ÁISINEACHT FHÁILTE agus COMHTHÁITE RECEPTION and INTEGRATION AGENCY

![RIA Monthly Report 12 December-2016 Monthly Report 12 December-2016.pdf/File… · Cases Processed to Completion (ORAC) ... Details of Return Flights Availed of by Citi]ens of the](https://img.pdfslide.us/doc/110x75/5fadbf6a4de2b5244b5c8269/ria-monthly-report-12-december-monthly-report-12-december-2016pdffile-cases.jpg)