Embed Size (px)
Citation preview
RI Educator Evaluation Systems
Improving Teaching and Learning
Year Two Report │ October 2014
Dear Friends of Education,
All Rhode Islanders should be proud of the commitment we have made, as a state, to ensuring that we
have effective teachers in every classroom and effective leaders in every Rhode Island school. As
educators, we know that the effectiveness of the classroom teacher is the single most important school-
based factor in improving student achievement. We also know that teachers do their work best when
they have sufficient resources, support, leadership, and autonomy to advance student learning.
In Rhode Island, our system of educator evaluation – including the evaluation of teachers, building
administrators, and, starting this year, support professionals – is a cornerstone in our work toward
ensuring educator excellence. We have now completed two full school years of implementing educator
evaluations statewide, and, as this report (Year Two Report: Rhode Island Educator Evaluation Systems)
shows, we are making progress toward building a culture of continuous reflection and improvement. In
our mid-year survey, a large majority of teachers and building administrators reported an increased
understanding of and more confidence in key elements of the evaluation process – student learning
objectives, in particular.
All who read this report will no doubt observe that the vast majority of teachers (98 percent) and
building administrators (99 percent) received ratings of effective or highly effective. I know that we have
many excellent teachers and school leaders across Rhode Island, but we should all keep in mind that the
purpose of educator evaluations is not simply to gain a high rating – and the purpose is certainly not to
compare one school against others. The purpose, as this report notes, is to “encourage student-focused
conversations that can help educators make improvements in real time.” This purpose will best be
realized through honest and constructive feedback.
Educator evaluations should be neither the beginning nor the end of this process. Those who receive a
rating of highly effective should continue to examine all facets of their teaching, so as to continue to
improve and to help others do so as well. Similarly, in years when teachers are not receiving formal
evaluations – as will be the case for many Rhode Island teachers during the current school year – the
informal observations and conversations about improving instruction and advancing student
achievement should be vigorous, thoughtful, and on-going.
Along with my team at the R.I. Department of Education, we are eager to help you keep these
conversations alive in schools and classrooms across Rhode Island. Working together, we can make this
another great year for teaching and learning!
Best,
Deborah A. Gist, Commissioner
2
Educator Evaluation Overview 2013-2014 During the 2013-14 school year, Rhode Island educators were engaged in the second year of full
implementation of educator evaluations under teacher and building administrator evaluation systems
approved by the Rhode Island Department of Education (RIDE). The statewide educator evaluation
effort is based on the belief that implementing fair, accurate, and meaningful educator evaluations will
help improve teaching and learning. Meaningful evaluations are those in which educators are provided
with prioritized, specific, and actionable feedback about their performance and receive support to
continuously improve their effectiveness, regardless of the number of years they have been teaching.
All teacher and building administrator evaluation systems implemented across districts and charter
public schools in the state are designed to meet the common expectations for quality established in the
Rhode Island Educator Evaluation System Standards, adopted by the Rhode Island Board of Regents for
Elementary and Secondary Education in spring 2009. The five years since the adoption of those
standards have seen tremendous effort and accomplishment by Rhode Island educators in designing,
developing, testing, implementing, and now applying the results from educator evaluation systems
designed to support and improve teaching and learning for all educators and students in Rhode Island.
The second year of full implementation brought refinements to all Rhode Island approved models , the
most notable being the introduction of a Differentiated Evaluation Process for Teachers to provide
schools and districts with greater flexibility for classroom observations, evaluation conferences, and
Professional Growth Plans. A second key refinement for 2013-14 provided flexibility for some special
education teachers to set a Student Outcome Objective (SOO) in place of one or more of their Student
Learning Objectives (SLOs). These refinements reflect that, with the second year of full implementation,
we are entering a phase in which teachers, building administrators, and district administrators are taking
ownership of their evaluation systems and their results, gaining a deeper understanding of those results,
and discovering relationships between the information produced by evaluation systems, instructional
policies and practices, and student performance. Two years of implementation, however, marks just the
beginning of a lengthy process that will produce refinements to those instructional policies and practices
as well as refinements to the evaluation systems as more is learned and understood about the
information needed to support the improvement of teaching and learning.
The final effectiveness ratings summarized in this report can do little to convey the breadth and depth of
information that is generated throughout the year to support teachers’ and building administrators’
work toward improving teaching and learning. Insights shared in beginning, midyear, and end-of-year
conferences; feedback from classrooms observations; and information gained from the development,
implementation, monitoring, and scoring of Student Learning Objectives are all part of the ongoing
instructional process that contributes to continuing improvement over time. By establishing high
expectations, a common vocabulary around excellent teaching and school leadership, and a process for
collecting and sharing important information in a timely manner, we can encourage student-focused
conversations that can help educators make improvements in real time – not just at the end of the
school year.
3
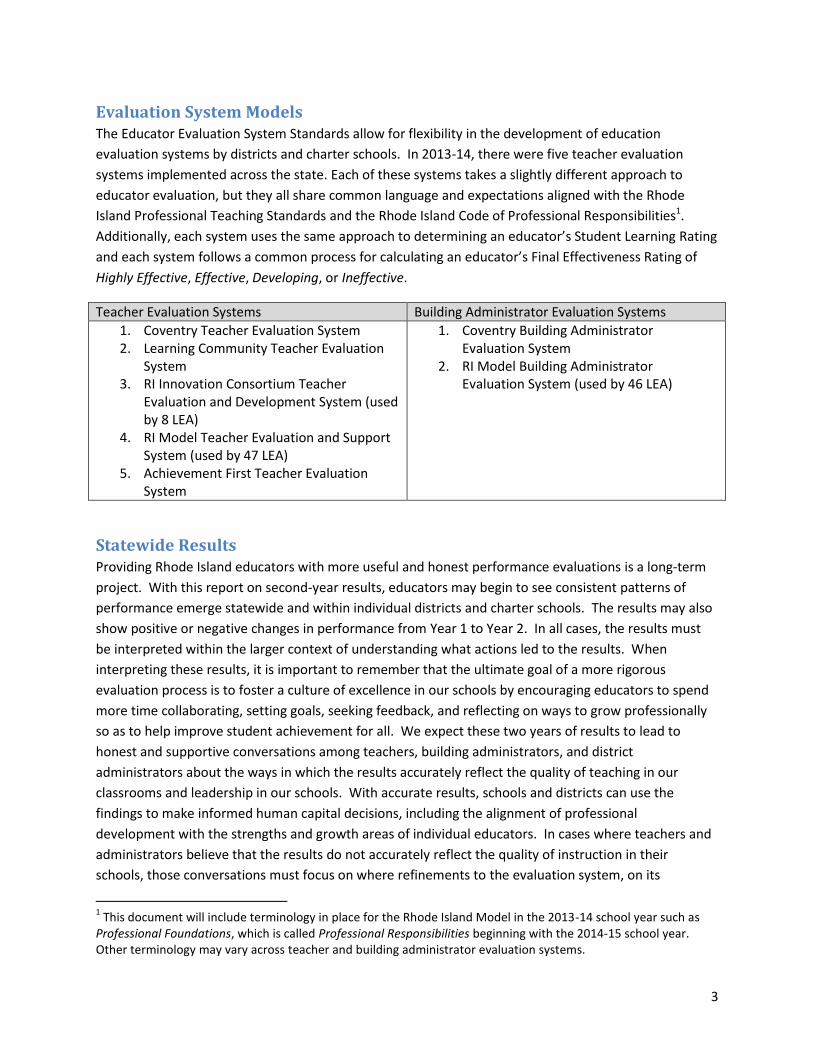
Evaluation System Models The Educator Evaluation System Standards allow for flexibility in the development of education
evaluation systems by districts and charter schools. In 2013-14, there were five teacher evaluation
systems implemented across the state. Each of these systems takes a slightly different approach to
educator evaluation, but they all share common language and expectations aligned with the Rhode
Island Professional Teaching Standards and the Rhode Island Code of Professional Responsibilities1.
Additionally, each system uses the same approach to determining an educator’s Student Learning Rating
and each system follows a common process for calculating an educator’s Final Effectiveness Rating of
Highly Effective, Effective, Developing, or Ineffective.
Teacher Evaluation Systems Building Administrator Evaluation Systems
1. Coventry Teacher Evaluation System 2. Learning Community Teacher Evaluation
System 3. RI Innovation Consortium Teacher
Evaluation and Development System (used by 8 LEA)
4. RI Model Teacher Evaluation and Support System (used by 47 LEA)
5. Achievement First Teacher Evaluation System
1. Coventry Building Administrator Evaluation System
2. RI Model Building Administrator Evaluation System (used by 46 LEA)
Statewide Results Providing Rhode Island educators with more useful and honest performance evaluations is a long-term
project. With this report on second-year results, educators may begin to see consistent patterns of
performance emerge statewide and within individual districts and charter schools. The results may also
show positive or negative changes in performance from Year 1 to Year 2. In all cases, the results must
be interpreted within the larger context of understanding what actions led to the results. When
interpreting these results, it is important to remember that the ultimate goal of a more rigorous
evaluation process is to foster a culture of excellence in our schools by encouraging educators to spend
more time collaborating, setting goals, seeking feedback, and reflecting on ways to grow professionally
so as to help improve student achievement for all. We expect these two years of results to lead to
honest and supportive conversations among teachers, building administrators, and district
administrators about the ways in which the results accurately reflect the quality of teaching in our
classrooms and leadership in our schools. With accurate results, schools and districts can use the
findings to make informed human capital decisions, including the alignment of professional
development with the strengths and growth areas of individual educators. In cases where teachers and
administrators believe that the results do not accurately reflect the quality of instruction in their
schools, those conversations must focus on where refinements to the evaluation system, on its
1 This document will include terminology in place for the Rhode Island Model in the 2013-14 school year such as
Professional Foundations, which is called Professional Responsibilities beginning with the 2014-15 school year. Other terminology may vary across teacher and building administrator evaluation systems.
4
implementation, on instruction, or on policies are needed to produce better alignment between the
information provided by the district’s evaluation system and the quality of the school’s teaching and
leadership. At the core of all of those conversations must be the relationship among the evaluation
results, expectations of quality, and the goal of improved student learning and achievement.
Teacher Evaluation System Results
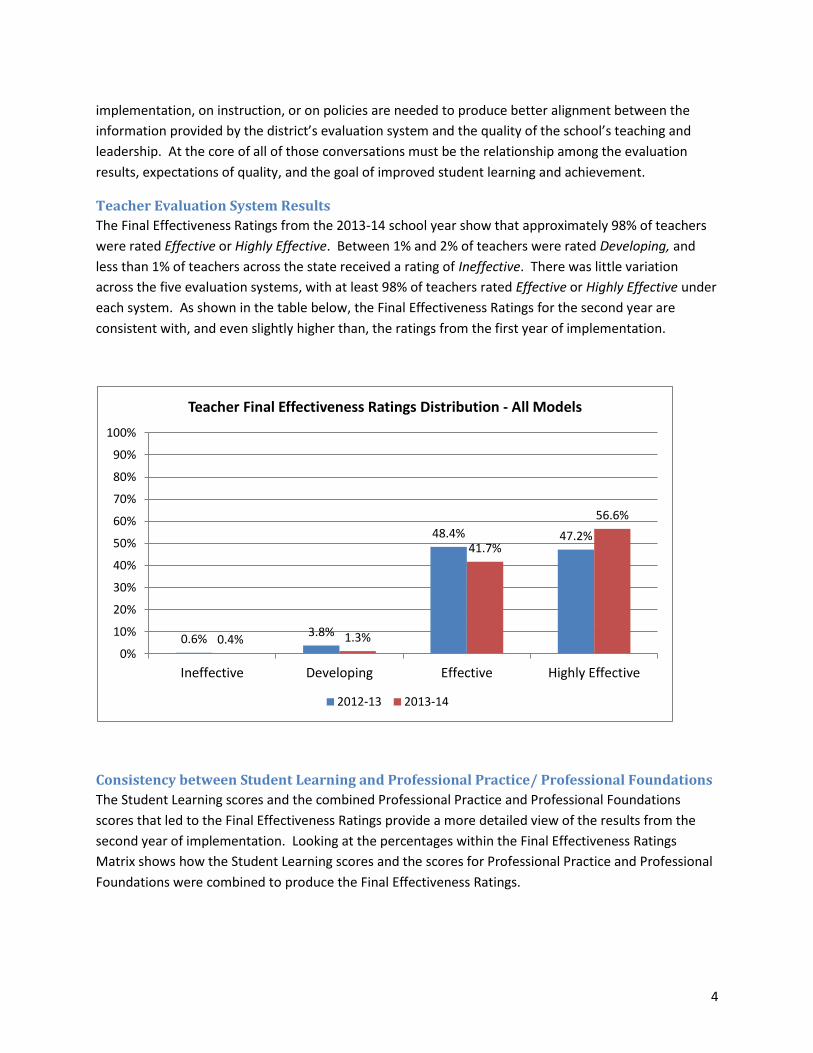
The Final Effectiveness Ratings from the 2013-14 school year show that approximately 98% of teachers
were rated Effective or Highly Effective. Between 1% and 2% of teachers were rated Developing, and
less than 1% of teachers across the state received a rating of Ineffective. There was little variation
across the five evaluation systems, with at least 98% of teachers rated Effective or Highly Effective under
each system. As shown in the table below, the Final Effectiveness Ratings for the second year are
consistent with, and even slightly higher than, the ratings from the first year of implementation.
Consistency between Student Learning and Professional Practice/ Professional Foundations
The Student Learning scores and the combined Professional Practice and Professional Foundations
scores that led to the Final Effectiveness Ratings provide a more detailed view of the results from the
second year of implementation. Looking at the percentages within the Final Effectiveness Ratings
Matrix shows how the Student Learning scores and the scores for Professional Practice and Professional
Foundations were combined to produce the Final Effectiveness Ratings.
0.6% 3.8%
48.4% 47.2%
0.4% 1.3%
41.7%
56.6%
0%
10%
20%
30%
40%
50%
60%
70%
80%
90%
100%
Ineffective Developing Effective Highly Effective
Teacher Final Effectiveness Ratings Distribution - All Models
2012-13 2013-14
5
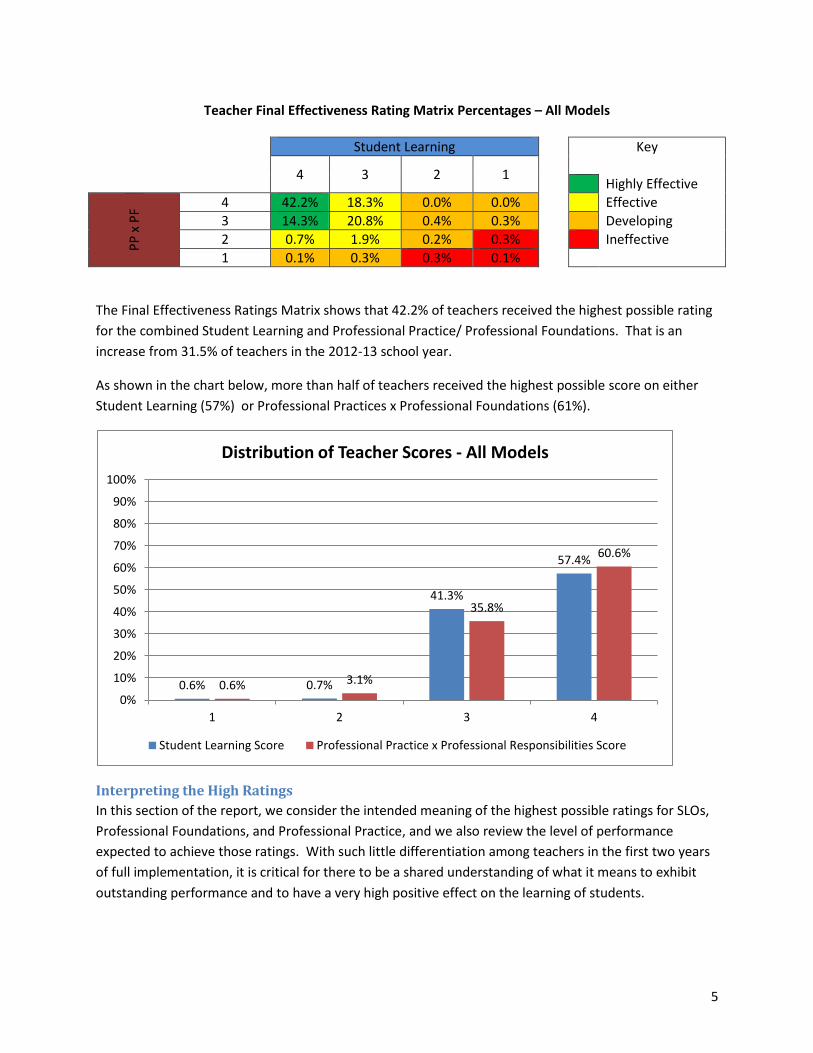
Teacher Final Effectiveness Rating Matrix Percentages – All Models
Student Learning Key
4 3 2 1
Highly Effective
PP
x P
F
4 42.2% 18.3% 0.0% 0.0% Effective
3 14.3% 20.8% 0.4% 0.3% Developing
2 0.7% 1.9% 0.2% 0.3% Ineffective
1 0.1% 0.3% 0.3% 0.1%
The Final Effectiveness Ratings Matrix shows that 42.2% of teachers received the highest possible rating
for the combined Student Learning and Professional Practice/ Professional Foundations. That is an
increase from 31.5% of teachers in the 2012-13 school year.
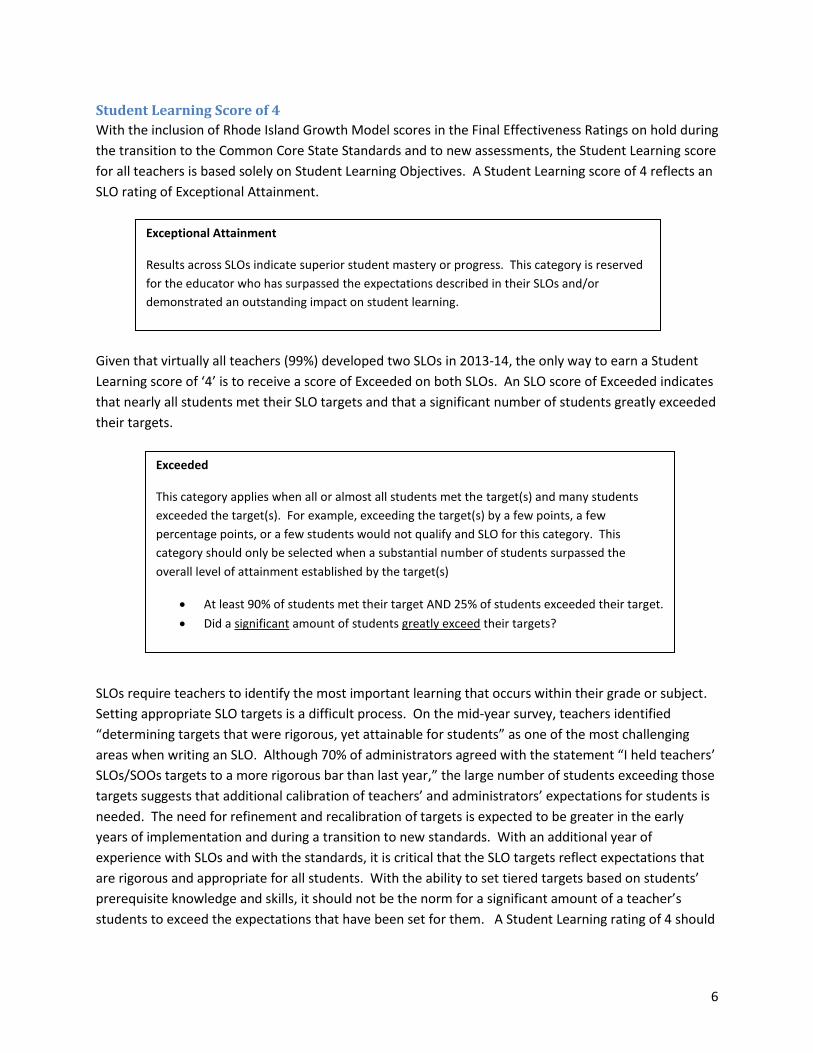
As shown in the chart below, more than half of teachers received the highest possible score on either
Student Learning (57%) or Professional Practices x Professional Foundations (61%).
Interpreting the High Ratings
In this section of the report, we consider the intended meaning of the highest possible ratings for SLOs,
Professional Foundations, and Professional Practice, and we also review the level of performance
expected to achieve those ratings. With such little differentiation among teachers in the first two years
of full implementation, it is critical for there to be a shared understanding of what it means to exhibit
outstanding performance and to have a very high positive effect on the learning of students.
0.6% 0.7%
41.3%
57.4%
0.6% 3.1%
35.8%
60.6%
0%
10%
20%
30%
40%
50%
60%
70%
80%
90%
100%
1 2 3 4
Distribution of Teacher Scores - All Models
Student Learning Score Professional Practice x Professional Responsibilities Score
6
Student Learning Score of 4
With the inclusion of Rhode Island Growth Model scores in the Final Effectiveness Ratings on hold during
the transition to the Common Core State Standards and to new assessments, the Student Learning score
for all teachers is based solely on Student Learning Objectives. A Student Learning score of 4 reflects an
SLO rating of Exceptional Attainment.
Given that virtually all teachers (99%) developed two SLOs in 2013-14, the only way to earn a Student
Learning score of ‘4’ is to receive a score of Exceeded on both SLOs. An SLO score of Exceeded indicates
that nearly all students met their SLO targets and that a significant number of students greatly exceeded
their targets.
SLOs require teachers to identify the most important learning that occurs within their grade or subject.
Setting appropriate SLO targets is a difficult process. On the mid-year survey, teachers identified
“determining targets that were rigorous, yet attainable for students” as one of the most challenging
areas when writing an SLO. Although 70% of administrators agreed with the statement “I held teachers’
SLOs/SOOs targets to a more rigorous bar than last year,” the large number of students exceeding those
targets suggests that additional calibration of teachers’ and administrators’ expectations for students is
needed. The need for refinement and recalibration of targets is expected to be greater in the early
years of implementation and during a transition to new standards. With an additional year of
experience with SLOs and with the standards, it is critical that the SLO targets reflect expectations that
are rigorous and appropriate for all students. With the ability to set tiered targets based on students’
prerequisite knowledge and skills, it should not be the norm for a significant amount of a teacher’s
students to exceed the expectations that have been set for them. A Student Learning rating of 4 should
Exceeded
This category applies when all or almost all students met the target(s) and many students
exceeded the target(s). For example, exceeding the target(s) by a few points, a few
percentage points, or a few students would not qualify and SLO for this category. This
category should only be selected when a substantial number of students surpassed the
overall level of attainment established by the target(s)
At least 90% of students met their target AND 25% of students exceeded their target.
Did a significant amount of students greatly exceed their targets?
Exceptional Attainment
Results across SLOs indicate superior student mastery or progress. This category is reserved
for the educator who has surpassed the expectations described in their SLOs and/or
demonstrated an outstanding impact on student learning.
7
be reserved for those cases of superior student mastery or progress and an outstanding effect on
student learning, as described above.
Professional Practice and Professional Responsibilities Score of 4
The process for determining a combined Professional Practice/Professional Foundations score varies
across the five evaluation models, but for all models a rating of 4 indicates an outstanding level of
performance. Under the RI Model implemented by the vast majority of LEAs, a teacher must earn the
highest possible rating of Exemplary in Professional Practice or the highest possible rating of Exceeds
Expectations in Professional Foundations in order to receive a combined Professional Practice/
Professional Foundations score of 4.
Professional Foundations
In the RI Model, teachers receive a score of 1 to 3 on each of the eight Professional Foundations
components. To earn a rating of Exceeds Expectations in Professional Foundations, a teacher must earn
a total of at least 21 of the possible 24 points. To earn at least 21 points, a teacher must receive the
highest possible score in at least 5 of the 8 elements evaluated across the domains of School
Responsibilities, Professionalism, and Planning. The rubrics for many of those elements use terms such
as “plays a leading role,” “goes above and beyond,” “pushes the school community,” “other educators
look to the teacher as a role model,” “[sets] ambitious Professional Growth Goals aligned with the
cutting edge of his/her discipline,” and “[takes] a leadership role.”
Professional Practice
During each classroom observation, teachers receive a score of 1 to 4 on each of the eight Professional
Practice components. Scores are averaged across observations to produce a score between 1 and 4 for
each component. To earn a rating of Exemplary in Professional Practice, a teacher must earn a total of at
least 29 of the 32 possible points. To earn 29 points, a teacher must receive an average rating greater
than 3 on at least 5 of the 8 components evaluated across the two domains of The Classroom
Environment and Instruction. The rubrics used by all approved models use terms at a level 4 such as:
“students assume responsibility for high quality…” and “teachers use a variety of questions to challenge
students cognitively, advance high level thinking and discourse and promote meta-cognition”.
Classrooms functioning at Level 4 are often described as student-led, where students take responsibility
for their learning and the teacher role is closer to facilitator.
A review of rubric language in all RI approved models demonstrates a common description of what
performance looks like at the highest level of a rubric. They all outline extraordinary practices by
teachers and student leadership in the learning process.
Summary
Administrators and teachers must be committed to setting high expectations for themselves. They show
this commitment by assigning the highest possible scores only to those demonstrations and examples of
performance that exhibit the best practices described in the rubrics and that will advance the goals of
improving student learning and the achievement of all students. The same principles that apply to
8
fostering improved student learning by setting rigorous yet attainable expectations for students must
also be applied to setting high expectations for educators.
Building Administrator Evaluation Results
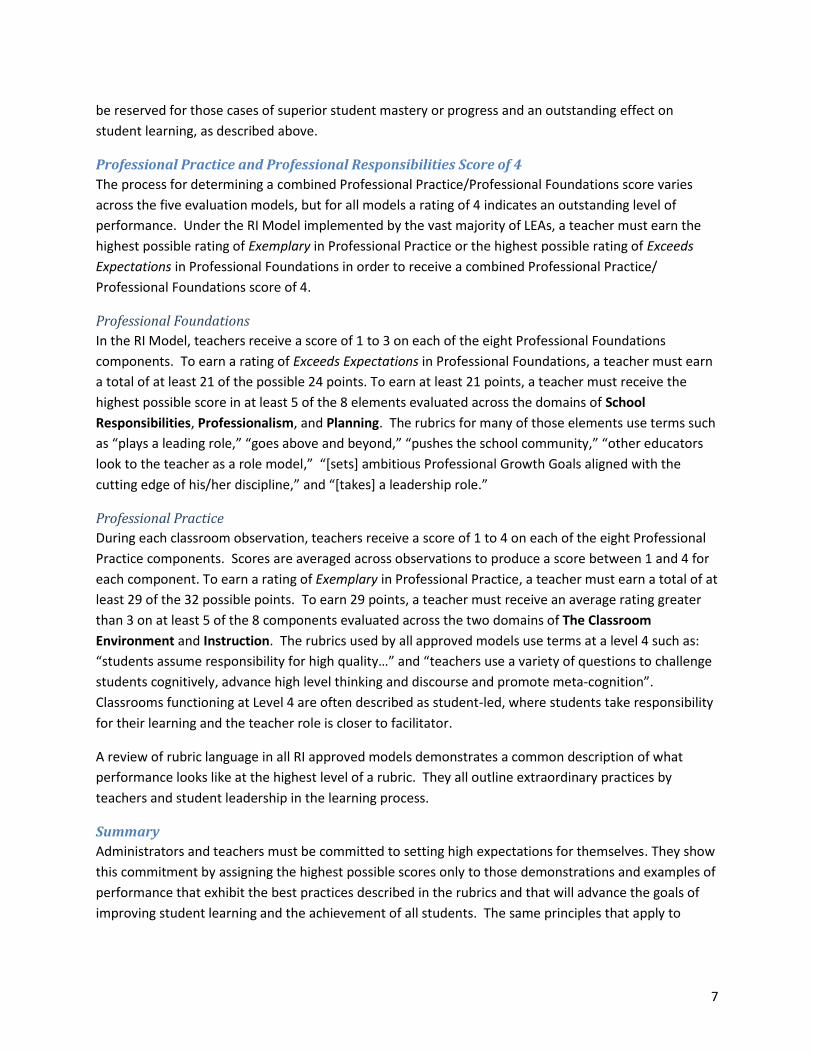
Similar to the teacher evaluation results, the 2013-14, Final Effectiveness Ratings for building
administrators show that 98.7% of building administrators received ratings in the top two categories of
Highly Effective (44.1%) and Effective (54.7%). The remaining 1.3% of administrators received a rating of
Developing. No building administrator received a Final Effectiveness Rating of Ineffective in 2013-14.
Overall, the 2013-14 building administrator ratings were consistent with the 2012-13 ratings, in which
93.4% of building administrators were rated Effective or Highly Effective.
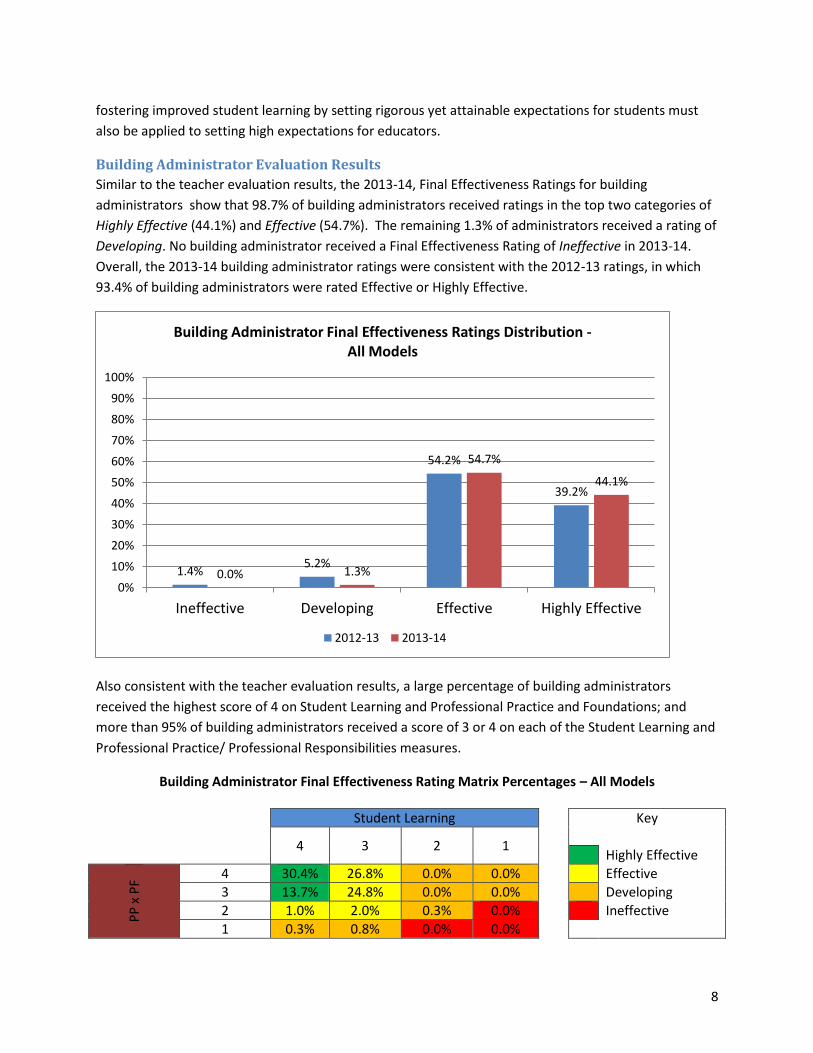
Also consistent with the teacher evaluation results, a large percentage of building administrators
received the highest score of 4 on Student Learning and Professional Practice and Foundations; and
more than 95% of building administrators received a score of 3 or 4 on each of the Student Learning and
Professional Practice/ Professional Responsibilities measures.
Building Administrator Final Effectiveness Rating Matrix Percentages – All Models
Student Learning Key
4 3 2 1
Highly Effective
PP
x P
F
4 30.4% 26.8% 0.0% 0.0% Effective
3 13.7% 24.8% 0.0% 0.0% Developing
2 1.0% 2.0% 0.3% 0.0% Ineffective
1 0.3% 0.8% 0.0% 0.0%
1.4% 5.2%
54.2%
39.2%
0.0% 1.3%
54.7%
44.1%
0%
10%
20%
30%
40%
50%
60%
70%
80%
90%
100%
Ineffective Developing Effective Highly Effective
Building Administrator Final Effectiveness Ratings Distribution - All Models
2012-13 2013-14
9
Overall Results Once again, we applaud teachers, building administrators, and district leaders for their diligent efforts in
implementing these new evaluation systems. Results from the midyear survey suggest that educators
have become more comfortable with the processes involved in implementing the systems:
68% of teachers indicated an increased understanding of how to set SLOs;
72% of building administrators and central office evaluators felt more confident in their ability
to support teachers and administrators in the SLO process, as compared with last year; and
85% of teachers and 80% of administrators who had received one or more observations or site
visits had received their feedback and scores, compared with 78% and 76% last year.
This year’s data suggest that, as a state, we have more work to do to ensure that educator evaluations
reflect the true spectrum of educator performance in our schools. On all indicators of student
achievement, student growth, and school accountability, there is variation across the state and often
considerable variation within districts and schools. In sharp contrast, the results from the first two
years of implementation of the educator evaluation systems continue to show little variation across and
within districts. More than 40% of teachers and 30% of building administrators received the highest
possible ratings on Student Learning and Professional Practice x Professional Responsibilities, and
overall, more than 97% of educators received ratings of Effective or Highly Effective.
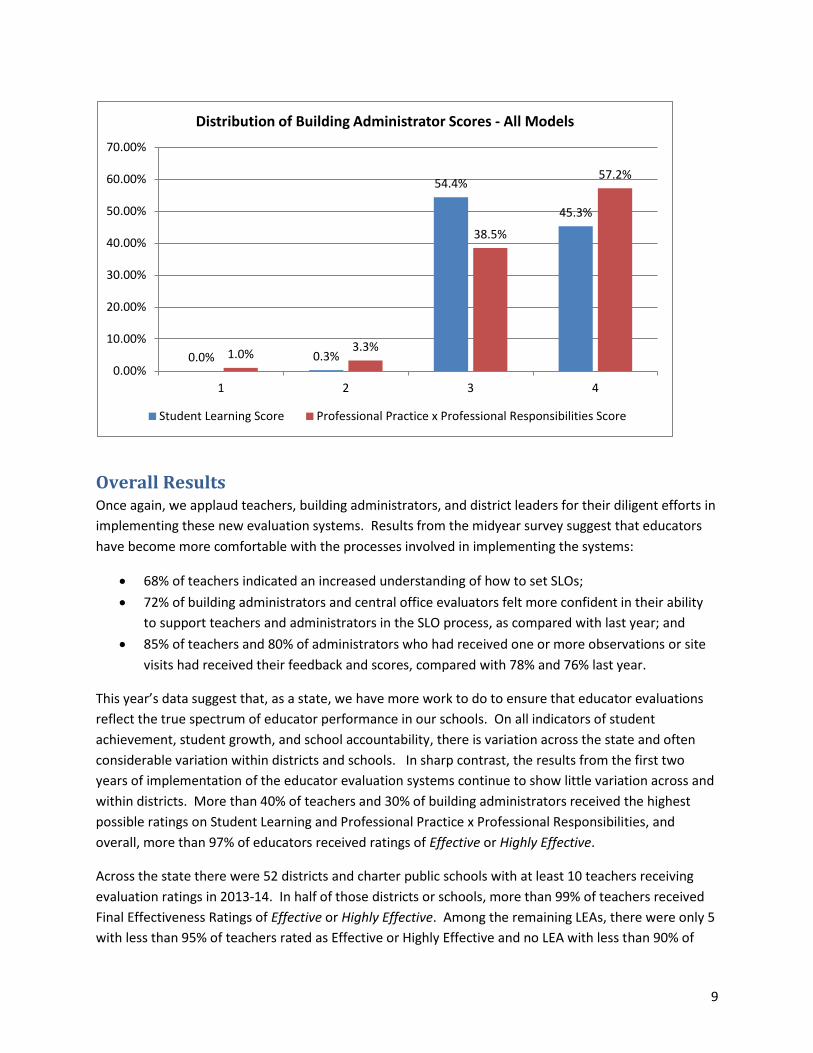
Across the state there were 52 districts and charter public schools with at least 10 teachers receiving
evaluation ratings in 2013-14. In half of those districts or schools, more than 99% of teachers received
Final Effectiveness Ratings of Effective or Highly Effective. Among the remaining LEAs, there were only 5
with less than 95% of teachers rated as Effective or Highly Effective and no LEA with less than 90% of
0.0% 0.3%
54.4%
45.3%
1.0% 3.3%
38.5%
57.2%
0.00%
10.00%
20.00%
30.00%
40.00%
50.00%
60.00%
70.00%
1 2 3 4
Distribution of Building Administrator Scores - All Models
Student Learning Score Professional Practice x Professional Responsibilities Score
10
teachers receiving ratings in the top two categories. Appendix A provides each LEA’s results reflecting
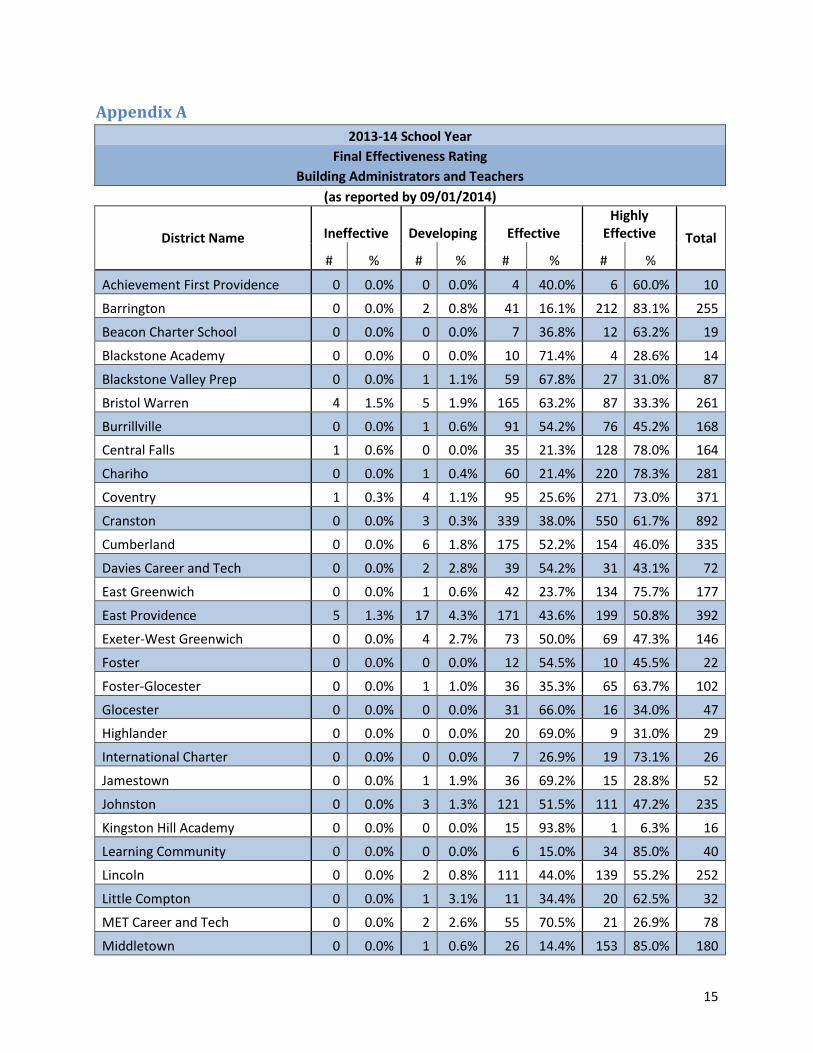
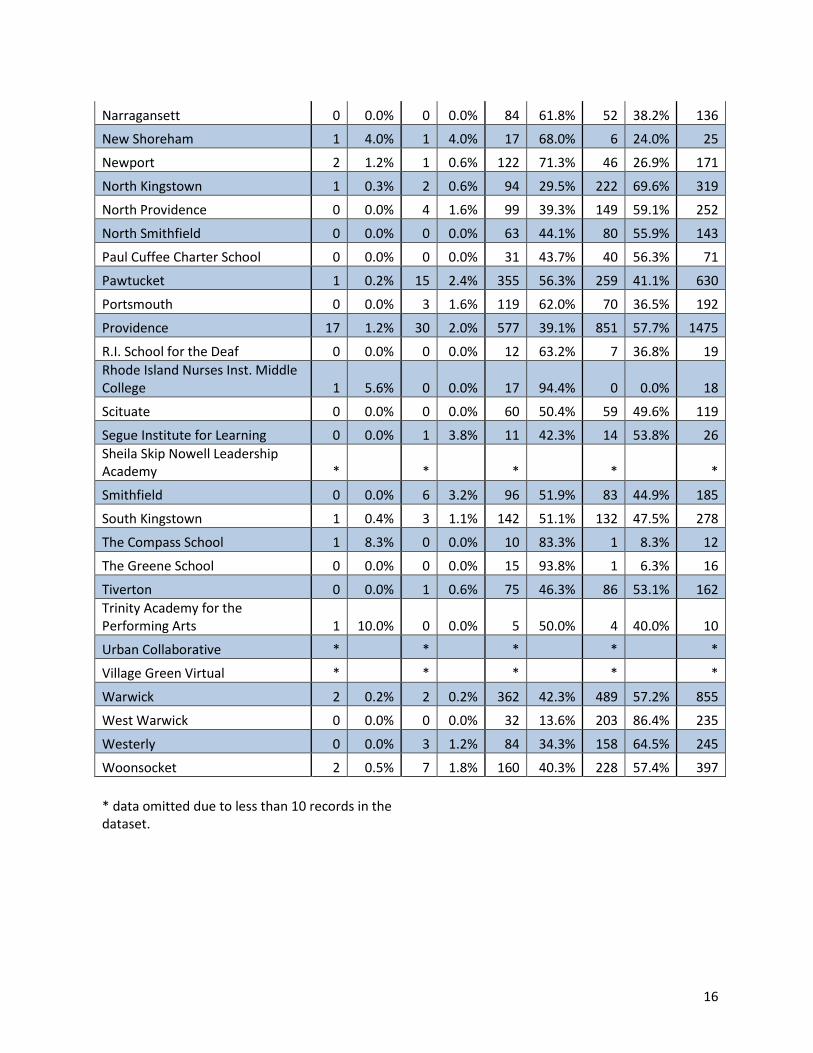
the combined ratings for teachers and administrators.
Relationship between Educator Effectiveness Ratings and Achievement To be clear, nobody expects there to be a 1:1 correspondence between ratings of educator effectiveness
and student academic achievement, whether student achievement is measured in the classroom or on
standardized assessments such as NECAP or PARCC. Students enter instruction each year at varying
levels of achievement. Student growth, in particular, and teacher impact on student growth and
learning, is a critical piece to the evaluation systems and to determining educators’ Final Effectiveness
Ratings each year; however, research2 continues to find considerable variability in educator
effectiveness, and common sense tells us that we are not yet capturing that variation within the
evaluation systems.
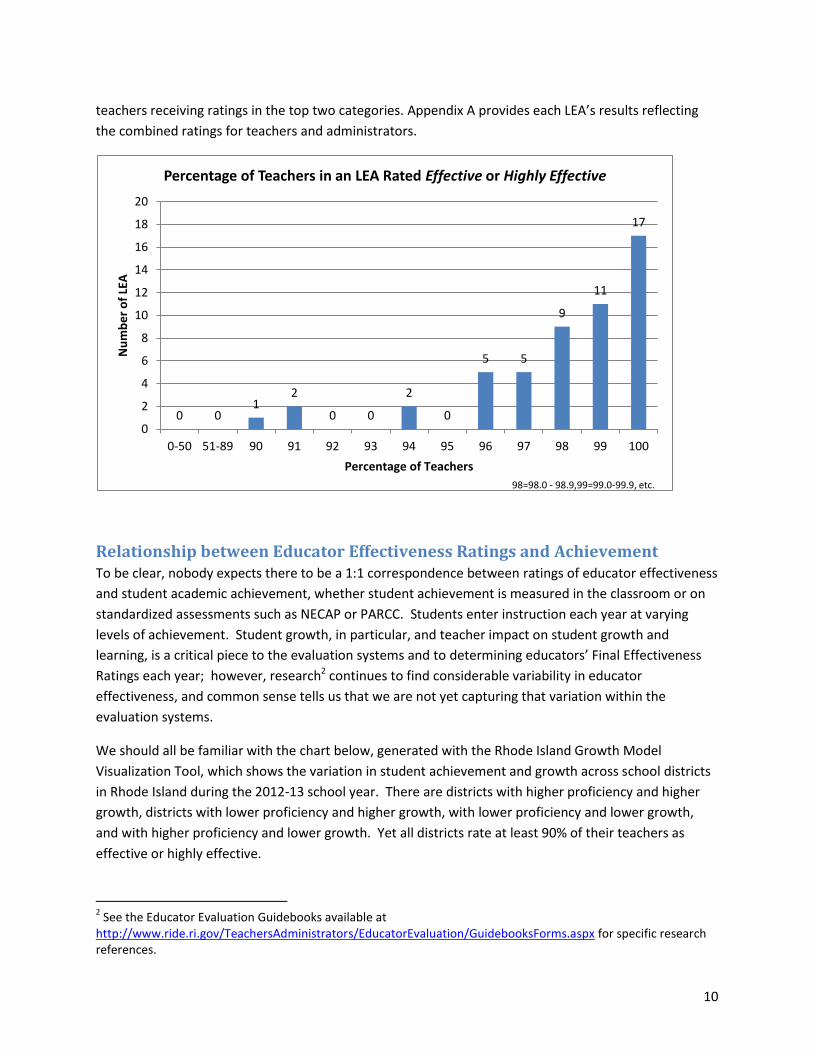
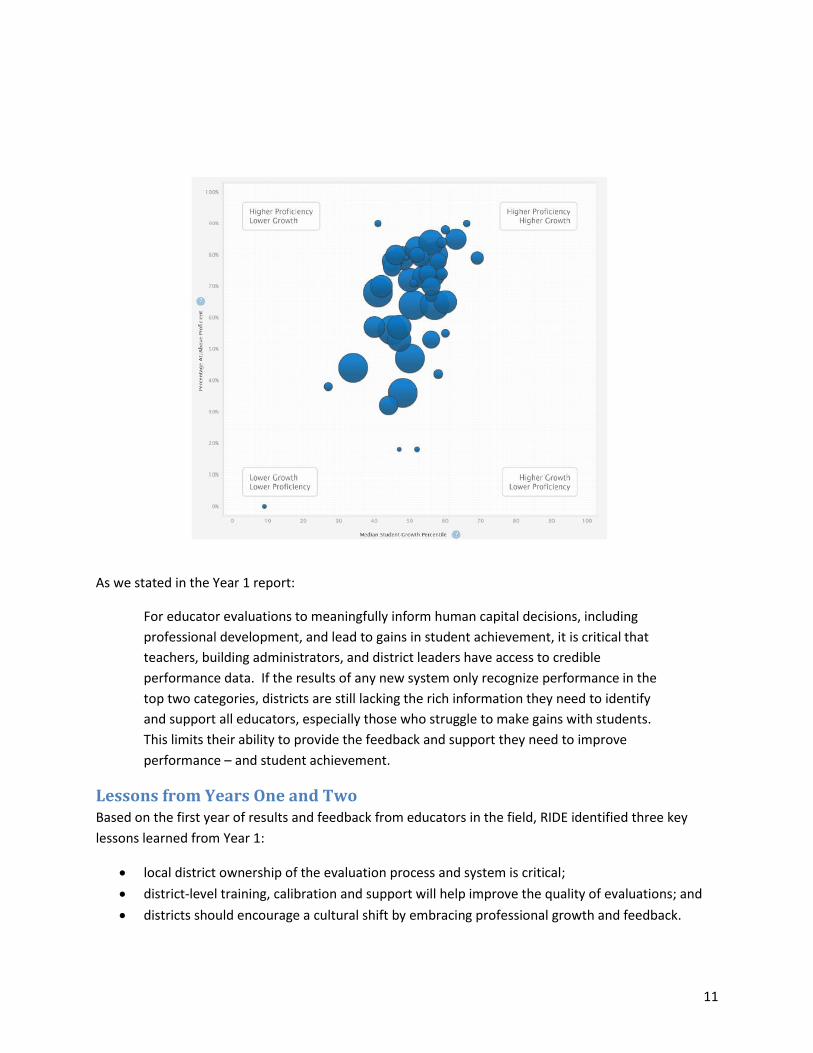
We should all be familiar with the chart below, generated with the Rhode Island Growth Model
Visualization Tool, which shows the variation in student achievement and growth across school districts
in Rhode Island during the 2012-13 school year. There are districts with higher proficiency and higher
growth, districts with lower proficiency and higher growth, with lower proficiency and lower growth,
and with higher proficiency and lower growth. Yet all districts rate at least 90% of their teachers as
effective or highly effective.
2 See the Educator Evaluation Guidebooks available at
http://www.ride.ri.gov/TeachersAdministrators/EducatorEvaluation/GuidebooksForms.aspx for specific research references.
0 0 1
2
0 0
2
0
5 5
9
11
17
0
2
4
6
8
10
12
14
16
18
20
0-50 51-89 90 91 92 93 94 95 96 97 98 99 100
Nu
mb
er
of
LEA
Percentage of Teachers
Percentage of Teachers in an LEA Rated Effective or Highly Effective
98=98.0 - 98.9,99=99.0-99.9, etc.
11
As we stated in the Year 1 report:
For educator evaluations to meaningfully inform human capital decisions, including
professional development, and lead to gains in student achievement, it is critical that
teachers, building administrators, and district leaders have access to credible
performance data. If the results of any new system only recognize performance in the
top two categories, districts are still lacking the rich information they need to identify
and support all educators, especially those who struggle to make gains with students.
This limits their ability to provide the feedback and support they need to improve
performance – and student achievement.
Lessons from Years One and Two Based on the first year of results and feedback from educators in the field, RIDE identified three key
lessons learned from Year 1:
local district ownership of the evaluation process and system is critical;
district-level training, calibration and support will help improve the quality of evaluations; and
districts should encourage a cultural shift by embracing professional growth and feedback.
12
Each of these lessons learned affected decisions RIDE made in regard to the adjustments made to the RI
Model and to the overall evaluation system requirements for 2013-14 and 2014-15, in regard to
determining where to focus training and resources in 2013-14, and in regard to communicating with
LEAs on how to interpret and use the first-year results to continue to improve their evaluation systems.
All of the key lessons learned from Year 1 still apply and will require long-term shifts in culture and
practices that cannot be fully realized within a single year.
In addition to continuing to draw on the lessons learned from Year 1, RIDE will also be drawing on the
following lessons learned from Year 2:
Ongoing communication and support is needed to eliminate misconceptions about the system.
Results from the midyear survey, meetings with teachers and administrators, and informal
communications with educators and district leaders across the state show that there are misconceptions
about the system. These misconceptions are best addressed through improved and continuing
communication and support. Often, misconceptions are a reflection of natural gaps in understanding in
these early stages of full implementation. In some cases, however, these misconceptions reflect
misinformation or confusion between district policies and evaluation system requirements.
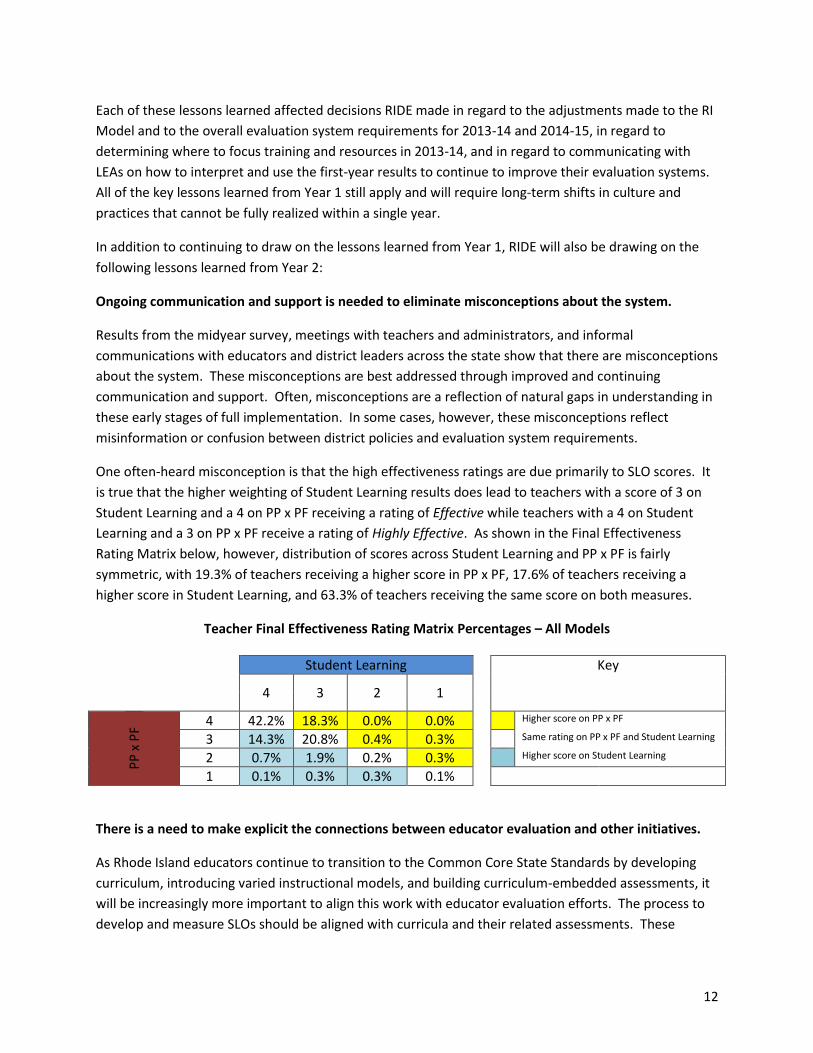
One often-heard misconception is that the high effectiveness ratings are due primarily to SLO scores. It
is true that the higher weighting of Student Learning results does lead to teachers with a score of 3 on
Student Learning and a 4 on PP x PF receiving a rating of Effective while teachers with a 4 on Student
Learning and a 3 on PP x PF receive a rating of Highly Effective. As shown in the Final Effectiveness
Rating Matrix below, however, distribution of scores across Student Learning and PP x PF is fairly
symmetric, with 19.3% of teachers receiving a higher score in PP x PF, 17.6% of teachers receiving a
higher score in Student Learning, and 63.3% of teachers receiving the same score on both measures.
Teacher Final Effectiveness Rating Matrix Percentages – All Models
Student Learning Key
4 3 2 1
PP
x P
F
4 42.2% 18.3% 0.0% 0.0% Higher score on PP x PF
3 14.3% 20.8% 0.4% 0.3% Same rating on PP x PF and Student Learning
2 0.7% 1.9% 0.2% 0.3% Higher score on Student Learning
1 0.1% 0.3% 0.3% 0.1%
There is a need to make explicit the connections between educator evaluation and other initiatives.
As Rhode Island educators continue to transition to the Common Core State Standards by developing
curriculum, introducing varied instructional models, and building curriculum-embedded assessments, it
will be increasingly more important to align this work with educator evaluation efforts. The process to
develop and measure SLOs should be aligned with curricula and their related assessments. These
13
connections will reduce the use of “SLO tests” and will increase the reliance on strong curriculum-
aligned measures of student learning.
Greater differentiation among teachers will not come solely through setting more rigorous
expectations.
Throughout this report, we have called for setting more rigorous expectations for students, teachers,
and building administrators with regard to student learning, professional practice, and professional
foundations. Simply setting more rigorous expectations, however, is not sufficient to understand the
differentiation among educators necessary to provide them with prioritized, specific, and actionable
feedback about their performance – nor for providing educators with support to continuously improve
their effectiveness; regardless of the number of years they have been teaching or leading schools.
The goal of educator evaluation is continuous improvement in educators’ understanding of teaching
effectiveness or leading, student learning, and instructional practices that will lead to improved student
learning. The timeliness and quality of feedback and supports provided to educators enable them to
continuously improve their effectiveness. Achieving those goals requires a long-term commitment to
improvement by teachers, building administrators, district leaders, RIDE, and state and federal
policymakers. Simply changing the way ratings are earned to impact the distribution of educator
effectiveness ratings is not the goal of educator evaluation.
What Comes Next Improved educator evaluation remains one of the highest priorities for Rhode Island, and there is a
renewed commitment that these policies are here to stay. The legislation passed this year does not
overturn the regulatory requirements set forth within the Educator Evaluation System Standards. All RI
LEAs must implement evaluation systems that meet those standards as well as BEP requirements and
that have been approved by RIDE. The legislation does impact the cycle of evaluation for many teachers;
however, the system components remain constant and the focus on supporting educators remains clear.
We are confident that we are at a point in the implementation process where the system itself and our
LEAs can adapt to those changes. RIDE will continue to support the implementation of educator
evaluation systems even as that support changes in 2014-15 and beyond.
One aspect of providing support for the work is making warranted refinements to the system over time.
We have listened to concerns from teachers, administrators, and support professionals about measuring
student learning, and we are committed to working together to continue to improve teachers’
understanding of and use of the SLO process and to ensure a smooth reintroduction of the Rhode Island
Growth Model into the evaluation system over the next few years, as we transition to new standards
and assessments. RIDE will provide educators with Median Growth Scores (MGS) based on available
state-assessment results from NECAP and PARCC, and we will provide data and supports to help
educators monitor how growth scores compare with SLO scores, student grades, and other relevant
14
data. RIDE will support districts and schools in the understanding and use of school, district, and
educator Median Growth Scores as a tool for evaluating school performance.
In short, we believe that we all want our entire education system to continue to focus on growth for all
educators and students – growth in educator effectiveness and growth in student learning – in all
subjects and grade levels, including those subjects and grade levels for which we will not have Rhode
Island Growth Model scores.
We will renew our commitment to fostering local ownership of the evaluation systems and to the
embedding of feedback and continuous improvement into the instructional process throughout the
year.
We will continue to emphasize and support districts in the interpretation of results from these new
evaluation systems in relation to other indicators of teacher effectiveness and overall school quality.
These indicators include district and school inputs such as aligned curriculum, professional development
plans, and student supports as well as outcome indicators, such as student growth and student
achievement. These outcome indicators will also include components beyond test-based outcomes,
such as course completion; preparedness for transitions across elementary, middle, and high schools;
high-school graduation rates; college enrollment, remediation, and completion rates; and other
indicators of readiness for postsecondary success.
Improved educator evaluations are one key to transforming Rhode Island schools into the centers of
excellence our students need and that we know we can create and sustain. The educator evaluation
systems alone, however, cannot transform education in Rhode Island, and the educator evaluation
systems cannot be considered in isolation from other key reform initiatives. All of the pieces must fit
together.
We look forward to continuing the work with educators to make progress toward achieving our number-
one goal: improving academic achievement for all Rhode Island students.
For More Information If you have questions or feedback about this report – or about any other aspect of the Rhode Island
educator evaluation initiative – contact: [email protected], or visit the educator evaluation section of
the RIDE website, at: www.ride.ri.gov/EdEval.
15
Appendix A
2013-14 School Year
Final Effectiveness Rating
Building Administrators and Teachers
(as reported by 09/01/2014)
District Name Ineffective Developing Effective Highly
Effective Total
# % # % # % # %
Achievement First Providence 0 0.0% 0 0.0% 4 40.0% 6 60.0% 10
Barrington 0 0.0% 2 0.8% 41 16.1% 212 83.1% 255
Beacon Charter School 0 0.0% 0 0.0% 7 36.8% 12 63.2% 19
Blackstone Academy 0 0.0% 0 0.0% 10 71.4% 4 28.6% 14
Blackstone Valley Prep 0 0.0% 1 1.1% 59 67.8% 27 31.0% 87
Bristol Warren 4 1.5% 5 1.9% 165 63.2% 87 33.3% 261
Burrillville 0 0.0% 1 0.6% 91 54.2% 76 45.2% 168
Central Falls 1 0.6% 0 0.0% 35 21.3% 128 78.0% 164
Chariho 0 0.0% 1 0.4% 60 21.4% 220 78.3% 281
Coventry 1 0.3% 4 1.1% 95 25.6% 271 73.0% 371
Cranston 0 0.0% 3 0.3% 339 38.0% 550 61.7% 892
Cumberland 0 0.0% 6 1.8% 175 52.2% 154 46.0% 335
Davies Career and Tech 0 0.0% 2 2.8% 39 54.2% 31 43.1% 72
East Greenwich 0 0.0% 1 0.6% 42 23.7% 134 75.7% 177
East Providence 5 1.3% 17 4.3% 171 43.6% 199 50.8% 392
Exeter-West Greenwich 0 0.0% 4 2.7% 73 50.0% 69 47.3% 146
Foster 0 0.0% 0 0.0% 12 54.5% 10 45.5% 22
Foster-Glocester 0 0.0% 1 1.0% 36 35.3% 65 63.7% 102
Glocester 0 0.0% 0 0.0% 31 66.0% 16 34.0% 47
Highlander 0 0.0% 0 0.0% 20 69.0% 9 31.0% 29
International Charter 0 0.0% 0 0.0% 7 26.9% 19 73.1% 26
Jamestown 0 0.0% 1 1.9% 36 69.2% 15 28.8% 52
Johnston 0 0.0% 3 1.3% 121 51.5% 111 47.2% 235
Kingston Hill Academy 0 0.0% 0 0.0% 15 93.8% 1 6.3% 16
Learning Community 0 0.0% 0 0.0% 6 15.0% 34 85.0% 40
Lincoln 0 0.0% 2 0.8% 111 44.0% 139 55.2% 252
Little Compton 0 0.0% 1 3.1% 11 34.4% 20 62.5% 32
MET Career and Tech 0 0.0% 2 2.6% 55 70.5% 21 26.9% 78
Middletown 0 0.0% 1 0.6% 26 14.4% 153 85.0% 180
16
Narragansett 0 0.0% 0 0.0% 84 61.8% 52 38.2% 136
New Shoreham 1 4.0% 1 4.0% 17 68.0% 6 24.0% 25
Newport 2 1.2% 1 0.6% 122 71.3% 46 26.9% 171
North Kingstown 1 0.3% 2 0.6% 94 29.5% 222 69.6% 319
North Providence 0 0.0% 4 1.6% 99 39.3% 149 59.1% 252
North Smithfield 0 0.0% 0 0.0% 63 44.1% 80 55.9% 143
Paul Cuffee Charter School 0 0.0% 0 0.0% 31 43.7% 40 56.3% 71
Pawtucket 1 0.2% 15 2.4% 355 56.3% 259 41.1% 630
Portsmouth 0 0.0% 3 1.6% 119 62.0% 70 36.5% 192
Providence 17 1.2% 30 2.0% 577 39.1% 851 57.7% 1475
R.I. School for the Deaf 0 0.0% 0 0.0% 12 63.2% 7 36.8% 19
Rhode Island Nurses Inst. Middle College 1 5.6% 0 0.0% 17 94.4% 0 0.0% 18
Scituate 0 0.0% 0 0.0% 60 50.4% 59 49.6% 119
Segue Institute for Learning 0 0.0% 1 3.8% 11 42.3% 14 53.8% 26
Sheila Skip Nowell Leadership Academy * * * * *
Smithfield 0 0.0% 6 3.2% 96 51.9% 83 44.9% 185
South Kingstown 1 0.4% 3 1.1% 142 51.1% 132 47.5% 278
The Compass School 1 8.3% 0 0.0% 10 83.3% 1 8.3% 12
The Greene School 0 0.0% 0 0.0% 15 93.8% 1 6.3% 16
Tiverton 0 0.0% 1 0.6% 75 46.3% 86 53.1% 162
Trinity Academy for the Performing Arts 1 10.0% 0 0.0% 5 50.0% 4 40.0% 10
Urban Collaborative * * * * *
Village Green Virtual * * * * *
Warwick 2 0.2% 2 0.2% 362 42.3% 489 57.2% 855
West Warwick 0 0.0% 0 0.0% 32 13.6% 203 86.4% 235
Westerly 0 0.0% 3 1.2% 84 34.3% 158 64.5% 245
Woonsocket 2 0.5% 7 1.8% 160 40.3% 228 57.4% 397
* data omitted due to less than 10 records in the dataset.