Embed Size (px)
Citation preview

VOT 74190
Investigation of growth of Rhizobium sp. at low concentrations of halogenated compound
Dr. Fahrul Zaman Huyop Ng Hong Jing
Dr. Adibah Yahya Tg. Haziyamin Tg. Abd. Hamid
Dr. Rosli Md. Illias Prof. Dr. Abu Bakar Salleh
Research VOTE NO: 74190
Jabatan Biologi Fakulti Sains
Universiti Teknologi Malaysia
2006

i
ABSTRACT
Investigation of growth of Rhizobium sp. at low concentrations of halogenated compound
Fahrul Huyop and Ng Hong Jing
Halogenated organic compounds are produced industrially in large quantities and
represent an important class of environmental pollutants. Bacteria have evolve several
strategies for the enzymes to catalysed dehalogenation and degradation of halogenated
compounds. The destruction of halogenated chemicals by microorganisms may be
influenced by environmental factors or the structure of the chemical itself. One of the
reasons suggested for the lack of degradation of organic compounds by microbes is their
low concentration. Such organisms appear to be adapted to low substrate concentrations
by having high substrate affinity (low Km value) systems. Our current investigation is
to study the possibility of growth of Rhizobium sp. at low concentrations of halogenated
substrate (2,2-dichloropropionic acid; 2,2DCP). 2,2DCP was chosen because it was
widely used as a herbicide (Dalapon). The degradation of low concentrations of 2,2DCP
by whole cells of Rhizobium sp. has been achieved (cells doubling time: 12 hours).
Rhizobium sp. was able to grow at 0.2 mM 2,2DCP which was 100x lower than the
concentration of the substrate routinely used (20 mM) with cells doubling time of 11
hours. Dehalogenase specific activity for crude extracts from cells grown at 20mM and
0.2 mM 2,2DCP PJC minimal media was calculated and the Km values for both enzymes
were 0.1mM respevtively. Apparently, no new dehalogenases are required to allow
growth on this low concentration of 2,2DCP as judged by dehalogenase properties which
is similar to the growth at low substrate concentration. A new isolated bacterium was
identified as Methylobacterium sp. by 16S rRNA method was found to be able to degrade
2,2DCP. The bacterium grew in 20mM 2,2DCP PJC minimal medium with a doubling
time of 22.80 hours. Degradation of 2,2DCP was detected in growth medium by HPLC
technique.

ii
LIST OF ABBREVIATIONS
2,2-DCP - 2,2-dichloropropionic acid
D,L2CP - D,L-2-chloropropionic acid
A - Absorbance
BLAST - Basic local alignment search tool
DDBJ - DNA Data Bank of Japan
DNA - Deoxyribonucleic acid
EDTA - Ethylenediaminetetraaceticacid,
(HOOCCH2)2N(CH2)2N(CH2COOH)2
EMBL - European Molecular Biology Laboratory
EtBr - Ethidium Bromide
H - Hour
kb - Kilo base
kDA - Kilo Dalton
min - Minutes
NCBI - National Center for Biotechnology Information
OD - Optical Density
PCR - Polymerase Chain Reaction
RDP - Ribosomal database project
RNA - Ribonucleic acid
rDNA - Ribosomal DNA
rRNA - Ribosomal RNA
TAE - Tris-Acetate-EDTA
UV - Ultraviolet

iii
UNIVERSITI TEKNOLOGI MALAYSIA
BORANG PENGESAHAN LAPORAN AKHIR PENYELIDIKAN
TAJUK PROJEK: Investigation of growth of Rhizobium sp. at low concentrations of halogenated compound
Saya, FAHRUL ZAMAN BIN HUYOP
Mengaku membenarkan Laporan Akhir Penyelidikan ini disimpan di Perpustakaan Universiti Teknologi Malaysia dengan syarat-syarat kegunaan seperti berikut :
1. Laporan Akhir Penyelidikan ini adalah hakmilik Universiti Teknologi Malaysia.
2. Perpustakaan Universiti Teknologi Malaysia dibenarkan membuat salinan untuk tujuan rujukan sahaja.
3. Perpustakaan dibenarkan membuat penjualan salinan Laporan Akhir
Penyelidikan ini bagi kategori TIDAK TERHAD.
4. * Sila tandakan ( / )
SULIT (Mengandungi maklumat yang berdarjah keselamatan
atau Kepentingan Malaysia seperti yang termaktub di
dalam AKTA RAHSIA RASMI 1972).
TERHAD (Mengandungi maklumat TERHAD yang telah Ditentukan oleh Organisasi/badan di mana penyelidikan dijalankan). TIDAK TERHAD __________________________________ TANDATANGAN KETUA PENYELIDIK
Nama & Cop Ketua Penyelidik Tarikh: 1hb. Disember 2006

iv
ACKNOWLEDGEMENTS
First and foremost, I would like to express my thank you to our research group for giving
brilliant ideas through out the project. Our post graduate student, Ng Hong Jing who puts
his effort in completing the research. Without him, we would not been able to conduct
and complete this project successfully.
Not forgotten staffs in the Department of Biology, Faculty of Science UTM for support,
sharing and ordering laboratory equipments and chemicals.
Last but not least, Malaysian Government (IRPA secretariat) for funding and support. I
would like to thank all those who have been involved directly or indirectly in making this
project a success.

v
TABLE OF CONTENTS
ABSTRACT i
ABBREVIATIONS ii
AUTHOR DECLARATIONS iii
ACKNOWLEDGEMENTS iv
LIST OF TABLES viii
LIST OF FIGURES ix
CHAPTER 1 INTRODUCTION 1
1.1 Oligotrophy 1
1.2 General problem statement 3
1.3 Research objectives 4
CHAPTER 2 MATERIAL AND METHODS 5
2.1 Growth conditions and media
2.2 Glycerol stocks 5
2.3 Measurement of DNA concentration 6
2.4 Agarose gel electrophoresis 6
2.5 Polymerase Chain Reaction (PCR) for Amplification of DNA 7
2.6 DNA sequencing and oligodeoxyribonucleotoide synthesis 8
2.7 Preparation of cell-free extracts 8
2.8 Estimation of protein concentration 9
2.9 Assay for dehalogenase activity 9
2.10 Assay for halide ion 10
2.11 Standard curve for chloride and bromide ions 10
2.12 HPLC analysis of growth medium 12
2.13 Computer Analysis 12

vi
CHAPTER 3 INVESTIGATION OF GROWTH OF
RHIZOBIUM SP. AT LOW CONCENTRATIONS OF
HALOGENATED COMPOUND 13
3.1 Introduction 13
3.2 Growth of Rhizobium sp. on 0.2mM 2,2-dichloropropionate (2,2DCP) 13
3.3 Analysis of cell-free extract from 0.2mM 2,2DCP-grown bacteria
by enzyme assay 16
3.4 Apparent Km values using crude extract prepared from cells
grown on 20mM and 0.2mM 2,2DCP 17
3.5 Discussion 19
3.6 Conclusion 20
CHAPTER 4 ISOLATION AND CHARACTERIZATION
OF 2,2DCP DEGRADING BACTERIA 21
4.1 Introduction 21
4.2 Isolation of 2,2DCP degrading bacteria 23
4.3 Identification of bacterium B by 16S gene sequencing 23
4.3.1 DNA analysis of Bacterium B 23
4.3.2 Sequencing of the PCR Product 25
4.4 Bacteria morphology, staining and biochemical characterization 29
4.5 Growth of Methylobacterium sp. in 2,2DCP PJC minimal medium 30
4.6 Growth of Methylobacterium sp. in other halogenated compounds 32
4.7 HPLC Analysis of Growth Medium 34
4.7.1 2,2DCP Calibration Curve 34
4.7.2 Detection of 2,2DCP in growth medium 35
4.7.3 Dehalogenase activity in cell free extracts of 2,2DCP
grown bacteria 38
4.8 Discussion 39
4.9 Conclusion 42

vii
APPENDICES
Appendix A
Appendix B
REFERENCES

viii
LIST OF TABLES
Table 3.1. Dehalogenase specific activity for crude extracts from cells
grown at low and high concentration 16
Table 4.1. Top 5 entries in the database that showed highest identity
to bacterium B 28
Table 4.2. Colony characteristic on 2,2DCP PJC minimal medium 29
Table 4.3. Morphological and biochemical characteristics of
Methylobacterium sp. 30
Table 4.4. Growth properties of bacteria in different 2,2DCP
Concentration 31
Table 4.5. Growth properties of Methylobacterium sp. in different
Substrates 32
Table 4.6. Data used to construct the 2,2DCP 34
Table 4.7. Comparison between the 2,2DCP consumed and turbidity
of Methylobacterium growth medium. 35

ix
LIST OF FIGURES
Figure 2.1.(a) Standard curve of Cl- concentration (0 - 0.2µmolCl-)
against A460nm 11
Figure 2.1. (b) Standard curve of Br- concentration (0 – 1.0µmolBr-)
against A460nm 11
Figure 3.1(a). Growth of Rhizobium sp. on 0.2mM 2,2DCP 15
Figure 3.1(b). Growth of Rhizobium sp. on 20mM 2,2DCP 15
Figure 3.2 (a). Apparent Km using crude extract from Rhizobium sp. 18
grown on high (20mM) concentration of 2,2DCP with 2,2DCP as substrate
Figure 3.2(b). Apparent Km using crude extract from Rhizobium sp. grown on low
(0.2mM) concentration of 2,2DCP with 2,2DCP as substrate 18
Figure 4.1. The molecular structure of 2,2-dichloropropionic acid
(Dalapon)- (2,2DCP) 22
Figure 4.2. Agarose gel electrophoresis of undigested genomic DNA and
16S rRNA gene fragment 24
Figure 4.3. Bacterium B 16S rRNA partial sequence lacking the very proximal 5’ and
terminal 3’ regions (Accession number AM 231910) 26
Figure 4.4. Sequence comparison for bacterium B 16S ribosomal RNA gene (percent
identity: 99 %) 28
Figure 4.5. Growth curves on 5, 10, 20 and 40 mM 2,2DCP for
Methylobacterium sp. 31
Figure 4.6. Grow curve of Methylobacterium sp. when grown on different types
halogenated substrate 33
Figure 4.7: Calibration curve for 2,2DCP 34
Figure 4.8. HPLC elution profile of medium from cells utilizing 2,2DCP as source of
carbon. Medium was analysed at i) day 0 ii) day 2 and (iii) day 4 37
1
CHAPTER 1
INTRODUCTION 1.1 Oligotrophy A less well understood part of the microbial community in soil and in other
natural environments are the oligotrophs. Generally these microorganisms can be
maintained on media containing less than 15mg/l of organic matter. The study of
oligotrophs and slow-growing organisms is an important area in environmental
microbiology (Prescot et al., 1996). Oligotrophs are ubiquitous in the
environment and have been isolated from soil, rivers, lakes, oceans and tap-water
lacking organic substances. There are two types of oligotrophs that have been
identified. Those that are able to grow only on a very low concentration of
carbon are called obligate oligotrophs and those that are able grow at both low
and high concentrations of organic substances are called facultative oligotrophs.
A detailed study was carried out on the enteric bacterium Enterococcus faecalis.
The natural habitat of this bacterium is in the intestine of humans and animals.
When discharged into a natural aquatic system this microorganism needs to adapt
for survival in a hostile environment. The ability of Enterocococus faecalis to
survive in an oligotrophic environment such as in tap water was shown (Hartke et
al., 1998).
Many oligotrophic bacteria can be isolated from clinical materials including urine,
sputum and vaginal discharges and throat swabs. However, the clinical
significance of such oligotrophic bacteria is uncertain (Tada et al., 1995).

2
Slow growth of oligotrophic bacteria was possibly due to the slow process of
transport of nutrients into the cell. Dissolved nutrients entering the aquatic
environment are assimilated into microorganisms due to permeability and active
transport through the cytoplasmic membrane. In some oligotrophic bacteria
there is a cellular appendage (prostheca) whose function is to increase the surface
area of cell and cytoplasmic membrane for increasing transport of substances into
a cell. A biochemical study on prostheca of Asticcacaulis biprosthecum revealed
that it did not contain DNA, RNA, NADH-oxidase and NADH-dehydrogenase.
This highlights the specialised function of prostheca connected with the active
transport of nutrients (Jordan et al., 1974). Some oligotrophic bacteria show
inhibition of growth in rich nutrient media (Kuznetsoz et al., 1979). One reason
may be the action of toxic products of metabolism particularly hydrogen peroxide
which forms in a number of metabolic reactions. Dubinina (1977) showed that
the oligotrophic bacterium Leptothrix pseudoochraceae begins to lyse due to
accumulation of hydrogen peroxide in a rich medium. The addition of catalase
resulted in growth of this organism.
Xenobiotic chemicals that enter the environment are mostly from chlorinated
aliphatic acid compounds. Many of these pollutants are present in natural waters
only at very low concentrations. However, such concentrations are still sufficient
to be a public health and environmental concern (Fauzi et al., 1996).
Biodegradation of low substrate concentrations of xenobiotic compounds has
been a neglected field of research. The rate of biodegradation at low
concentration usually decreases with lower initial substrate concentrations
(Boethling and Alexander, 1979). For example the herbicide (2,4-
dichlorophenoxy acetic acid) at 2.2 parts/billion was mineralised more slowly in
stream water than at higher concentrations (22 ppm). In addition, the carbon of
very low concentrations of xenobiotics is often not converted to biomas carbon,

3
thus other carbon sources may be required for cell growth under these conditions
(Subba-Rao et al., 1982).
The bacterial degradation of low concentrations of 1,3-dichloro-2-propanol (1,3-
DCP) has been reported. The isolate was identified as Agrobacterium sp., which
was able to dehalogenate 1,3-DCP with a Km value of 0.1mM (Fauzi et al.,
1996). However, there is no report so far in the current literature for degradation
of low concentration of haloalkanoic aliphatic acids.
1.2 General problem statement
Biodegradation of very low concentrations of xenobiotic compounds has been
neglected. It is useful to know about growth of microorganisms in low
concentrations of pollutants because of the legal requirements. A government
body or legislation may set the concentration of a pollutant down to a level that is
not considered harmful. Therefore, if the microorganisms could only remove
high concentration of pollutants, they could not be used to meet requirements of
the law, since there still will be low concentrations of pollutants in the
environment.
The Rhizobium sp. had been isolated using 20mM 2,2DCP and it was not known
whether the organism could grow at concentrations of the order of one hundreth
of this value i.e. could exhibit oligotrophism?. However, should growth be
possible at very low substrate concentrations some of the Km values of Rhizobial
dehalogenases suggest that the known dehalogenases might function satisfactorily
at low substrate concentrations. Alternatively, a different type of dehalogenase
with a higher substrate affinity might be needed/present.

4
1.3 Research objectives
To determine the ability of Rhizobium sp. to degrade 2,2DCP at low
concentration.
To determine the kinetic parameter (i.e. Km values) of Rhizobium sp.
dehalogenases involved in growth at high and low substrate concentration
To identify whether the same dehalogenases are involved when growth at
low substrate concentration or different dehalogenases are present
To characterize newly isolate organism that able to degrade 2,2DCP
5
CHAPTER 2
MATERIAL AND METHODS
2.1 Growth conditions and media
Luria broth (LB) media was described by Miller (1972) and contained yeast
extract 10.0 g/l, tryptone 5.0 g/l and NaCl 10.0 g/l.
PJC chloride-free minimal media was prepared as 10x concentrated basal salts
containing K2HPO4. 3H2O (42.5g/l), NaH2PO4. 2H2O (10.0 g/l) and (NH4)2SO4
(25.0 g/l). The trace metal salts solution was a 10x concentrate that contained
nitriloacetic acid (NTA) (1.0 g/l), MgSO4(2.0 g/l), FeSO4. 7H2O (120.0 mg/l),
MnSO4. 4H2O (30.0 mg/l), ZnSO4. H2O (30 mg/l) and CoCl2 (10.0 mg/l) in
distilled water (Hareland et al., 1975).
Minimal media for growing bacteria contained 10ml of 10x basal salts and 10ml
of 10x trace metal salts per 100ml of distilled water and were autoclaved (121oC,
for 15 minutes). Carbon sources were sterilised separately and added aseptically
to the media to the desired final concentration. Liquid minimal cultures were
supplemented with yeast extract to a final concentration of 0.05% (w/v) for
growth of Rhizobium. Liquid cultures were incubated in a Gallenkamp orbital
shaker at 200 rpm at the appropriate temperature. The liquid media was solidified
by addition of Oxoid bacteriological agar No. 1 (1.5 % w/v) prior to sterilisation.
2.2 Glycerol stocks
Glycerol stocks of organisms were prepared by adding 0.3ml of sterile 50%
glycerol to 0.7ml of bacterial culture. The sample was then mixed thoroughly and
frozen by standing in dry ice/IMS bath. Stocks were stored at –80oC.

6
2.3 Measurement of DNA concentration
DNA concentration was estimated by ultraviolet spectrophotometry. An A260nm of
1.0 corresponds to 50µg of double stranded DNA per ml. The DNA purity was
estimated from the A260nm / A280nm = ratio. Ratios of less than 1.8 indicate that the
preparation is contaminated with protein (Maniatis et al., 1982).
2.4 Agarose gel electrophoresis
Restriction enzyme digests were analysed by submarine gel electrophoresis
through agarose gels. Generally, 0.8% agarose gel prepared in TAE buffer (40
mM Tris-acetate pH 7.6, 1 mM EDTA + ethidium bromide at 0.5 µg/ml) was
used. Samples (between 2 to 5 µl) were mixed with 5µl of gel loading buffer
[0.25% bromophenol blue (w/v), 0.25% xylene cyanol (w/v), 30% glycerol (w/v)]
before loading. Gels were run at a constant 90 volts for 1 to 2 hours (Sambrook et
al., 1989).
DNA fragments on the gel were visualised using a UV transilluminator. The
sizes were estimated by comparison with a 1 kb ladder (Life Technologies Inc.)
standard DNA marker (1µg of DNA marker was used each time). The DNA
Ladder could also be used as a means of estimating the amount of DNA present in
a sample as the band at 1636 base pairs makes up 10 % (100 ng) of the total DNA
present in the marker used.

7
2.5 Polymerase Chain Reaction (PCR) for Amplification of DNA
PCR reactions were generally carry out in 50µl reaction. The components in the
PCR reactions are:
10x buffer with MgSO4(Promega) 5.0µl
dNTPs mix (10mM) 4.0µl
Forward primer (20pmol/µl) 1.0µl
Reverse primer (20pmol/µl) 1.0µl
DNA template variable(e.g.>0.5µg)
Pfu DNA polymerase (3u/µl)(Promega) 0.3µl
Sterile distilled water to final volume of 50µl
The amplification was carried out using a Techne Progene thermal cycler. The
program used was as follows:
Initial denaturation: 95oC 60 sec 1 cycle
Denaturation: 95oC 1.5mins
Annealing: between 50 to 55oC 40 sec 25 cycles
Extension: 72oC 1 mins
Final extension: 72oC 10 mins 1 cycle
Stop: 4oC

8
The exact parameters were dependent on a number of factors including estimated
length of the final product and predicted annealing temperature of the primers.
After completion the reaction mixture was electrophoresed on 0.8% agarose gel.
The primer concentration was calculated using the equation:-
Concentration(pmol/µl)=100 x Absorbance260nm x dilution factor of the DNA solution
A
Where A: (nA x 1.54) + (nG x 1.17) + (nT x 0.92) + (nC x 0.75); n= is the
number of that base in the oligodeoxyribonucleotide
2.6 DNA sequencing and oligodeoxyribonucleotoide synthesis
Sequencing was performed by the 1st Base Laboratory, Malaysia. Initial
sequencing of both strands was carried out using an Applied Biosystem PRISM ®
377 automated DNA sequencer by employing forward and reverse PCR primers.
Sequences were extended by designing downstream primers based on the
available determined sequence.
2.7 Preparation of cell-free extracts
Cell-free extracts were prepared from bacterial cells in mid- to late-exponential
phase of growth. Cells from 100ml culture were harvested by centrifugation at
10,000g for 10 minutes at 4oC. The cell pellets were resuspended in 20ml of
0.1M Tris-acetate buffer pH7.6 and centrifuged at 10,000g for 10 minutes at 4oC.
The cells were then resuspended in 4ml of 0.1M Tris-acetate buffer pH7.6 and
maintained at 0oC for ultrasonication in a Vibra CellsTM ultrasonicator, an
ultrasonic disintegrator at a peak amplitude λ=10 microns for 30 seconds.
Sonication of Rhizobium cell suspensions was generally carried out for 3x30
second periods, with 30 seconds cooling between each sonication. Unbroken

9
cells and cell wall material were removed by centrifugation at 20,000g for 15
minutes at 4oC.
2.8 Estimation of protein concentration
The protein concentration of crude cell extracts was measured using the biuret
method described by Gornall et al. (1949). A standard curve of protein
concentration was constructed using bovine serum albumin as reference. Cell-
free extract (200 µl) was added to the biuret reagent (800 µl) mixed and the
colour was allowed to develop for 30 minutes at room temperature before
measuring at A540nm against a blank made using 200µl buffer. An A540nm value of
0.1 corresponds to a protein concentration of 2 mg/ml. The concentration of
protein in column fractions was estimated by measurement of the A280nm
(Warburg and Christian, 1941).
2.9 Assay for dehalogenase activity
Dehalogenase activity was determined as total chloride released at 30oC in an
incubation mixture containing:
1- 0.1M Tris-acetate buffer(pH7.6) 4700µl
2- 0.1M halogenated aliphatic acid 50µl
3- Distilled water and enzyme
to a final volume of 5000µl
After 5 minutes equilibration at 30oC, the reaction was initiated by adding cell-
free extract. Samples (1.0ml) were removed at appropriate intervals and assayed
for halide ions.

10
2.10 Assay for halide ion
Measurement of free halide released during the dehalogenation reaction was
carried out by an adaptation of the method of Bergman and Sanik (1957).
Sample (1ml) was added into 100 µl of 0.25M ammonium ferric sulphate in 9M
nitric acid and mixed thoroughly. To this was added 100µl mercuric thiocyanate-
saturated ethanol and the solution was mixed by vortexing. The colour was
allowed to develop for 10 minutes and measured at A460nm in a Jenway 6300
Series spectrophotometer. Halide concentration was determined by comparison
of the absorbance of the test sample against a standard curve of known
concentrations of halide.
2.11 Standard curve for chloride and bromide ions
A standard curve for chloride ion was constructed using sodium chloride within
the range of 0-0.2µmol. A standard curve for bromide ion (Br-) using sodium
bromide was also constructed within the range of 0 -1.0 µmol Br-. Standards
were known concentrations of sodium chloride and sodium bromide in 100mM
Tris-acetate buffer pH 7.6 with colour developed as described in section 2.9.
Both standard curves are shown in Figure 2.1 (a) and (b).

11
0.00 0.05 0.10 0.15 0.200.00
0.05
0.10
0.15
0.20
0.25
0.30
0.35
Abs
orba
nce
460n
m
umolCl-
Figure 2.1. (a) Standard curve of Cl- concentration (0 - 0.2µmolCl-) against A460nm
0.0 0.2 0.4 0.6 0.8 1.00.0
0.5
1.0
1.5
2.0
2.5
Abso
rban
ce 46
0nm
umolBr-
Figure 2.1. (b) Standard curve of Br- concentration (0 – 1.0µmolBr-) against A460nm
µmolCl-/ml
µmolBr-/ml

12
2.12 HPLC analysis of growth medium
Samples of growth medium were analyzed using HPLC in order to monitor
disappearance of 2,2DCP. Samples were filtered through nitrocellulose 0.2 µM
filters (Sartorious) to remove bacteria cells and particles which could damage the
HPLC equipment.
Samples were separated using an isocratic elution with a mobile phase containing
potassium sulphate (20 mM): asetonitile (60:40) in deionized water. Samples
were detected with a UV detector equipped with a Supelco C-18 column (250 ×
4.6 mm, particle size of 5µm) using a flow rate of 2 ml/min.
2.13 Computer Analysis
International databases were searched using the BLAST programme (Altschul et
al., 1990) (http://www.ncbi.nlm.nih.gov). The 16S rRNA gene sequences was
compared with those in the EMBL database (Guenter et al.,, 1998) using
FASTA3 at the European Bioinformatics Institute (http://www.ebi.ac.uk) and
with those from the Ribosomal Data base Project by using SIMILARITY RANK
to identify closely related sequences (Maidak, et al., 1997).

13
CHAPTER 3
INVESTIGATION OF GROWTH OF RHIZOBIUM SP. AT LOW
CONCENTRATIONS OF HALOGENATED COMPOUND
3.1 Introduction
In relation to environmental pollution, many investigations have been conducted
about the global distribution of persistent organochlorines such as PCBs and
DDT. These contaminants are transportable and contaminate all over the world
(Iwata, et al., 1993). The destruction of organic chemicals by microorganisms
may be influenced by environmental factors or the structure of the chemical itself.
One of the reasons suggested for the lack of degradation of organic compounds by
microbes is their low concentration (Boethling and Alexander, 1979).
Microorganisms that metabolise and grow upon very low concentrations of
substrates have been designated as oligotrophs (Poindexter, 1981). Such
organisms appear to be adapted to low substrate concentrations by having high
substrate affinity (low Km value) systems. In our natural environment many of
the polluted substances degraded by microorganisms. Our investigation will
focus on Rhizobium sp. and its ability to degrade halogenated compound at low
substrate concentration.
3.2 Growth of Rhizobium sp. on 0.2mM 2,2-dichloropropionate (2,2DCP)
Rhizobium sp. was reported to grow on 2,2DCP, D,L2-CP and D,L2-BP as sole
sources of carbon and energy (Berry et al., 1979). However, growth did not
occur on 2,2DCP and D,L2-CP at concentrations in excess of 50mM or 20mM
respectively, suggesting toxicity of these compounds to the organism (Leigh,
1986). The normal 2,2DCP concentration used to grow Rhizobium sp. was

14
20mM. To investigate the ability of Rhizobium sp. to grow on low
concentrations of substrate, 0.2mM 2,2DCP, 100x lower than the normal growth
concentration, was used.
An initial experiment was carried out to establish whether Rhizobium sp. was able
to grow on 0.2mM 2,2DCP. The cell inoculum was prepared by growing
Rhizobium sp. in 20mM lactate minimal medium. Then 15ml of an overnight
culture was centrifuged and the cells washed twice with minimal medium before
inoculation into 100ml minimal medium supplied with 0.2mM 2,2DCP. Growth
was monitored by measuring the amount of chloride ions released at appropriate
time intervals. An uninoculated flask treated in the same way was used as a
control. This is important to make sure the chloride measured in the growth
medium was due to the cells using the 2,2DCP rather than the auto-degradation of
the substrate in the growth medium. A typical growth curve is shown in Figure
2.1(a) with a doubling time of approximately 12 hours. From the growth curve
the time to harvest cells was set between mid and late logarithmic phase so that at
harvesting the cells were still active and producing dehalogenase. For larger
scale preparation cells were grown in 8 flasks each with 500ml of medium
containing 0.2mM 2,2DCP as a carbon source.
As a control Rhizobium sp. grown in 20mM 2,2DCP was also prepared for use in
further analysis, as shown in Figure 2.1(b). A doubling time of approximately 11
hours was observed which was more or less the same doubling time for growth at
low concentration. Time for harvesting cells was set between mid and late
logarithmic phase similar to that for growth at low concentration.

15
0.01
0.1
1
0 6 12 18 24 30 36 42 48 54 60
Time(hours)
µmol
Cl- /m
l Rhizobium sp.
Control
Figure 3.1(a). Growth of Rhizobium sp. on 0.2mM 2,2DCP Rhizobium sp. : inoculated sample with Rhizobium sp.
Control : uninoculated sample
0.01
0.1
1
0 6 12 18 24 30 36 42 48 54 60 66 72 78 84
Time(hours)
A 680
nm
Rhizobium sp.
Figure 3.1(b). Growth of Rhizobium sp. on 20mM 2,2DCP

16
3.3 Analysis of cell-free extract from 0.2mM 2,2DCP-grown bacteria by
enzyme assay
Table 3.1 shows the dehalogenase specific activity for crude extracts prepared
from cells grown on 0.2mM 2,2DCP and on 20mM 2,2DCP. The substrates
chosen were based on the specificity of the three dehalogenases the organism is
known to produce. DBA is a substrate for DehL and DehE; 2,2DCP a substrate
for DehE; MCA a substrate for DehD and DehE; and D,L2-CP a substrate for all
three dehalogenases. The results suggest that similar dehalogenase enzymes
(DehL, DehE and DehD) are produced under the two growth conditions. The
dehalogenase specific activity using DBA as substrate for cells grown in 20mM
2,2DCP is twice that seen for growth at 0.2mM 2,2DCP. Since from the 2,2DCP
measurement the amount of DehE in each growth is the same, there must be more
DehL in the cells grown on 20mM 2,2DCPP. Such assays of crude extract may
not show the presence of any additional dehalogenase(s) in cells grown on low
concentration, so the crude extracts were checked by Km values analysis.
Table 3.1. Dehalogenase specific activity for crude extracts from cells grown
at low and high concentration
Substrates
0.2mM 2,2DCP-grown
bacteria
(µmolCl-/min/mg protein)
20mM 2,2DCP-grown
bacteria
(µmolCl-/min/mg protein)
Dibromoacetate (DBA) 0.66 1.40
2,2-dichloropropionate
(2,2DCP)
0.065 0.055
Monochloroacetate(MCA) 0.130 0.110
D,L-2-chloropropionate
(D,L2-CP)
0.22 0.23

17
3.4 Apparent Km values using crude extract prepared from cells grown on
20mM and 0.2mM 2,2DCP
The apparent Km values for extracts prepared from growth at high and low
concentration are shown in Figure 3.2 (a) and (b) using 2,2DCP as substrate. The
Km value was 0.18mM in both cases suggested the same dehalogenase might be
present in both growth conditions. However, further tests were not carried out
such as protein purification and N-terminal amino acid sequencing analysis to
confirm types of dehalogeasnes were present.

18
0 1 2 3 4 50,000
0,002
0,004
0,006
0,008
0,010
0,012
0,014
0,016
0,018
0,020
Km 0.18±0.066
umol
Cl- /m
l/min
mM
Figure 3.2 (a). Apparent Km using crude extract from Rhizobium sp. grown on high (20mM) concentration of 2,2DCP with 2,2DCP as substrate
(The crude extract was prepared in 0.1M Tris-acetate pH7.6 buffer)
0 1 2 3 4 50,000
0,002
0,004
0,006
0,008
0,010
0,012
0,014
0,016
0,018
0,020
0,022
0,024
0,026
Km 0.18±0.013
umol
Cl- /m
l/min
m M
Figure 3.2(b). Apparent Km using crude extract from Rhizobium sp. grown
on low (0.2mM) concentration of 2,2DCP with 2,2DCP as substrate
(The crude extract was prepared in 0.1M Tris-acetate pH7.6 buffer)
19
3.5 Discussion
The Rhizobium sp. was able to grow on 0.2mM 2,2DCP with a doubling time of
approximately 12 hours, similar to the growth rate obtained at 20mM 2,2DCP
concentration indicating that the organism was a facultative oligotroph.
Dehalogenases produced during growth on 0.2mM 2,2DCP were analysed by Km
analysis to investigate whether growth at low concentration may involve a new
dehalogenase enzyme. The Km values were found similar for both growth at
high and low substrate concentration.
Maybe further investigation needs to be carried out to determine the N-terminal
sequence of each dehalogenase that was present from growth at low 2,2DCP
concentration to check its identity.
Rhizobium sp. is the only bacteria reported produced more than one
dehalogenases (DehD, DehE and DehL) when grown on 2,2DCP. According to
Leigh (1986) when Rhizobium sp. grown on 20mM 2,2DCP as sole source of
carbon and energy revealed three dehalogenases although DehL and DehD did not
play any role in 2,2DCP degradation. In other cases variation in growth
condition influenced the nature of dehalogenase production (Hardman and Slater
(1981a). According to Allison et al., (1983) different inducers gave different
pattern of induction compare to 2,2DCP and it was seen in the current
investigation that similar amounts of dehalogenases were observed when growth
was at high and low 2,2DCP concentration.

20
3.6 Conclusion
The present investigation did not show any new dehalogenase from growth at low
haloalkanoic acid concentration. The low Km value for 2,2DCP of DehE
(0.19mM) as reported earlier (Fahrul et al., 2004) would seem clear DehE enzyme
suited to dealing with low concentrations of growth substrate and no other
enzyme would appear to be necessary.

21
CHAPTER 4
ISOLATION AND CHARACTERIZATION OF 2,2DCP DEGRADING
BACTERIA
4.1 Introduction
Halogenated compounds are extensively used as herbicides, insecticides,
fungicides, insulators and lubricants (Chapelle, 1993). Dalapon or 2,2-
dichloropropionic acid (2,2DCP) is an example of herbicide and plant growth
regulator that used to control specific annual and perennial grasses like
Quackgrass, Bermuda grass, Johnson grass as well as rushes. It is selective,
meaning that it kills only certain plants, while sparing non-target types of
vegetation (Ashton and Crafts, 1973).
Generally, 2,2DCP is not readily bind or adsorb to soil particles. Even in muck
soil, as little as 20% of applied 2,2DCP may adsorb. Since it is not adsorb to soil
particles, 2,2DCP had a high degree of mobility in all soil types and leaching does
occur. However, 2,2DCP movement in soil may prevented by rapid breakdown of
the herbicide into naturally-occurring compound by soil microorganisms.
Biodegradation is the main route of 2,2DCP disappearance from soil.
22
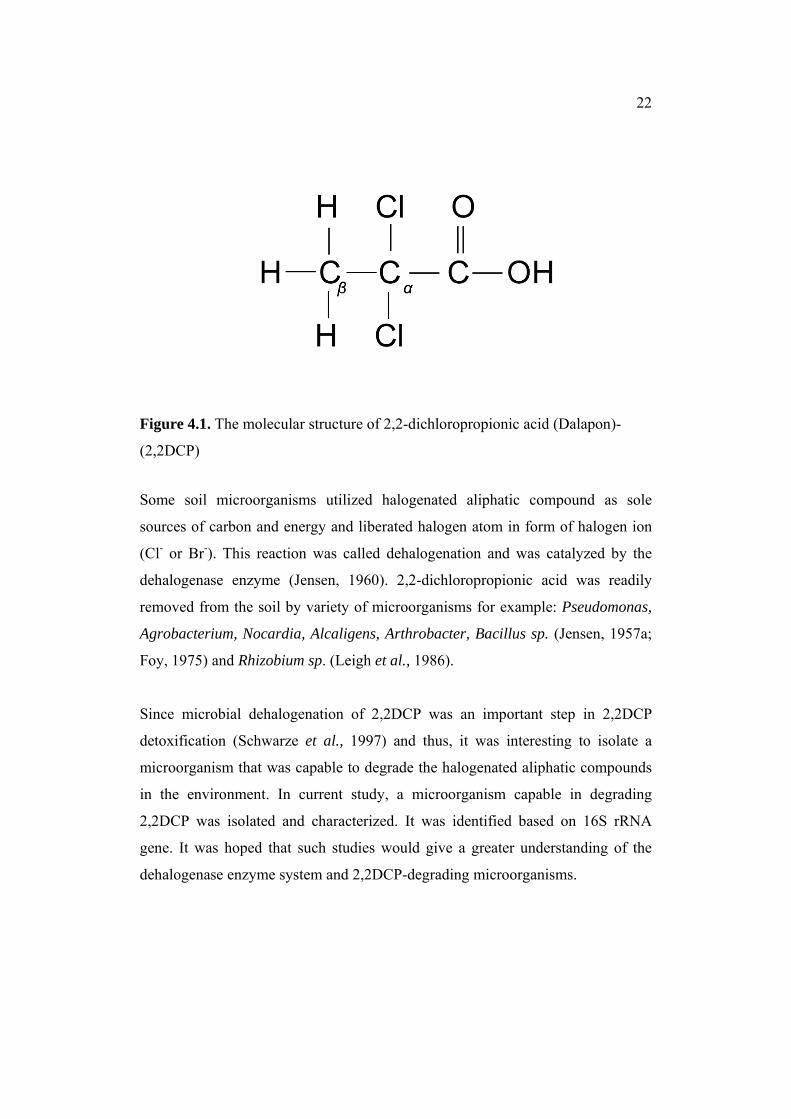
Figure 4.1. The molecular structure of 2,2-dichloropropionic acid (Dalapon)-
(2,2DCP)
Some soil microorganisms utilized halogenated aliphatic compound as sole
sources of carbon and energy and liberated halogen atom in form of halogen ion
(Cl- or Br-). This reaction was called dehalogenation and was catalyzed by the
dehalogenase enzyme (Jensen, 1960). 2,2-dichloropropionic acid was readily
removed from the soil by variety of microorganisms for example: Pseudomonas,
Agrobacterium, Nocardia, Alcaligens, Arthrobacter, Bacillus sp. (Jensen, 1957a;
Foy, 1975) and Rhizobium sp. (Leigh et al., 1986).
Since microbial dehalogenation of 2,2DCP was an important step in 2,2DCP
detoxification (Schwarze et al., 1997) and thus, it was interesting to isolate a
microorganism that was capable to degrade the halogenated aliphatic compounds
in the environment. In current study, a microorganism capable in degrading
2,2DCP was isolated and characterized. It was identified based on 16S rRNA
gene. It was hoped that such studies would give a greater understanding of the
dehalogenase enzyme system and 2,2DCP-degrading microorganisms.

23
4.2 Isolation of 2,2DCP degrading bacteria A mixed culture from UTM plantation was streaked onto 20 mM 2,2DCP PJC
minimal medium. Three morphologically different colonies were observed.
Colonies formed were repeatedly streaked on the same type of medium. Only one
of them grew well in 2,2DCP PJC liquid medium minimal medium and picked for
further analysis. This bacterium was designated as Bacterium B.
4.3 Identification of bacterium B by 16S gene sequencing
4.3.1 DNA analysis of Bacterium B
Genomic DNA of bacterium B was prepared using Wizard genomic DNA kit
(promega). Figure 4.2 showed the genomic DNA prepared from bacterium B.
PCR reaction was carried out using the prepared genomic DNA as a template for
16S rRNA gene amplification. The fragment amplified was approximately 1.6 kb.
The PCR condition generated a single fragment, with appropriate controls.

24
Figure 4.2. Agarose gel electrophoresis of undigested genomic DNA and 16S
rRNA gene fragment
Lane 1: Genomic DNA (0.25 µg/µl) prepared from bacterium B
Lane 2: The amplified 16S rRNA DNA fragment
Lane 3: Negative control without DNA template
Lane 4: Negative control without FD1 primer
Lane 5: Negative control without rP1 primer
Lane 6: 1 KB DNA ladder (Invitrogen)
Lane 1 2 3 4 5 6
kb

25
4.3.2 Sequencing of the PCR Product
The 16S rRNA gene fragment was sequenced using FD1 and rP1 primers. Figure
4.3 showed the partial nucleotide sequence of 16S rRNA gene from the isolated
bacterium. The sequence comprises of 1307 nucleotides lacking the very proximal
5’ and terminal 3’ regions corresponding to the universal primers used. This
sequence was submitted to the GenBank with accession number of AM231910
(Appendix A).
The 16S rRNA gene sequence was compared to the sequences in the GenBank
database. The result revealed that the 2,2DCP degrading bacteria matched 99%
identity with Methylobacterium sp. (Figure 4.4). From the results obtained, it was
clear that the bacterium B belongs to Methylobacterium sp. It shared 99 %
identity to the series of bacteria listed in the database (Table 4.1).

26
1 tgagtaacgc gtgtgaacgt gccttccggt tcggaataac cctgggaaac tagggctaat
61 accggatacg cccttatggg gaaaggttta ctgccggaag atcggcccgc gtctgattag
121 ctagttggtg gggtaacggc ctaccaaggc gacgatcagt agctggtctg agaggatgat
181 cagccacact gggactgaga cacggcccag actcctacgg gaggcagcag tggggaatat
241 tggacaatgg gcgcaagcct gatccagcca tgccgcgtga gtgatgaagg ccttagggtt
301 gtaaagctct tttatccggg acgataatga cggtaccgga ggaataagcc ccggctaact
361 tcgtgccagc agccgcggta atacgaaggg ggctagcgtt gctcggaatc actgggcgta
421 aagggcgcgt aggcggcgtt ttaagtcggg ggtgaaagcc tgtggctcaa ccacagaatg
481 gccttcgata ctgggacgct tgagtatggt agaggttggt ggaactgcga gtgtagaggt
541 gaaattcgta gatattcgca agaacaccgg tggcgaaggc ggccaactgg accattactg
601 acgctgaggc gcgaaagcgt ggggagcaaa caggattaga taccctggta gtccacgccg
661 taaacgatga atgccagctg ttggggtgct tgcaccgcag tagcgcagct aacgctttga
721 gcattccgcc tggggagtac ggtcgcaaga ttaaaactca aaggaattga cgggggcccg
781 cacaagcggt ggagcatgtg gtttaattcg aagcaacgcg cagaacctta ccatcctttg
841 acatggcgtg ttacccagag agatttgggg tccacttcgg tggcgcgcac acaggtgctg
901 catggctgtc gtcagctcgt gtcgtgagat gttgggttaa gtcccgcaac gagcgcaacc
961 cacgtcctta gttgccatca ttcagttggg cactctaggg agactgccgg tgataagccg
1021 cgaggaaggt gtggatgacg tcaagtcctc atggccctta cgggatgggc tacacacgtg
1081 ctacaatggc ggtgacagtg ggacgcgaag gagcgatctg gagcaaatcc ccaaaagccg
1141 tctcagttcg gattgcactc tgcaactcga gtgcatgaag gcggaatcgc tagtaatcgt
1201 ggatcagcat gccacggtga atacgttccc gggccttgta cacaccgccc gtcacaccat
1261 gggagttggt cttacccgac ggcgctgcgc caaccgcaag gaggcag
Figure 4.3. Bacterium B 16S rRNA partial sequence lacking the very proximal 5’
and terminal 3’ regions (Accession number AM 231910)

27
Bacterium B 1 TGAGTAACNCGTGTGAACGTGCCTTCCGGTTCGGAATAACCCTGGGAAACTAGGGCTAAT 60 |||||||| |||| |||||||||||||||||||||||||||||||||||||||||||||| Methylobacterium 69 TGAGTAACGCGTGGGAACGTGCCTTCCGGTTCGGAATAACCCTGGGAAACTAGGGCTAAT 128 Bacterium B 61 ACCGGATACGCCCTTATGGGGAAAGGTTTACTGCCGGAAGATCGGCCCGCGTCTGATTAG 120 |||||||||||||||||||||||||||||||||||||||||||||||||||||||||||| Methylobacterium 129 ACCGGATACGCCCTTATGGGGAAAGGTTTACTGCCGGAAGATCGGCCCGCGTCTGATTAG 188 Bacterium B 121 CTAGTTGGTGGGGTAACGGCCTACCAAGGCGACGATCAGTAGCTGGTCTGAGAGGATGAT 180 |||||||||||||||||||||||||||||||||||||||||||||||||||||||||||| Methylobacterium 189 CTAGTTGGTGGGGTAACGGCCTACCAAGGCGACGATCAGTAGCTGGTCTGAGAGGATGAT 248 Bacterium B 181 CAGCCACACTGGGACTGAGACACGGCCCAGACTCCTACGGGAGGCAGCAGTGGGGAATAT 240 |||||||||||||||||||||||||||||||||||||||||||||||||||||||||||| Methylobacterium 249 CAGCCACACTGGGACTGAGACACGGCCCAGACTCCTACGGGAGGCAGCAGTGGGGAATAT 308 Bacterium B 241 TGGACAATGGGCGCAAGCCTGATCCAGCCATGCCGCGTGAGTGATGAAGGCCTTAGGGTT 300 |||||||||||||||||||||||||||||||||||||||||||||||||||||||||||| Methylobacterium 309 TGGACAATGGGCGCAAGCCTGATCCAGCCATGCCGCGTGAGTGATGAAGGCCTTAGGGTT 368 Bacterium B 301 GTAAAGCTCTTTTATCCGGGACGATAATGACGGTACCGGAGGAATAAGCCCCGGCTAACT 360 |||||||||||||||||||||||||||||||||||||||||||||||||||||||||||| Methylobacterium 369 GTAAAGCTCTTTTATCCGGGACGATAATGACGGTACCGGAGGAATAAGCCCCGGCTAACT 428 Bacterium B 361 TCGTGCCAGCAGCCGCGGTAATACGAAGGGGGCTAGCGTTGCTCGGAATCACTGGGCGTA 420 ||||||||||||||||||||||||||||||||||||||||||||||||||||||||||| Methylobacterium 429 CCGTGCCAGCAGCCGCGGTAATACGAAGGGGGCTAGCGTTGCTCGGAATCACTGGGCGTA 488 Bacterium B 421 AAGGGCGCGTAGGCGGCGTTTTAAGTCGGGGGTGAAAGCCTGTGGCTCAACCACAGAATG 480 |||||||||||||||||||||||||||||||||||||||||||||||||||||||||||| Methylobacterium 489 AAGGGCGCGTAGGCGGCGTTTTAAGTCGGGGGTGAAAGCCTGTGGCTCAACCACAGAATG 548 Bacterium B 481 GCCTTCGATACTGGGACGCTTGAGTATGGTAGAGGTTGGTGGAACTGCGAGTGTAGAGGT 540 |||||||||||||||||||||||||||||||||||||||||||||||||||||||||||| Methylobacterium 549 GCCTTCGATACTGGGACGCTTGAGTATGGTAGAGGTTGGTGGAACTGCGAGTGTAGAGGT 608 Bacterium B 541 GAAATTCGTAGATATTCGCAAGAACACCGGTGGCGAAGGCGGCCAACTGGACCATTACTG 600 |||||||||||||||||||||||||||||||||||||||||||||||||||||||||||| Methylobacterium 609 GAAATTCGTAGATATTCGCAAGAACACCGGTGGCGAAGGCGGCCAACTGGACCATTACTG 668 Bacterium B 601 ACGCTGAGGCGCGAAAGCGTGGGGAGCAAACAGGATTAGATACCCTGGTAGTCCACGCCG 660 |||||||||||||||||||||||||||||||||||||||||||||||||||||||||||| Methylobacterium 669 ACGCTGAGGCGCGAAAGCGTGGGGAGCAAACAGGATTAGATACCCTGGTAGTCCACGCCG 728 Bacterium B 661 TAAACGATGAATGCCAGCTGTTGGGGTGCTTGCACCGCAGTAGCGCAGCTAACGCTTTGA 720 |||||||||||||||||||||||||||||||||||||||||||||||||||||||||||| Methylobacterium 729 TAAACGATGAATGCCAGCTGTTGGGGTGCTTGCACCGCAGTAGCGCAGCTAACGCTTTGA 788 Bacterium B 721 GCATTCCGCCTGGGGAGTACGGTCGCAAGATTAAAACTCAAAGGAATTGACGGGGGCCCG 780 |||||||||||||||||||||||||||||||||||||||||||||||||||||||||||| Methylobacterium 789 GCATTCCGCCTGGGGAGTACGGTCGCAAGATTAAAACTCAAAGGAATTGACGGGGGCCCG 848 Bacterium B 781 CACAAGCGGTGGAGCATGTGGTTTAATTCGAAGCAACGCGCAGAACCTTACCATCCTTTG 840 |||||||||||||||||||||||||||||||||||||||||||||||||||||||||||| Methylobacterium 849 CACAAGCGGTGGAGCATGTGGTTTAATTCGAAGCAACGCGCAGAACCTTACCATCCTTTG 908 Bacterium B 841 ACATGGCGTGTTACCCAGAGAGATTTGGGGTCCACTTCGGTGGCGCGCACACAGGTGCTG 900 |||||||||||||||||||||||||||||||||||||||||||||||||||||||||||| Methylobacterium 909 ACATGGCGTGTTACCCAGAGAGATTTGGGGTCCACTTCGGTGGCGCGCACACAGGTGCTG 968 Bacterium B 901 CATGGCTGTCGTCAGCTCGTGTCGTGAGATGTTGGGTTAAGTCCCGCAACGAGCGCAACC 960 |||||||||||||||||||||||||||||||||||||||||||||||||||||||||||| Methylobacterium 969 CATGGCTGTCGTCAGCTCGTGTCGTGAGATGTTGGGTTAAGTCCCGCAACGAGCGCAACC 1028 Bacterium B 961 CACGTCCTTAGTTGCCATCATTCAGTTGGGCACTCTAGGGAGACTGCCGGTGATAAGCCG 1020 |||||||||||||||||||||||||||||||||||||||||||||||||||||||||||| Methylobacterium 1029 CACGTCCTTAGTTGCCATCATTCAGTTGGGCACTCTAGGGAGACTGCCGGTGATAAGCCG 1088 Bacterium B 1021 CGAGGAAGGTGTGGATGACGTCAAGTCCTCATGGCCCTTACGGGATGGGCTACACACGTG 1080 |||||||||||||||||||||||||||||||||||||||||||||||||||||||||||| Methylobacterium 1089 CGAGGAAGGTGTGGATGACGTCAAGTCCTCATGGCCCTTACGGGATGGGCTACACACGTG 1148

28
Bacterium B 1081 CTACAATGGCGGTGACAGTGGGACGCGAAGGAGCGATCTGGAGCAAATCCCCAAAAGCCG 1140 |||||||||||||||||||||||||||||||||||||||||||||||||||||||||||| Methylobacterium 1149 CTACAATGGCGGTGACAGTGGGACGCGAAGGAGCGATCTGGAGCAAATCCCCAAAAGCCG 1208 Bacterium B 1141 TCTCAGTTCGGATTGCACTCTGCAACTCGAGTGCATGAAGGCGGAATCGCTAGTAATCGT 1200 |||||||||||||||||||||||||||||||||||||||||||||||||||||||||||| Methylobacterium 1209 TCTCAGTTCGGATTGCACTCTGCAACTCGAGTGCATGAAGGCGGAATCGCTAGTAATCGT 1268 Bacterium B 1201 GGATCAGCATGCCACGGTGAATACGTTCCCGGGCCTTGTACACACCGCCCGTCACACCAT 1260 |||||||||||||||||||||||||||||||||||||||||||||||||||||||||||| Methylobacterium 1269 GGATCAGCATGCCACGGTGAATACGTTCCCGGGCCTTGTACACACCGCCCGTCACACCAT 1328 Bacterium B 1261 GGGAGTTGGTCTTACCCGACGGCGCTGCGCCAACCGCAAGGAGGCAG 1307 ||||||||||||||||||||||||||||||||||||||||||||||| Methylobacterium 1329 GGGAGTTGGTCTTACCCGACGGCGCTGCGCCAACCGCAAGGAGGCAG 1375
Figure 4.4. Sequence comparison for bacterium B 16S ribosomal RNA gene
(percent identity: 99 %)
Table 4.1. Top 5 entries in the database that showed highest identity to
bacterium B
Bacteria Sequence Identity
Methylobacterium sp. F05 99%
Methylobacterium sp. F15 99%
Methylobacterium fujisawaense 99%
Methylobacterium sp. F73 99%
Methylobacterium sp. A1 99%

29
4.4 Bacteria morphology, staining and biochemical characterization
The identification of bacterium B using 16S rRNA gene sequence was supported
by the bacterial staining and biochemical analysis. Bacterium B colony was
observed as a rough surface, a smooth margin and a raised elevation. It formed
pink colonies on nutrient agar and 2,2-dichloropropionate minimal medium
(Table 4.2). It was a gram-negative rod bacterium. The cells were acid-fast and no
spores were demonstrated by malachite green staining. Bacterium B also
demonstrated its ability in utilizing lactose, gelatin liquefaction, producing
catalase, oxidase, motile and grew on citrate (Table 4.3). The biochemical test
results were compared to Bergey’s Manual of Systematic Bacteriology (Holt et
al., 1994) and were agreeing well with the finding of 16S rRNA analysis of
bacterium B as Methylobacterium sp.
Table 4.2. Colony characteristic on 2,2DCP PJC minimal medium
Characteristics Observation
Size of colony Small
Pigmentation pink
Form (Shape of the colony) Smooth Circular
Margin (Outer edge of colony) Entire (Sharply defined, even)
Elevation Raised (Slightly elevated)

30
Table 4.3. Morphological and biochemical characteristics of Methylobacterium
sp.
Biochemical test and staining Result
Gram Stain Gram negative
Acid Fast Positive (Blue)
Spore Stain No Spore
Grow Behavior Aerobic
Oxidase Positive
Catalase Positive
Citrate Positive
Gelatin Liquefaction Positive
Lactose Utilization Positive
Motility Positive
4.5 Growth of Methylobacterium sp. in 2,2DCP PJC minimal medium
Methylobacterium sp. was inoculated into 100 ml PJC minimal liquid medium
containing 5 mM, 10 mM, 20 mM and 40 mM 2,2DCP as sole source of carbon,
respectively. The flask was incubated at 30°C in a rotary incubator with 180 rpm.
The maximum growth was achieved in 20mM 2,2DCP PJC minimal medium.
Figure 4.5 showed the growth patterns of bacteria in different 2,2DCP
concentration. Methylobacterium sp. grew readily on 5 to 20 mM 2,2DCP.
However, no growth was observed when growth at 40 mM suggested that the
substrate was toxic to the cell at higher concentration. The cell doubling time was
calculated for each growth curve as summarized in Table 4.4.

31
Figure 4.5. Growth curves on 5, 10, 20 and 40 mM 2,2DCP for
Methylobacterium sp.
(Values are a mean of triplicate determinations).
Table 4.4. Growth properties of bacteria in different 2,2DCP concentration
Substrate Concentration
Highest A680nm Doubling time
5 mM 0.279 24.27
10 mM 0.499 19.67
20 mM 1.052 22.80
40 mM 0.122 NG
*NG: no growth

32
4.6 Growth of Methylobacterium sp. in other halogenated compounds
Table 4.5 showed growth at various types of halogenated compound. Both of
these compounds failed to support growth at 40mM in liquid PJC minimal media.
The compounds were toxic to the cell at higher concentration.
Figure 4.6 showed the growth curves of Methylobacterium sp. when grown on
2,2-dichloropropionate and D,L-2-chloropropionate, with doubling time of 22 and
26 hours, respectively. This experiment suggested that Methylobacterium sp.
could only act on chloride attached to carbon number 2.
Table 4.5. Growth properties of Methylobacterium sp. in different substrates
Substrate A 680nm Growth doubling times
3-chloropropionate NG NG
D,L-2-chloropropionate 1.091 26.40 hours
2,2-dichloropropionate 1.052 22.80 hours
2,3-dichloropropionate NG NG
3-bromopropionate NG NG
NG : No Growth

33
Figure 4.6. Grow curve of Methylobacterium sp. when grown on different types
halogenated substrate. (Values are a mean of triplicate determinations).

34
4.7 HPLC Analysis of Growth Medium
4.7.1 2,2DCP Calibration Curve
A standard curve was constructed from a series of known concentration of 2,2-
dichloropropionate (2,2DCP) within the range of 0 to 20 mM. Table 4.6 showed
the data used to construct the calibration curve for 2,2-dichloropropionate
whereas Figure 4.7 showed the calibration curve constructed.
Table 4.6. Data used to construct the 2,2DCP calibration curve
No Peak Name Level Mean Area Amount
1 2,2DCP 1 56.236 5 mM
2 2,2DCP 2 130.323 10 mM
3 2,2DCP 3 274.321 20 mM
Figure 4.7. Calibration curve for 2,2DCP

35
4.7.2 Detection of 2,2DCP in growth medium Methylobacterium sp. was grown in 20 mM 2,2DCP PJC minimal medium.
Growth medium was then analyzed using HPLC at daily intervals to monitor the
presence of 2,2DCP. The chromatogram showed the area of the peak
corresponding to 2,2DCP decreased from 20 mM at day 0 to 0 mM at day 4. The
results were summarized in Table 4.7.
Table 4.7. Comparison between the 2,2DCP consumed and turbidity of
Methylobacterium growth medium. (Values are a mean of triplicate
determinations).
Days Bacteria Growth
(A680nm)
Amount of 2,2DCP left
0 0.102 100 %
1 0.199 86 %
2 0.428 72 %
3 0.712 35%
4 1.302 0%
36
From the results obtained, it was concluded that 2,2DCP was fully utilized and
depleted by Methylobacterium sp. The traces of 2,2DCP was not observed in the
growth medium after 4 days of incubation period. Nevertheless, depletion of
2,2DCP was coupled with bacteria growth suggested that 2,2DCP was carbon and
energy source for Methylobacterium sp. Figure 4.8 showed the peak of 2,2DCP in
the chromatogram dropped from day 0 to day 4.

37
(i)
(ii)
(iii)
Figure 4.8. HPLC elution profile of medium from cells utilizing 2,2DCP as source of carbon. Medium was
analysed at i) day 0, ii) day 2 and (iii) day 4

38
4.7.3 Dehalogenase activity in cell free extracts of 2,2DCP grown bacteria
Cell free extracts were prepared from bacteria grown on 2,2DCP as sole carbon
source and were assayed for dehalogenase activity using 1 mM 2,2DCP as
substrate. By measuring the rate of chloride ion released from the substrate
(Figure 4.9), the average specific activity of dehalogenase on these extracts was
found to be 0.039 µmol Cl-/min/mg protein. Details as in Appendix B.

39
4.8 Discussion
In current investigation, 16S rRNA of 2,2DCP degrading bacteria shared 99% to
Methylobacterium sp. Since any identification close to 99% is well above
acceptance level, it was possible to confirm that the 2,2DCP degrading bacteria
belongs to Methylobacterium sp. In addition, this was supported by staining
properties and biochemical analysis.
The 2,2DCP degrading bacteria belongs to genus Methylobacterium was
supported by its novel ability to produce pink pigment. Certain Methylobacterium
species are known to be pink-pigmented bacteria that produce so called pink
slime. For example, a Methylobacterium sp. which is known to be responsible for
so called pink slime produced a (10→3)-galactan polysaccharide (EPS) was
described by Verhoef et al. (2003).
Methylobacterium is a facultative Methylobacteriumlotroph, meaning it has the
ability to grow by reducing carbon compounds with one or more carbon atoms but
no carbon-carbon bonds (Madigan et al., 2003). It grows on
methylobacteriumlamine, methanol, and C2, C3, and C4 compounds, including the
methanol emitted by the stomata of plants. They are non-motile rod-shaped and
are obligate aerobic; they are also called PPFMs - pink-pigmented facultative
Methylobacteriumlotrophs.
Methane is the end product of anaerobic degradation of organic matter; therefore,
methane-oxidizing bacteria can be found using this methane in such habitats as in
wetland rice fields (Eller and Frenzel, 2001). This bacterium can be found mostly
in soils, on leaves and in other parts of plants (Lidstrom and Christoserdova,
2002; Aken et al., 2004), or even dust, air, freshwater and aquatic sediments
(Gallego et al., 2005). One species, Methylobacterium podarium, is thought to be
part of the natural human foot microflora. Methylobacterium have even been

40
found living inside the human mouth. Samples have been isolated from the
tongue, supra- and subgingival plaques that have shown growth of
Methylobacterium, especially M. thiocyanatum.
Methylobacterium was well known for their ability in degrading chloromethane or
dichloromethane as the sole carbon and energy source (Vannelli et al., 1998,
1999; Studer, 2001; McDonald et al., 2002). However, no Methylobacterium that
able to degrade 2,2DCP was reported so far.
There are four basic criteria which must be fulfilled in order for a given
halogenated compound to be utilized by an organism as sole source of carbon and
energy. Firstly, the organism must either possess or synthesize dehalogenase in
response to the halogenated compound which is capable of removing the
substituent halogen(s) from the compound. Secondly, the dehalogenation product
should be non-toxic and easily converted to an intermediate of the organism’s
central metabolic pathway. Thirdly, the halogenated compound should be able to
enter cell either passively or by active transport in order to reach the site of
dehalogenase activity, and finally, the halogenated compound should be non-toxic
to the organism at normal intracellular concentrations.
When Methylobacterium sp. grew on 2,2DCP and D,L-2-chloropropionate
(D,L2CP) as sole source of carbon and energy, the above criteria were satisfied.
Of these compounds, the isolate grew more rapidly on 2,2DCP compared to
D,L2CP. Both halogenated compound failed to support growth at concentration
exceeding 40mM; presumably the intracellular concentration of halo-aliphatic
acid had reached a toxic level.
Senior et al.,(1976) reported that Pseudomonas putida PP3 utilized 0.5 g carbon
L-1 of 2,2DCP as sole carbon source with specific growth rates 8.33 hours in
continuous culture. However, mean generation time for P. putida PP3 growing on

41
2,2DCP closed culture system was not mentioned. Allison (1981), reported that
growth of Rhizobium sp. on 2,2DCP closed culture system with the doubling time
of 12 hours. In current study, the doubling time of Methylobacterium in the same
substrate was around 20 hours, or 2 times slower compared to Rhizobium sp. The
difference maybe due to different affinity towards 2,2DCP between the two
organisms.
Allison (1981) described that differential plots of culture extinction at 680 nm
against medium chloride ion concentration were linear during exponential growth
of Rhizobium sp. in 2,2DCP PJC minimal medium, indicating that the rate of
2,2DCP dehalogenation was proportional to the growth rate of the Rhizobium sp.
Since 2,2DCP was the sole carbon source in the experiment, the results also
indicated that the dehalogenation product was being utilized by the organism for
metabolism and growth.
In order to further confirm the relationship between the 2,2DCP and bacterial
growth, HPLC was employed in current study. The degradation and utilization of
2,2-dichloropropionate was initiated from the beginning of the growth. Table 4.7
clearly illustrates that when the bacteria number increased in the growth medium,
2,2DCP concentration dropped gradually. HPLC results suggested that growth of
the bacterium in the medium was proportional to the utilization of 2,2DCP in the
PJC growth medium.
Dehalogenase activity was detected in cell-free extracts of Methylobacterium sp.
grown on 2,2DCP by measuring the rate of halide ion released from the substrate.
Specific activity was expressed as µmol Cl-/min/mg protein. The specific activity
of dehalogenase present in Methylobacterium was 0.039 µmol Cl-/min/mg
protein.The average specific activity of dehalogenase in cell free extract of

42
Rhizobium sp. described by Allison (1981) was found to be 0.243 µmol Cl-
/min/mg protein. In current study, specific activities of dehalogenase present in
Methylobacterium crude cell free extract was 82% lower compared to Rhizobium
sp. Since Methylobacterium sp. was a slow grower (40% slower as described
earlier) compared to Rhizobium sp, it was not surprised that specific activity of
dehalogease from Methylobacterium sp. had much lower enzyme specific activity.
Nevertheless, in a recent study by Schwarze et al. (1997), two Agrobacterium
tumefaciencs species, A. tumefaciens RS4 and A. tumefaciens RS5 were found to
grow on 2,2DCP with a doubling time of 8.5 and 4.7 hours, respectively. Their
dehalogenase specific activity in crude extract were 0.247 µmol Cl-/min/mg
protein and 0.647 µmol Cl-/min/mg protein, respectively. This indicated that the
growth rate was correlated with dehalogenase specific activity. Slower growth
rate in Methylobacterium sp. in current study was caused by lower dehalogenase
activity.
4.9 Conclusion
A bacterial species isolated from soil that able to degrade 2,2DCP was identified
as Methylobacterium sp. based on 16S rRNA gene analysis. This was the first
reported strain that able to grow on 2,2DCP since Methylobacterium was
facultative Methylobacteriumlotroph for example some strains were able to
degrade chloromethane and dichloromethane but no Methylobacterium was
reported to degrade 2,2DCP so far. The ability of Methylobacterium sp. in
degrading 2,2DCP was confirmed by HPLC analysis. Other than 2,2DCP the
bacteria also grew well in D,L2CP. However, it could not grow in other
compound which differed in halogen substitution position such as 3-
chloropropionate (3CP) and 3-bromopropionate (3BP). This suggested that the
bacteria dehalogenase system could only act on β-halocarboxylic acids. Finally,
production of dehalogenase enzyme by Methylobacterium was confirmed by
enzyme assay. Crude cell free extract of Methylobacterium showed week activity

43
toward 2,2DCP with specific activity of 0.039 µmol Cl-/min/mg protein. This
agreed by the slow growth in 20 mM 2,2DCP PJC minimal medium.

44
REFERENCES Aken, B.V., Peres, C. V., Doty, S. L., Jong, M. Y. and chnoor, J. L. (2004).
Methylobacterium populi sp. nov., a novel aerobic, pink-pigmented, facultatively
methylotrophic, methane-utilizing bacterium isolated from poplar trees (Populus
deltoidesxnigra DN34). Int J Syst Evol Microbiol. 54: 1191-119.
Allison, N. (1981). Bacterial Degradation of Halogenated Aliphatic Acids. Trent
Polytechnic: Ph.D. Thesis.
Allison, N., Skinner, A.J. and Cooper, R.A. (1983) The dehalogenases of a 2,2 dichloropropionate degrading bacterium. J. Gen. Microbiol. 129:1283-1293
Ashton, F. M. and Crafts, A. S. (1973). Mode of Action of Herbicides. New York:
Wiley & Sons.
Bergman, J.G. and Sanik, J. (1957) Determination of trace amounts of chlorine in naptha. Anal. Chem. 29: 241-243 Berry, E.K.M, Allison, N., Skinner, A.J. and Cooper, R.A. (1979) Degradation of the selective herbicide 2,2-dichloropropionate (Dalapon) by a soil bacterium. Journal of General Microbiology 110 : 39-45 Boethling, R.S. and Alexander, M. (1979) Effect of concentration of organic chemicals on their biodegradation by natural microbial communities. Appl. Env. Microbiol. 37(6):1211-1216
Chapelle, F. H. (1993). Ground Water Microbiology and Geochemistry. New
York: John Wiley and Sons.
Dubinina, G.A. (1977) Biologija zhelezobakterii ich geologicheskaja dejatelnost. PhD. Thesis. Inst. Microbiol. Moscow. pp 393.

45
Eller, G. and Frenzel, P. (2001). Changes in Activity and Community Structure of
Methane-Oxidizing Bacteria over the Growth Period of Rice. Applied and
Environmental Microbiology. 67(6): 2395-2403.
Fahrul Z. Huyop, Tan Yea Yusn, Marcells Ismail, Roswanira A.B. Wahab and Ronald Cooper (2004) Overexpression and characterization of non-stereospecific haloacid Dehalogenase (E) DehE of Rhizobium sp. Asia Pacific Journal of Molecular Biology and Biotechnology 12(1&2):15-20 Fauzi, A.M. Hardman, D.J. and Bull A.T. (1996) Biodehalogenation of low concentrations of 1,3dichloropropanol by mono and mixed cultures of bacteria. Appl. Microbiol. Biotechnol. 46:660-666
Foy, C. L. (1975). The Chlorinated Apliphatic Acids in Herbicides-Chemistry,
Degradation and Mode of Action. In: Kearney, P. C. and Kaufman, D. D. ed.
Herbicides: Chemistry, degradation And Mode Of Action Second Edition. New
York: M. Dekker. 339-452.
Gallego, V., García, M. T. and Ventosa, A. (2005). Methylobacterium variabile
sp. Nov., A Methylotrophic Bacterium Isolated from an Aquatic Environment. Int
J Syst Evol Microbiol. 55: 1429-1433.
Gornall, A.G., Bardawill, C.J. and David, M.M. (1949) Determination of serum proteins by means of the biuret reaction. J. Biol. Chem. 177: 751-766 Hardman, D.J. and Slater, J.H. (1981a) Dehalogenases in soil bacteria. J. Gen. Microbiol. 123:117-128 Hardman, D.J. and Slater, J.H. (1981b) The dehalogenase complement of a soil pseudomonad grown in closed and open cultures on haloalkanoic acids. J. Gen. Microbiol. 127:399-405

46
Hartke, A., Giard, J.C., Laplace, J. and Auffray, Y., (1998) Survival of Enterococcus faecalis in an oligotrophic microcosm: changes in morphology, development of general stress resistance, and analysis of protein synthesis. App. Env. Microbiol. 64(11):4238-4245. Hareland , W.A., Crawford, R.L., Chapman, P.J. and Dagley, S. (1975) Metabolic function and properties of a 4-hydroxyphenyl-acetic acid 1-hydroxylase from Pseudomonas acidovorans. J. Bacteriology 121 : 272-285 Holt, J.G., Krieg, N.R., Sneath, P.H.A., Staley, J.T. and Willianms, S.T. (1994).
Bergey’s Manual of Determinative Bacteriology. 9th edition. Baltimo: Williams
and Wilkins.
Iwata, H, Tanabe, S., Sakai, N., and Tatsu, R. (1993) Distribution of persistent organochlorines in the oceanic air and surface seawater. Environ. Sci. Technol. 227:1080-1098 Jensen, H. L. (1960). Decomposition of Chloroacetates and Chloropropionates by
Bacteria. Acta Agriculturae Scandinavica. 10: 83-103.
Jensen, H.L. (1957a). Decomposition of Chloro-Substituted Aliphatic Acids by
Soil Bacteria. Canadian Journal of Microbiology, 3: 151-164
Jensen, H.L. (1957b). Decomposition of Chloro-Organic Acids by Fungi. Nature,
180: 1416
Jordan, T.L. Porter, T.S. and Pate, J.L. (1974) Isolation and characterisation of prosthecae of Asticca caulisbiprosthecum, Arch. Mikrobiol. 961:1-16
Leigh, J.A. (1986) Studies on bacterial dehalogenases. PhD thesis, Trent Polytechnic, Nottingham. U.K.

47
Kuznetsov, S.I., Dubinina, G.A. and Lapteva, N.A. (1979) Biology of oligotrophic bacteria. Annu. Rev. Microbiol. 33:377-387
Lidstrom, M. E. and Chistoserdova, L. (2002). Plants in the Pink: Cytokinin
Production by Methylobacterium. Journal of Bacteriology. 184(7): 1818.
Madigan, M. T., Martinko, J. M., Parker, J. (2000). Brock Biology of
Microorganism. 9th ed. Prentice Hall. 360-452.
Maniatis, T.. Fritisch, E.F. and J. Sambrook. (1982) Molecular cloning: A laboratory manual. Cold Spring Harbor Laboratory, CSH: New York Maidak, B.L., Olsen, G.J., Larsen, N.(1997) The RDP (Ribosomal Database Projects) Nucleic acid research 25(1):109-110
McDonald, I.R., Warner, K.L., McAnulla, C., Woodall, C.A., Oremland, R.S.,
Murrell, J.C. (2002). “A Review of Bacterial Methyl Halide Degradation:
Biochemistry, Genetics and Molecular Ecology.” Environ Microbiol. 4(4):193-
203.
Miller, J. H. (1972). Experiments in Molecular Genetics. Cold Spring Harbor,
N.Y: Cold Spring Harbor Laboratory.
Poindexter, J.S. (1981) Oligotrophy: Fast and famine existence. Adv. Microb. Ecol. 5:63-89
Prescott L.M., Harley, J.P. and Klein, D.A. (1996) Microbiology 3rd edition WCB publishers (USA) pp.862
Sambrook, J., Fritsch, E.F., and Maniatis, T. (1989) Molecular Cloning. A laboratory manual. 2nd Edition. Cold Spring Harbour Press, U.S.A
48
Schwarze, R., Brokamp, A., Schmidt, F.R.J. (1997). “Isolation and
Characterization of Dehalogenases from 2,2-Dichloropropionate-Degrading Soil
Bacteria”. Current Microbiology. 34:103-109
Senior, E., Bull, A. T. and Slater, J. H. (1976). Enzyme Evolution in a Microbial
Community Growing on the Herbicide Dalapon. Nature. 263: 476-479.
Studer, A. (2001). Aerobic Mocrobial Degradation of Chloromethane. Swiss
Feferal Institute of Technology Zurich: Ph.D. Thesis.
Subba-Rao, R.V., Rubin, H.E. and Alexander, M. (1982) Kinetics and extent of mineralisation of organic compounds at trace levels in freshwater and sewage. Appl. Environ. Microbiol. 43:1139-1150
Tada Y, Ihmoro M., and Yamaguchi J. (1995) Oligotrophic bacterial isolated from clinical materials. J. Clin. Microbiol. 33(2):493-494 Vannelli, T., Studer, A., Kertesz, M. and Leisinger, T. (1998) Chloromethane
Metabolism by Methylobacterium sp. Strain CM4. Appl. Environ. Microbiol.
64:1933-6.
Vannelli, T., Messmer, M., Studer, A., Vuilleumier, S. and Leisinger, T. (1999) A
Corrinoid-Dependent Catabolic Pathway for Growth of a Methylobacterium
Strain with Chloromethane. Proc. Natl. Acad. Sci. USA. 96:4615-4620.
Verhoef, R., de Waard, P., Schols, H.A., Siika-aho, M., Voragen, A.G.J. (2003)
“Methylobacterium sp. Isolated from a Finnish Paper Machine Produces Highly
Pyruvated Galactan Exopolysaccharide” Carbohydrate Research 338: 1851/1859
Warburg, O. and Christian, W. (1941) Biochem. Z. 310(384):450-452

49
APPENDIX: A ID AM231910 standard; genomic DNA; PRO; 1307 BP. AC AM231910; SV AM231910.1 DT 24-FEB-2006 (Rel. 86, Created) DT 24-FEB-2006 (Rel. 86, Last updated, Version 1) DE Methylobacterium sp. HN2006B partial 16S rRNA gene, strain HN2006B KW 16S ribosomal RNA; 16S rRNA gene. OS Methylobacterium sp. HN2006B OC Bacteria; Proteobacteria; Alphaproteobacteria; Rhizobiales; OC Methylobacteriaceae; Methylobacterium. RN [1] RP 1-1307 RA Ng H.; RT ; RL Submitted (22-FEB-2006) to the EMBL/GenBank/DDBJ databases. RL Huyop F.Z., Biology Department, Faculty of Science, Universiti Teknologi RL Malaysia, Universiti Teknologi Malaysia, Skudai, Johor, 81310, MALAYSIA. RN [2] RA Ng H.; RT "Degradation of herbicide by soil microorganism and cloning of a haloacid RT permease gene"; RL Unpublished. FH Key Location/Qualifiers FH FT source 1..1307 FT /country="Malaysia" FT /db_xref="taxon:373519" FT /mol_type="genomic DNA" FT /organism="Methylobacterium sp. HN2006B" FT /strain="HN2006B" FT /isolation_source="agriculture soil" FT rRNA <1..>1307 FT /gene="16S rRNA" FT /product="16S ribosomal RNA" XX SQ Sequence 1307 BP; 307 A; 317 C; 422 G; 261 T; 0 other; tgagtaacgc gtgtgaacgt gccttccggt tcggaataac cctgggaaac tagggctaat 60 accggatacg cccttatggg gaaaggttta ctgccggaag atcggcccgc gtctgattag 120 ctagttggtg gggtaacggc ctaccaaggc gacgatcagt agctggtctg agaggatgat 180 cagccacact gggactgaga cacggcccag actcctacgg gaggcagcag tggggaatat 240 tggacaatgg gcgcaagcct gatccagcca tgccgcgtga gtgatgaagg ccttagggtt 300 gtaaagctct tttatccggg acgataatga cggtaccgga ggaataagcc ccggctaact 360 tcgtgccagc agccgcggta atacgaaggg ggctagcgtt gctcggaatc actgggcgta 420 aagggcgcgt aggcggcgtt ttaagtcggg ggtgaaagcc tgtggctcaa ccacagaatg 480 gccttcgata ctgggacgct tgagtatggt agaggttggt ggaactgcga gtgtagaggt 540 gaaattcgta gatattcgca agaacaccgg tggcgaaggc ggccaactgg accattactg 600 acgctgaggc gcgaaagcgt ggggagcaaa caggattaga taccctggta gtccacgccg 660 taaacgatga atgccagctg ttggggtgct tgcaccgcag tagcgcagct aacgctttga 720 gcattccgcc tggggagtac ggtcgcaaga ttaaaactca aaggaattga cgggggcccg 780 cacaagcggt ggagcatgtg gtttaattcg aagcaacgcg cagaacctta ccatcctttg 840 acatggcgtg ttacccagag agatttgggg tccacttcgg tggcgcgcac acaggtgctg 900 catggctgtc gtcagctcgt gtcgtgagat gttgggttaa gtcccgcaac gagcgcaacc 960 cacgtcctta gttgccatca ttcagttggg cactctaggg agactgccgg tgataagccg 1020 cgaggaaggt gtggatgacg tcaagtcctc atggccctta cgggatgggc tacacacgtg 1080 ctacaatggc ggtgacagtg ggacgcgaag gagcgatctg gagcaaatcc ccaaaagccg 1140 tctcagttcg gattgcactc tgcaactcga gtgcatgaag gcggaatcgc tagtaatcgt 1200 ggatcagcat gccacggtga atacgttccc gggccttgta cacaccgccc gtcacaccat 1260 gggagttggt cttacccgac ggcgctgcgc caaccgcaag gaggcag 1307 //

50
Appendix: B Specific activity calculation Raw data of enzyme assay when using cell free extract from Methylobacterium.
Minutes A460 Corrected A460 Cl- (mM)
0 0.198 0 0 5 0.242 0.044 0.046
10 0.297 0.099 0.101 15 0.351 0.153 0.155 20 0.394 0.196 0.199
Since 400 µl of cell free extract used in 10ml incubation mixture during enzyme assay, the
dehalogenase specific activity can be calculated as below:
[ y µmol Cl- /ml ] / z minute = X µmol Cl- /ml /min
[ X x 1000 /a ] / b mg /ml protein in a sample = specific activity
Where a: Amount of cell free extract: 400/10 = 40 µl/ml
b: Measurement of protein concentration at Abs595 :
(0.145-0.0122) / 0.021 = 6.45 mg/ml
Therefore, dehalogenase specific activity towards 2,2-dichlororpopionate was 0.039 µmol
Cl-/min/mg protein.

Benefits Report Guidelines A. Purpose The purpose of the Benefits Report is to allow the IRPA Panels and their supporting experts to assess the benefits derived from IRPA-funded research projects. B. Information Required The Project Leader is required to provide information on the results of the research project, specifically in the following areas: • Direct outputs of the project;
• Organisational outcomes of the project; and
• Sectoral/national impacts of the project.
C. Responsibility The Benefits Report should be completed by the Project Leader of the IRPA-funded project. D. Timing The Benefits Report is to be completed within three months of notification by the IRPA Secretariat. Only IRPA-funded projects identified by MPKSN are subject to this review. Generally, the Secretariat will notify Project Leaders of selected projects within 18 months of project completion. E. Submissin Procedure One copy of this report is to be mailed to :
IRPA Secretariat Ministry of Science, Technology and the Environment 14th, Floor, Wisma Sime Darby Jalan Raja Laut 55662 Kuala Lumpur

1
Benefit Report 1. Description of the Project
A. Project identification
1. Project number : 09-02-06-0124 EA001
2. Project title : Investigation of growth of Rhizobium sp. at low concentrations of halogenated compound
3. Project leader : Dr. Fahrul Zaman Huyop
B. Type of research Indicate the type of research of the project (Please see definitions in the Guidelines for completing the Application Form)
Scientific research (fundamental research)
Technology development (applied research)
Product/process development (design and engineering)
Social/policy research
C. Objectives of the project 1. Socio-economic objectives
Which socio-economic objectives are adressed by the project? (Please indentify the sector, SEO Category and SEO Group under which the project falls. Refer to the Malaysian R&D Classification System brochure for the SEO Group code) Sector : Science & Engineering
SEO Category : Natural Sciences, Technologies and Engineering
SEO Group and Code : S50106 Applied Sciences Technologies
2. Fields of research
Which are the two main FOR Categories, FOR Groups, and FOR Areas of your project? (Please refer to the Malaysia R&D Classification System brochure for the FOR Group Code)
a. Primary field of research
FOR Category : Biological Sciences
FOR Group and Code : F10808- Biotechnology
FOR Area : Microbial Biotechnology
b. Secondary field of research
FOR Category : Biological Sciences
FOR Group and Code : F10803 Microbiology
FOR Area : Other Microbiology
May-96 Benefits Report

2
D. Project duration
What was the duration of the project ?
______36_______________ Months
E. Project manpower
How many man-months did the project involve? _______66___________________Man-months
F. Project costs
What were the total project expenses of the project? RM__145,215-65_________
G. Project funding
Which were the funding sources for the project? Funding sources Total Allocation (RM) _IRPA________________________ ___171,200-00________________
______________________________ _____________________________
______________________________ _____________________________
______________________________ _____________________________

3
ll. Direct Outputs of the Project
A. Technical contribution of the project 1. What was the achieved direct output of the project :
For scientific (fundamental) research projects?
Algorithm
Structure
Data
Other, please specify : ______________________________________________
For technology development (applied research) projects :
Method/technique
Demonstrator/prototype
Other, please specify : _______________________________________________
For product/process development (design and engineering) projects:
Product/component
Process
Software
Other, please specify : _______________________________________________
2. How would you characterise the quality of this output?
Significant breakthrough
Major improvement
Minor improvement

4
B. Contribution of the project to knowledge 1. How has the output of the project been documented?
Detailed project report
Product/process specification documents
Other, please specify : _MSc. Thesis
2. Did the project create an intellectual property stock? ‘No’
Patent obtained
Patent pending
Patent application will be filed
Copyright
3. What publications are available?
Articles (s) in scientific publications How Many: ________________
Papers(s) delivered at conferences/seminars How Many: _one________
Book
Other, please specify : ___M.Sc. thesis ___________
4. How significant are citations of the results?
Citations in national publications How Many: ________________
Citations in international publications How Many: ________________
None yet
Not known

5
lll. Organisational Outcomes of the Project
A. Contribution of the project to expertise development 1. How did the project contribute to expertise?
PhD degrees How Many: ________________
MSc degrees How Many: ______one_______
Research staff with new specialty How Many: ________________
Other, please specify: ________________________________________________
2. How significant is this expertise?
One of the key areas of priority for Malaysia
An important area, but not a priority one
B. Economic contribution of the project? 1. How has the economic contribution of the project materialised?
Sales of manufactured product/equipment
Royalties from licensing
Cost savings
Time savings
Other, please specify : Fundamental & Academic achievement
2. How important is this economic contribution ? Not Available
High economic contribution Value: RM________________
Medium economic contribution Value: RM________________
Low economic contribution Value: RM________________

6
3. When has this economic contribution materialised?
Already materialised
Within months of project completion
Within three years of project completion
Expected in three years or more
Unknown
C Infrastructural contribution of the project
1. What infrastructural contribution has the project had?
New equipment Value: RM __________________
New/improved facility Investment : RM __________________
New information networks
Other, please specify: Preparation of enzymes/ Enzyme technology equipments
2. How significant is this infrastructural contribution for the organisation?
Not significant/does not leverage other projects
Moderately significant
Very significant/significantly leverages other projects
D. Contribution of the project to the organisation’s reputation
1. How has the project contributed to increasing the reputation of the organisation
Recognition as a Centre of Excellence
National award
International award
Demand for advisory services
Invitations to give speeches on conferences
Visits from other organisations
Other, please specify: for post graduates and internal research for further study

7
2. How important is the project’s contribution to the organisation’s reputation ?
Not significant
Moderately significant
Very significant

8
1V. National Impacts of the Project
A. Contribution of the project to organisational linkages
1. Which kinds of linkages did the project create?
Domestic industry linkages
International industry linkages
Linkages with domestic research institutions, universities
Linkages with international research institutions, universities
2. What is the nature of the linkages?
Staff exchanges
Inter-organisational project team
Research contract with a commercial client
Informal consultation
Other, please specify: attending short courses and instituitional visit
B. Social-economic contribution of the project
1. Who are the direct customer/beneficiaries of the project output?
Customers/beneficiaries: Number: Department of environmental studies n/a
________________________________ ________________________________
________________________________ ________________________________
2. How has/will the socio-economic contribution of the project materialised ?
Improvements in health
Improvements in safety
Improvements in the environment
Improvements in energy consumption/supply
Improvements in international relations
Other, please specify: knowledge in pollutant degradation; at low pollutant
degradation

9
3. How important is this socio-economic contribution?
High social contribution
Medium social contribution
Low social contribution
4. When has/will this social contribution materialised?
Already materialised
Within three years of project completion
Expected in three years or more
Unknown
Date: 21.11.2006 Signature:

End of Project Report Guidelines A. Purpose The purpose of the End of Project is to allow the IRPA Panels and their supporting group of experts to assess the results of research projects and the technology transfer actions to be taken. B. Information Required The following Information is required in the End of Project Report : • Project summary for the Annual MPKSN Report;
• Extent of achievement of the original project objectives;
• Technology transfer and commercialisation approach;
• Benefits of the project, particularly project outputs and organisational outcomes; and
• Assessment of the project team, research approach, project schedule and project
costs.
C. Responsibility The End of Project Report should be completed by the Project Leader of the IRPA-funded project. D. Timing The End of Project Report should be submitted within three months of the completion of the research project. E. Submission Procedure One copy of the End of Project is to be mailed to :
IRPA Secretariat Ministry of Science, Technology and the Environment 14th Floor, Wisma Sime Darby Jalan Raja Laut 55662 Kuala Lumpur

End of Project Report
A. Project number : 09-02-06-0124 EA001
Project title : Investigation of growth of Rhizobium sp. at low concentrations of halogenated compound Project leader: Dr. Fahrul Zaman Huyop
Tel: 07-5534556 Fax: 07-556 6162
B. Summary for the MPKSN Report (for publication in the Annual MPKSN Report, please summarise
the project objectives, significant results achieved, research approach and team strucure) Halogenated organic compounds are produced industrially in large quantities and represent an important class of environmental pollutants. Bacteria have evolved several strategies for the enzymes to catalysed dehalogenation and degradation of halogenated compounds. The destruction of halogenated chemicals by microorganisms may be influenced by environmental factors or the structure of the chemical itself. One of the reasons suggested for the lack of degradation of organic compounds by microbes is their low concentration. Microorganisms that metabolise and grow upon very low concentrations of substrates have been designated as oligotrophs. Such organisms appear to be adapted to low substrate concentrations by having high substrate affinity (low Km value) systems. Our current investigation is to study the possibility of growth of Rhizobium sp. at low concentrations of halogenated substrate (2,2-dichloropropionic acid; 22DCP). 22DCP was chosen because it was widely used as a herbicide (Dalapon).
The degradation of low concentrations of 22DCP by whole cells of Rhizobium sp. has been achieved (cells doubling time of 12 hours). Rhizobium sp. was able to grow at 0.2 mM 22DCP which was 100x lower than the concentration of the substrate routinely used (20 mM; cells doubling time 11 hours). Dehalogenase specific acitivity for crude extracts from cells grown at 0.2 mM 22DCP showed the specific activity for 22DCP (0.065 µmolCl-/min/mg protein) and also had the affinity for 22DCP (Km 0.18 + 0.01 mM). Similar study was carried out using cell free extract prepared from cells grown at 20 mM 22DCP to see whether new dehalogenases were involved. Apparently, no new dehalogenases are required to allow growth on this low concentration of 22DCP as judged by dehalogenase properties which is similar to the growth at low substrate concentration.
May 96 End of Project Report

C. Objectives achievement
• Original project objectives (Please state the specific project objectives as described in Section ll of the Application Form)
1. To determine the ability of Rhizobium sp. to degrade 2,2DCP at low concentration.
2. To determine the kinetic parameter (i.e. Km values) of Rhizobium sp. dehalogenases involved in growth at high and low substrate concentration
3. To identify whether the same dehalogenases are involved when growth at low substrate concentration or different dehalogenases present • Objectives Achieved (Please state the extent to which the project objectives were achieved) All of the objectives stated were achieved • Objectives not achieved (Please identify the objectives that were not achieved and give reasons)
D. Technology Transfer/Commercialisation Approach (Please describe the approach planned to transfer/commercialise the results of the project)
It is important at this stage biodegradation of very low concentrations of xenobiotic compounds has been neglected. It
is useful to know about growth of microorganisms in low concentrations of pollutants because of the legal
requirements. A government body or legislation may set the concentration of a pollutant down to a level that is not
considered harmful. Therefore, if the microorganisms could only remove high concentration of pollutants, they could
not be used to meet requirements of the law, since there still will be low concentrations of pollutants in the
environment.
In nature the concentration of nutrients (including some pollutants that can be used as a source of carbon) in a given
habitat varies (due to weather etc.). Some of the pollutants degrader may include oligotrophic bacteria that can survive
or utilise substrates at low nutrient flux may be present in nature. Experimental study of such bacteria need to be
carried out and their properties need to be clarified.

E. Benefits of the Project (Please identify the actual benefits arising from the project as defined in Section lll of the Application Form. For examples of outputs, organisational outcomes and sectoral/national impacts, please refer to Section lll of the Guidelines for the Application of R&D Funding under IRPA)
• Outputs of the project and potential beneficiaries (Please describe as specifically as possible
the outputs achieved and provide an assessment of their significance to users)
In government and non-government organisation: to tackle pollutant at a very low concentration in the environment.
(i.e. MARDI, Kepala Batas, Pulau Pinang: herbicide widely use to kill weeds in Padi area) Some of the herbicide may be toxic and released of the toxic compound into the environment may cause environmental pollution. Some of these herbicides are biodegradable and some are not. This study only demonstrated that some of the microbes has some potential of degrading pollutants when the compounds are present at low concentrations. • Organisational Outcomes (Please describe as specifically as possible the organisational benefits
arising from the project and provide an assessment of their significance) 1. Establishment of General Microbiology laboratory 2. Establishment of protein preparation and characterization techniques • National Impacts (If known at this point in time, please describes specifically as possible the potential
sectoral/national benefits arising from the project and provide an assessment of their significance) n/a

F. Assessment of project structure
• Project Team (Please provide an assessment of how the project team performed and highlight any significant departures from plan in either structure or actual man-days utilised)
Group meeting was carried out every six months to discuss students/research associates progress. Several short courses were attended at Institute Bioscience in UPM to master skills in : 1. DNA sequencing (Workshop) 2. Protein Preparation & Purifications (Techniques) • Collaborations (Please describe the nature of collaborations with other research organisations and/or
industry) 1. Regular meeting 2. Short Course attended (Institute Biosains UPM)
G. Assessment of Research Approach (Please highlight the main steps actually performed and indicate any major departure from the planned approach or any major difficulty encountered)
1. To establish growth of Rhizobium sp. under low 2,2DCP concentrantion (0.20mM) using shake flask culture. (to see whether cells is able to grow at 100th times lower than the normal growth condition).
2. Scale up process: grow cells up to at least in 8L culture (using shake flask technique) 3. Preparation of cell-free extract using standard extraction technique 4. Non-denaturing polyacrylamide gel analysis: to obtain the protein profiles from growth at low substrate
concentration compared to high substrate concentration 5. Kinetic analysis will be carried out to see the Km values between the enzymes prepared from low and high
concentration of growth substrate. (Lap top computer equip with latest version computer software to measure kinetic analysis ie. Microcal Origin Ver. 6.5 or Enzfitter from SIGMA)
H. Assessment of the Project Schedule (Please make any relevant comment regarding the actual duration
of the project and highlight any significant variation from plan) The project completed was completed in October 2006 after 6/7 months extension from 31st March 2006. There is no changing in the plan and research activities. However, some of the research activities may take longer times to accomplished and time period extension is necessary.

I. Assessment of Project Costs (Please comment on the appropriateness of the original budget and highlight any major departure from the planned budget)
Overall budget is sufficient within 3 years allocation. The latest statement of account indicated that only 85% from the total budget was fully utilized.
J. Additional Project Funding Obtained (In case of involvement of other funding sources, please indicate the source and total funding provided) n/a
K. Other Remarks (Please include any other comment which you feel is relevant for the evaluation of this
project) The investigation is important to project the properties of bacterial enzymes and possibly to asses the very basic concept of oligotrophy by examining the enzyme properties of the isolated bacterial species. The primary purpose to imply that oligotrophy does exist. And, it is suitable for exploitation of habitats low in pollutants as sole of carbon source.
Date : 22nd November 2006 Signature :


![Comparison between the reference [i]Rhizobium … · Common bean plants were inoculated with rhizobia strains: Rhizobium tropici CIAT899 or Rhizobium etli 12a3, ... +216 94120093](https://img.pdfslide.us/doc/110x75/5b915a7d09d3f26a278b6ea5/comparison-between-the-reference-irhizobium-common-bean-plants-were-inoculated.jpg)