Embed Size (px)
Citation preview

T h e C e n t e r f o r E d u c a t i o n D a t a & R e s e a r c h U n i v e r s i t y o f W a s h i n g t o n B o t h e l l 3 8 7 6 B r i d g e W a y N . S t e . 2 0 1 S e a t t l e , W A 9 8 1 0 3 ( 2 0 6 ) 5 4 7 -‐ 5 5 8 5 c e d r @ u . w a s h i n g t o n . e d u w w w . c e d r . u s
Rhetoric Versus Reality: Is the Academic Caliber of the Teacher Workforce Changing? Dan Goldhaber and Joe Walch
CEDR Working Paper 2013-4 University of Washington Bothell
CEDR Working
Paper
2013-‐4
08 Fall
Suggested citation: Goldhaber, Dan and Walch, Joe. (2013). Rhetoric Versus Reality: Is the Academic Caliber of the Teacher Workforce Changing? CEDR Working Paper 2013-4. University of Washington, Seattle, WA.
© 2013 by Dan Goldhaber and Joe Walch. All rights reserved. Short sections of text, not to exceed two paragraphs, may be quoted without explicit permission, provided that full credit, including © notice, is given to the source.

1
"The U.S. does not take a strategic or systematic approach to nurturing teaching talent...the world's top performing school systems--Singapore, Finland, and South Korea--make a different choice… These systems recruit 100% of their teacher corps from the top third of the academic cohort…in the U.S., by contrast, 23% of new teachers come from the top third, and just 14% in high poverty schools.” (Auguste, 2010, p. 5)
1. The Changing Landscape of the Teacher Labor Market Policies
There exists a considerable amount of concern about the overall academic caliber
of the teacher workforce in the United States. The evidence of the importance of teacher
academic proficiency as a predictor of effectiveness is somewhat mixed. However,
numerous researchers and educational stakeholders point to the fact that US teachers tend
not to be drawn from the upper end of the academic performance distribution—as is the
case in countries with high student achievement, such as Finland, Korea, and
Singapore—as one explanation for the poor performance of US students relative to other
industrialized countries.
The idea that the academic caliber of the US teacher workforce does not measure
up has become quite pervasive. Michael Bloomberg, for instance, speaking at MIT’s
Collaborative Initiative Conference said, “We don’t hire the people who are at the top of
their class anymore. If you go to countries around the world where the education systems
really work, the teachers come from the top 10 to 20 percent of the class—the best
schools. In America, they come from the bottom 20 percent and not of the best schools."
(Collaborative Initiative Conference).1
There is little doubt that teacher quality matters a great deal for student
achievement. Numerous studies show that student academic success depends in no small
1 See also Auguste et al. (2010), Darling-Hammond (2010), OECD (2012), and Tucker (2011). 2 As a specific example, Rivkin et al. estimate that a one standard deviation change in teacher effectiveness is roughly equivalent to a change in class size of 10 to 13 students. 3 While not all studies find evidence that teacher cognitive skills predict student achievement (e.g. Buddin and Zamarro, 2009; Harris and Sass, 2011), summaries of the literature (e.g. Goldhaber, 2008; Murnane

2
part to access to high quality teachers (e.g. Aaronson et al., 2007; Chetty et al., 2011;
Goldhaber and Hansen, 2013; Hanushek, 1992; Rivkin et al., 2005). The difference
between having a very effective versus a very ineffective teacher is equivalent to more
than a year’s worth of academic achievement (Hanushek, 1992) and the impact of the
difference in teacher quality is large relative to other educational investments such as
changing class size (Rivkin et al., 2005).2
The evidence of the importance of teacher cognitive skills (we use this term
interchangeably with “academic proficiency”) is not definitive, but generally suggests an
association between measures, such as college entrance exams or licensure test scores,
and teacher value added.3 Regardless of the academic literature, there is a strong policy
push toward focusing on getting smarter people into the teacher workforce. The No Child
Left Behind Act, for instance, puts an emphasis on measuring academic competence by
requiring that teachers either graduate with a major in the subject they are teaching, have
credits equivalent to a major, or pass a qualifying test showing competence in the subject.
More recently, proposed new standards to regulate teacher training programs also place a
strong emphasis on training programs being more selective about the academic
competence of those admitted.4
2 As a specific example, Rivkin et al. estimate that a one standard deviation change in teacher effectiveness is roughly equivalent to a change in class size of 10 to 13 students. 3 While not all studies find evidence that teacher cognitive skills predict student achievement (e.g. Buddin and Zamarro, 2009; Harris and Sass, 2011), summaries of the literature (e.g. Goldhaber, 2008; Murnane and Steele (2007) do suggest a moderate positive relationship on the whole. For recent studies that focus on the relationship between measures of teachers’ cognitive skills and student achievement, see Goldhaber (2007), Rockoff et al. (2011), and Rockoff and Speroni (2011). There is also clear evidence that there is generally an inequity of teacher cognitive skills across student demographic types and achievement levels (e.g. Lankford et al., 2002). 4 See, for instance, the CAEP Draft Standards (http://caepnet.org/commission/standards) and NCTQ Teacher Prep Program Ratings (http://www.nctq.org/p/edschools/home.jsp).

3
If it is true that teacher academic proficiency matters, then most of the existing
body of research on the long-term trends in the academic caliber of the teacher workforce
presents a troubling portrait. Specifically, research documents that, in the 1990s, college
graduates with higher test scores were less likely to enter the teaching profession than
other occupations (Corcoran et al., 2004; Goldhaber and Liu, 2003; Hanushek and Pace,
1995; Henke et al., 1996; Hoxby and Leigh, 2004; and LakDawalla, 2001), a finding that
contrasts with the situation from several decades earlier when many of the most
academically capable female graduates became teachers.5
More recent evidence suggests the situation may be changing. In a study of
prospective teachers taking the Praxis II®, an assessment used for licensure in 20 states
and the District of Columbia, Gitomer (2007) finds that the average SAT score and
college GPA has risen over time. The average math SAT score of prospective teachers
that passed the Praxis II® increased by 17 points between 1995–1997 and 2004–2005
and the verbal SAT score increased by 6 points (Gitomer, 2007). But, it is important to
note that this evidence does not directly bear on the academic caliber of incoming
teachers given that only about 60 to 80 percent of those taking licensure exams actually
end up teaching (Esch et al., 2004; Henke, et al., 2000; Ingersol and Perda, 2010).6
So have there been significant changes in the academic caliber of the teacher
workforce over the last couple decades? The nation has, at least rhetorically, focused a
great deal on the issue of teacher quality, and, in some states, dramatically changed
5 Corcoran et al., who focus on females, find the likelihood that a female teacher will have scored in the top 10 percent (on a standardized achievement test) among high school students dropped by more than half (down from about a 20 percent probability) in 1964, to about a 10 percent probability in 2000. 6 For instance, using data from states’ departments of labor occupation projections and the US Department of Education Title II report (https://title2.ed.gov/TitleIIReport13.pdf), we estimate that the national annual demand for all primary, secondary, and special education teachers is about 247,000 positions, while the number of credentials issued in 2009-10 was about 311,000.

4
licensure to allow for more pathways into the teacher labor market. At the same time
there have been significant education policy shifts that might affect new teachers, such as
increased test-based accountability under No Child Left Behind, and increased
experimentation with individual and group-based teacher incentives.7 Views are mixed as
to whether such policy shifts make teaching a more desirable profession (see Achinstein
et al., 2004 and Hanushek & Rivkin, 2006; for a review of the effects of test based
accountability see Chamberlin et al., 2002). Finally, these changes are overlaid onto both
periods of economic boom, in the mid and late 1990s, and relative stagnation in job
growth in the mid-2000s culminating in an economic collapse in 2008.
In this paper we use a variety of datasets to analyze trends in the academic
proficiency of individuals at various points in the teacher pipeline over the last two
decades. In the course of our analysis we pay particular attention to teachers (and
prospective teachers) in STEM fields.8 The argument for this is twofold. First, because
teacher salaries are typically not differentiated by area of training and the economic
returns to different academic skills and majors have changed over time (Grogger and
Eide, 1995), it is likely that workers trained in the high demand fields of math and
science will have opportunities for higher pay in other careers. Second, and consistent
with the first point, there is a fair amount of empirical evidence (e.g. Ingersoll and May,
2012; Ingersoll and Perda, 2010; Epstein and Miller, 2011; Murnane and Steele, 2007)
that school systems find it more challenging to hire and retain teachers in STEM areas.
7 For example, the federally funded Teacher Incentive Fund provides grants to develop performance-based teacher and principal compensation systems in an effort to increase student achievement, and the Race to the Top Fund rewards states implementing reforms to recruit and reward effective teachers. 8 We use science and math interchangeably with STEM.
5
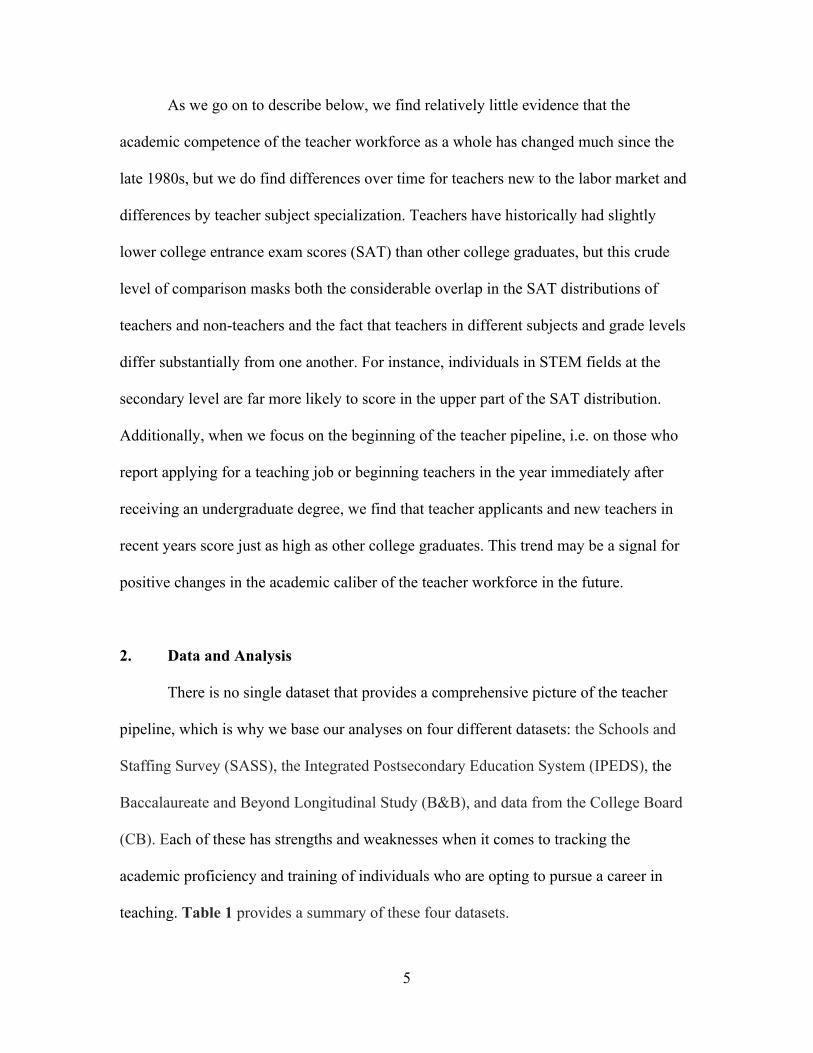
As we go on to describe below, we find relatively little evidence that the
academic competence of the teacher workforce as a whole has changed much since the
late 1980s, but we do find differences over time for teachers new to the labor market and
differences by teacher subject specialization. Teachers have historically had slightly
lower college entrance exam scores (SAT) than other college graduates, but this crude
level of comparison masks both the considerable overlap in the SAT distributions of
teachers and non-teachers and the fact that teachers in different subjects and grade levels
differ substantially from one another. For instance, individuals in STEM fields at the
secondary level are far more likely to score in the upper part of the SAT distribution.
Additionally, when we focus on the beginning of the teacher pipeline, i.e. on those who
report applying for a teaching job or beginning teachers in the year immediately after
receiving an undergraduate degree, we find that teacher applicants and new teachers in
recent years score just as high as other college graduates. This trend may be a signal for
positive changes in the academic caliber of the teacher workforce in the future.
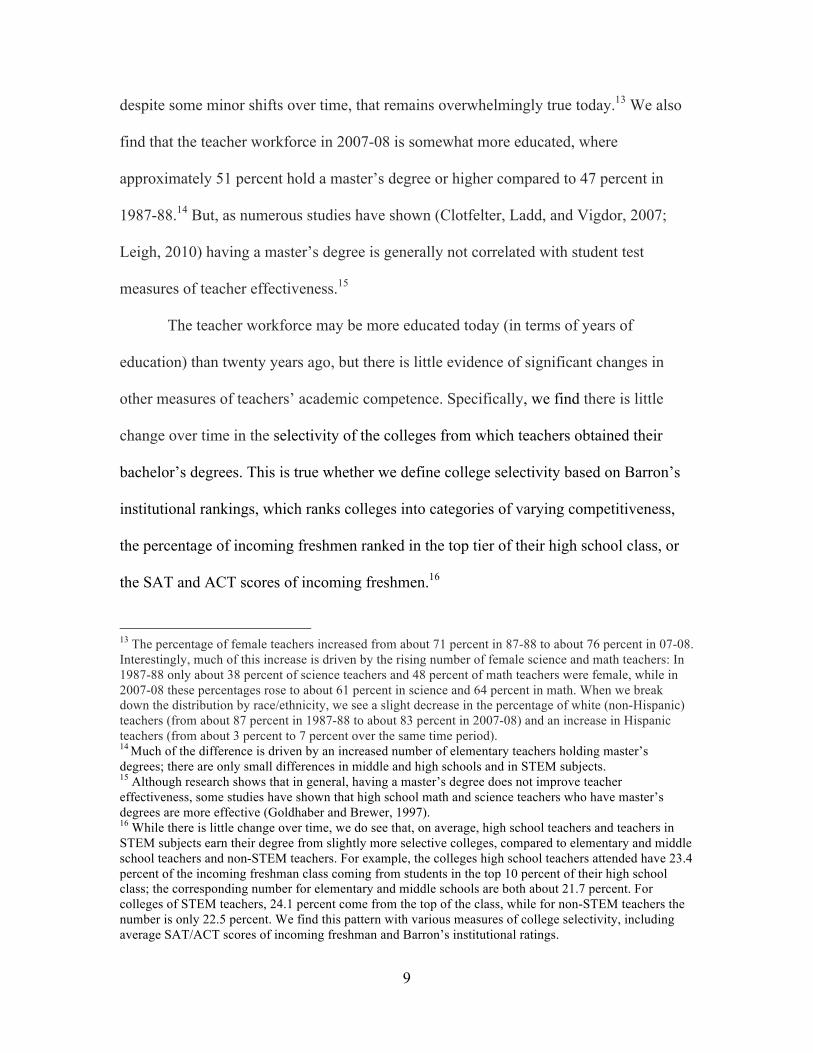
2. Data and Analysis
There is no single dataset that provides a comprehensive picture of the teacher
pipeline, which is why we base our analyses on four different datasets: the Schools and
Staffing Survey (SASS), the Integrated Postsecondary Education System (IPEDS), the
Baccalaureate and Beyond Longitudinal Study (B&B), and data from the College Board
(CB). Each of these has strengths and weaknesses when it comes to tracking the
academic proficiency and training of individuals who are opting to pursue a career in
teaching. Table 1 provides a summary of these four datasets.

6
[Table 1 about here]
The SASS provides a nationally representative snapshot of districts, schools, and
teachers in particular years: 1987-88, 1990-91, 1993-94, 1999-2000, 2003-04, and 2007-
08. This dataset includes approximately 250,000 teacher observations over the six waves
of the survey.9 The SASS is useful in providing a broad picture of how the teacher
workforce is changing, e.g. in terms of demographics, over time. But, those who end up
in a teaching position must have both an expressed desire (though obtaining required
credentials and applying to teaching positions) to teach and have been selected for a
teaching position by a school system. Thus, information about teachers in the SASS
reflects both the preferences of teachers and hiring officials (Boyd et al., 2013).
Additionally, the SASS is limited in that it only focuses on in-service teachers, so does
not provide information on how teachers compare to other college graduates.
IPEDS consists of annual information from over 7,500 institutions and is used to
describe and analyze trends in postsecondary education in the US. IPEDS includes data
on enrollments, degree completions, and graduation rates.
The B&B data provides nationally representative snapshots of three cohorts (one
from 1993, followed up in 1994, 1997, and 2003; one from 2000, followed up in 2001;
and one from 2008, followed up in 2009) of more than 10,000 college graduates (in each
wave of the survey) who are tracked into the workforce. We use this data to paint a more
detailed picture of the teacher pipeline and how those at various points in the pipeline
compare to college graduates who opt into a different occupation.
Data from the College Board (CB) include annual information on the number of
applicants for approximately 6,000 two-year and four-year post-secondary institutions 9 These are unweighted frequencies.

7
from 1990-2010, as well as institutional selectivity measures, such as class rankings,
GPA, and ACT and SAT scores of incoming freshman, averaged at the level of the
institution. This institution-level dataset can be merged with each of the other datasets we
plan to utilize, providing a measure of the selectivity of colleges and universities from
which teachers receive their credentials. And, for our purposes, the data can be merged
with annual information from IPEDS on the number of graduates by major and degree
level. This allows us to assess whether there has been any change in the academic
proficiency of prospective teachers, i.e. those whose academic major in education
suggests they are interested in pursuing a teaching career, over the last twenty years. But,
as we describe below, many of those whose major might suggest they are interested in
teaching might not actually pursue a teaching career (Ingersoll, 2003; Goldhaber and Liu,
2003).10
3. Portrait of the Teaching Profession and Pipeline
3.1 Demographic Changes to the Teacher Workforce Over Time
We begin by providing an overview of demographic changes to the teacher
workforce since the late 1980s. The aging of the teacher workforce, and the possibility of
an impeding teacher retirement “crisis” is a longstanding concern that tends to come up
repeatedly in reports (e.g. Barro, 2010; Costrell et al., 2011; Fensterwald, 2013; Spencer,
2013). A 2009 article appearing in the New York Times, for instance, notes that “Over the
next four years, more than a third of the nation’s 3.2 million teachers could retire,
depriving classrooms of experienced instructors and straining taxpayer-financed
10 A description of the construction of the variables we use in each stage of the analysis is provided in Appendix A.

8
retirement systems” (Dillon, 2009).11 Evidence from the SASS does indeed show that the
teacher workforce has aged somewhat, as shown in Figure 1, which reports nationally
representative snapshots of the teacher age distribution over the last 20 years. The
average age has changed relatively little during this period, moving from 41.4 in the
1987-88 school year to 42.2 in 2007-08, but this average masks the fact that the number
of teachers eligible for full or partial retirement has increased more dramatically.
Specifically, over this time period, the percentage of teachers over age 65 has nearly
doubled from about 0.5 to 0.9 percent and the percentage over age 55 has increased from
9 to 16 percent. The pace at which the workforce is aging into retirement eligibility is
also quickening: most of the increase in the proportion of retirement eligible teachers
occurred in the mid-2000s, and today the workforce tends to be staffed by relatively
junior (under age 30) and senior teachers (over age 55), i.e. in 2007-08 the distribution is
close to being bimodal.12
[Figure 1 about here]
The figures from the various waves of the SASS clearly show that the teacher
workforce is aging, but do we see other significant changes in who staffs the nation’s
classrooms? Teaching has historically been a white, female dominated profession and,
11 It is worth noting that while the issue of an aging teacher workforce appears regularly in popular press, there is no consensus that there is a looming crisis associated with upcoming teacher retirements (e.g. Greene, 2012). An increase in retirement eligible teachers may portend the need to hire more teachers in upcoming years, but the number of teachers hired is also highly dependent on schooling policies, class size in particular. The use of technology may alter what we now think of as a common classroom configuration (Hill, 2009; Moe et al., 2009; Schorr and McGriff, 2011; Simburg and Roza, 2012; Tucker, 2012), and minor tweaks to teacher pension systems could also have profound impacts on the retirement decisions of teachers (Koedel et al., 2013) 12 We also break the age distribution down by grade configuration and by STEM subject but find only small differences by group. The most notable difference is in math, where teachers are about half a year younger on average and slightly less likely to be under 55 and under 65, compared to the entire population of teachers.
9
despite some minor shifts over time, that remains overwhelmingly true today.13 We also
find that the teacher workforce in 2007-08 is somewhat more educated, where
approximately 51 percent hold a master’s degree or higher compared to 47 percent in
1987-88.14 But, as numerous studies have shown (Clotfelter, Ladd, and Vigdor, 2007;
Leigh, 2010) having a master’s degree is generally not correlated with student test
measures of teacher effectiveness.15
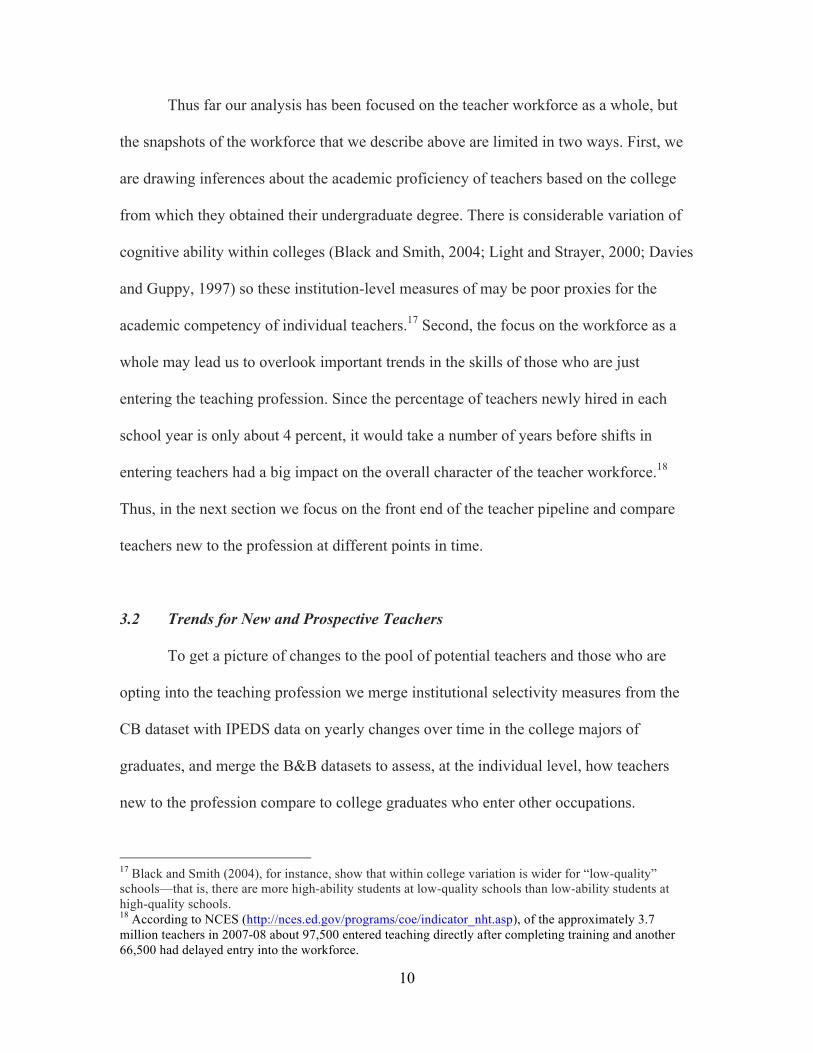
The teacher workforce may be more educated today (in terms of years of
education) than twenty years ago, but there is little evidence of significant changes in
other measures of teachers’ academic competence. Specifically, we find there is little
change over time in the selectivity of the colleges from which teachers obtained their
bachelor’s degrees. This is true whether we define college selectivity based on Barron’s
institutional rankings, which ranks colleges into categories of varying competitiveness,
the percentage of incoming freshmen ranked in the top tier of their high school class, or
the SAT and ACT scores of incoming freshmen.16
13 The percentage of female teachers increased from about 71 percent in 87-88 to about 76 percent in 07-08. Interestingly, much of this increase is driven by the rising number of female science and math teachers: In 1987-88 only about 38 percent of science teachers and 48 percent of math teachers were female, while in 2007-08 these percentages rose to about 61 percent in science and 64 percent in math. When we break down the distribution by race/ethnicity, we see a slight decrease in the percentage of white (non-Hispanic) teachers (from about 87 percent in 1987-88 to about 83 percent in 2007-08) and an increase in Hispanic teachers (from about 3 percent to 7 percent over the same time period). 14 Much of the difference is driven by an increased number of elementary teachers holding master’s degrees; there are only small differences in middle and high schools and in STEM subjects. 15 Although research shows that in general, having a master’s degree does not improve teacher effectiveness, some studies have shown that high school math and science teachers who have master’s degrees are more effective (Goldhaber and Brewer, 1997). 16 While there is little change over time, we do see that, on average, high school teachers and teachers in STEM subjects earn their degree from slightly more selective colleges, compared to elementary and middle school teachers and non-STEM teachers. For example, the colleges high school teachers attended have 23.4 percent of the incoming freshman class coming from students in the top 10 percent of their high school class; the corresponding number for elementary and middle schools are both about 21.7 percent. For colleges of STEM teachers, 24.1 percent come from the top of the class, while for non-STEM teachers the number is only 22.5 percent. We find this pattern with various measures of college selectivity, including average SAT/ACT scores of incoming freshman and Barron’s institutional ratings.
10
Thus far our analysis has been focused on the teacher workforce as a whole, but
the snapshots of the workforce that we describe above are limited in two ways. First, we
are drawing inferences about the academic proficiency of teachers based on the college
from which they obtained their undergraduate degree. There is considerable variation of
cognitive ability within colleges (Black and Smith, 2004; Light and Strayer, 2000; Davies
and Guppy, 1997) so these institution-level measures of may be poor proxies for the
academic competency of individual teachers.17 Second, the focus on the workforce as a
whole may lead us to overlook important trends in the skills of those who are just
entering the teaching profession. Since the percentage of teachers newly hired in each
school year is only about 4 percent, it would take a number of years before shifts in
entering teachers had a big impact on the overall character of the teacher workforce.18
Thus, in the next section we focus on the front end of the teacher pipeline and compare
teachers new to the profession at different points in time.
3.2 Trends for New and Prospective Teachers
To get a picture of changes to the pool of potential teachers and those who are
opting into the teaching profession we merge institutional selectivity measures from the
CB dataset with IPEDS data on yearly changes over time in the college majors of
graduates, and merge the B&B datasets to assess, at the individual level, how teachers
new to the profession compare to college graduates who enter other occupations.
17 Black and Smith (2004), for instance, show that within college variation is wider for “low-quality” schools—that is, there are more high-ability students at low-quality schools than low-ability students at high-quality schools. 18 According to NCES (http://nces.ed.gov/programs/coe/indicator_nht.asp), of the approximately 3.7 million teachers in 2007-08 about 97,500 entered teaching directly after completing training and another 66,500 had delayed entry into the workforce.

11
Who ultimately becomes a teacher is going to depend not only on training— i.e.
those who receive a credential and are eligible to teach—but also whether those who have
a teaching credential ultimately seek a teaching job and are hired.19 Still one’s college
major is certainly a leading indicator of occupational intention. We explore this in
Figure 2, which reports the trends in the average selectivity of colleges (measured based
on the average SAT score for incoming freshman) of those receiving a bachelor’s degree
with either an education or non-education major.20
[Figure 2 about here]
Consistent with the findings reported in the prior sub-section, prospective teachers
are graduating from less selective colleges compared to non-education graduates, but the
last twenty years has also seen the gap in institutional selectivity between education and
non-education majors widen. For instance, the difference between education and non-
education majors in both the average math (Panel A) and verbal (Panel B) SAT at the
college where a BA was received increased from about 10 points in 1990 to 20 points in
2010.21 And, while we do not report the results, the trends for education and non-
19 For more detail on the proportion of newly trained potential teachers entering the workforce see footnote 6. Also note that there is mixed evidence as to whether school systems favor more academically proficient teacher applicants in the hiring process (Ballou, 1996). Boyd et al. (2013) find that schools do favor teachers from the most selective schools. 20 The values in Figure 2 are college-level average SAT scores of incoming freshmen, weighted by the number of graduates majoring in education. We derive these values for each year by finding the product of the institution-level SAT percentiles and the number of graduates majoring in education for each institution, and then dividing that product by the total number of graduates. We repeat this procedure for non-education graduates. For institutions with missing SAT percentiles we convert the ACT percentiles using the concordance table found at: http://research.collegeboard.org/sites/default/files/publications/2012/7/researchnote-2009-40-act-sat-concordance-tables.pdf 21 As a point of reference, a 10-point increase is approximately 9 percent of a standard deviation on the math and critical reading SAT distribution. This is true whether one focuses on the average SAT at the 25th or the 75th percentile of each college’s student distribution. Standard deviations for math and reading scores vary by year, but are generally close to 115. See http://professionals.collegeboard.com/profdownload/2010-total-group-profile-report-cbs.pdf for more details.

12
education majors are also consistent for other measures of college selectivity, such as the
percentage of incoming freshmen ranking in the top of their high school class.
One explanation for this shift in the type of schools from which education versus
non-education majors are graduating is that more selective colleges and universities have
become increasingly less likely to offer undergraduate programs that allow students to
easily earn teacher certification in four years (Reback 2004).22 This in fact is broadly
consistent with another interesting finding from the IPEDS data, which shows a
significant shift in the way teachers are being prepared. We find that the percentage of
education bachelor’s degrees dropped from about 10 percent of all bachelor’s degrees in
1990 to about 6 percent in 2010, but concurrently the percentage of education master’s
degrees stayed around 27 percent. Not surprising given these figures, the share of
prospective teachers getting formal teacher preparation (i.e. a degree in education)
through a graduate rather than undergraduate program has risen sharply over time, from
about 45 percent MA in 1990 to about 63 percent in 2010. Using SASS data we find that
the increase in the number of master credentials is also seen in the distribution of newly
hired teachers. For instance, of teachers new to the profession (who report having 1 or
fewer years of teaching experience) approximately 17 percent entered teaching with a
master’s degree in 1987-88 compared to 26 percent in 2007-08.
Next we turn our attention to comparisons between different kinds of teachers and
other college graduates.23 Before we begin, it is worth noting that teachers are often
22 Findings from Reback (2004) suggest that adding undergraduate teaching programs that could be completed in four years, or converting five year programs into four year programs, at some elite colleges could increase the number of academically high-achieving teachers by upwards of 50 percent. 23 The analytic sample for this part of the analysis only includes respondents who were designated as full-time employees in the year following graduation.

13
characterized in popular press as being less academically competent compared to private
sector professionals. For instance, the author of a recent New York Times op-ed stated:
“In the nations that lead the international rankings—Singapore, Japan, South Korea, Finland and Canada—teachers are drawn from the top third of college graduates, rather than the bottom 60 percent as in the case of the United States.” (Mehta, 2013).
The above quote is accurate in the sense that evidence shows teachers in the US
are more likely to be drawn from the lower end of the academic achievement distribution
than are teachers in selected other countries. But, not surprisingly, the picture is a bit
more nuanced, and as we illustrate below, it has changed over time.
We turn to the B&B data to get a better sense of who is actually entering teaching
(as opposed to training to enter the profession) and other occupations. But, it is
worthwhile to note, given the above discussion about the degrees that prospective
teachers are receiving, that a focus on BA recipients misses a substantial proportion of
those individuals training to become teachers.24
Figure 3, which is derived from the B&B data, shows the distributions of SAT
percentile ranks over time for new teachers entering the workforce the year after
receiving their bachelor’s degree in selective years (1993, 2000, and 2008 and teaching in
the 1993-94, 2000-01, and 2008-09 school years).25 In contrast to the measures of
selectivity at the college level, here we do find evidence that more academically
competent individuals are being drawn into the teaching profession. We find a small drop
in average SAT percentile rankings between the 1993 and 2000 cohorts, from 44.6 to
24 Unfortunately there is not a dataset focusing at the master’s degree or above level of training that has detailed information about new entrants into teaching and other occupations. 25 Percentile ranks are calculated using a within-cohort comparison group that includes graduates who are employed full-time in the year immediately following graduation.

14
41.9 with a sizeable jump up in the average percentile rank to 50.3 for the 2008 cohort,
driven mainly by a big increase in the proportion of teachers with SAT scores that fall in
the top quartile of the distribution.26 This trend of increasing academic competence for
newer entrants to the teacher labor market also shows up when we use undergraduate
GPA as our indicator of academic competency, though this measure is somewhat
questionable given evidence that grading standards are not consistent across academic
majors (Koedel, 2011). Unfortunately the B&B lacks other measures of academic
competence that are consistent across all cohorts.
[Figure 3 about here]
We also investigate whether there have been similar changes over time for
different subject areas. Before getting to the details, it is worth noting that teachers’
academic backgrounds tend to be related to the subjects they teach (Gitomer and Latham,
1999). For instance, as we show in Table 2, the vast majority of the newly minted STEM
majors who enter the teaching profession teach in STEM classrooms, over 90 percent for
each cohort. 27 We also see that there is some variation across the cohorts in the
proportion of STEM classes that are staffed by new teachers with a STEM major, though
it is consistently less than half of STEM classrooms.28 It is speculation, but conceivable
that the dip in STEM majors teaching in STEM classrooms in 2000-01 has to do with
26 When we break the sample down by grade configuration we find the same trend over time, with high school teachers scoring higher than teachers in lower grades. Additionally, the average raw SAT scores are similar for teachers in the 1993 and 2000 cohorts, but scores for non-teachers were higher for the 2000 cohort, resulting in a decrease in the average percentile rank for teachers. T-tests show that the difference in means between 2008 teachers and the other two cohorts is statistically significant at the .05 level. 27 We define a STEM teacher as a non-elementary teacher whose primary teaching responsibility includes math, biology/life science, chemistry, geology/earth/space science, physics, computer science, or general science. 28 The percentage of new graduates earning STEM degrees has remained pretty consistent across cohorts at about 20 percent, while the percentage of STEM graduates entering teaching in the year immediately following graduation fluctuates between 6–8 percent.

15
difficulty schools faced in hiring individuals with STEM backgrounds during the tech
boom era, while the uptick in the percentage in the percentage of new STEM teachers
with STEM degrees may reflect NCLB regulations that required teachers to earn a degree
in their content area or pass a qualifying exam.
[Table 2 about here]
It is not surprising, given empirical evidence that STEM majors tend to have
higher SAT scores than non-STEM majors (Kokkelenberg and Sinha, 2010), that we find
the academic caliber of teachers varies a good deal by subject area. This is illustrated by
the various panels of Figure 4, which show the SAT percentile rank distributions for
STEM and non-STEM majors who choose to enter the teaching profession and other
occupations in the year following graduation for the 1993 (Panel A), 2000 (Panels B),
and 2008 (Panels C) B&B cohorts. Consistent with the prior empirical evidence, we find,
for all three cohorts, that STEM majors tend to have significantly higher SAT scores than
non-STEM majors: their SAT score average is about 100 points higher in each year and a
far higher proportion come from the highest quintile of the distribution.29
[Figure 4 about here]
For both the 1993 and 2000 cohorts, teachers score lower on average than non-
teachers among both STEM majors and non-STEM majors, in some cases by as much as
7 SAT percentile points. However, in the case of the 2008 cohort, scores for teachers
were slightly higher for both STEM majors (3.5 percentile points) and non-STEM majors
(2 percentile points) than non-teachers. 30 In other words, we find that high-scoring
STEM majors are relatively more likely to become teachers in 2008 than they were in
29 The difference in means between STEM majors and non-STEM majors is statistically significant at the .05 level. 30 The difference in means between teachers and non-teachers in 2008 is not statistically significant.

16
earlier cohorts. There is still considerable overlap in the distributions of scores for
teachers and non-teachers in both groups, but the gap in the academic proficiency of
teachers and graduates entering other professions had clearly narrowed a great deal—and
even reversed—by 2008. Particularly notable is the fact that there has been a sharp
decline in the share of STEM majors entering teaching from the bottom 20 percent of the
SAT distribution, which fell from 13 percent in 1993 to less than 2 percent in 2008.
What explains the seeming dichotomy between what we see when we look at
trends for prospective teachers (based on college major) and trends for those who actually
enter the teacher workforce? One possibility is that there are within college shifts in who
opts to teach; these would not be captured by the college selectivity measures but would
show up in the individual level analysis. The second is, as we noted earlier, many
individuals who graduate from college with an education major do not actually end up
teaching, and it may be the more academically competent among those trained to teach
who actually become teachers, either because of application or hiring decisions. We
attempt to sort out these issues in the next sub-section where we take a more detailed look
at who progresses through college into the teaching profession.
3.3 A More Detailed Look at Prospective Teachers
In this section we use data from the B&B to statistically model whether measures
of individuals’ academic competence and college training are: 1) predictive of whether
they choose to pursue a career in teaching as evidenced by their decision to apply for a
teaching position; and 2) ultimately end up in the teacher workforce, given an application
to teach, in the year following graduation. We focus particular attention on whether there

17
is any evidence that the relationship between academic competence and college training
and whether the propensity to pursue a career as a teacher has shifted over time.31 To
simplify the analysis we focus on the decisions of female graduates who are employed
full-time in the year following graduation.32
Based on the results of the statistical model, we report the predicted probability
that individuals with different SAT scores and college majors (STEM or non-STEM)
apply to a teaching job (Figure 5A) and, given application, end up in the teacher
workforce in the year following college graduation (Figure 5B).
[Figure 5 about here]
For each cohort, STEM majors are about 4 to 8 percentage points less likely to
apply for a teaching job than non-STEM majors. In the first two cohorts, we find that
graduates with higher SAT scores are generally less likely to pursue a teaching career,
but this is not the case in 2008. Specifically, in 1993, the probability of applying for a
teaching job decreases as SAT score increases, with a difference of about 10 percentage
points between a teacher at the 20th percentile and a teacher at the 80th percentile on the
SAT distribution. A similar pattern exists in 2000, but the negative relationship between
SAT scores and the propensity to apply for a teaching job is not as strong. By 2008, there
is no relationship between college graduates’ SAT scores and their likelihood of applying
to teach, when controlling for the other variables in the model. Put another way:
31 Specifically, we estimate logistic regressions that include whether the graduate majored in a STEM subject, SAT math and reading composite scores, GPA, and a measure of selectivity of the college from which individuals received their BA based on SAT scores of incoming freshmen, with interactions between cohort year and each of these variables. Models also include the following control variables: race/ethnicity, parental income, whether the graduates’ parents were teachers, and indicators for missing values. The full set of marginal effects estimates are reported in Appendix Table B1. 32 We do this because there is empirical evidence that men and women exhibit different labor market behavior (Reskin & Roos, 1990; Blau et al., 2010), and, as we noted previously, women make up nearly 80 percent of the teacher workforce.

18
individuals with high SAT scores from earlier cohorts were less likely to pursue a
teaching position than their lower-scoring counterpart, but, for the 2008 cohort, high and
low scoring individuals were about equally likely to pursue a teaching job.
In Panel B, we display the predicted probabilities of entering the teacher
workforce for graduates who applied. There are interesting changes over time in both the
relative probability that STEM and non-STEM majors who apply for a teaching job
actually end up teaching, as well as the relationship between SAT scores and the
likelihood of employment. The figure suggests that STEM majors were slightly more
likely to enter the teacher workforce in 1993 and less likely in 2000 compared to non-
STEM majors; however, none of these differences are statistically significant.
We cannot definitively tell from the B&B data whether school systems are
demonstrating preferences for academic competence because we do not know which
applicants are competing for which jobs, or whether individuals applying for teaching
jobs may have opted not to accept an offer. However, we find that if we estimate the
probability of receiving at least one teaching job offer with models identical to those used
to generate Figure 5, the patterns for the predicted probabilities look very similar to the
predicted probabilities of entering the teacher workforce in the year following graduation.
Finally, to account for the possibility that there are changes over time in which
colleges offer teacher preparation programs (Reback, 2004) we also estimate statistical
models that focus on comparisons of graduates within the same college.33 In general the
results are similar whether we look within or across colleges.
33 These models include the same set of covariates described in footnote 34, but also include college fixed effects. Marginal effect estimates from these models are reported in Appendix Table B1.

19
What does all this mean for individuals with different combinations of
characteristics? To help illustrate, we estimate the probability of being employed as a
teacher in the year following graduation for a “typical” white, female STEM and non-
STEM graduate with a SAT scores at the 10th, 50th, and 90th percentile. These
probabilities are displayed in Table 3. STEM majors are less likely than non-STEM
majors to enter into teaching for all cohorts, We find that in 1993 and 2000 the likelihood
of entering teaching is predicted to decrease as SAT scores increase, while this negative
association between SAT scores and the propensity to become a teacher does not exist in
2008.
Finally, we investigate whether there is any pattern across cohorts of new teachers
in the kind of classroom they end up teaching. There is some speculation (Baker et al.,
2010) as well as empirical evidence that teachers could be shying away from instruction
in tested grades and subjects due to increases in the scrutiny and test-based accountability
systems. Clotfelter et al. (2004) find that the introduction of a school accountability
system based on high-stakes testing increased the problem of teacher turnover in low-
performing schools. By contrast, Boyd et al. (2008), find that teachers in New York State
entering into 4th grade teaching positions (the only elementary grade with high-stakes
testing) are less likely to be first-year teachers than other teachers moving into untested
elementary grades, suggesting that beginning teachers may be shying away from tested
grades and subjects.
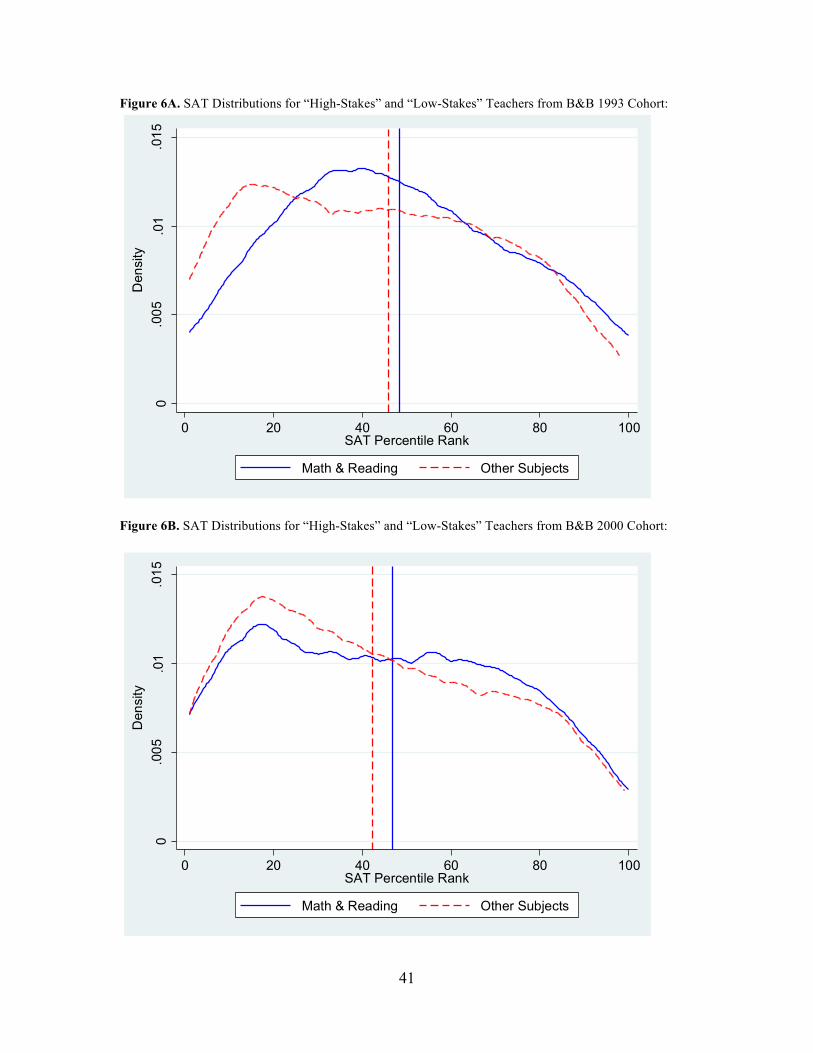
We investigate the patterns of the type of classrooms—those typically associated
with and without high-stakes testing—that new teachers end up in for the different B&B

20
cohorts.34 The panels of Figure 6 show that new teachers in high-stakes classrooms tend
to have higher SAT scores than those in low-stakes classrooms, but, moreover the
differential in teachers’ SAT percentile ranks between the two classroom types has grown
somewhat (to favor those in high-stakes classrooms) between the 1993 and 2008 cohorts
(by about 5.5 SAT percentile points). Test-based accountability greatly increased after
the 2001 passage of No Child Left behind, but we see no evidence that less academically
proficient teachers entering the workforce in the year immediately following graduation
are shying away from (or at least not being assigned to) classrooms that face
accountability pressures.35
[Figure 6 about here]
4. Discussion and Conclusions
It is clear that individuals with different academic skills and training face different
opportunity costs associated with choosing teaching over an alternative occupation. The
argument is easy to understand: in the private sector it is common to see financial
rewards associated with college major, demonstrated academic performance, as measured
by grades, and selectivity of institution (Arcidiacono 2004; Brewer, Eide and Ehrenberg
1999; Grogger and Eide, 1995; Loury and Garman 1995; Rumberger and Thomas 1993)
34 While grades and subjects for high-stakes tests vary by state and district, we define a teacher as “high-stakes” if they teach any math or reading class in grades 4-8. The comparison group includes teachers in grades 4-8 who do not teach math or reading classes. However, the results are qualitatively similar when we expand the comparison to any also include other assignments that are typically not associated with high-stakes testing, such as early childhood and general elementary teachers and non-math and non-reading classes in high school grades. 35 This finding is not necessarily in conflict with the empirical evidence cited above. It is entirely plausible that more experienced teachers do tend to move out of high-stakes classrooms given that seniority often plays a formalized role in determining job placements (e.g. seniority job transfers are codified in collective bargaining agreements) and there also be more churn of teachers in high-stakes classrooms.

21
whereas most school systems rely exclusively on the single salary schedule and do not
differentiate salaries based on characteristics other than degree and experience levels.36
The estimated implications of the dichotomy in pay structure are profound. Several
studies, for instance, suggest opportunity cost differences that run into the thousands of
dollars per year.37
Given the differences in the way that individuals are rewarded, individuals with
stronger academic or technical skills are likely to sacrifice more financially should they
choose to teach. And research shows that the supply of teachers varies across academic
subject areas in ways that are consistent with expectations given the dichotomy in
opportunity costs (Murnane and Steele, 2007).
As we show in the prior section, it appears that there are major changes in the
academic proficiency of those seeking and finding employment in a teaching job in
different years, as measured by SAT scores. There is also some speculation that changes
to state licensure policies— allowing for greater diversity of pathways into the teaching
profession—might be an important source of academic talent for the profession (Johnson
et al., 2005; Nadler and Peterson, 2009; Schaefer, 1999). Unfortunately, we cannot
explore this issue in any depth because there is not consistency over time in how teachers
are asked about their entry into the classroom. But, having said that, we speculate that
alternative routes are unlikely to be the primary explanation for the changing SAT trends
36 While there is a great deal of discussion of reforming the single salary schedule, most school districts still utilize this system to determine teacher compensation. For instance, only about 15 percent of districts offered incentives to attract and retain teachers in hard-to-staff areas in 2007-08 and, in the same year, only about 10 percent of districts report offering pay incentives or step increases on the salary schedule to reward teachers for performance (based on data from the SASS). 37 See, for instance, Goldhaber et al. (2008). This seems to be borne out by what teachers leaving the profession earn. Chingos and West (2012) find that math and science teachers earn salaries roughly comparable to English teachers while teaching, but, among teachers who leave the profession for other industries, science teachers earn about 12 percent more than English teachers and math teachers earn about 15 percent more.

22
given that most alternative certification programs are not highly selective (Constantine et
al., 2009).38
While it is a bit speculative, it is no great leap to suggest that differences in the
labor market context across years help explain this finding. In particular, according to
data from the Bureau of Labor Statistics, the average unemployment rate in 2009 was
about 9.3 percent compared to 6.1 and 4.7 percent in 1994 and 2001, respectively. The
high unemployment rate in 2009 is quite likely to have led a great many high-scoring
graduates to choose to pursue comparatively stable and secure teaching jobs rather than
occupations that were likely to be seen as relatively risky in the economic downturn. By
contrast, those graduating in 2000 were entering the labor market during the tech boom,
when there is likely to have been a good deal of competition for the labor of prospective
teachers.39
Regardless of the reason for the changes in academic proficiency that we observe,
they are encouraging given that they may represent the reversal of the long-term trend of
declining academic talent entering teaching. But we have to be cautious about drawing
too strong a conclusion here as the evidence we present on recent college graduates
provides only a partial picture of the academic skills of new entrants to the teacher labor
market. Systematic national data on the academic caliber of prospective teachers, and
teachers new to the workforce, is limited to those applying or entering teaching in the
year immediately following graduation with a bachelor’s degree. To our knowledge there
38 Some high profile alternative certification programs, such as Teach For America, clearly are highly selective (Feistrizer 1993; Glazerman et al., 2006; Shen 1997), but this is not representative of alternative routes as a whole (Constantine et al., 2009). 39 It is also possible that the findings on changing SATs of teachers over time, which are larger at the secondary level, result from NCLB eligibility requirements that teachers either major in the content area they teach (or earn credit hours equivalent to a major) or pass a qualifying exam. This requirement may be altering either who is selected into teacher training institutions or which teacher applicants are being hired.

23
is no nationally representative dataset with information on the academic caliber of
teachers who come into the profession with a master’s degree, which is an increasingly
important pathway into the teaching profession.40
In contrast to the findings on the relationship between the SAT scores of
individuals and their propensity to end up in the teaching profession, we see little change
across years in the relative propensity of STEM and non-STEM majors to become
teachers. Unfortunately, as a consequence, school systems continue to struggle to fill
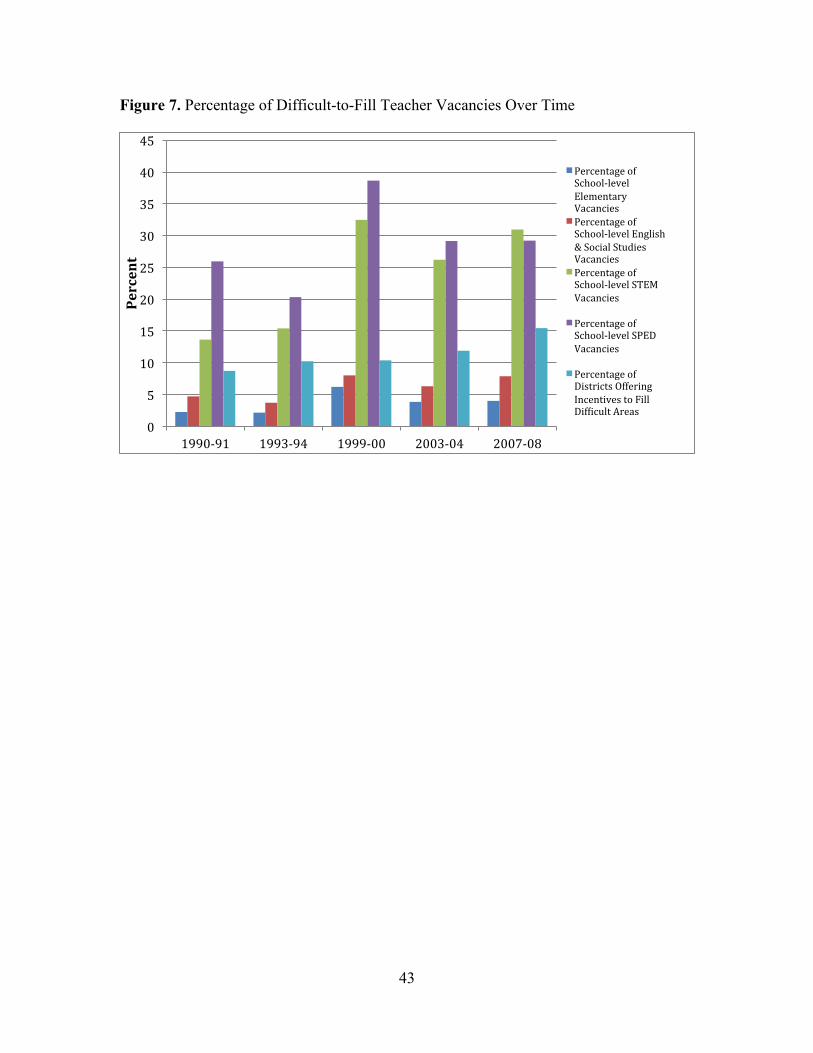
teaching slots in STEM areas (and special education).41 Figure 7 shows the percentage
of teaching position vacancies that are judged by district officials to be difficult to fill is
consistently higher for STEM and special education than vacancies in English, social
studies, and general elementary in each year available, despite the fact that district pay
policies/practices have evolved to deal with shortage areas, with a steady increase in the
percentage of districts offering pay incentives for shortage areas (from about 7.5 percent
in 1987-88 to 15 percent in 2007-08).42
[Figure 7 about here]
Teacher quality has been shown to be the most important schooling resource
affecting student achievement so there are good reasons to be concerned with the
academic caliber of individuals who staff the nation’s classrooms. In this paper, we use a
variety of datasets to investigate the extent to which the academic proficiency of teachers 40 Using SASS data we find that approximately 26 percent of teachers in 2007-08 enter into teaching with a master’s degree. 41 Teaching special education is arguably a more difficult job, as evidenced by higher levels of “burnout” and turnover rates (Fore et al., 2002; McLeskey et al., 2004). 42 This is derived from the school-level SASS questionnaire items “For this school year, were there teaching vacancies in this school, that is, teaching positions for which teachers were recruited and interviewed?” and “How easy or difficult was it to fill the vacancies in each of the following fields?” Responses of “Very difficult” and “Could not fill the vacancy” were coded as being difficult-to-fill.

24
has changed in the last twenty years. In general, we find that teachers have lower SAT
scores compared to non-teachers, but we also see an upward shift for 2008 graduates (for
STEM and non-STEM majors) entering the teacher workforce in 2008-09. This is
encouraging. Less encouraging is the finding that school systems continue to struggle to
find teachers in STEM subjects. It appears that education policies (compensation,
working conditions, etc.) must evolve further if school systems are to move in the
direction of addressing the relative supply constraints that exist around staffing STEM
classrooms.

25
References Aaronson, D., Barrow, L., & Sander, W. (2007). Teachers and student achievement in the
Chicago Public High Schools. Journal of Labor Economics, 25(1), 95–135. Retrieved from http://www.journals.uchicago.edu/doi/abs/10.1086/508733
Achinstein, B., Ogawa, R. T., & Speiglman, A. (2004). Are We Creating Separate and Unequal Tracks of Teachers? The Effects of State Policy, Local Conditions, and Teacher Characteristics on New Teacher Socialization. American Educational Research Journal, 41(3), 557–603. doi:10.3102/00028312041003557
Arcidiacono, P. (2004). Ability sorting and the returns to college major. Journal of Econometrics, 121(1-2), 343–375. doi:10.1016/j.jeconom.2003.10.010
Auguste, B., Kihn, P., & Miller, M. (2010). Closing the talent gap: Attracting and retaining top third graduates to a career in teaching. McKinsey & Co.
Baker, E., Barton, P., Darling-Hammond, L., Haertel, E., Ladd, H., Linn, R., Ravitch, D., Rothstein, R., Shavelson, R., & Shepard, L. (2010). Problems with the use of student test scores to evaluate teachers. Economic Policy Institute Briefing Paper #278.
Ballou, D. (1996). Do Public Schools Hire the Best Applicants? Quarterly Journal of Economics, 111(1), 97–133. Retrieved from <Go to ISI>://A1996TV59400005
Barro, J. (2010). The Teacher Pension Nightmare. Forbes.com. Retrieved May 15, 2013, from http://www.forbes.com/2010/04/14/teacher-pension-education-taxpayers-opinions-contributors-josh-barro.html
Black, D. A., & Smith, J. A. (2004). How robust is the evidence on the effects of college quality? Evidence from matching. Journal of Econometrics, 121(1-2), 99–124. doi:10.1016/j.jeconom.2003.10.006
Blau, F. D., Ferber, M., & Winkler, A. (2010). The Economics of Women, Men, and Work. Librairie Lavoisier. Retrieved from http://www.lavoisier.fr/livre/notice.asp?ouvrage=1091881
Boyd, Donald, Hamilton Lankford, Susanna Loeb and James Wyckoff. (2008). The impact of assessment and accountability on teacher recruitment and retention: Are there unintended consequences? Public Finance Review 36(1): 88-111.
Boyd, D., Lankford, H., Loeb, S., & Wyckoff, J. (2013). Analyzing determinants of the matching of public school teachers to jobs: Disentangling the preferences of teachers and employers. Journal of Labor Economics.
Brewer, D. J., Eide, E. R., & Ehrenberg, R. G. (1999). Does It Pay to Attend an Elite Private College? Cross-Cohort Evidence on the Effects of College Type on Earnings. Journal of Human Resources, 34(1), 104–123. Retrieved from http://links.jstor.org/sici?sici=0022-166X(199924)34:1<104:DIPTAA>2.0.CO;2-F
Buddin, R., & Zamarro, G. (2009). Teacher qualifications and student achievement in urban elementary schools. Journal of Urban Economics, 66(2), 103–115. doi:10.1016/j.jue.2009.05.001
Chamberlin, R., Wragg, T., Haynes, G., & Wragg, C. (2002). Performance-related pay and the teaching profession: a review of the literature. Research Papers in Education, 17(1), 31–49. Retrieved from http://hdl.handle.net/10036/47116
Chetty, R., Friedman, J. N., & Rockoff, J. E. (2011). The Long-Term Impacts of Teachers: Teacher Value-Added and Student Outcomes in Adulthood. NBER Working Paper, 17699.

26
Chingos, M. M., & West, M. R. (2012). Do More Effective Teachers Earn More Outside of the Classroom? Education Finance and Policy, 7(1), 8–43.
Clotfelter,C.,H. Ladd,J. Vigdor,and R. Aliaga. 2004. Do school accountability systems make it more difficult for low performing schools to attract and retain high quality teachers? Journal of Policy Analysis and Management23 (2):251-71.
Clotfelter, C. T., Ladd, H. F., & Vigdor, J. L. (2007). Teacher credentials and student achievement: Longitudinal analysis with student fixed effects. Economics of Education Review, 26(6), 673–682. Retrieved from http://www.caldercenter.org/PDF/1001058_Teacher_Credentials.pdf
Constantine, J., Player, D., Silva, T., Hallgren, K., Grider, M., & Deke, J. (2009). An evaluation of teachers trained through different routes to certification. Final Report for National Center for Education and Regional Assistance, 142.
Corcoran, S. P., Evans, W. N., & Schwab, R. S. (2004). Changing Labor Market Opportunities for Women and the Quality of Teachers 1957-1992. American Economic Review, 94(2), 230–235. Retrieved from http://links.jstor.org/sici?sici=0002-8282(200405)94:2<230:CLOFWA>2.0.CO;2-P
Costrell, R. M., Podgursky, M., & Weller, C. (2011). Fixing Teacher Pensions. Education Next. Retrieved from http://educationnext.org/fixing-teacher-pensions/
Darling-Hammond, L. (2010). Teacher Education and the American Future. Journal of Teacher Education, 61(1-2), 35–47. doi:10.1177/0022487109348024
Davies, S., & Guppy, N. (1997). Fields of Study, College Selectivity, and Student Inequalities in Higher Education. Social Forces, 75(4), 1417–1438. doi:10.2307/2580677
Dillon. (2009). Report Envisions Teacher Shortage Looming. NYTimes.com. April 7, 2009. http://www.nytimes.com/2009/04/07/education/07teacher.html?_r=0
Epstein, D., & Miller, R. T. (2011). Slow off the Mark: Elementary School Teachers and the Crisis in Science, Technology, Engineering, and Math Education. Center for American Progress. Retrieved from http://www.eric.ed.gov/ERICWebPortal/search/detailmini.jsp?_nfpb=true&_&ERICExtSearch_SearchValue_0=ED536070&ERICExtSearch_SearchType_0=no&accno=ED536070
Esch, C. E., Chang-Ross, C. M., Guha, R., Tiffany-Morales, J., & Shields, P. M. (2004). California’s teaching force 2004: Key issues and trends. The Center for the Future of Teaching and Learning.
Feistritzer, C. E. (1993). National Overview of Alternative Teacher Certification. Education and Urban Society, 26(1), 18–28. Retrieved from http://www.eric.ed.gov/ERICWebPortal/search/detailmini.jsp?_nfpb=true&_&ERICExtSearch_SearchValue_0=EJ475255&ERICExtSearch_SearchType_0=no&accno=EJ475255
Fensterwald, J. (2013). Solving teacher retirement system’s shortfall would cost billions. EdSource Today. Available online at http://www.edsource.org/today/2013/solving-teacher-retirement-systems-shortfall-would-cost-billions/29041#.UZQbRxzRQe-
Fore, C., Martin, C., & Bender, W. (2002). Teacher burnout In special education: The causes and the recommended solutions. High School Journal, 86(1), 36–44.

27
Gitomer, D. H. (2007). Teacher Quality in a Changing Policy Landscape: Improvements in the Teacher Pool. Princeton, NJ: Educational Testing Services. Retrieved from http://www.ets.org/Media/Education_Topics/pdf/TQ_full_report.pdf
Gitomer, D. H., & Latham, A. S. (1999). The Academic Quality of Prospective Teachers: The Impact of Admissions and Licensure Testing. (J. Giambattista, Ed.). Princeton, NJ: ETS. Retrieved from http://uwashington.worldcat.org.offcampus.lib.washington.edu/oclc/41472706&referer=brief_results
Glazerman, S., Mayer, D., & Decker, P. (2006). Alternative Routes to Teaching: The Impacts of Teach for America on Student Achievement and Other Outcomes. Journal of Policy Analysis and Management, 25(1), 75-96.
Goldhaber, B. D., DeArmond, M., Player, D., & Choi, H. (2008). Why Do So Few Public School Districts Use Merit Pay ? Journal of Education Finance, 33(3), 262–289. Retrieved from http://www.press.uillinois.edu/journals/jef.html
Goldhaber, D. (2008). “Teachers Matter, But Effective Teacher Quality Policies are Elusive.” In Handbook of Research in Education Finance and Policy, edited by Helen F. Ladd and Edward B. Fiske. New York: Routledge, pp.146-165.
Goldhaber, D. (2007). Everyone’s Doing It, But What Does Teacher Testing Tell Us About Teacher Effectiveness? Journal of Human Resources, 42(4), 765–794.
Goldhaber, D., & Brewer, D. (1997). Why Don’t Schools and Teachers Seem to Matter? Assessing the Impact of Unobservables on Educational Productivity. Journal of Human Resources, 32(3), 505–523. Retrieved from http://links.jstor.org/sici?sici=0022-166X(199722)32:3<505:WDSATS>2.0.CO;2-#
Goldhaber, D., & Hansen, M. (2013). Is it Just a Bad Class? Assessing the Long-term Stability of Estimated Teacher Performance. Economica. Vol 80(319), pp. 589–612.
Goldhaber, D., & Liu, A. (2003). Occupational Choices and the Academic Proficiency of the Teacher Workforce. (W. Fowler, Ed.)Developments in School Finance 2001-2002 (pp. 53–75). Washington, DC: National Center for Educational Statistics. Retrieved from http://nces.ed.gov/pubsearch/pubsinfo.asp?pubid=2003403
Greene, J. (2012). The Imaginary Teacher Shortage. WSJ.com. Retrieved from http://online.wsj.com/article/SB10000872396390443482404578042704123153548.html
Grogger, J., & Eide, E. (1995). Changes in College Skills and the Rise in the College Wage Premium. Journal of Human Resources, 30(2), 280–310. Retrieved from http://links.jstor.org/sici?sici=0022-166X(199521)30:2<280:CICSAT>2.0.CO;2-F
Hanushek, E.A., & Rivkin, S. G. (2006). Teacher quality. Handbook of the Economics of Education, 2, 1051–1078.
Hanushek, Eric A. (1992). The Trade-Off between Child Quantity and Quality. Journal of Political Economy, 100(1), 84–117. Retrieved from http://links.jstor.org/sici?sici=0022-3808(199202)100:1<84:TTBCQA>2.0.CO;2-N
Hanushek, Eric A, & Pace, R. R. (1995). Who Chooses to Teach (and Why)? Economics of Education Review, 14(2), 101–117.
Harris, D. N., & Sass, T. R. (2011). Teacher training, teacher quality and student achievement. Journal of Public Economics, 95(7-8), 798–812. doi:10.1016/j.jpubeco.2010.11.009

28
Henke, R., Geis, S., Giambattista, J., & Knepper, P. (1996). Out of the Lecture hall and Into the Classroom: 1992-1993 College Graduates and Elementary/Secondary School Teaching: with an Essay on Undergraduate Academic Experiences (p. 137). Washington, DC: U.S. Department of Education National Center for Education Statistics. Retrieved from http://eric.ed.gov/ERICWebPortal/Home.portal?_nfpb=true&_pageLabel=RecordDetails&ERICExtSearch_SearchValue_0=ED399898&ERICExtSearch_SearchType_0=eric_accno&objectId=0900000b80124779
Henke, R. R., Chen, X., & Geis, S. (2000). Progress Through the Teacher Pipeline: 1992-93 College Graduates and Elementary/Secondary School Teaching as of 1997. Postsecondary Education Descriptive Analysis Reports. Washington, DC: US Department of Education.
Hill, P. T. (2009). Consequences of Instructional Technology for Human Resource Needs in Education. Creating a New Teaching Profession (pp. 137–163). The Urban Institute.
Hinrichs, P. (Georgetown U. (2013). What Kind of Teachers Are Schools Looking For? Evidence from a Randomized Field Experiment. 38th Annual AEFP Conference.
Hoxby, C. M., & Leigh, A. (2004). Pulled Away or Pushed Out? Explaining the Decline of Teacher Aptitude in the United States. American Economic Review, 94(2), 236–240. Retrieved from http://proquest.umi.com.offcampus.lib.washington.edu/pqdweb?did=663187731&sid=1&Fmt=4&clientId=8991&RQT=309&VName=PQD
Ingersoll, R., & May, L. (2012). Retaining Teachers: How preparation matters. Educational Leadership, (8), 30–34.
Ingersoll, R. M., & Perda, D. (2010). Is the Supply of Mathematics and Science Teachers Sufficient? American Educational Research Journal, 47(3), 563–594. doi:10.3102/0002831210370711
Ingersoll, R. M. (2003). Turnover and Shortages among Science and Mathematics Teachers in the United States. Retrieved from http://www.eric.ed.gov/ERICWebPortal/search/detailmini.jsp?_nfpb=true&_&ERICExtSearch_SearchValue_0=ED472325&ERICExtSearch_SearchType_0=no&accno=ED472325
Koedel, C. (2011, August 19). Grading Standards in Education Departments at Universities. education policy analysis archives. Retrieved from http://epaa.asu.edu/ojs/article/view/905
Koedel, C., Podgursky, M., & Shi, S. (2013). Teacher Pension Systems , the Composition of the Teaching Workforce, and Teacher Quality. Journal of Policy Analysis and Management.
Lakdawalla, D. (2001). The Declining Quality of Teachers. Working Paper No. 8263: National Bureau of Economic Research. Retrieved from http://www.nber.org/papers/w8263
Lankford, H., Loeb, S., & Wyckoff, J. (2002). Teacher Sorting and the Plight of Urban Schools: A Descriptive Analysis. Educational Evaluation and Policy Analysis, 24(1), 37–62. Retrieved from http://links.jstor.org/sici?sici=0162-3737(200221)24:1<37:TSATPO>2.0.CO;2-A

29
Leigh, A. (2010). Estimating teacher effectiveness from two-year changes in students’ test scores. Economics of Education Review, 29(3), 480–488. doi:10.1016/j.econedurev.2009.10.010
Light, A., & Strayer, W. (2000). Determinants of College Completion: School Quality or Student Ability? The Journal of Human Resources, 35(2), 299–332. doi:10.2307/146327
Loury, L. D., & Garman, D. (1995). College Selectivity and Earnings. Journal of Labor Economics, 13(2), 289–308.
McLeskey, J., Tyler, N. C., & Saunders Flippin, S. (2004). The supply of and demand for special education teachers : A review of research regarding the chronic shortage of special education teachers. The Journal of Special Education, 38(1), 5–21.
Mehta, J. (2013). Teachers - Will We Ever Learn? NYTimes.com. Retrieved from http://www.nytimes.com/2013/04/13/opinion/teachers-will-we-ever-learn.html?pagewanted=all&_r=0
Moe, T., Cuban L., & Chubb, J. (2009). Virtual Schools. Education Next, 9(10). Available online at http://educationnext.org/virtual-schools/
Murnane, R. J., & Steele, J. L. (2007). What is the problem? The challenge of providing effective teachers for all children. The Future of Children, 17(1), 15–43. Retrieved from http://muse.jhu.edu/content/crossref/journals/future_of_children/v017/17.1murnane.html
OECD. (2012). Preparing teachers and developing school leaders for the 21st century: Lessons from Around the World. OECD Publishing.
Reback, R. (2004). The Impact of College Course Offerings on the Supply of Academically Talented Public School Teachers. Journal of Econometrics, 121(1-2), 377–404. Retrieved from http://www.sciencedirect.com/science/article/B6VC0-4B3NNHK-1/2/4a5c3a60cd631e7eaf4b4a3c4b6d414b
Reskin, B. F., & Roos, P. A. (1990). Job Queues, Gender Queues: Explaining Women’s Inroads into Male Occupations. (B. F. Reskin & P. A. Roos, Eds.)Job queues gender queues Explaining womens inroads into male occupations (p. 388). Temple University Press. Retrieved from http://search.ebscohost.com/login.aspx?direct=true&db=ecn&AN=0285925&site=ehost-live
Rivkin, S. G., Hanushek, E. A., & Kain, J. F. (2005). Teachers, Schools, and Academic Achievement. Econometrica, 73(2), 417–458. Retrieved from http://www.blackwell-synergy.com/links/doi/10.1111/j.1468-0262.2005.00584.x/abs/
Rockoff, J. E., Jacob, B. A., Kane, T. J., & Staiger, D. O. (2011). Can You Recognize an Effective Teacher When You Recruit One? The Association for Education Finance and Policy, 6(1), 43–74. Retrieved from http://www.aefpweb.org/journal/can-you-recognize-effective-teacher-when-you-recruit-one
Rockoff, J. E., & Speroni, C. (2011). Subjective and objective evaluations of teacher effectiveness: Evidence from New York City. Labour Economics, 18(5), 687–696. doi:10.1016/j.labeco.2011.02.004
Rumberger, R. W., & Thomas, S. L. (1993). The Economic Returns to College Major, Quality and Performance: A Multilevel Analysis of Recent Graduates. Economics of Education Review, 12(1), 1–19.

30
Schaefer, N. (1999). Traditional and Alternative Certification: A View from the Trenches. In Better Teachers, Better Schools, editors: Marci Kanstoroom and Chester E. Finn, Jr. Thomas B. Fordham Foundation. Available online at http://www.edexcellencemedia.net/publications/1999/199907_betterteachersbetterschools/btrtchrs.pdf
Schorr, J., & McGriff, D. (2011). Future Schools: Blending Face-to-Face and Online Learning. Education Next, 11(3), 10–17. Retrieved from http://www.eric.ed.gov/ERICWebPortal/search/detailmini.jsp?_nfpb=true&_&ERICExtSearch_SearchValue_0=EJ960472&ERICExtSearch_SearchType_0=no&accno=EJ960472
Shen, J. (1997). Has the alternative certification policy materialized its promise? A comparison between traditionally and alternatively certified teachers in public schools. Educational Evaluation and Policy Analysis, 19(3), 276–283. Retrieved from http://links.jstor.org/sici?sici=0162-3737(199723)19:3<276:HTACPM>2.0.CO;2-Z
Simburg, S., & Roza, M. (2012). Innovating toward Sustainability: How Computer Labs Can Enable New Staffing Structures, and New Savings. Schools in Crisis: Making Ends Meet. Center on Reinventing Public Education. Retrieved from http://www.eric.ed.gov/ERICWebPortal/search/detailmini.jsp?_nfpb=true&_&ERICExtSearch_SearchValue_0=ED540443&ERICExtSearch_SearchType_0=no&accno=ED540443
Spencer. (2013). Teacher Pension System Hole Getting Deeper. WatchdogWire. Retrieved May 15, 2013, from http://watchdogwire.com/michigan/2013/03/14/teacher-pension-system-hole-getting-deeper/
Tucker, B. (2012). The Flipped Classroom. Education Next, 12(1). Retrieved from http://educationnext.org/the-flipped-classroom/
Tucker, M. (2011). Surpassing Shanghai : an agenda for American education built on the world’s leading systems. Harvard Ed. Harvard Education Press.

31
Tables and Figures

32
Table 1. Characteristics of Datasets Dataset Level Years Number of Observations
Schools and Staffing Survey (SASS)
Teacher and School
1987-88, 1990-91, 1993-94, 1999-2000, 2003-04, 2007-08
257,973 teacher-year observations; 50,057 school-year observations
Integrated Postsecondary Education System (IPEDS)
Post-secondary Institution 1987-2010 7,322
Baccalaureate and Beyond (B&B)
College Graduate 1993-94, 2000-01, 2008-09 36,268
College Board (CB) Post-secondary Institution 1990-2010 6,029
Note: all reported frequencies are unweighted.

33
Table 2. Breakdown of STEM Teachers by Major and Year
B&B Cohorts SASS Cohorts
(Non-STEM Major/STEM Major) (Non-STEM Major/STEM Major)
1994 2001 2009 1988 1991 1994 2000 2004 2008
Teaching Non-STEM Subject 97/3 98/2 99/1 99/1 99/1 99/1 99/1 99/1 99/1
Teaching STEM Subject 69/31 80/20 70/30 73/27 66/34 66/34 62/38 47/54 49/51 Notes: All values are percentages. Samples from B&B cohorts include new teachers in the year following graduation. Samples from SASS cohorts include all teachers.

34
Table 3. Predicted Probabilities of Entering the Teacher Workforce by Major and SAT Percentile
STEM Major Non-STEM Major
SAT 10th Percentile
SAT 50th Percentile
SAT 90th Percentile
SAT 10th Percentile
SAT 50th Percentile
SAT 90th Percentile
1993 0.20 0.15 0.11 0.26 0.20 0.15 2000 0.14 0.13 0.11 0.24 0.21 0.19 2008 0.17 0.18 0.18 0.22 0.22 0.22 Note: Displayed probabilities are for White, female graduates who are employed full-time in the year following graduation.

35
Figure 1. Age of the Teacher Workforce Over Time
87-88: 9%90-91: 10%93-94: 9%99-00: 9%03-04: 13%07-08: 16%
% Over 55
87-88: .5%90-91: .6%93-94: .6%99-00: .6%03-04: .5%07-08: .9%
% Over 65
'87-88'90-91'93-94
'99-00'03-04'07-08
Average Age (Years)87-88: 41.490-91: 42.693-94: 43.199-00: 42.303-04: 42.507-08: 42.2
0.0
1.0
2.0
3.0
4.0
5D
ensi
ty
20 30 40 50 60 70 80Age
Source: Schools and Staffing Survey; observations are weighted to be nationally representative

36
Figure 2A. College Selectivity (Institution Level), Math
Figure 2B. College Selectivity (Institution Level), Verbal

37
Figure 3. Distribution of SAT Percentile Ranks of Teachers from B&B Cohorts
0.0
05.0
1.0
15D
ensi
ty
0 20 40 60 80 100SAT Percentile Rank
1993 Cohort 2000 Cohort
2008 Cohort

38
Figure 4A. Distribution of SAT Percentile Ranks for STEM and Non-STEM Majors from B&B 1993 Cohort:
Figure 4B. Distribution of SAT Percentile Ranks for STEM and Non-STEM Majors from B&B 2000 Cohort:
0.0
05.0
1.0
15D
ensi
ty
0 20 40 60 80 100SAT Percentile Rank
STEM Major in Teaching STEM Major Not in Teaching
Non-STEM Major in Teaching Non-STEM Major Not in Teaching
0.0
05.0
1.0
15.0
2D
ensi
ty
0 20 40 60 80 100SAT Percentile Rank
STEM Major in Teaching STEM Major Not in Teaching
Non-STEM Major in Teaching Non-STEM Major Not in Teaching

39
Figure 4C. Distribution of SAT Percentile Ranks for STEM and Non-STEM Majors from B&B 2008 Cohort:
0.0
05.0
1.0
15.0
2D
ensi
ty
0 20 40 60 80 100SAT Percentile Rank
STEM Major in Teaching STEM Major Not in Teaching
Non-STEM Major in Teaching Non-STEM Major Not in Teaching

40
Figure 5A. Predicted Probabilities of Applying to a Teaching Position by Major and SAT Percentile Rank
Figure 5B. Predicted Probabilities of Entering Teaching Profession for Applicants by Major and SAT Percentile Rank
.1.1
5.2
.25
.3.3
5
Pro
babi
lity
0 20 40 60 80 100SAT Percentile Rank
1994 1994
2001 2001
2009 2009
STEMNon-STEM
.75
.8.8
5.9
.95
Pro
babi
lity
0 20 40 60 80 100SAT Percentile Rank
1994 1994
2001 2001
2009 2009
STEMNon-STEM
41
Figure 6A. SAT Distributions for “High-Stakes” and “Low-Stakes” Teachers from B&B 1993 Cohort:
Figure 6B. SAT Distributions for “High-Stakes” and “Low-Stakes” Teachers from B&B 2000 Cohort:
0.0
05.0
1.0
15D
ensi
ty
0 20 40 60 80 100SAT Percentile Rank
Math & Reading Other Subjects
0.0
05.0
1.0
15D
ensi
ty
0 20 40 60 80 100SAT Percentile Rank
Math & Reading Other Subjects

42
Figure 6B. SAT Distributions for “High-Stakes” and “Low-Stakes” Teachers from B&B 2008 Cohort:
.004
.006
.008
.01
.012
.014
Den
sity
0 20 40 60 80 100SAT Percentile Rank
Math & Reading Other Subjects
43
Figure 7. Percentage of Difficult-to-Fill Teacher Vacancies Over Time
0
5
10
15
20
25
30
35
40
45
1990-‐91 1993-‐94 1999-‐00 2003-‐04 2007-‐08
Percent
Percentage of School-‐level Elementary Vacancies Percentage of School-‐level English & Social Studies Vacancies Percentage of School-‐level STEM Vacancies
Percentage of School-‐level SPED Vacancies
Percentage of Districts Offering Incentives to Fill DifIicult Areas

44
Appendix A. Construction of Variables:
Our “teacher” definition includes respondents who are designated as a regular
elementary/secondary, itinerant, support, or long-term substitute teacher in the year
following graduation. While the B&B variables are not completely consistent across
cohorts (1993/94, 2000/01; 2008/09), we use the variables that provide the most
consistent definition as possible. Robustness checks showed that the results are
qualitatively similar when we use different definitions. We use the following variables
from each B&B cohort to construct the “teacher” variable: 1993/94 B&B variable
“TEACH94”, 2000/01 B&B variable “CGCURPOS”, 2008/09 B&B variable
“B1TEACHR”.
In some parts of the analysis, teachers are further defined as STEM and non-
STEM teachers, based on the primary subjects they teach (rather than certification area).
We use the following variables from each B&B cohort to define STEM teachers: 1993/94
B&B variable “FIELD”, 2000/01 B&B variables “CGTCHS1”, “STATUS”, 2008/09
B&B variables “B1MATH”, “B1SCI”, excluding elementary teachers designated by
“B1EE09”.
We use the following variables from each B&B cohort to define graduates who
applied to a teaching position: 1993/94 B&B variable “APPLICAT”, 2000/01 B&B
variables “CGTCHAPP”, “STATUS”, 2008/09 B&B variables “B1TCHAPP”,
“B1STAT”.
STEM major is defined as the major (life sciences, physical sciences, math,
computer/information science, engineering) in which graduates receive their
undergraduate degree. We use the following variables from each B&B cohort to define

45
STEM major: 1993/94 B&B variable “B2BAMAJR”, 2000/01 B&B variable
“BMAJORS3”, 2008/09 B&B variable “MAJORS23”.
For much of the analysis using B&B data, we restrict our sample to college
graduates who are employed full-time (at least 35 hours per week) in the year
immediately following graduation. We use the following variables from each B&B
cohort to define full-time employment: 1993/94 B&B variable “EMPINTVW”, 2000/01
B&B variable “EMPCUR”, 2008/09 B&B variables “B1LFP09”, “B1HOURS”.
We derive GPA of college graduates using the following variables from each
B&B cohort: 1993/94 B&B variables “NORMGPA” and “GPACUM”, 2000/01 variable
“GPA2”, 2008/09 variable “GPA”.
For the analysis predicting the probability of recent college graduates applying to
a teaching position and entering the teacher workforce we generate a number of
background variables based on the following variables from each B&B cohort: gender
(1993/94, 2000/01, and 2008/09 B&B variables “GENDER”), race/ethnicity (1993/94
B&B variable “B2ETHNIC”, 2000/01 B&B variable “RACE1”, 2008/09 B&B variable
“RACE”), parental income (1993/94, 2000/01, and 2008/09 B&B variables
“CINCOME”), and whether the respondents’ parents were teachers (1993/94 B&B
variables “MOMOC” and “DADOC”, 2000/01 B&B variable “NBMOMCD” and
“NBDADCD”).
For teacher-level SAT scores we use the following variables from each B&B
cohort: 1993/94 B&B variable “SATR10”, 2000/01 and 2008/09 B&B variables
“TESATDER”. The “TESATDER” variable in 2000/01 and 2008/09 includes converted
SAT scores if a respondent took the ACT but not the SAT. For respondents with an ACT

46
but no SAT score in the 1993/94 cohort, we impute SAT scores using the “ACTSCOR2”
variable the ACT/SAT concordance table found at
http://research.collegeboard.org/sites/default/files/publications/2012/7/researchnote-
2009-40-act-sat-concordance-tables.pdf. We use the same conversion for institutions in
the College Board data missing information on SAT scores of incoming freshmen but
who have information on ACT scores. These scores from the College Board data are used
to calculate the “College Selectivity Index” variable. We find the institution-level average
of the 25th and 75th percentiles of incoming freshmen four years prior to the graduation
dates (for example, for the B&B cohort graduating in 2008 we use the scores of incoming
freshmen from 2004. If scores are not available in that particular year we use the most
recent available year. All SAT scores used in the analysis account for the 1995
recentering.
The percentage of difficult-to-fill teacher vacancies is derived from the school-
level SASS questionnaire items “For this school year, were there teaching vacancies in
this school, that is, teaching positions for which teachers were recruited and
interviewed?” and “How easy or difficult was it to fill the vacancies in each of the
following fields?” Responses of “Very difficult” and “Could not fill the vacancy” were
coded as being difficult-to-fill.

47
Appendix B. Table B1. Average Marginal Effects Estimates from Models Predicting Applying to a Teaching Job and Entering Teaching in the Year Immediately Following Graduation Applying Applying Entering Entering No College Fixed Effects College Fixed Effects No College Fixed Effects College Fixed Effects STEM Major 1994 -0.06071 -0.07402 * 0.02205 0.06481 (0.03129) (0.03336) (0.07064) (0.09508) 2001 -0.07664 ** -0.10280 *** -0.08966 -0.15144 (0.02452) (0.02491) (0.05996) (0.10868) 2009 -0.04625 -0.03014 0.00286 0.11359 * (0.03080) (0.03329) (0.04514) (0.05022) SAT 1994 -0.00029 *** -0.00027 *** 6.60E-06 -0.00005 (0.00006) (0.00006) (0.00009) (0.00013) 2001 -0.00012 -0.00014 * -0.00005 0.00008 (0.00006) (0.00006) (0.00006) (0.00011) 2009 0.00002 -0.00009 0.00008 0.00017 (0.00006) (0.00006) (0.00006) (0.00013) College Selectivity Index 1994 -0.00008 0.00021 -0.00014 -0.00074 (0.00009) (0.00018) (0.00018) (0.00047) 2001 -0.00043 *** -0.00014 -0.00009 -0.00059 (0.00008) (0.00017) (0.00010) (0.00035) 2009 -0.00010 0.00035 * 0.00009 0.00012 (0.00009) (0.00017) (0.00009) (0.00032) GPA 1994 0.00111 *** 0.00126 *** 0.00070 * 0.00139 ** (0.00020) (0.00021) (0.00030) (0.00047) 2001 0.00092 *** 0.00139 *** 0.00056 * 0.00081 (0.00018) (0.00022) (0.00022) (0.00041) 2009 0.00119 0.00163 *** 0.00043 * 0.00098 * (0.00021) *** (0.00028) (0.00019) (0.00046) Background Characteristics Black -0.01530 -0.01529 -0.06134 ** -0.07564 (0.01803) (0.02237) (0.02242) (00000) Hispanic 0.04796 ** 0.03021 -0.02832 -0.02276 (0.01699) (0.02089) (0.02489) (00000) Asian -0.15088 *** -0.16210 *** -0.03842 0.10133 (0.03143) (0.03630) (0.05475) (00000) Other Minority 0.01042 0.03096 -0.12189 *** -0.17476 * (0.03094) (0.03273) (0.03590) (00000) Parental Income -4.52E-07 *** -5.00E-07 *** -1.05E-07 -5.47E-08 (1.04E-07) (1.14E-07) (1.37E-07) (1.96E-07) Mother Worked as
Teacher 0.07950 *** 0.08833 *** 0.02148 0.03173
(0.02296) (0.02476) (0.04237) (00000) Father Worked as
Teacher 0.12087 ** 0.09214 * -0.07272 -0.13386
(0.04225) (0.04025) (0.05068) (00000) Observations 13941 12449 3742 1951 Notes: *p<.05, **p<.01, ***p<.001. Standard errors in parentheses. Some observations in the college fixed effects specifications due to no variation in the outcome variable within college. Sample for columns 1 and 2 include female college graduates who are employed full-time in the year following graduation. Sample for columns 3 and 4 include female college graduates who applied to a teaching position in the year following graduation.