Embed Size (px)
Citation preview

RHESSI and Radio Imaging Observations of Microflares
M.R. Kundu, Dept. of Astronomy, University of Maryland, College Park, MDG. Trottet,Observatoire de Paris/Meudon, FranceV.I. Garaimov, Dept. of Astronomy, University of Maryland, College Park, MDP.C. Grigis,Institute of Astronomy, ETH Zurich, CH-8092 Zurich, SwitzerlandE.J.Schmahl, Dept. of Astronomy, University of Maryland, College Park, MD and Lab for Astronomy and Solar Physics, NASA/GSFC

ABSTRACT
We present the analysis of five microflares
Three observed simultaneously by RHESSI in hard X-rays and Nobeyama RadioHeliograph (NoRH) in microwaves (17 GHz) andTwo observed by RHESSI and Nancay RadioHeliograph (NRH) at metric wavelengths (150-450 MHz). Since we have no radio imaging telescopes simultaneously operating at microwave and meter wavelengths in the same time zone, we use a different set of microevents for comparison with metric wavelength counterparts in contrast to that used for comparison with microwave events. This is because we are interested in using the locations and other imaging characteristics of the events from both RHESSI and Nancay instead of just temporal correlation. Here we describe the properties of five events -- three in microwaves and two at metric wavelengths.
Three microwave events corresponding to RHESSI microflares occurred in active region 9934 : 2002 May 3 03:58 ; 2002 May 4 05:08 ; 2002 May 2 01:52 UT
AR 9934 was a complex region which contained a sunspot with astrong negative polarity of the magnetic field on the north side and abipolar region on the south side.
MDI images show fast evolution of the south part of the region. TRACE images show many small loops in the south and thecomplex loop connecting the north sunspot to the south side ofthe region.
NoRH 17-GHz maps show loop-like structure with a maximum above thesunspot and it connects to the south side of the AR. RHESSI mapssuperimposed on the NoRH maps show that X-ray emission in the range3-25 keV are located inside the radio contours.
THE 2002 MAY EVENTS OBSERVED AT NOBEYAMA

During all three events HXR emission was located in the south part of the AR. RHESSI maps for 2002 May 3 (event 1) clearly show an X-ray loop at3-6 keV and two footpoints of the loop in the 6-12 and 12-25 keVranges. These footpoints are located above opposite magneticpolarities as seen in overlays of hard X-ray images on the MDI image.
For 2002 May 4 (event 2) HXR images show a small X-ray loop,located close to the same position as previous event. Footpoints of the X-ray loop are not resolved.
Overlays of HXR images on the MDI image shows that the X-ray loop was located above the magnetic neutral line and it connected two regionswith opposite magnetic polarities.
During both events HXR emission was observed below 25 keV. Total radio flux from the X-ray emitting active region was less than 0.5 sfu.
No significant polarization of the radio emission was observed in either case.

2002 May 2 (event 3) is one of several microflares observed on this day,
which originated in the NE part of the active region. At 01:52:10 UT RHESSI images in 3 energy bands 3-6 keV, 6-12 keV and 12-25 keV overlie a 17-GHz NE source which occupies mostly an MDI negative polarity, implying that the HXR source may be situated above the strongest microwave source -- probably one footpoint of the microwave flaring loop.
The NE source and another SW source seem to contribute to the microflare emission at the same time as judged from the time profiles.
For the maximum phase of 2002 May 3 (event 1) the HXR spectrum was calculated. It could be fitted by three components: thermal bremsstrahlung, atomic emission lines, and power law spectrum. Temperature of the thermal component was about 1.6 keV; the emission measure was about 6 1046 cm-3. Slope of the power law is -3.2.

TRACE images of the AR 9934 with MDI contours
2002 May 03 2002 May 04

Evolution of the magnetic field
The southern part of the active region shows fast evolution of the magneticfield.
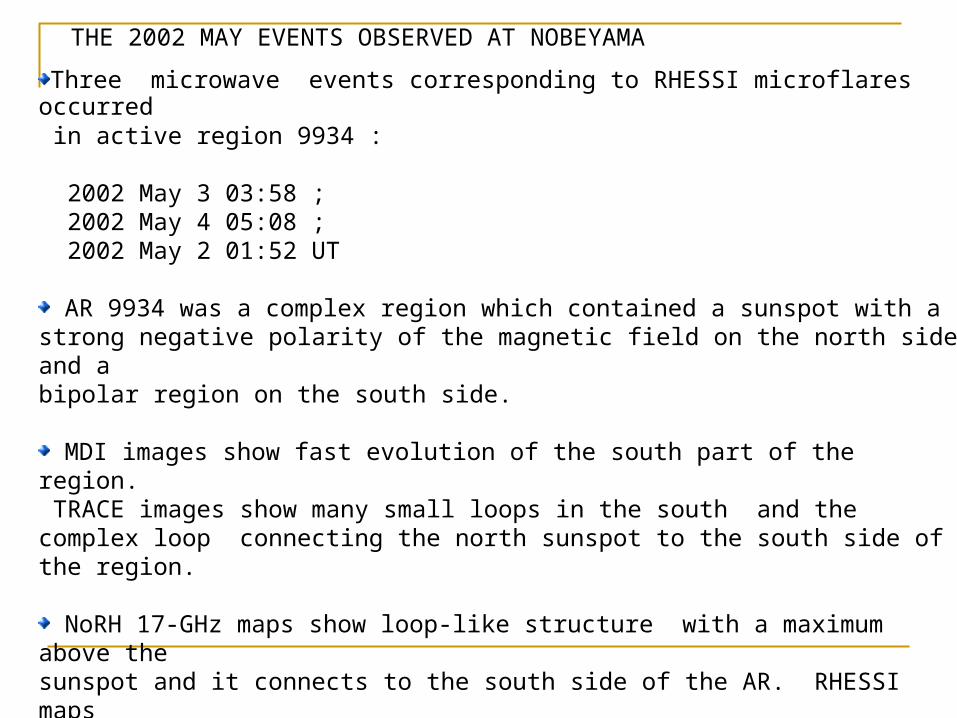
May 02, 2002The microflare concerned occurs at 01:52 UT (first row). The RHESSI andNoRH images show co-located sources superposed on a MDI magnetogram.

May 03, 2002Left: time profiles at 17 GHz and for GOES and RHESSI (3-25 keV)Right: contour maps at 17 GHz and HXR superimposed on MDI magnetogram
The
The microflare concerned (03:58) is shownin the bottom row. HXR loop at 3-6 keV;two footpoints in 6-25 keV.

May 04, 2002Left: time profiles at 17 GHz and for GOES and RHESSI (3-25 keV)Right: contour maps at 17 GHz and HXR superimposed on MDI magnetogram
The event concernedstarts at 0:508 UT (first row). Note a small X-ray loop close to the May 3 location.The HXR source is compact with unresolved footpoints.

X-ray spectrum fitted by three components: thermal bremsstrahlung, atomic lines, and power law
Temperature of the thermal component is about 1.6 keV; emission measure is about 6 1046 cm-3. Slope of the power law is -3.2.

RHESSI HXR spectra for event 1 (May 3). Each panel shows a 5-componentfit for a 12-s time bin using thermal, atomic line emission and nonthermalbremsstrahlung.
12.812.611.312.3Eturn (keV)
0.1530.2190.3490.134F20
6.034.483.333.62
13.79.689.557.25EM (1046 cm-3)
17.317.816.516.3T1 (MK)
4321Time bin
The components are:Temperature (T), emission measure(E), spectral index (), 20-keV flux (F20), and lower cutoff (Eturn)
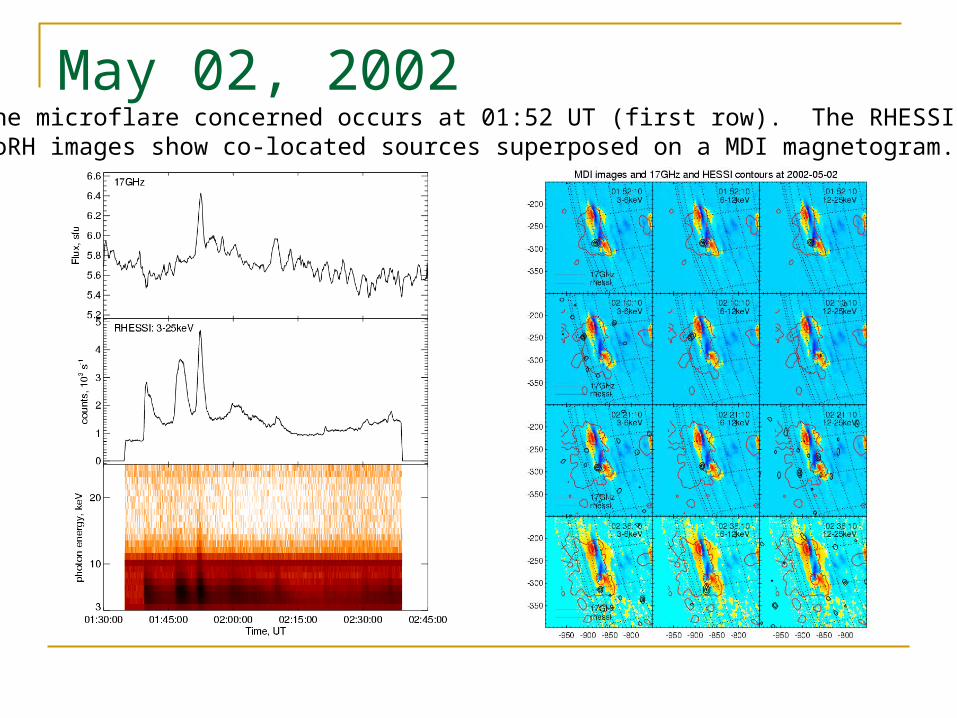
ConclusionsWe have detected microwave (17 GHz) counterparts of RHESSI microflares observed in the energy range 3-50 keV.The microwave emission comes from the foot points (for higher energies), and from the entire small (mini) flaring loop (for lower energies).The relative positions of microwaves and hard X-rays in the higher energy channels are as they should be in normal flares. Sometimes the two (microwave & hard X-ray) sources coincide, at other times the two are at opposite ends of the mini flaring loop. One sees the mini flaring loops clearly in NoRH images.The hard X-ray spectrum of microwave associated RHESSI micro flares can be fit by a thermal component (EM~6*1046 cm-3 at 3-6 keV) at low energies and (sometimes) a nonthermal component (with slope -3.2) at higher energies.At metric wavelengths the type III bursts are often spatially associated with RHESSI microflares. This must have important implications in the propagation of energetic electrons up thru the corona.This result combined with microwave results should provide a good understanding of the topology of coronal structures in which energetic HXR emitting electrons propagate.

Nancay eventsUnfortunately we have no radio imaging telescopes simultaneously operating at Microwave and meter wavelengths in the same time zone. So we’ve used the Nancay(France) metric radioheliograph at 150-450 MHz to study metric counterparts of RHESSI micro-flares and used a different set of microflares for comparison with metric events as opposed to that used for comparison with microwave events. This is because we want to use the locations of events from both RHESSI and Nancay and not just temporal correlation. Here we present a preliminary analysis of such a study. Since both RHESSI HXR and metric type IIIs are produced by beams of electrons, type IIIs are the obvious candidates for such a comparison. We confirmed our identification of bursts by using Potsdam spectral data.

Aug. 05, 2003
Top Left: RHESSI time profile of a microflare, along with Nancay burst time profiles at 150,164,236 MHz. Bottom Left: EIT image with RHESSI and Type III positional data at three frequencies. The RHESSI source is very compact.
Middle top panel: MDI image with RHESSI microflare position.
Right top: Potsdam type III bursts

Sep. 03, 2003
Top Left: RHESSI time profile of a micro flare, along with Nancay burst time profiles at 150,164,236,327,410 MHz. Bottom Left: EIT image with RHESSI and Type III positional data at five frequencies. Note the very compact RHESSI source.Right top: Potsdam type III bursts

Concluding Remarks
Our main conclusion is that RHESSI micro flares are often spatially associated with metric type III bursts. This must have important implications in the propagation of energetic electrons up thru the corona.
This result combined with microwave results should provide a good understanding of the topology of coronal structures in which energetic HXR emitting electrons propagate.


![RHESSI arXiv:0709.1963v3 [astro-ph] 18 Dec 2007](https://img.pdfslide.us/doc/110x75/6199d32546f4a65fd6604a10/rhessi-arxiv07091963v3-astro-ph-18-dec-2007.jpg)