Embed Size (px)
Citation preview
Article
Rheology of the Active Cell Cortex in Mitosis
Elisabeth Fischer-Friedrich,1,2 Yusuke Toyoda,1,3 Cedric J. Cattin,4 Daniel J. Muller,4 Anthony A. Hyman,1,*and Frank Julicher2,*1Max Planck Institute of Molecular Cell Biology and Genetics, Dresden, Germany; 2Max Planck Institute for the Physics of Complex Systems,Dresden, Germany; 3Institute of Life Science, Kurume University, Kurume, Japan; and 4Department of Biosystems Science and Engineering,Eidgenossische Technische Hochschule Zurich, Basel, Switzerland
ABSTRACT The cell cortex is a key structure for the regulation of cell shape and tissue organization. To reach a better under-standing of the mechanics and dynamics of the cortex, we study here HeLa cells in mitosis as a simple model system. Inour assay, single rounded cells are dynamically compressed between two parallel plates. Our measurements indicate thatthe cortical layer is the dominant mechanical element in mitosis as opposed to the cytoplasmic interior. To characterize thetime-dependent rheological response, we extract a complex elastic modulus that characterizes the resistance of the cortexagainst area dilation. In this way, we present a rheological characterization of the cortical actomyosin network in the linearregime. Furthermore, we investigate the influence of actin cross linkers and the impact of active prestress on rheologicalbehavior. Notably, we find that cell mechanics values in mitosis are captured by a simple rheological model characterized bya single timescale on the order of 10 s, which marks the onset of fluidity in the system.
INTRODUCTION
The cell cortex plays a key role in determining cellmechanics,cell shape, and tissue organization (1). The cortical layer is anactin-based filament network linked to the plasma mem-brane (2). It is dynamically maintained at a thickness thathas been estimated to range from 0.05 to 1 mm (2). Manyactin-associated proteins organize the network structure andfilament length including passive cross linkers and active ele-ments such as myosin motors (2). The cortex is therefore anactive material and is mechanically characterized by thecortical tension. This cortical tension results from active con-tractile stress generated in the cytoskeletal network by motorproteins and filament dynamics (1,2). The cortex provides acellwith an effective surface tension (2). In contrast to the sur-face tension of a passive system (3), such as a liquid drop, cellsurface tension can be locally regulated by cellular signalingprocesses (1,4). This allows the cell to use cortical mechanicsto regulate shape and, togetherwith cell adhesion, to guide tis-sue organization (1). For example, cortical tension can regu-late cell shape in a tissue, and drive tissue remodelingprocesses such as T1 transitions (5,6) and cell extrusionsfrom an epithelium (7). During mitosis, increasing cell sur-face tension leads to cell rounding. In this way, cells providesufficient space for the formation of a mitotic spindle unhin-
dered by complex cell geometry found in tissues (8). Cellrounding is associated with major remodeling of the actomy-osin cytoskeleton and an increase in cortical tension that isaccompanied by a corresponding increase of hydrostaticpressure (9–11). Round cells will then divide into two duringcytokinesis, and return to interphase.
While there is extensive work on the mechanics of theinterphase cortex, we know much less about the mechanicsof the mitotic cortex. Therefore, we do not understand howmechanical properties of the cortex change to prepare cellsfor division. Recently, using a parallel plate assay (12), wehave shown that compressed mitotic cells acquire a well-defined shape of minimal surface area (10). This permitstight control of cell geometry during measurements of strainand steady-state active tension. Here, by measuring thesequantities, we show that cell mechanics in mitosis is domi-nated by the cortical layer of the cell. Because we can distin-guish the cortex from the cytoplasm, this allows us tomeasure the time-dependent mechanical response of thecortical layer in vivo.
MATERIALS AND METHODS
Cell culture
We cultured HeLa Kyoto cells expressing a fluorescent histone construct(H2B-GFP) in DMEM supplemented with 10% (vol/vol) fetal bovineserum, 2 mM GlutaMAX, 100 mg/mL penicillin, 100 mg/mL streptomycin,and 0.5 mg/mL geneticin (all Invitrogen, Carlsbad, CA) at 37!C with 5%
Submitted November 2, 2015, and accepted for publication June 9, 2016.
*Correspondence: [email protected] or [email protected]
Editor: Cecile Sykes.
Biophysical Journal 111, 589–600, August 9, 2016 589
http://dx.doi.org/10.1016/j.bpj.2016.06.008
! 2016 Biophysical Society.
CO2. One day before the measurement, 10,000 cells were seeded into a sil-icon cultivation chamber (0.56 cm2, from a 12-well chamber; Ibidi, Mar-tinsried, Germany) that was placed in a 35-mm cell culture dish (glassbottom Fluorodish FD35-100; World Precision Instruments, Sarasota, FL)such that a confluency of z30% is reached at the day of measurement.For atomic force microscopy (AFM) experiments, medium was changedto DMEM (Cat. No. 12800-017; Invitrogen) with 4 mM NaHCO3 bufferedwith 20 mM HEPES/NaOH at pH 7.2. Where indicated, mitotic cells weredetached from cell culture dishes with Trypsin/EDTA and measured ondishes coated with PLL-g-PEG (SuSoS, Dubendorf, Switzerland) that pre-vents cell adhesion but does not induce significant changes in cell surfacetension (13). For PEG-coating, dishes were first plasma-cleaned and thenincubated for z30 min in 0.1 mg/mL PLL-g-PEG solution and afterwardsrinsed with PBS and used up to 24 h afterwards. We used the cytoskeletaldrugs blebbistatin (Cat. No. B0560; Sigma-Aldrich, St. Louis, MO), latrun-culin A (Cat. no. 428021; Merck, www.merck.com), taxol (Cat. No. T7191;Sigma-Aldrich), or nocodazol (Cat. No. M1404; Sigma-Aldrich), whereindicated. Drugs were added to indicated concentrations at least 10 minbefore the experiment. Mitotic arrest of cells was achieved by addition ofS-trityl-L-cysteine (STC; Sigma-Aldrich) 2–8 h before the experiment ata concentration of 2 mM. This allowed conservation of cell mechanicalproperties during measurement times of up to 30 min for one cell (14). Cellsin mitotic arrest were identified by their shape and/or H2B-GFP. Diametersof uncompressed, roundish, mitotic cells typically ranged from 19 to 23 mm.We verified that mechanical properties of cells in mitotic arrest are similarto those of cells in metaphase of mitosis (Fig. S16 in the SupportingMaterial).
Atomic force microscopy
The experimental setup consisted of an atomic force microscope (Nanowi-zard I; JPK Instruments, Berlin, Germany) mounted on an Axiovert 200Moptical, wide-field microscope (Carl Zeiss, Jena, Germany). For imaging,we used a 20" objective (Plan Apochromat, NA ¼ 0.80; Carl Zeiss) andan AxioCam charge-coupled device camera (Carl Zeiss). During measure-ments, cell culture dishes were kept in a petri dish heater (JPK Instruments)at 37!C. On every measurement day, the spring constant of the cantileverwas calibrated using the thermal noise analysis (built-in software; JPK In-struments). Cantilevers were tipless, 200–350-mm long, 35-mm wide, 2-mmthick, and made of pure silicon (NSC12/tipless/noAl or CSC37/tipless/noAl, from MikroMasch; www.mikromasch.com) with nominal force con-stants between 0.3 and 0.8 N/m. Cantilevers were modified in either of twoways to correct for the 10! cantilever tilt and allow for axisymmetricconfinement. For this purpose, cantilevers were supplemented by wedgesconsisting of UV-curing adhesive (Norland Optical Adhesive 63; NorlandProducts, Cranbury, NJ) (12). During measurements, measured force, piezoheight, and time were output at a time resolution of 10 Hz (compressionsteps) or 100 Hz (oscillatory compressions). For AFM compression of de-tached mitotic cells on PEG-coated dishes, we used the CellHesion module(JPK Instruments), which allowed us to vertically control the AFM canti-lever in a 100-mm range (15).
Progressive uniaxial compression of cells
To probe the viscoelastic response of cells, we progressively compressedthem with the AFM cantilever. Before cell compression, the AFM canti-lever was lowered to the dish bottom near the cell until it came into contactwith the surface and then retracted to z15 mm above the surface. There-after, the free cantilever was moved over the cell. The cantilever wasthen gradually lowered in steps of 0.5–1 mm at a set speed of 0.5 mm/s in-terrupted by waiting times of 60–100 s. During these waiting times, theAFM cantilever was held at constant height and the measured force was re-laxing. The force acting on the cantilever was continuously recorded. Theheight of the confined cell was computed as the difference between the
height that the cantilever was raised from the dish surface and loweredonto the cell plus the height of spikes at the rim of the wedge (due to im-perfections in the manufacturing process (12)) and the force-induceddeflection of the cantilever. We estimate a total error of cell height ofz0.5 mm due to unevenness of the cantilever wedge and vertical movementof the cantilever to a position above the cell. The analysis of experimentallymeasured DF in dependence of x is described in detail in Section S2 in theSupporting Material.
Oscillatory compression of cells
To sample the viscoelastic response of cells at a distinct frequency, we per-formed oscillatory compressions of cells. To this end, we sandwiched cellsbetween dish bottom and cantilever wedge and carried out oscillatoryheight modulations of the AFM cantilever with typical oscillation ampli-tudes of 0.1–0.5 mm in a frequency range of 0.01 and 2 Hz (Supporting Ma-terial). During this procedure, the cell was on average kept at a normalizedheight reduction of 30–40%. Oscillatory cantilever height modulationswere generated by a piecewise linear approximation of the sine-functionfor oscillation periods of 0.5, 1, 5, 10, 50, and 100 s in a piezo height controlmode (Supporting Material). If not indicated otherwise, height oscillationswere set to an amplitude of 0.5 mm. If force oscillations became large (forceminima reaching <50% of the average force value), oscillations wererepeated at 0.25-mm amplitude. In this case, the lower-amplitude oscilla-tions were used for stiffness analysis. We also performed cantilever oscilla-tions in the absence of a cell. These blank cantilever oscillations alsogenerated force oscillations. In this case, however, force amplitudes weremuch smaller ((0.02 nN). Accordingly, effects of the medium’s viscosityare negligible. Oscillatory force and cantilever height curves were analyzedin the following way: for every data point, effective tension geff and surfacearea strain ðAðtÞ & hAiÞ=hAi are estimated. An amplitude and a phase angleassociated to the oscillatory time variation of effective tension geff and sur-face area strain are extracted (Supporting Material). To estimate the value ofthe complex elastic modulus at a distinct frequency, we determine the phaseangles 4g and 4eA as well as amplitudes bgeff and beA of effective tension andsurface area strain, respectively. The complex elastic modulus at this fre-quency is then calculated as bg=beAexpið4g&4eA
Þ. In cells treated with a com-bination of latrunculin A (200 nM) and blebbistatin (10 mM), surfacetensions were very low and mitotic cells were not properly rounded ifadhered to the cell culture dish. Therefore, rheological measurementswere performed on PEG-coated dishes in this condition (Table 1, row 6).Cantilever oscillations were chosen as 0.5 mm by default to achieve anacceptable signal/noise.
Restoration of myosin activity throughphotoinactivation of blebbistatin
Rheological measurements including (indirect) photoactivation ofmyosin II in blebbistatin-treated cells were performed on PEG-coateddishes with detached cells. In this way, we could entirely rule out effectsof cell shape changes and adhesion during changing cell surface tension.During photoactivation measurements, we performed cantilever heightoscillations until force oscillations were in steady state. Then, weexposed the cell for z10 s to blue light (GFP excitation, fluorescencelamp). As a consequence, the measured AFM force shoots up and atthe same time, oscillation amplitudes increase (see Fig. 6 a). Then,over a time interval of z10 min, the average force gradually decreasesback to its original value as active blebbistatin reenters the cell (seeFig. 6 a). As this decrease is slow as compared to the sampled oscillationperiods (1, 10 s), we expect that oscillations are close to steady state dur-ing this time interval. We determined the momentary complex elasticmodulus and the average effective tension within moving time windowsof two oscillation periods. Oscillation amplitudes were chosen to be very
Fischer-Friedrich et al.
590 Biophysical Journal 111, 589–600, August 9, 2016
small (0.125 mm) such that the average effective tension could to a goodextent be identified with cell surface tension at steady state.
Gene knock-down through RNA interference
To probe the influence of the molecular composition of the cell cortex on theviscoelastic response of cells, we performed gene knock-downs throughRNA interference (RNAi). Cells were transfected with esiRNA (EupheriaBiotech, Dresden, Germany) targeting the genesMYH9 and ACTN4 at a con-centration of 10 nM (MYH9) and 100 nM (ACTN4), respectively, using thetransfection reagent Lipofectamin RNAiMax (Invitrogen). For a control, weused firefly luciferase esiRNA (F-Luc). At day 0, 30,000 cells were seededintoa 24-well plate (NuncMicroWell PlateswithNunclon;ThermoFisher Sci-entific, Waltham, MA). Transfection was carried out at day 1, medium wasexchanged at day 2 (without antibiotics), and transfected cells were measuredat day 3. Approximately 12 h before measurements, cells were trypsinized,diluted, and transferred onto a glass-bottom petri dish (FD35;World PrecisionInstruments) to achieve a confluency of 20–40% during AFMmeasurements.
Estimating cellular shape and volume during AFMmeasurements
During progressive uniaxial cell compression, a time-lapse of z-stackswas recorded in DIC mode including eight z-planes centered roughlyaround the cell equator (Dt ¼ 10–20 s and Dz ¼ 1 mm). At each compres-sion level, we chose a time point of the time series, where steady forcewas reached and selected the z plane with maximal cell diameter andused this as an estimate of equatorial cell radius. It has been shownpreviously that the shape of mitotic cells during parallel plate confinementis to a very good approximation given by a shape of minimal surfacearea at negligible adhesion (10). Therefore, the equatorial cell radius Req
and cell height h are sufficient parameters to determine cell shape andcell volume (Fig. S9) (10,16). To calculate cell volume, we used the for-mula V ¼ &ðp=24Þhðh2ð3p& 10Þ & 6hðp& 4ÞReq & 24R2
eqÞ, which canbe derived by approximating the profile of the free cell contour by a semi-circle. In this way, we estimated cell volume for progressive cell compres-sion levels. In general, we do not find a trend for increasing or decreasingcell volume due to progressive uniaxial cell compression within the uncer-
tainties of our measurement (z2% error; see Fig. S10). Therefore, we aver-aged volume values of one cell measured at the first four compression levelsand used this average volume as estimated cell volume. Cells that weresampled through oscillatory uniaxial compression were imaged duringslow cantilever oscillations (f¼ 0.01 or 0.02 Hz) and the average equatorialradius during oscillations was determined. The average radius together withaverage cantilever height during oscillations was used to estimate cell vol-ume as described above. Anticipating shapes of minimal cell surface area insteady state of uniaxial cell compression, we could calculate the area ofcontact Acon ¼ pr2con between cell and cantilever wedge (or dish bottom)and the mean curvature H of the free cell surface for each compressionlevel (Fig. S9). To determine the contact radius rcon, we used the
approximative formula rcon ¼ ðReq & ðh=2ÞÞ þ ð2=3Þðffiffiffiffiffiffiffiffiffiffiffiffiffiffiffiffiffiffiffiffiffiffiffiffiffiffiffiffið2R3
eq & hR2eqÞ
q=
ffiffiffiffiffiffiffiffiffiffiffiffiffiffiffiffiffiffiffiffiffiðhþ 2ReqÞ
p& ðReq & ðh=2ÞÞÞ, described in Fischer-Friedrich et al. (10).
Together with measured AFM forces, this allowed us to estimate cell sur-face tension in steady state (10).
Calculations of the uniaxial compression ofelastic model cells
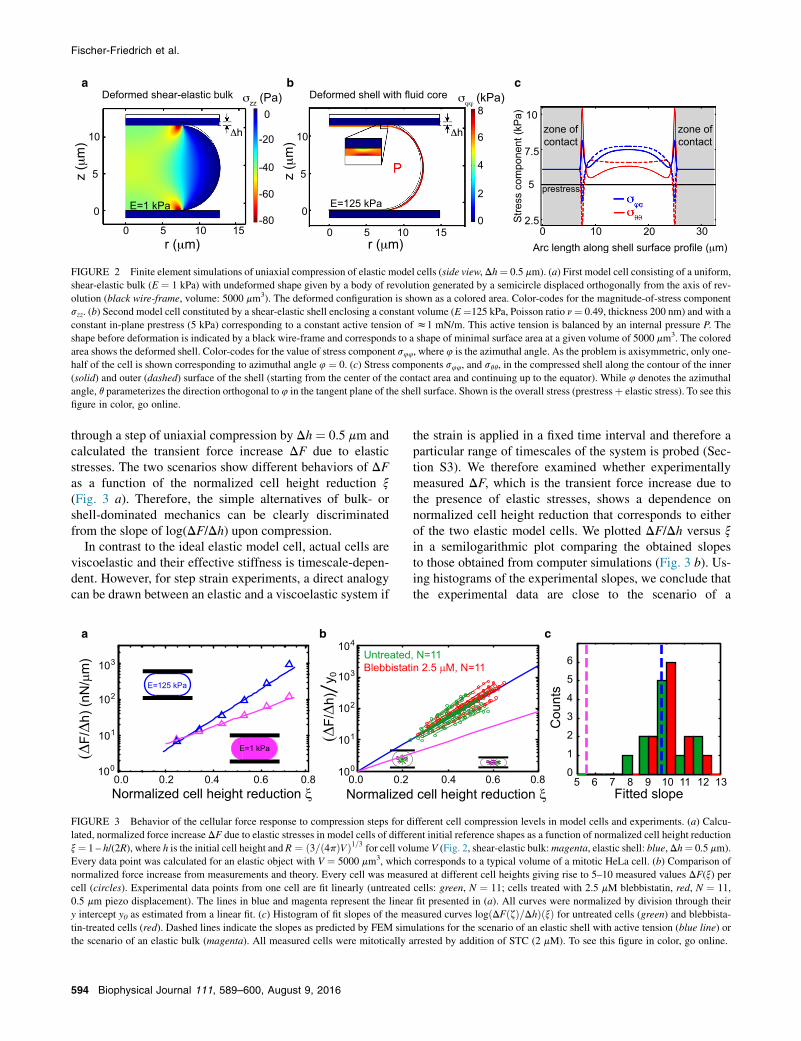
To distinguish between the scenario of a mechanically dominant cell inte-rior or cell cortex, we performed calculations of elastic deformations inidealized model cells. We calculated the elastic deformation of model cellsin two different scenarios with the aid of Comsol Multiphysics (https://www.comsol.com; see the Supporting Material for details). In the first sce-nario, which represents a mechanically dominant cytoplasm, the model cellwas represented by an elastic body of revolution (E ¼ 1000 Pa, n ¼ 0.49)generated by a rectangle and an adjacent semicircle (see black wire-framein Fig. 2 a). In the second scenario, which represents a mechanically domi-nant cortical layer, the model cell was represented by an elastic shell (E ¼125 kPa, n¼ 0.49) whose shape was defined by an outer contour of minimalsurface area and a thickness of 200 nm (10). Furthermore, we assigned auniform, constant mechanical prestress that mimics active tension in thecortex due to the presence of myosin motors. The prestress is a constant,isotropic in-plane stress in the shell that was set to 5000 Pa correspondingto a surface tension of gst ¼ 1 mN/m. We calculated the force increase DFdue to the creation of elastic stresses after a uniaxial compression by Dh re-sulting from a set piezo displacement of 0.5 mm. The total cell volume for
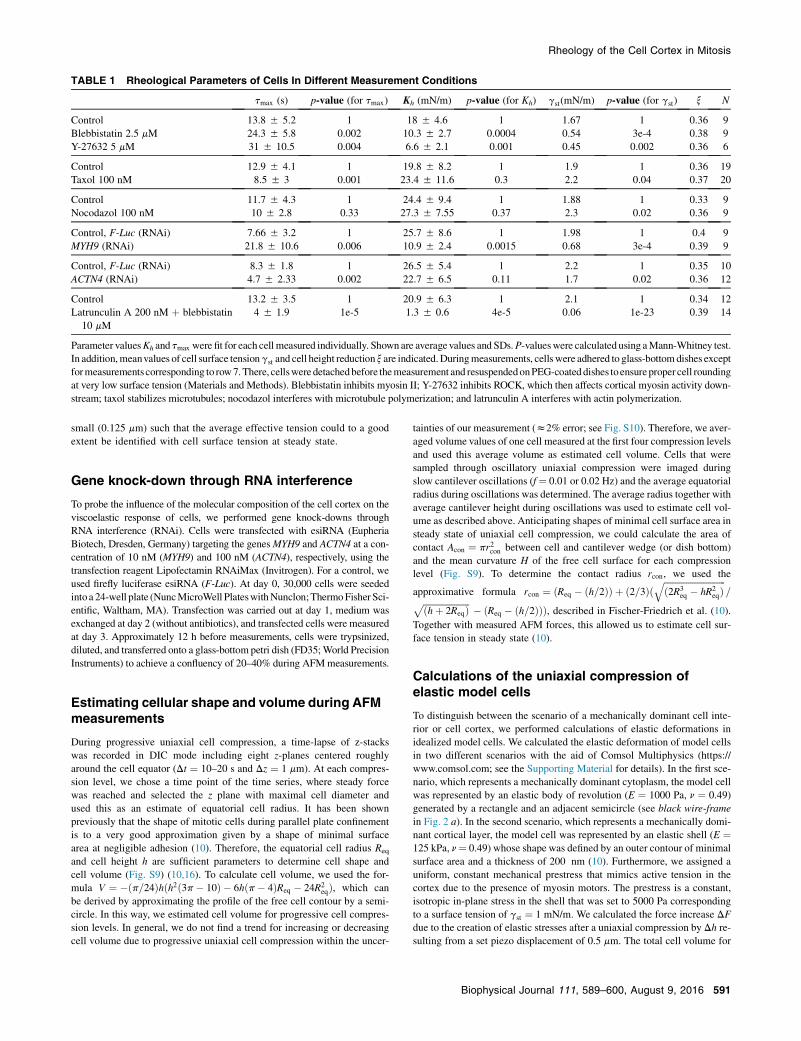
TABLE 1 Rheological Parameters of Cells In Different Measurement Conditions
tmax (s) p-value (for tmax) Kh (mN/m) p-value (for Kh) gst(mN/m) p-value (for gst) x N
Control 13.8 5 5.2 1 18 5 4.6 1 1.67 1 0.36 9Blebbistatin 2.5 mM 24.3 5 5.8 0.002 10.3 5 2.7 0.0004 0.54 3e-4 0.38 9Y-27632 5 mM 31 5 10.5 0.004 6.6 5 2.1 0.001 0.45 0.002 0.36 6
Control 12.9 5 4.1 1 19.8 5 8.2 1 1.9 1 0.36 19Taxol 100 nM 8.5 5 3 0.001 23.4 5 11.6 0.3 2.2 0.04 0.37 20
Control 11.7 5 4.3 1 24.4 5 9.4 1 1.88 1 0.33 9Nocodazol 100 nM 10 5 2.8 0.33 27.3 5 7.55 0.37 2.3 0.02 0.36 9
Control, F-Luc (RNAi) 7.66 5 3.2 1 25.7 5 8.6 1 1.98 1 0.4 9MYH9 (RNAi) 21.8 5 10.6 0.006 10.9 5 2.4 0.0015 0.68 3e-4 0.39 9
Control, F-Luc (RNAi) 8.3 5 1.8 1 26.5 5 5.4 1 2.2 1 0.35 10ACTN4 (RNAi) 4.7 5 2.33 0.002 22.7 5 6.5 0.11 1.7 0.02 0.36 12
Control 13.2 5 3.5 1 20.9 5 6.3 1 2.1 1 0.34 12Latrunculin A 200 nM þ blebbistatin
10 mM4 5 1.9 1e-5 1.3 5 0.6 4e-5 0.06 1e-23 0.39 14
Parameter valuesKh and tmax were fit for each cellmeasured individually. Shownare averagevalues and SDs.P-valueswere calculatedusing aMann-Whitney test.In addition,meanvalues of cell surface tensiongst and cell height reduction x are indicated.Duringmeasurements, cellswere adhered to glass-bottomdishes exceptformeasurementscorresponding to row7.There, cellswere detachedbefore themeasurement and resuspendedonPEG-coateddishes toensureproper cell roundingat very low surface tension (Materials and Methods). Blebbistatin inhibits myosin II; Y-27632 inhibits ROCK, which then affects cortical myosin activity down-stream; taxol stabilizes microtubules; nocodazol interferes with microtubule polymerization; and latrunculin A interferes with actin polymerization.
Rheology of the Cell Cortex in Mitosis
Biophysical Journal 111, 589–600, August 9, 2016 591
both scenarios was V ¼ 5000 mm and was kept constant during the defor-mation. In the case of a shell, volume conservation was realized by the im-plementation of an internal pressure that was adjusted in the process ofcompression. In our calculations, objects are initially free of elastic stressesand only after the performance of the compression step are elastic stressespresent. Calculations were carried out with elastic reference shapes withvarying cell height h corresponding to different values of cell height reduc-tion x ¼ 1& h=ð2RÞ, where R ¼ ð3=ð4pÞVÞ1=3. We find that the functionaldependence of logðDF=DhÞðxÞ is close to linear (see Fig. 3 a). Linear slopesfitted in the x-interval [0.2, 0.6] differ for the two scenarios: while the elasticbulk shows a slope of z5.5, the elastic shell displays a slope of z9.7 (seeFig. 3 a). Simply speaking, the larger slope of logðDF=DhÞðxÞ for the caseof the shell originates from surface area stretch (DA/A) increasing morestrongly than bulk strain (zDh/h) for increasingly oblate equilibriumshapes. These distinct trends allow us to clearly discriminate between thetwo scenarios of a bulk- or a shell-dominated mechanics. To compare theo-retical results with experimental data, we plotted logðDF=DhÞðxÞ for eachcell measured and fit a linear slope (see Fig. 3 b). Indeed, measuredlogðDF=DhÞðxÞ are captured well by a linear dependence and show averageslopes of 10.15 1.2 for untreated, mitotic cells (see Fig. 3, b and c, green,0.5 mm piezo displacement, Dt ¼ 1 s, N ¼ 11). We also measured cellstreated with low doses of blebbistatin (2.5 mM), which leads to a reductionof cell surface tension by inhibition of myosin II. Again, we performed iter-ative cell compression steps on those cells. There, logðDF=DhÞðxÞ followson average a slope of 10.1 5 0.8 (see Fig. 3, b and c, red, N ¼ 11).Comparing slopes as predicted from computer simulations (slope ofz5.5 for elastic bulk and slope of z9.7 for elastic shell) with experimen-tally derived slopes, we concluded that the experimental data are signifi-cantly closer to the scenario of a compressed shell (see Fig. 3 c).
RESULTS
Rheology of thin active films
We first discuss the mechanics of a thin active film as amodel for the cell cortex. The cortex is a dynamic activegel. While myosin and cortical cross-linker proteins turnover on timescales on the order of 1–10 s, actin filaments inthe mitotic cortex turn over on the timescale of roughly1 min (2,17). In the steady state, actomyosin contractilitygenerates an in-plane contractile tension, the cortical tensiondenoted gst. Under dynamic area changes, this film tensionbecomes a dynamic quantity. The rheology of the film underuniform area dilation is characterized to linear order as
gtotðtÞ ¼Z t
&N
G2Dðt & t0Þ_eAðt0Þdt0 þ gst; (1)
where eAðtÞ ¼ ðAðtÞ & A0Þ=A0 is the area strain, A0 is a refer-ence area, and the dot denotes a time derivative. The relaxa-tion modulus G2D(t) describes the time-dependent response,including memory effects and viscoelastic material proper-ties (18). Equation 1 describes a relaxation process by whichthe film tension relaxes to the steady-state value gst. Therelaxation modulus G(t) results in general from a super-position of many collective relaxation modes with a rangeof relaxation times t, and can thus be written as (18)
G2DðtÞ ¼Z N
&N
hðtÞexpð&t=tÞdlnðtÞ: (2)
Here, the relaxation spectrum hðtÞ characterizes the relativeweight of modes with relaxation time t. The function hðtÞcharacterizes the mechanical properties of the material. Inthe absence of detailed knowledge of the internal relaxationprocesses, we use a simple choice of hðtÞ, which corre-sponds to a relaxation spectrum with constant amplitudeup to a maximal time tmax, which is the longest relaxationtime (Fig. S1 a). In short, we choose hðtÞ ¼ Kh for t %tmax and hðtÞ ¼ 0 for t > tmax. With this choice, the relax-ation modulus is given by
G2DðtÞ ¼ &KhEið&t=tmaxÞ; (3)
where EiðzÞ ¼ &RN&z expð&tÞ=tdt is called the exponential
integral (see the Supporting Material). The complex elasticmodulusG(
2DðuÞ ¼RN0 G2DðtÞiu e&iutdt can be decomposed
into a real and an imaginary part as G(2D ¼ G0
2D þ iG002D with
G02DðuÞ ¼ Kh
2log
"1þ ðtmaxuÞ2
#; (4)
G002DðuÞ ¼ KharctanðtmaxuÞ: (5)
This complex elastic modulus characterizes the frequency-dependent response of the active film to area dilation. Thereal-part G0
2D is a two-dimensional (2D) storage modulusthat accounts for the in-phase elastic response. The imagi-nary part G00
2D is a 2D loss modulus that accounts for aviscous response. This dissipative part of the response isphase shifted to the applied oscillatory stress by p/2. Alter-natively, the complex modulus can also be written asG(
2D ¼$$G(
2D
$$ expði4Þ, where the phase 4 describes the lagbetween stress and strain during oscillatory forcing of thematerial. For viscoelastic materials, this phase shift typi-cally ranges between zero and p/2. If the material is solid-like, the phase shift is small and close to zero. Viscousbehavior corresponds to a phase shift close to p/2. Equations4 and 5 provide a simple model to discuss the rheology ofthe cortical layer based on a characteristic timescale and acomplex elastic modulus.
Note that the general form of the relaxation modulusgiven by Eq. 3 is model-independent. A particular choiceof the relaxation spectrum hðtÞ corresponds to a rheologicalmodel. For example, the Maxwell model corresponds to thechoice hðtÞ ¼ Kdðt & t0Þ, where t0 is the Maxwell timeand K is an elastic modulus. Our choice of the relaxationspectrum giving rise to the moduli (3–5) captures the essen-tial features of the experimental data using only two param-eters. Note that our model is fundamentally different fromthe Maxwell model as it captures a broad spectrum of relax-ation processes. Power laws are often used to fit experi-mental data. Power laws also imply the existence of abroad relaxation spectrum. However, in the presence of amaximal relaxation time of the system, the power lawmust be cut off (Section S1). In the cortex, a maximal
Fischer-Friedrich et al.
592 Biophysical Journal 111, 589–600, August 9, 2016
relaxation time exists because of filament turnover. As dis-cussed in Results, a power-law relaxation spectrum withoutcutoff does not provide a good fit to the data.
Cell compression between two parallel plates
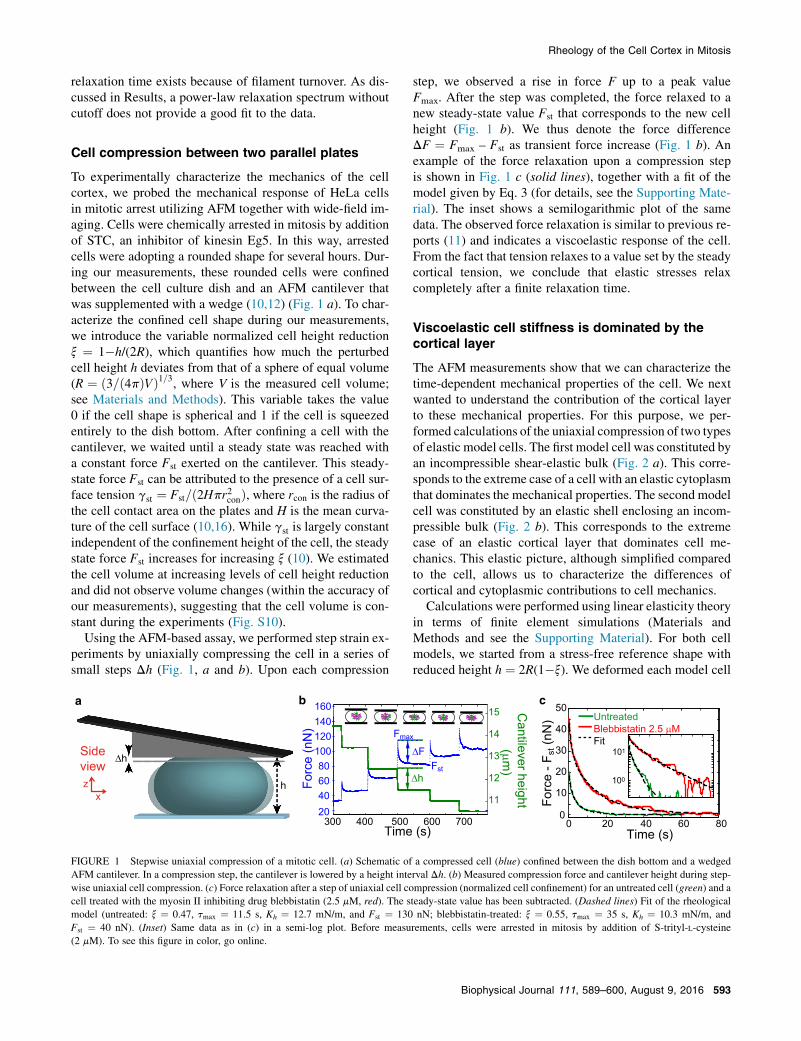
To experimentally characterize the mechanics of the cellcortex, we probed the mechanical response of HeLa cellsin mitotic arrest utilizing AFM together with wide-field im-aging. Cells were chemically arrested in mitosis by additionof STC, an inhibitor of kinesin Eg5. In this way, arrestedcells were adopting a rounded shape for several hours. Dur-ing our measurements, these rounded cells were confinedbetween the cell culture dish and an AFM cantilever thatwas supplemented with a wedge (10,12) (Fig. 1 a). To char-acterize the confined cell shape during our measurements,we introduce the variable normalized cell height reductionx ¼ 1&h/(2R), which quantifies how much the perturbedcell height h deviates from that of a sphere of equal volume(R ¼ ð3=ð4pÞVÞ1=3, where V is the measured cell volume;see Materials and Methods). This variable takes the value0 if the cell shape is spherical and 1 if the cell is squeezedentirely to the dish bottom. After confining a cell with thecantilever, we waited until a steady state was reached witha constant force Fst exerted on the cantilever. This steady-state force Fst can be attributed to the presence of a cell sur-face tension gst ¼ Fst=ð2Hpr2conÞ, where rcon is the radius ofthe cell contact area on the plates and H is the mean curva-ture of the cell surface (10,16). While gst is largely constantindependent of the confinement height of the cell, the steadystate force Fst increases for increasing x (10). We estimatedthe cell volume at increasing levels of cell height reductionand did not observe volume changes (within the accuracy ofour measurements), suggesting that the cell volume is con-stant during the experiments (Fig. S10).
Using the AFM-based assay, we performed step strain ex-periments by uniaxially compressing the cell in a series ofsmall steps Dh (Fig. 1, a and b). Upon each compression
step, we observed a rise in force F up to a peak valueFmax. After the step was completed, the force relaxed to anew steady-state value Fst that corresponds to the new cellheight (Fig. 1 b). We thus denote the force differenceDF ¼ Fmax – Fst as transient force increase (Fig. 1 b). Anexample of the force relaxation upon a compression stepis shown in Fig. 1 c (solid lines), together with a fit of themodel given by Eq. 3 (for details, see the Supporting Mate-rial). The inset shows a semilogarithmic plot of the samedata. The observed force relaxation is similar to previous re-ports (11) and indicates a viscoelastic response of the cell.From the fact that tension relaxes to a value set by the steadycortical tension, we conclude that elastic stresses relaxcompletely after a finite relaxation time.
Viscoelastic cell stiffness is dominated by thecortical layer
The AFM measurements show that we can characterize thetime-dependent mechanical properties of the cell. We nextwanted to understand the contribution of the cortical layerto these mechanical properties. For this purpose, we per-formed calculations of the uniaxial compression of two typesof elastic model cells. The first model cell was constituted byan incompressible shear-elastic bulk (Fig. 2 a). This corre-sponds to the extreme case of a cell with an elastic cytoplasmthat dominates the mechanical properties. The second modelcell was constituted by an elastic shell enclosing an incom-pressible bulk (Fig. 2 b). This corresponds to the extremecase of an elastic cortical layer that dominates cell me-chanics. This elastic picture, although simplified comparedto the cell, allows us to characterize the differences ofcortical and cytoplasmic contributions to cell mechanics.
Calculations were performed using linear elasticity theoryin terms of finite element simulations (Materials andMethods and see the Supporting Material). For both cellmodels, we started from a stress-free reference shape withreduced height h ¼ 2R(1&x). We deformed each model cell
∆h
b c
Time (s)
Cantilever height
(µm)
∆hForc
e (n
N)
300 400 500 600 700
11
12
13
14
15
h
Time (s)
100
101
UntreatedBlebbistatin 2.5 µMFit
Forc
e - F
st (n
N)
0 20 40 60 80
10
0
20
30
40
50
20406080
100120140160
Fmax
∆FFst
a
Sideview
xz
FIGURE 1 Stepwise uniaxial compression of a mitotic cell. (a) Schematic of a compressed cell (blue) confined between the dish bottom and a wedgedAFM cantilever. In a compression step, the cantilever is lowered by a height interval Dh. (b) Measured compression force and cantilever height during step-wise uniaxial cell compression. (c) Force relaxation after a step of uniaxial cell compression (normalized cell confinement) for an untreated cell (green) and acell treated with the myosin II inhibiting drug blebbistatin (2.5 mM, red). The steady-state value has been subtracted. (Dashed lines) Fit of the rheologicalmodel (untreated: x ¼ 0.47, tmax ¼ 11.5 s, Kh ¼ 12.7 mN/m, and Fst ¼ 130 nN; blebbistatin-treated: x ¼ 0.55, tmax ¼ 35 s, Kh ¼ 10.3 mN/m, andFst ¼ 40 nN). (Inset) Same data as in (c) in a semi-log plot. Before measurements, cells were arrested in mitosis by addition of S-trityl-L-cysteine(2 mM). To see this figure in color, go online.
Rheology of the Cell Cortex in Mitosis
Biophysical Journal 111, 589–600, August 9, 2016 593
through a step of uniaxial compression by Dh ¼ 0.5 mm andcalculated the transient force increase DF due to elasticstresses. The two scenarios show different behaviors of DFas a function of the normalized cell height reduction x(Fig. 3 a). Therefore, the simple alternatives of bulk- orshell-dominated mechanics can be clearly discriminatedfrom the slope of log(DF/Dh) upon compression.
In contrast to the ideal elastic model cell, actual cells areviscoelastic and their effective stiffness is timescale-depen-dent. However, for step strain experiments, a direct analogycan be drawn between an elastic and a viscoelastic system if
the strain is applied in a fixed time interval and therefore aparticular range of timescales of the system is probed (Sec-tion S3). We therefore examined whether experimentallymeasured DF, which is the transient force increase due tothe presence of elastic stresses, shows a dependence onnormalized cell height reduction that corresponds to eitherof the two elastic model cells. We plotted DF/Dh versus xin a semilogarithmic plot comparing the obtained slopesto those obtained from computer simulations (Fig. 3 b). Us-ing histograms of the experimental slopes, we conclude thatthe experimental data are close to the scenario of a
a b c
FIGURE 2 Finite element simulations of uniaxial compression of elastic model cells (side view, Dh¼ 0.5 mm). (a) First model cell consisting of a uniform,shear-elastic bulk (E ¼ 1 kPa) with undeformed shape given by a body of revolution generated by a semicircle displaced orthogonally from the axis of rev-olution (black wire-frame, volume: 5000 mm3). The deformed configuration is shown as a colored area. Color-codes for the magnitude-of-stress componentszz. (b) Second model cell constituted by a shear-elastic shell enclosing a constant volume (E¼125 kPa, Poisson ratio n¼ 0.49, thickness 200 nm) and with aconstant in-plane prestress (5 kPa) corresponding to a constant active tension of z1 mN/m. This active tension is balanced by an internal pressure P. Theshape before deformation is indicated by a black wire-frame and corresponds to a shape of minimal surface area at a given volume of 5000 mm3. The coloredarea shows the deformed shell. Color-codes for the value of stress component s44, where 4 is the azimuthal angle. As the problem is axisymmetric, only one-half of the cell is shown corresponding to azimuthal angle 4 ¼ 0. (c) Stress components s44, and sqq, in the compressed shell along the contour of the inner(solid) and outer (dashed) surface of the shell (starting from the center of the contact area and continuing up to the equator). While 4 denotes the azimuthalangle, q parameterizes the direction orthogonal to 4 in the tangent plane of the shell surface. Shown is the overall stress (prestressþ elastic stress). To see thisfigure in color, go online.
Fitted slope
a b
100
101
102
103
0.20.0 0.4 0.6 0.8 0.20.0 0.4 0.6 0.8Normalized cell height reduction ξNormalized cell height reduction ξ
(∆F/∆h
) (nN
/ µm
)
100
101
102
103
104
(∆F/∆h
) y 0
Untreated, N=11Blebbistatin 2.5 µM, N=11
E=125 kPa
E=1 kPa
c
0
1
2
3
4
5
6
Cou
nts
5 6 7 8 9 10 11 12 13
FIGURE 3 Behavior of the cellular force response to compression steps for different cell compression levels in model cells and experiments. (a) Calcu-lated, normalized force increase DF due to elastic stresses in model cells of different initial reference shapes as a function of normalized cell height reductionx¼ 1 – h/(2R), where h is the initial cell height and R ¼ ð3=ð4pÞVÞ1=3 for cell volume V (Fig. 2, shear-elastic bulk:magenta, elastic shell: blue,Dh¼ 0.5 mm).Every data point was calculated for an elastic object with V ¼ 5000 mm3, which corresponds to a typical volume of a mitotic HeLa cell. (b) Comparison ofnormalized force increase from measurements and theory. Every cell was measured at different cell heights giving rise to 5–10 measured values DF(x) percell (circles). Experimental data points from one cell are fit linearly (untreated cells: green, N ¼ 11; cells treated with 2.5 mM blebbistatin, red, N ¼ 11,0.5 mm piezo displacement). The lines in blue and magenta represent the linear fit presented in (a). All curves were normalized by division through theiry intercept y0 as estimated from a linear fit. (c) Histogram of fit slopes of the measured curves logðDFðzÞ=DhÞðxÞ for untreated cells (green) and blebbista-tin-treated cells (red). Dashed lines indicate the slopes as predicted by FEM simulations for the scenario of an elastic shell with active tension (blue line) orthe scenario of an elastic bulk (magenta). All measured cells were mitotically arrested by addition of STC (2 mM). To see this figure in color, go online.
Fischer-Friedrich et al.
594 Biophysical Journal 111, 589–600, August 9, 2016
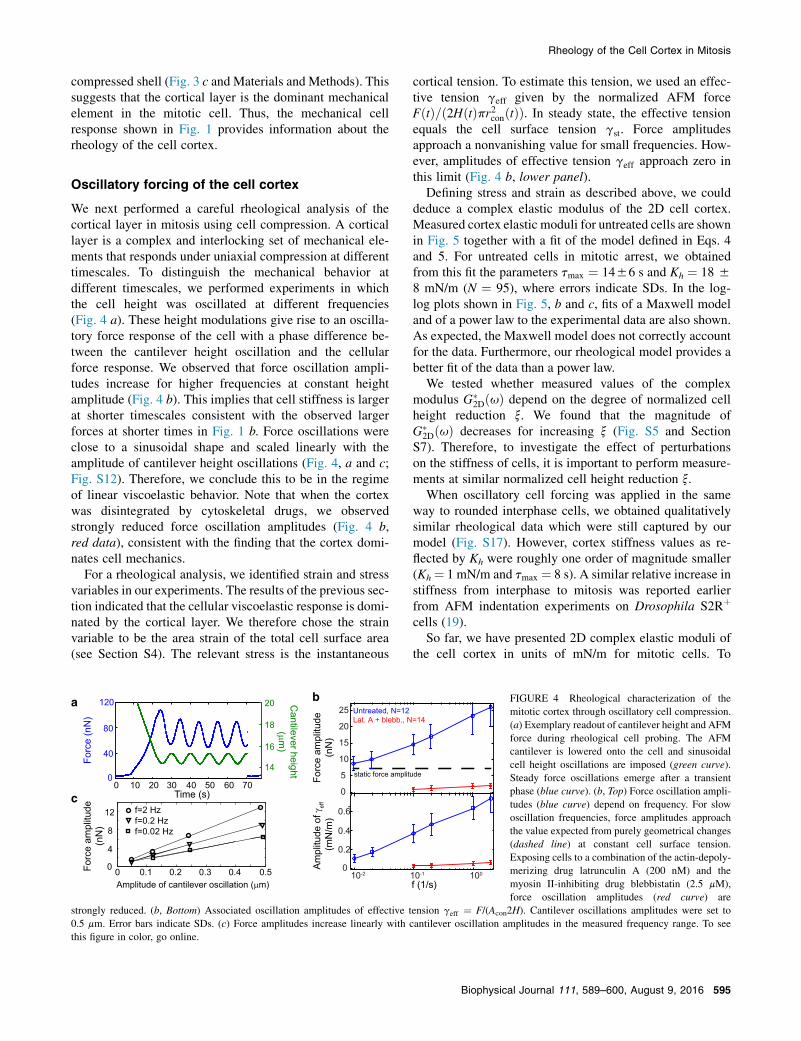
compressed shell (Fig. 3 c and Materials and Methods). Thissuggests that the cortical layer is the dominant mechanicalelement in the mitotic cell. Thus, the mechanical cellresponse shown in Fig. 1 provides information about therheology of the cell cortex.
Oscillatory forcing of the cell cortex
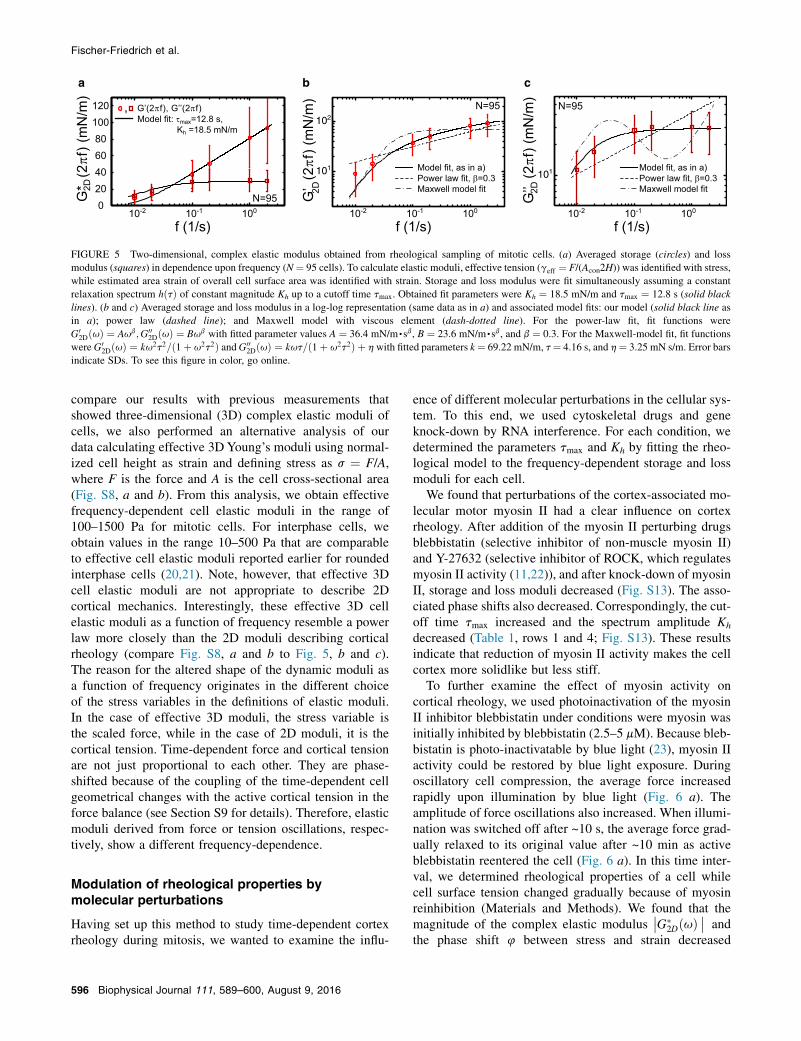
We next performed a careful rheological analysis of thecortical layer in mitosis using cell compression. A corticallayer is a complex and interlocking set of mechanical ele-ments that responds under uniaxial compression at differenttimescales. To distinguish the mechanical behavior atdifferent timescales, we performed experiments in whichthe cell height was oscillated at different frequencies(Fig. 4 a). These height modulations give rise to an oscilla-tory force response of the cell with a phase difference be-tween the cantilever height oscillation and the cellularforce response. We observed that force oscillation ampli-tudes increase for higher frequencies at constant heightamplitude (Fig. 4 b). This implies that cell stiffness is largerat shorter timescales consistent with the observed largerforces at shorter times in Fig. 1 b. Force oscillations wereclose to a sinusoidal shape and scaled linearly with theamplitude of cantilever height oscillations (Fig. 4, a and c;Fig. S12). Therefore, we conclude this to be in the regimeof linear viscoelastic behavior. Note that when the cortexwas disintegrated by cytoskeletal drugs, we observedstrongly reduced force oscillation amplitudes (Fig. 4 b,red data), consistent with the finding that the cortex domi-nates cell mechanics.
For a rheological analysis, we identified strain and stressvariables in our experiments. The results of the previous sec-tion indicated that the cellular viscoelastic response is domi-nated by the cortical layer. We therefore chose the strainvariable to be the area strain of the total cell surface area(see Section S4). The relevant stress is the instantaneous
cortical tension. To estimate this tension, we used an effec-tive tension geff given by the normalized AFM forceFðtÞ=ð2HðtÞpr2conðtÞÞ. In steady state, the effective tensionequals the cell surface tension gst. Force amplitudesapproach a nonvanishing value for small frequencies. How-ever, amplitudes of effective tension geff approach zero inthis limit (Fig. 4 b, lower panel).
Defining stress and strain as described above, we coulddeduce a complex elastic modulus of the 2D cell cortex.Measured cortex elastic moduli for untreated cells are shownin Fig. 5 together with a fit of the model defined in Eqs. 4and 5. For untreated cells in mitotic arrest, we obtainedfrom this fit the parameters tmax ¼ 1456 s and Kh ¼ 18 58 mN/m (N ¼ 95), where errors indicate SDs. In the log-log plots shown in Fig. 5, b and c, fits of a Maxwell modeland of a power law to the experimental data are also shown.As expected, the Maxwell model does not correctly accountfor the data. Furthermore, our rheological model provides abetter fit of the data than a power law.
We tested whether measured values of the complexmodulus G(
2DðuÞ depend on the degree of normalized cellheight reduction x. We found that the magnitude ofG(
2DðuÞ decreases for increasing x (Fig. S5 and SectionS7). Therefore, to investigate the effect of perturbationson the stiffness of cells, it is important to perform measure-ments at similar normalized cell height reduction x.
When oscillatory cell forcing was applied in the sameway to rounded interphase cells, we obtained qualitativelysimilar rheological data which were still captured by ourmodel (Fig. S17). However, cortex stiffness values as re-flected by Kh were roughly one order of magnitude smaller(Kh¼ 1 mN/m and tmax ¼ 8 s). A similar relative increase instiffness from interphase to mitosis was reported earlierfrom AFM indentation experiments on Drosophila S2Rþ
cells (19).So far, we have presented 2D complex elastic moduli of
the cell cortex in units of mN/m for mitotic cells. To
Forc
e am
plitu
de(n
N)
Untreated, N=12Lat. A + blebb., N=14
0
5
10
15
20
25
c
a b
static force amplitude
Cantilever height
(µm)
0
40
80
120
Forc
e (n
N)
0 10 20 30 40 50 60 70
14
16
18
20
0
4
8
12
0 0.1 0.2 0.3 0.4 0.5Amplitude of cantilever oscillation (µm)
Time (s)f=2 Hzf=0.2 Hzf=0.02 Hz
Forc
e am
plitu
de(n
N)
0.6
0.4
0.2
0
f (1/s)10-110-2 100
Ampl
itude
of γ
eff
(mN
/m)
FIGURE 4 Rheological characterization of themitotic cortex through oscillatory cell compression.(a) Exemplary readout of cantilever height and AFMforce during rheological cell probing. The AFMcantilever is lowered onto the cell and sinusoidalcell height oscillations are imposed (green curve).Steady force oscillations emerge after a transientphase (blue curve). (b, Top) Force oscillation ampli-tudes (blue curve) depend on frequency. For slowoscillation frequencies, force amplitudes approachthe value expected from purely geometrical changes(dashed line) at constant cell surface tension.Exposing cells to a combination of the actin-depoly-merizing drug latrunculin A (200 nM) and themyosin II-inhibiting drug blebbistatin (2.5 mM),force oscillation amplitudes (red curve) are
strongly reduced. (b, Bottom) Associated oscillation amplitudes of effective tension geff ¼ F/(Acon2H). Cantilever oscillations amplitudes were set to0.5 mm. Error bars indicate SDs. (c) Force amplitudes increase linearly with cantilever oscillation amplitudes in the measured frequency range. To seethis figure in color, go online.
Rheology of the Cell Cortex in Mitosis
Biophysical Journal 111, 589–600, August 9, 2016 595
compare our results with previous measurements thatshowed three-dimensional (3D) complex elastic moduli ofcells, we also performed an alternative analysis of ourdata calculating effective 3D Young’s moduli using normal-ized cell height as strain and defining stress as s ¼ F/A,where F is the force and A is the cell cross-sectional area(Fig. S8, a and b). From this analysis, we obtain effectivefrequency-dependent cell elastic moduli in the range of100–1500 Pa for mitotic cells. For interphase cells, weobtain values in the range 10–500 Pa that are comparableto effective cell elastic moduli reported earlier for roundedinterphase cells (20,21). Note, however, that effective 3Dcell elastic moduli are not appropriate to describe 2Dcortical mechanics. Interestingly, these effective 3D cellelastic moduli as a function of frequency resemble a powerlaw more closely than the 2D moduli describing corticalrheology (compare Fig. S8, a and b to Fig. 5, b and c).The reason for the altered shape of the dynamic moduli asa function of frequency originates in the different choiceof the stress variables in the definitions of elastic moduli.In the case of effective 3D moduli, the stress variable isthe scaled force, while in the case of 2D moduli, it is thecortical tension. Time-dependent force and cortical tensionare not just proportional to each other. They are phase-shifted because of the coupling of the time-dependent cellgeometrical changes with the active cortical tension in theforce balance (see Section S9 for details). Therefore, elasticmoduli derived from force or tension oscillations, respec-tively, show a different frequency-dependence.
Modulation of rheological properties bymolecular perturbations
Having set up this method to study time-dependent cortexrheology during mitosis, we wanted to examine the influ-
ence of different molecular perturbations in the cellular sys-tem. To this end, we used cytoskeletal drugs and geneknock-down by RNA interference. For each condition, wedetermined the parameters tmax and Kh by fitting the rheo-logical model to the frequency-dependent storage and lossmoduli for each cell.
We found that perturbations of the cortex-associated mo-lecular motor myosin II had a clear influence on cortexrheology. After addition of the myosin II perturbing drugsblebbistatin (selective inhibitor of non-muscle myosin II)and Y-27632 (selective inhibitor of ROCK, which regulatesmyosin II activity (11,22)), and after knock-down of myosinII, storage and loss moduli decreased (Fig. S13). The asso-ciated phase shifts also decreased. Correspondingly, the cut-off time tmax increased and the spectrum amplitude Kh
decreased (Table 1, rows 1 and 4; Fig. S13). These resultsindicate that reduction of myosin II activity makes the cellcortex more solidlike but less stiff.
To further examine the effect of myosin activity oncortical rheology, we used photoinactivation of the myosinII inhibitor blebbistatin under conditions were myosin wasinitially inhibited by blebbistatin (2.5–5 mM). Because bleb-bistatin is photo-inactivatable by blue light (23), myosin IIactivity could be restored by blue light exposure. Duringoscillatory cell compression, the average force increasedrapidly upon illumination by blue light (Fig. 6 a). Theamplitude of force oscillations also increased. When illumi-nation was switched off after ~10 s, the average force grad-ually relaxed to its original value after ~10 min as activeblebbistatin reentered the cell (Fig. 6 a). In this time inter-val, we determined rheological properties of a cell whilecell surface tension changed gradually because of myosinreinhibition (Materials and Methods). We found that themagnitude of the complex elastic modulus
$$G(2DðuÞ
$$ andthe phase shift 4 between stress and strain decreased
a b c
Model fit: τmax=12.8 s, Kh =18.5 mN/mPower law fit, β=0.3
f (1/s) f (1/s) f (1/s)
G*
(2πf
) (m
N/m
)2D 2D 2D
10-110-2 100 10-110-2 100 10-110-2 100N=95
020406080
100120 G’(2πf), G’’(2πf),
Model fit, as in a)Power law fit, β=0.3Maxwell model fit
Model fit, as in a)Power law fit, β=0.3Maxwell model fit
N=95
G’
(2πf
) (m
N/m
)
G’’
(2πf
) (m
N/m
)
101
102
N=95
101
FIGURE 5 Two-dimensional, complex elastic modulus obtained from rheological sampling of mitotic cells. (a) Averaged storage (circles) and lossmodulus (squares) in dependence upon frequency (N¼ 95 cells). To calculate elastic moduli, effective tension (geff ¼ F/(Acon2H)) was identified with stress,while estimated area strain of overall cell surface area was identified with strain. Storage and loss modulus were fit simultaneously assuming a constantrelaxation spectrum hðtÞ of constant magnitude Kh up to a cutoff time tmax. Obtained fit parameters were Kh ¼ 18.5 mN/m and tmax ¼ 12.8 s (solid blacklines). (b and c) Averaged storage and loss modulus in a log-log representation (same data as in a) and associated model fits: our model (solid black line asin a); power law (dashed line); and Maxwell model with viscous element (dash-dotted line). For the power-law fit, fit functions wereG0
2DðuÞ ¼ Aub;G002DðuÞ ¼ Bub with fitted parameter values A ¼ 36.4 mN/m,sb, B ¼ 23.6 mN/m,sb, and b ¼ 0.3. For the Maxwell-model fit, fit functions
were G02DðuÞ ¼ ku2t2=ð1þ u2t2Þ andG00
2DðuÞ ¼ kut=ð1þ u2t2Þ þ h with fitted parameters k¼ 69.22 mN/m, t¼ 4.16 s, and h¼ 3.25 mN s/m. Error barsindicate SDs. To see this figure in color, go online.
Fischer-Friedrich et al.
596 Biophysical Journal 111, 589–600, August 9, 2016
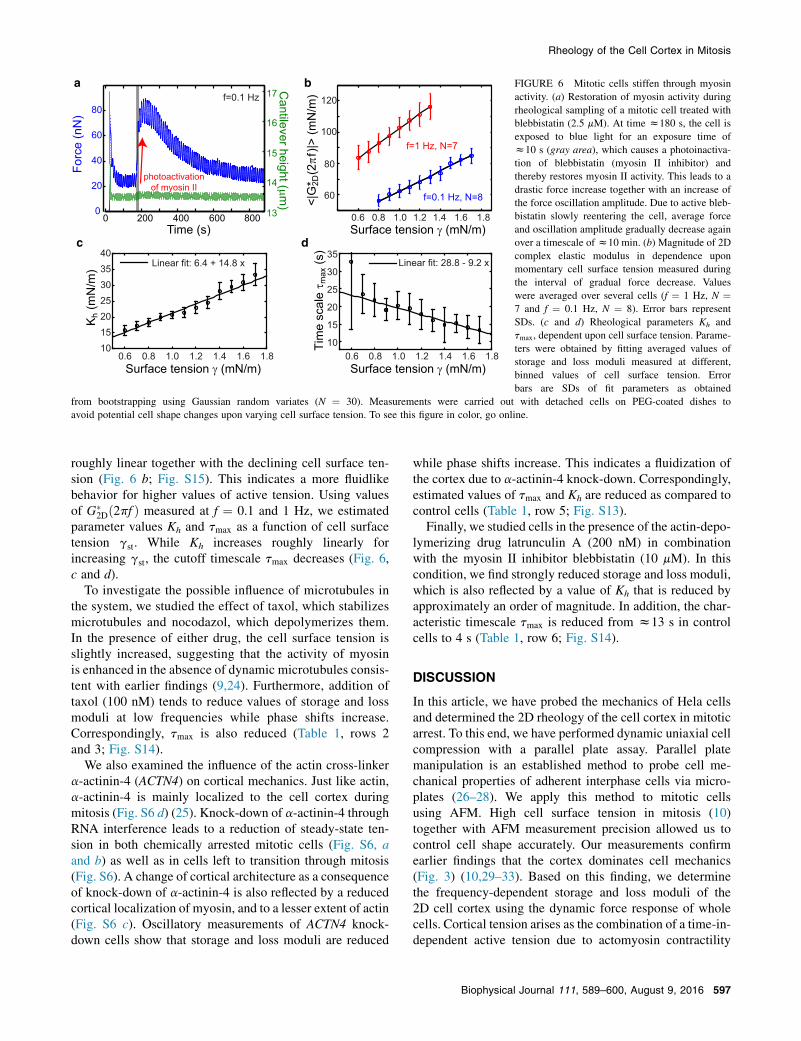
roughly linear together with the declining cell surface ten-sion (Fig. 6 b; Fig. S15). This indicates a more fluidlikebehavior for higher values of active tension. Using valuesof G(
2Dð2pf Þ measured at f ¼ 0.1 and 1 Hz, we estimatedparameter values Kh and tmax as a function of cell surfacetension gst. While Kh increases roughly linearly forincreasing gst, the cutoff timescale tmax decreases (Fig. 6,c and d).
To investigate the possible influence of microtubules inthe system, we studied the effect of taxol, which stabilizesmicrotubules and nocodazol, which depolymerizes them.In the presence of either drug, the cell surface tension isslightly increased, suggesting that the activity of myosinis enhanced in the absence of dynamic microtubules consis-tent with earlier findings (9,24). Furthermore, addition oftaxol (100 nM) tends to reduce values of storage and lossmoduli at low frequencies while phase shifts increase.Correspondingly, tmax is also reduced (Table 1, rows 2and 3; Fig. S14).
We also examined the influence of the actin cross-linkera-actinin-4 (ACTN4) on cortical mechanics. Just like actin,a-actinin-4 is mainly localized to the cell cortex duringmitosis (Fig. S6 d) (25). Knock-down of a-actinin-4 throughRNA interference leads to a reduction of steady-state ten-sion in both chemically arrested mitotic cells (Fig. S6, aand b) as well as in cells left to transition through mitosis(Fig. S6). A change of cortical architecture as a consequenceof knock-down of a-actinin-4 is also reflected by a reducedcortical localization of myosin, and to a lesser extent of actin(Fig. S6 c). Oscillatory measurements of ACTN4 knock-down cells show that storage and loss moduli are reduced
while phase shifts increase. This indicates a fluidization ofthe cortex due to a-actinin-4 knock-down. Correspondingly,estimated values of tmax and Kh are reduced as compared tocontrol cells (Table 1, row 5; Fig. S13).
Finally, we studied cells in the presence of the actin-depo-lymerizing drug latrunculin A (200 nM) in combinationwith the myosin II inhibitor blebbistatin (10 mM). In thiscondition, we find strongly reduced storage and loss moduli,which is also reflected by a value of Kh that is reduced byapproximately an order of magnitude. In addition, the char-acteristic timescale tmax is reduced from z13 s in controlcells to 4 s (Table 1, row 6; Fig. S14).
DISCUSSION
In this article, we have probed the mechanics of Hela cellsand determined the 2D rheology of the cell cortex in mitoticarrest. To this end, we have performed dynamic uniaxial cellcompression with a parallel plate assay. Parallel platemanipulation is an established method to probe cell me-chanical properties of adherent interphase cells via micro-plates (26–28). We apply this method to mitotic cellsusing AFM. High cell surface tension in mitosis (10)together with AFM measurement precision allowed us tocontrol cell shape accurately. Our measurements confirmearlier findings that the cortex dominates cell mechanics(Fig. 3) (10,29–33). Based on this finding, we determinethe frequency-dependent storage and loss moduli of the2D cell cortex using the dynamic force response of wholecells. Cortical tension arises as the combination of a time-in-dependent active tension due to actomyosin contractility
photoactivationof myosin II
Time (s)
a
0 200 400 600 8000
20
40
60
80
Forc
e (n
N)
Cantilever height (µm
)
13
14
15
16
17f=0.1 Hzb
60
80
100
120
<|G
* (2πf
)|> (m
N/m
)
f=1 Hz, N=7
f=0.1 Hz, N=8
0.6 0.8 1.0 1.2 1.4 1.6 1.810152025303540
K h (m
N/m
)
Tim
e sc
ale τ m
ax (s
)
Surface tension γ (mN/m) Surface tension γ (mN/m)
Surface tension γ (mN/m)
Linear fit: 6.4 + 14.8 x Linear fit: 28.8 - 9.2 x
c d
0.6 0.8 1.0 1.2 1.4 1.6 1.8
0.6 0.8 1.0 1.2 1.4 1.6 1.8
10
15
20
25
30
35
2D
FIGURE 6 Mitotic cells stiffen through myosinactivity. (a) Restoration of myosin activity duringrheological sampling of a mitotic cell treated withblebbistatin (2.5 mM). At time z180 s, the cell isexposed to blue light for an exposure time ofz10 s (gray area), which causes a photoinactiva-tion of blebbistatin (myosin II inhibitor) andthereby restores myosin II activity. This leads to adrastic force increase together with an increase ofthe force oscillation amplitude. Due to active bleb-bistatin slowly reentering the cell, average forceand oscillation amplitude gradually decrease againover a timescale ofz10 min. (b) Magnitude of 2Dcomplex elastic modulus in dependence uponmomentary cell surface tension measured duringthe interval of gradual force decrease. Valueswere averaged over several cells (f ¼ 1 Hz, N ¼7 and f ¼ 0.1 Hz, N ¼ 8). Error bars representSDs. (c and d) Rheological parameters Kh andtmax, dependent upon cell surface tension. Parame-ters were obtained by fitting averaged values ofstorage and loss moduli measured at different,binned values of cell surface tension. Errorbars are SDs of fit parameters as obtained
from bootstrapping using Gaussian random variates (N ¼ 30). Measurements were carried out with detached cells on PEG-coated dishes toavoid potential cell shape changes upon varying cell surface tension. To see this figure in color, go online.
Rheology of the Cell Cortex in Mitosis
Biophysical Journal 111, 589–600, August 9, 2016 597
and a dynamic part characterized by a 2D time-dependentrelaxation modulus (Eq. 1). We measure a correspondingstorage modulus G0
2Dz80 mN/m for frequency f ¼ 1 Hz,which is comparable to the area expansion moduli measuredfor MDCK II cells by AFM indentation (34) and approxi-mately a factor-of-five smaller than area expansion modulimeasured for preswollen red blood cells by micropipetteaspiration (35). We can estimate a 3D shear elastic modulusG(
3DðuÞ ¼ G(2DðuÞ=ð2ð1þ nÞdÞ of the cortical layer on
the order of 100 kPa for f ¼ 1 Hz, using d z 200 nm forthe cortical thickness (36) and a Poisson ratio n ¼ 0.5, cor-responding to an incompressible material. Comparablemoduli have been reported for actin-rich structures such asmuscle fibers or actin stress fibers (37,38). We have alsoanalyzed our data calculating effective 3D elastic moduliof the entire cell. We obtain a storage modulus of~1300 Pa during mitotic arrest at f ¼ 1 Hz . For interphasecells, we find z300 Pa (Fig. S8, a and b). These effectivecell moduli are consistent with earlier measurements deter-mining cell elasticity (20,21). Interestingly, this effectivecell modulus is generated mainly by the rheology of thecell cortex, as we show in this work.
Our measurement of dynamic storage and loss moduliallow us to discuss frequency-dependent material propertiesof the cell cortex. At frequencies <0.02 Hz, the lossmodulus dominates and the cortical response becomes fluid-like. This suggests that the cortex behaves like a viscousfluid at slow timescales. This emergence of fluidity mightbe due to the turnover of actin cross linkers and actin fila-ments, which leads to the relaxation of elastic stresses atlong times (2). Because of this fluidlike behavior, the cortexflows in response to contractility gradients (39,40). Suchcortical flows occur, for example, during cell division,particularly when the division is asymmetric, or during theformation of a contractile ring (39,41).
Our data suggest the existence of a longest relaxationtime tmax, which might be related to cortex turnover. Indeed,a simple rheological model with a constant relaxation spec-trum and a cutoff timescale tmax fits the rheological datawell (Fig. 5). We compared this fit to fits of a Maxwellmodel and of a power law. The Maxwell model with onlya single relaxation time does not fit the data. The powerlaw does not capture the maximal relaxation time that cor-responds to cortical turnover. As a consequence, it providesa poorer fit as compared to our model. This can be seen mostclearly when fit to the loss modulus data (Fig. 5 c). However,when using the power law to fit the data, we obtain an expo-nent z0.3, similar to reported values (42,43).
The actin network is organized by a large number of asso-ciated proteins. However, it has been difficult to distinguishthe roles of these different proteins for rheological proper-ties of the mitotic cell cortex. In our assay, knock-down ofmyosin II and a-actinin both reduce the magnitude of theelastic modulus of the cortical layer, as suggested by previ-ous work (44–52). However, our oscillation experiments
show that myosin II tends to fluidize the cortex, while a-ac-tinin tends to solidify it. The solidifying role of a-actinin hasbeen extensively studied in the in vitro actin networks andin vivo (46,47,51). In terms of our rheological model, a-ac-tinin knock-down reduces the characteristic timescale tmax,suggesting enhanced cortical turnover under this condition.This is consistent with the observation that a-actinin overex-pression inhibits actin turnover during cell division (53).Previous studies have reported both a fluidization or a solid-ification of actin networks through myosin activity. MyosinII has been shown to fluidize non-cross-linked networks (54)while cross-linked actin networks were reported to solidifywhen myosin was added (50). Several in vivo measurementshave suggested a solidifying role of myosin for adherentcells (45,55), but a fluidizing effect for suspended cells(20) and myoblasts (52). Here, we observed a solidificationwhen myosin II is inhibited, suggesting that myosin activityin the cortex modulates rheological properties and increasesfluidity. This resembles the observed fluidization of cellularmaterial properties when exposed to large external prestress(43,56). We speculate that the fluidization by myosin inmitotic HeLa cells observed here could stem from enhancedactin turnover in the cortical layer resulting from increasedactive tension. This is supported by the observation thatactin turnover is augmented by myosin activity during cyto-kinesis of mammalian cells (57).
Despite extensive theoretical work that suggests that thebest way to think about the cortex is as an active thin film,it has been difficult to test these ideas in vivo. By intro-ducing uniaxial compression of cells and complementingthis with a simple rheological model, our work provides acharacterization of the time-dependent mechanical proper-ties of the mitotic cortex, confirming that it behaves likean active fluid film on longer timescales. Modulation ofthe properties of this film drives cell morphology and tissuereorganization.
SUPPORTING MATERIAL
Supporting Materials and Methods and 17 figures are available at http://www.biophysj.org/biophysj/supplemental/S0006-3495(16)30441-6.
AUTHOR CONTRIBUTIONS
E.F.-F. and C.J.C. performed research and analyzed the data; Y.T. contrib-uted new reagents and analytic tools; E.F.-F., D.J.M., A.A.H., and F.J. de-signed the research; and E.F.-F., Y.T., C.J.C., D.J.M., A.A.H., and F.J.wrote the article.
ACKNOWLEDGMENTS
We thank Benjamin Friedrich, Guillaume Salbreux, Alexander Mietke,Louise Jawerth, and Stefan Munster for helpful discussions on cell me-chanics and Jochen Guck and Moritz Kreysing for kind access to ComsolMultiphysics software. Furthermore, we thank Martin Stewart foradvice on trans-mitotic AFM measurements and discussions about the
Fischer-Friedrich et al.
598 Biophysical Journal 111, 589–600, August 9, 2016
consequences of impaired cortex integrity, Subramanian Ramanathan andJonne Helenius for advice on quantification of cortical components, andthe E. Paluch laboratory for contributing the Lifeact-mCherry expressingHeLa cell line.
This work was supported by the Eidgenossische Technische HochschuleZurich (research grant No. ETH-05 11-2).
REFERENCES
1. Lecuit, T., and P.-F. Lenne. 2007. Cell surface mechanics and the con-trol of cell shape, tissue patterns and morphogenesis. Nat. Rev. Mol.Cell Biol. 8:633–644.
2. Salbreux, G., G. Charras, and E. Paluch. 2012. Actin cortex mechanicsand cellular morphogenesis. Trends Cell Biol. 22:536–545.
3. Hyman, A. A., C. A. Weber, and F. Julicher. 2014. Liquid-liquid phaseseparation in biology. Annu. Rev. Cell Dev. Biol. 30:39–58.
4. Fehon, R. G., A. I. McClatchey, and A. Bretscher. 2010. Organizingthe cell cortex: the role of ERM proteins. Nat. Rev. Mol. Cell Biol.11:276–287.
5. Umetsu, D., B. Aigouy,., C. Dahmann. 2014. Local increases in me-chanical tension shape compartment boundaries by biasing cell interca-lations. Curr. Biol. 24:1798–1805.
6. Rauzi, M., P. Verant, ., P.-F. Lenne. 2008. Nature and anisotropy ofcortical forces orienting Drosophila tissue morphogenesis. Nat. CellBiol. 10:1401–1410.
7. Eisenhoffer, G. T., P. D. Loftus, ., J. Rosenblatt. 2012. Crowding in-duces live cell extrusion to maintain homeostatic cell numbers inepithelia. Nature. 484:546–549.
8. Thery, M., A. Jimenez-Dalmaroni, ., F. Julicher. 2007. Experi-mental and theoretical study of mitotic spindle orientation. Nature.447:493–496.
9. Stewart, M. P., J. Helenius, ., A. A. Hyman. 2011. Hydrostatic pres-sure and the actomyosin cortex drive mitotic cell rounding. Nature.469:226–230.
10. Fischer-Friedrich, E., A. A. Hyman, ., J. Helenius. 2014. Quantifica-tion of surface tension and internal pressure generated by single mitoticcells. Sci. Rep. 4:6213.
11. Ramanathan, S. P., J. Helenius,., D. J. Muller. 2015. Cdk1-dependentmitotic enrichment of cortical myosin II promotes cell rounding againstconfinement. Nat. Cell Biol. 17:148–159.
12. Stewart, M. P., A. W. Hodel,., J. Helenius. 2013. Wedged AFM-can-tilevers for parallel plate cell mechanics. Methods. 60:186–194.
13. Schubert, R., N. Strohmeyer, ., D. J. Muller. 2014. Assay for charac-terizing the recovery of vertebrate cells for adhesion measurements bysingle-cell force spectroscopy. FEBS Lett. 588:3639–3648.
14. Skoufias, D. A., S. DeBonis, ., F. Kozielski. 2006. S-trityl-L-cysteineis a reversible, tight binding inhibitor of the human kinesin Eg5 thatspecifically blocks mitotic progression. J. Biol. Chem. 281:17559–17569.
15. Puech, P.-H., K. Poole, ., D. J. Muller. 2006. A new technicalapproach to quantify cell-cell adhesion forces by AFM. Ultramicro-scopy. 106:637–644.
16. Yoneda, M. 1964. Tension at the surface of sea-urchin egg: a criticalexamination of Cole’s experiment. J. Exp. Biol. 41:893–906.
17. Clark, A. G. 2013. Thickness, Dynamics and Mechanics of the Acto-myosin Cortex. Ph.D. thesis. Technische Universitaet Dresden, Dres-den, Germany.
18. Phan-Thien, N. 2012. Understanding Viscoelasticity: An Introductionto Rheology. Springer Science & Business Media, Berlin, Germany.
19. Kunda, P., A. E. Pelling, ., B. Baum. 2008. Moesin controls corticalrigidity, cell rounding, and spindle morphogenesis during mitosis.Curr.Biol. 18:91–101.
20. Chan, C. J., A. E. Ekpenyong, ., F. Lautenschlager. 2015. Myosin IIactivity softens cells in suspension. Biophys. J. 108:1856–1869.
21. Rosenbluth, M. J., W. A. Lam, and D. A. Fletcher. 2006. Force micro-scopy of nonadherent cells: a comparison of leukemia cell deformabil-ity. Biophys. J. 90:2994–3003.
22. Straight, A. F., A. Cheung, ., T. J. Mitchison. 2003. Dissecting tem-poral and spatial control of cytokinesis with a myosin II inhibitor. Sci-ence. 299:1743–1747.
23. Sakamoto, T., J. Limouze, ., J. R. Sellers. 2005. Blebbistatin, amyosin II inhibitor, is photoinactivated by blue light. Biochemistry.44:584–588.
24. Mandato, C. A., H. A. Benink, and W. M. Bement. 2000. Microtubule-actomyosin interactions in cortical flow and cytokinesis. Cell Motil.Cytoskeleton. 45:87–92.
25. Hutchins, J. R., Y. Toyoda, ., J. M. Peters. 2010. Systematic analysisof human protein complexes identifies chromosome segregation pro-teins. Science. 328:593–599.
26. Thoumine, O., and A. Ott. 1997. Time scale dependent viscoelastic andcontractile regimes in fibroblasts probed by microplate manipulation.J. Cell Sci. 110:2109–2116.
27. Desprat, N., A. Richert,., A. Asnacios. 2005. Creep function of a sin-gle living cell. Biophys. J. 88:2224–2233.
28. Fernandez, P., P. A. Pullarkat, and A. Ott. 2006. A master relation de-fines the nonlinear viscoelasticity of single fibroblasts. Biophys. J.90:3796–3805.
29. Ananthakrishnan, R., J. Guck,., J. Kas. 2006. Quantifying the contri-bution of actin networks to the elastic strength of fibroblasts. J. Theor.Biol. 242:502–516.
30. Yeung, A., and E. Evans. 1989. Cortical shell-liquid core modelfor passive flow of liquid-like spherical cells into micropipets.Biophys. J. 56:139–149.
31. Hochmuth, R. M. 2000. Micropipette aspiration of living cells.J. Biomech. 33:15–22.
32. Monteiro, E., J. Yvonnet, ., A. Asnacios. 2011. Analyzing the inter-play between single cell rheology and force generation through largedeformation finite element models. Biomech. Model. Mechanobiol.10:813–830.
33. Nawaz, S., P. Sanchez, ., I. A. Schaap. 2012. Cell visco-elasticitymeasured with AFM and optical trapping at sub-micrometer deforma-tions. PLoS One. 7:e45297.
34. Pietuch, A., B. R. Bruckner,., A. Janshoff. 2013. Elastic properties ofcells in the context of confluent cell monolayers: impact of tension andsurface area regulation. Soft Matter. 9:11490.
35. Evans, E. A., R. Waugh, and L. Melnik. 1976. Elastic area compress-ibility modulus of red cell membrane. Biophys. J. 16:585–595.
36. Clark, A. G., K. Dierkes, and E. K. Paluch. 2013. Monitoring actin cor-tex thickness in live cells. Biophys. J. 105:570–580.
37. Ogneva, I. V., D. V. Lebedev, and B. S. Shenkman. 2010. Transversalstiffness and Young’s modulus of single fibers from rat soleus muscleprobed by atomic force microscopy. Biophys. J. 98:418–424.
38. Hofmann, U. G., C. Rotsch,., M. Radmacher. 1997. Investigating thecytoskeleton of chicken cardiocytes with the atomic force microscope.J. Struct. Biol. 119:84–91.
39. Mayer, M., M. Depken, ., S. W. Grill. 2010. Anisotropies in corticaltension reveal the physical basis of polarizing cortical flows. Nature.467:617–621.
40. Salbreux, G., J. Prost, and J. F. Joanny. 2009. Hydrodynamics ofcellular cortical flows and the formation of contractile rings. Phys.Rev. Lett. 103:058102.
41. Cao, L. G., and Y. L. Wang. 1990. Mechanism of the formation of con-tractile ring in dividing cultured animal cells. II. Cortical movement ofmicroinjected actin filaments. J. Cell Biol. 111:1905–1911.
42. Pullarkat, P. A., P. A. Fernandez, and A. Ott. 2007. Rheological prop-erties of the eukaryotic cell cytoskeleton. Phys. Rep. 449:29–53.
43. Kollmansberger, P., C. T. Mierke, and B. Fabry. 2011. Nonlinear visco-elasticity of adherent cells is controlled by cytoskeletal tension. SoftMatter. 7:3127.
Rheology of the Cell Cortex in Mitosis
Biophysical Journal 111, 589–600, August 9, 2016 599
44. Wang, N., I. M. Toli!c-Nørrelykke, ., D. Stamenovi!c. 2002. Cellprestress. I. Stiffness and prestress are closely associated in adherentcontractile cells. Am. J. Physiol. Cell Physiol. 282:C606–C616.
45. Stamenovi!c, D., B. Suki, ., J. J. Fredberg. 2004. Rheology of airwaysmooth muscle cells is associated with cytoskeletal contractile stress.J. Appl. Physiol. 96:1600–1605.
46. Tseng, Y., and D. Wirtz. 2001. Mechanics and multiple-particletracking microheterogeneity of a-actinin-cross-linked actin filamentnetworks. Biophys. J. 81:1643–1656.
47. Tseng, Y., T. P. Kole, and D. Wirtz. 2002. Micromechanical mapping oflive cells by multiple-particle-tracking microrheology. Biophys. J.83:3162–3176.
48. Sen, S., M. Dong, and S. Kumar. 2009. Isoform-specific contributionsof a-actinin to glioma cell mechanobiology. PLoS One. 4:e8427.
49. Gardel, M. L., J. H. Shin, ., D. A. Weitz. 2004. Elastic behavior ofcross-linked and bundled actin networks. Science. 304:1301–1305.
50. Koenderink, G. H., Z. Dogic, ., D. A. Weitz. 2009. An activebiopolymer network controlled by molecular motors. Proc. Natl.Acad. Sci. USA. 106:15192–15197.
51. Ward, S. M. V., A. Weins, ., D. A. Weitz. 2008. Dynamic viscoelas-ticity of actin cross-linked with wild-type and disease-causing mutanta-actinin-4. Biophys. J. 95:4915–4923.
52. Balland, M., A. Richert, and F. Gallet. 2005. The dissipative contribu-tion of myosin II in the cytoskeleton dynamics of myoblasts. Eur.Biophys. J. 34:255–261.
53. Mukhina, S., Y. L. Wang, and M. Murata-Hori. 2007. a-actinin isrequired for tightly regulated remodeling of the actin cortical networkduring cytokinesis. Dev. Cell. 13:554–565.
54. Humphrey, D., C. Duggan,., J. Kas. 2002. Active fluidization of poly-mer networks through molecular motors. Nature. 416:413–416.
55. Fabry, B., G. N. Maksym, ., J. J. Fredberg. 2001. Scaling the micro-rheology of living cells. Phys. Rev. Lett. 87:148102.
56. Bursac, P., G. Lenormand, ., J. J. Fredberg. 2005. Cytoskeletal re-modelling and slow dynamics in the living cell. Nat. Mater. 4:557–561.
57. Murthy, K., and P. Wadsworth. 2005. Myosin-II-dependent localizationand dynamics of F-actin during cytokinesis. Curr. Biol. 15:724–731.
Fischer-Friedrich et al.
600 Biophysical Journal 111, 589–600, August 9, 2016