Embed Size (px)
Citation preview
Published: October 24, 2011
r 2011 American Chemical Society 8990 dx.doi.org/10.1021/ma201649f |Macromolecules 2011, 44, 8990–8998
ARTICLE
pubs.acs.org/Macromolecules
Rheology and Phase Behavior of Lyotropic CelluloseNanocrystal SuspensionsEsteban E. Ure~na-Benavides,† Geyou Ao,‡ Virginia A. Davis,‡ and Christopher L. Kitchens*,†
†Department of Chemical and Biomolecular Engineering, Clemson University, Clemson, South Carolina 29634, United States‡Department of Chemical Engineering, Auburn University, Auburn, Alabama 36849, United States
bS Supporting Information
’ INTRODUCTION
Cellulose nanocrystals (CNC) are renewable, strong, light-weight, and low-cost nanomaterials that have been incorporatedinto renewable polymer matrices for sustainable, environmen-tally friendly nanocomposites1,2 and assembled into opticallyactive films that selectively reflect specific wavelengths of light.3,4
CNC are commonly isolated from native cellulosic materials byacid hydrolysis where the CNC size and surface chemistrydepend on the cellulose source and reaction conditions. Aqueoussuspensions of sulfonated CNC exhibit lyotropic phase behavior,readily transitioning from isotropic to a biphasic suspension to aliquid crystalline phase with increasing concentration.5,6 At stillhigher concentrations, the suspensions can transition into abirefringent gel-like material.7
The properties of bulk CNC-based materials produced byfluid phase processing are dependent on the type of CNCemployed, the dispersion microstructure, and the processingconditions.8,9 CNC tend to assemble in cholesteric liquidcrystals;6 moreover, blending CNC with macromolecules suchas alginate10 or inorganic materials like silica3 can induce similartypes of ordering in the resultant mixtures. The optical propertiesof films assembled from CNC dispersions can be tuned bycontrolling the cholesteric pitch which can be affected bydispersion composition, temperature, and shear.11 The mechan-ical properties of CNC�calcium alginate fibers have been shownto be dependent on the helical assembly of the cellulose crystal-lites, which is observed in nature and interrelated with the
cholesteric ordering of CNC suspensions.10,12 Therefore, under-standing the rheology and phase behavior of CNC dispersions isof both scientific interest and practical relevance.
At the critical concentration for the isotropic to biphasictransition, the larger particles first form the liquid crystallinephase, while the smallest remain in the isotropic phase.13,14 Thus,the size distribution is an important parameter affecting the phasebehavior.5,13 The ionic strength of the medium also has animportant effect.15 Sulfonated CNC are intrinsically acidic;consequently, any variation of concentration induces a changeof the ionic strength, yielding a nonlinear behavior of the phasetransition diagram and equilibrium concentrations.15 It has beenshown that increasing temperature also impacts the phasebehavior by decreasing the volume of the liquid crystalline phase,especially near 40 �C.16 Still, limited information exists regardingthe interrelations of phase behavior with rheological propertiesand the transition into a hydrogel material at high CNCconcentrations.
A small-angle scattering study by Orts et al. confirmed that aconcentrated CNC suspension isolated from black sprucebleached Kraft pulp was chiral nematic (cholesteric) at rest, yetthe particles oriented with the larger axis parallel to the directionof the flow as the shear rate was increased.17 Suspensions ofmicrometer length CNC derived from tunicate showed a very
Received: July 18, 2011Revised: September 9, 2011
ABSTRACT: The dispersion microstructure and rheologicalproperties of aqueous sulfonated cellulose nanocrystal (CNC)suspensions have been investigated. Between 3.07 and 10.4 vol %the suspensions phase separated into liquid crystalline andisotropic domains. At 12.1 vol %, no isotropic phase was visible,and the samples had the fingerprint texture characteristic of acholesteric liquid crystal. Below 35 �C, temperature had littleinfluence on rheology and phase behavior. However, between35 and 40 �C there was a significant change in both the fractionof isotropic phase and the rheological properties. In contrast tomany lyotropic suspensions, the steady shear viscosity did not go through a maximum with increasing concentration. Maxima wereobserved for complex viscosity, storage modulus, and loss modulus at concentrations that appeared fully liquid crystalline.Time�concentration superposition was successful for the loss modulus but not the storagemodulus. This suggests that the interfacein biphasic samples affects the elastic relaxation but not the viscous response. At still higher concentrations, the fingerprint texture ofthe liquid crystal phase was absent, and the dispersions behaved as rheological gels.

8991 dx.doi.org/10.1021/ma201649f |Macromolecules 2011, 44, 8990–8998
Macromolecules ARTICLE
small reduction of viscosity upon appearance of a liquid crystal-line phase followed by a monotonic increase in viscosity withconcentration.18 A three-region behavior was observed for theliquid crystalline samples, while the isotropic suspensions be-haved as classic polymer solutions.18
In this study, we report the effects of concentration andtemperature on the microstructure and shear response of aqu-eous sulfonated cellulose nanocrystal dispersions. In contrast tomost previous studies,17,18 we evaluated the phase behavior usinga combination of both low-magnification imaging and hot stagecross-polarized optical microscopy. We also evaluated the vis-coelastic properties in addition to the steady shear response. Thismore detailed understanding of the rheology and phase behaviorof cellulose nanocrystal dispersions will aid in developing CNCcomposite materials with controlled properties.
’EXPERIMENTAL SECTION
Isolation of Cellulose Nanocrystals (CNC). Whatman(Piscataway, NJ) cellulose filter aid (cotton powder) was used as theraw material for CNC isolation. The CNC were isolated via acidhydrolysis of cotton cellulose with 64 wt % sulfuric acid at 45 �C for50 min. Upon completion, the reaction was quenched with colddeionized water. The resulting slurry was allowed to precipitate, andthe supernatant was decanted. The solids were dialyzed against deio-nized water for several days until the pH remained constant. Ultra-sonication was used to redisperse the CNC in water. The batch wasdivided into several samples, and the concentration of each was adjustedby slowly evaporating the water under a nitrogen stream. The concen-tration was measured in wt % and transformed to g/mL and vol % usingthe densities of water and CNC at 25 �C, which are 0.9970 and 1.636 g/mL, respectively. Further details of CNC isolation can be foundelsewhere.10,13
Size Characterization. A Digital Instruments/Veeco Bioscopeatomic force microscope (Plainview, NY) was used in tapping mode tomeasure the dimensions of the CNC. A droplet of a CNC suspensionwith an approximate concentration of 0.01 wt % was allowed to dry on afreshly cleaved mica surface (∼1.5 cm2).19 In order to avoid artifacts dueto particles lying on top of another, only the 117 CNC that seemedisolated were included in the statistics. The tip employed had a nominalradius of less than 10 nm. An image of the tip was obtained using aporous aluminum standard surface; this image was used to deconvolutethe shape of the particles from the geometry of the tip.20 Both thestandard surface and the tip were purchased from MikroMasch (SanJose, CA).Imaging of Bulk Samples. Samples of 2.99, 3.85, 4.83, and 6.23
vol % were introduced into 2 mm path length sealed quartz cuvettes andallowed to rest for at least 12 days at the desired temperature. Thecuvettes were placed between crossed polarized films, and pictures weretaken using a digital camera. The percent liquid crystalline phase wasmeasured from the images.14,15 The experiments were performed at 4,20, and 45 �C; the same cuvettes were used at all temperatures. Beforeeachmeasurement, the samples were homogenized using a vortex stirrer.Polarized Light Microscopy. A droplet of each suspension was
placed on a temperature-controlled stage or microscope slide. Pictureswere taken with a Nikon (Melville, NY) Eclipse 80i optical microscopeusing an LU Plan Fluor 20x/0.45NA Nikon objective lens at roomtemperature. For higher temperature imaging, a Linkam (Tadworth,UK) optical rheology system CSS450 was used with an L Plan SLWD20x/0.35NA Nikon objective lens.Rheological Measurements. Aqueous suspensions with CNC
concentrations ranging from 3.07 to 17.3 vol % were analyzed using anAnton Paar (Ashland, VA) MCR301 rotational rheometer. Steady shear
viscosity versus shear rate curves were generated for each sample from ashear rate of 0.1 to 100 s�1. For each sample, the time required to reachsteady state at 0.1 s�1 was determined by a transient test; the samplingtime used to generate the flow curves was decreased linearly withincreasing shear rate. Oscillatory measurements were also performedon each sample from 0.1 to 100 rad/s. The percent strain used was insidethe linear viscoelastic region (LVE) as determined by performingamplitude sweep experiments at a frequency of 10 rad/s. All thesuspensions were tested at 10 �C; the effect of temperature on thesteady shear viscosities was also studied for samples of 3.07, 6.99, and12.1 vol %. The low-viscosity samples were characterized usingMooney-Ewart or double gap geometries; the high-viscosity samples weremeasured using 25 mm parallel plates and cone and plate (2� nominalangle) geometries. For several samples, two different geometries wereused to ensure no experimental artifacts were present. All data arepresented with error bars generated from the standard deviation.
’RESULTS AND DISCUSSION
CNC Properties. Since phase behavior is influenced by bothmesogen size and electrostatic stabilization, the size distributionand the proportion of sulfate groups were measured. The sizedistributions of the CNC measured with atomic force micro-scopy (AFM) are shown in Figure 1; they were elongatedparticles with rectangular cross section.10,21,22 The average lengthwas 107 nm with a standard deviation (σ) of 55 nm, the averagewidth was 20 nm (σ = 6 nm), and the average height was 8.9 nm(σ = 2.8 nm). The polydispersity defined as p = [(Æa2æ � Æaæ2)/Æaæ2)]1/2 was also calculated. Here Æa2æ and Æaæ are the secondand first moments of a, respectively, while a is any dimension.For length, width, and height p is 0.52, 0.29, and 0.32, respec-tively. The CNC suspensions were acidic due to the presence of�SO3H groups introduced on the surface of the nanocrystalsduring the hydrolysis step. A suspension of 1.59 vol % had a pH of2.9. Conductometric titration with sodium hydroxide (4.2 �10�3 M) was used to determine that there were 1.71� 10�4 molof �SO3H per gram of cellulose, which, according to our sizemeasurements, is equivalent to sulfonating 30% of the availableprimary hydroxyl groups.Phase Behavior and Microstructure. Revol et al. first
observed that biphasic suspensions of sulfonated CNC consistof isotropic and chiral nematic (cholesteric) phases that readilyphase separate and can be observed by simply placing cuvettesbetween cross-polarized films.6 Figure 2 shows four suspensionsimaged between crossed polarizers; the fraction of the bottombirefringent liquid crystalline phase increased with increasingCNC concentration. The amount of liquid crystalline phase as afunction of CNC concentration was determined at three differ-ent temperatures (Figure 3). No significant difference wasobserved between 4 and 20 �C, but at 45 �C the volume ofliquid crystalline phase at a given concentration was reduced; thisis analogous to the behavior previously observed by Dong andGray.16 Moreover, the slope of the trendline decreases at highertemperatures, suggesting an enlargement of the biphasic region.The isotropic to biphasic transition concentrations ϕI were
measured by extrapolation of the curves in Figure 3; the resultswere 2.8, 2.7, and 3.0 vol % at 4, 20, and 45 �C, respectively. Ourmeasurement at 20 �C is in very good agreement with thetransition concentration reported by Dong and Gray of 5.14 �10�6 nm�3 (2.9 vol % for their average dimensions and assuminga squared rod geometry).16 However, it was not possible toaccurately quantify the biphasic to liquid crystalline transition

8992 dx.doi.org/10.1021/ma201649f |Macromolecules 2011, 44, 8990–8998
Macromolecules ARTICLE
concentration ϕLC using the same method. At CNC concentra-tions from 7.69 to 10.4 vol % the sample looked completelybirefringent in the cuvettes, but optical microscopy revealedisotropic regions. The viscosity of these biphasic suspensionslikely prevented complete separation of the liquid crystalline andisotropic phases within the 12 days of settling time; the size of theisotropic domains was too small to be observed without magni-fication. Centrifugation of the suspensions was attempted toaccelerate phase separation of the higher concentration biphasicsamples. Measurements of the relative volume of the anisotropic
phase and extrapolation to one (completely anisotropic) yieldeda ϕLC of 11.2 vol %. The technique proves to be useful to aidseparation, yet care must be taken to avoid heating the sampleand/or precipitating nanoparticles out of the suspension.Representative cross-polarized optical microscopy images of
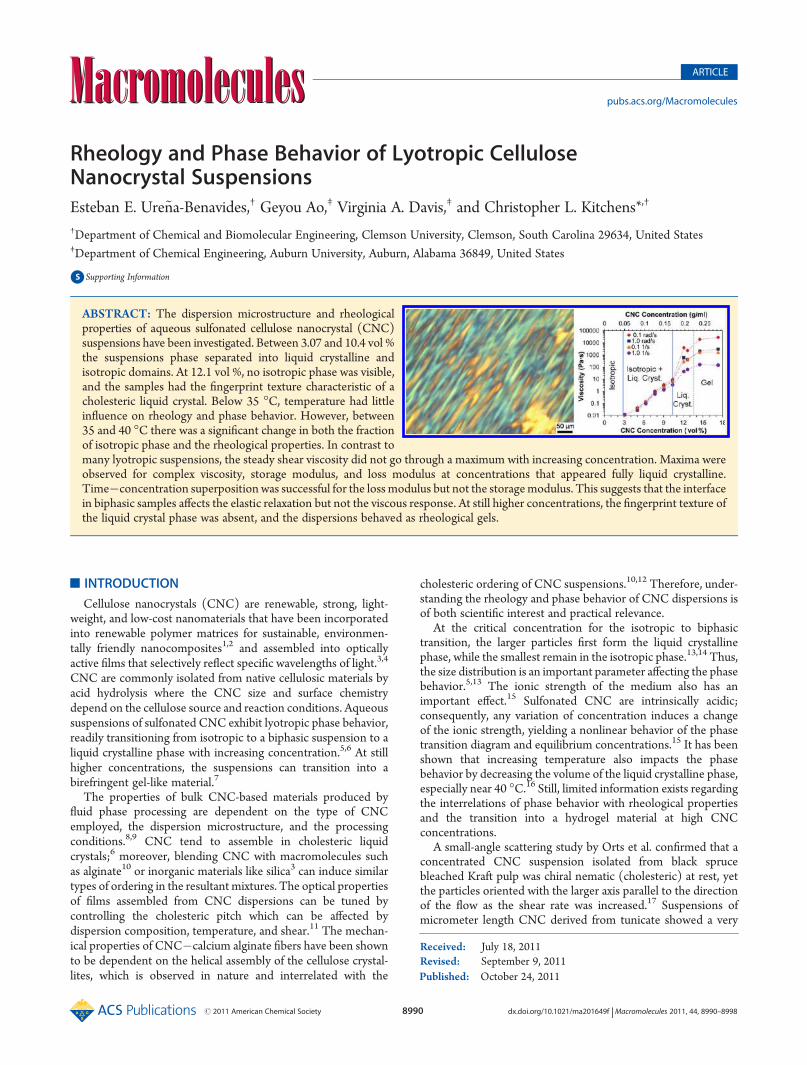
increasing CNC concentration are shown in Figure 4 (additionalrepresentative images from several concentrations taken atdifferent angles are provided in the Supporting Information).At 5.00 vol % it was possible to observe the presence of liquidcrystalline droplets dispersed in a continuous isotropic phase.Rotation of the sample between cross polarizers caused the brightregions (liquid crystalline) to darken while the continuousisotropic domain remained unchanged. As the concentrationwas increased to 6.30 vol %, the fraction of liquid crystal domainsincreased, and the microstructure was suggestive of a cocontin-uous mixture of isotropic and liquid crystalline regions. However,after 12 days settling in a cuvette, demixing occurred and thevolume fraction of the anisotropic region was ∼0.6 between 4and 20 �C (Figure 3). At 9.03 vol %, the suspension looked com-pletely birefringent in a cuvette; however, under the microscopeisotropic regions were observed in a liquid crystalline matrix.The sample containing 9.91 vol % CNC appeared almost
entirely liquid crystalline under cross-polarized optical micro-scopy with 20�magnification; a few isotropic sections could be
Figure 2. Cross-polarized images showing the phase separation of CNCsuspensions from 2.99 to 6.23 vol %. The lower liquid crystalline phase isbirefringent while the upper isotropic phase appears dark.
Figure 3. Amount of liquid crystalline (anisotropic) phase as a functionof CNC concentration at 4 �C (diamonds), 20 �C (squares), and 45 �C(triangles).
Figure 1. Size distribution of CNC (a) length, (b) width, and (c)height.
8993 dx.doi.org/10.1021/ma201649f |Macromolecules 2011, 44, 8990–8998
Macromolecules ARTICLE
observed near the sample edges. The colorful discontinuousstripes indicate a precholesteric type of ordering. Some iso-tropic regions were also observed at 10.4 vol %. However, at12.1 vol %, the suspension was completely birefringent withcolors that changed with rotation at all positions including theedge. Moreover, the stripes became uniform and formed thefingerprint texture which is characteristic of a cholesteric liquidcrystal.Based on these cross-polarized optical microscopy results 10.4
vol % < ϕLC < 12.1 vol %. While the cuvettes could not be used toquantify ϕLC, the value of 11.2 vol % measured by centrifugationis consistent with the microscopy results. Dong and Graymeasured a lower critical concentration of 15.3 � 10�6 nm�3
(ϕLC = 8.6 vol %).16 Nevertheless, they used the cuvettes for thispurpose, which may explain the differences in the reported value.The discrepancies found with the various techniques highlightthe need for developing standard methods for determining ϕLCfor lyotropic nanorod dispersions.23
Theoretical calculations based on the Stroobants, Lekkerkerkerand Odijk (SLO) theory were performed to compare with theexperimental critical concentrations.15,24,25 To account for varia-tions in the ionic strength of the medium, the acid dissociationconstant pKa of the sulfate groups was determined by conducto-metric titration. This yielded a value of 3.20, which was used tocalculate the pH of the medium with variable CNC concentra-tion. The calculated values for ϕI and ϕLC are 8.9 and 12.4 vol %,respectively. The theoretical prediction for ϕLC is very close toour experimental measurements; nevertheless, ϕI is clearly over-estimated. It must be noted that the SLO theory was developedfor rod-shaped particles while CNCs resemble more rectangularparallelepipeds. Moreover, the calculations assumed a monodis-persed population with dimensions equal to the averages mea-sured by AFM. Polydispersed samples are expected to show abroader biphasic region and shift ϕI to lower concentrations dueto the presence of larger particles. Both phenomena are reflectedin our experimental measurements.When the CNC concentration reached 14.5 vol %, the texture
(Figure 4) was more random with very bright colors; rheologicalcharacterization at this concentration revealed that the system
was a gel. A similar behavior was observed in aqueous mixtures ofsingle-walled carbon nanotubes (SWNTs) and double-strandedDNA; these suspensions formed a cholesteric phase whichdisappeared at high concentrations.26
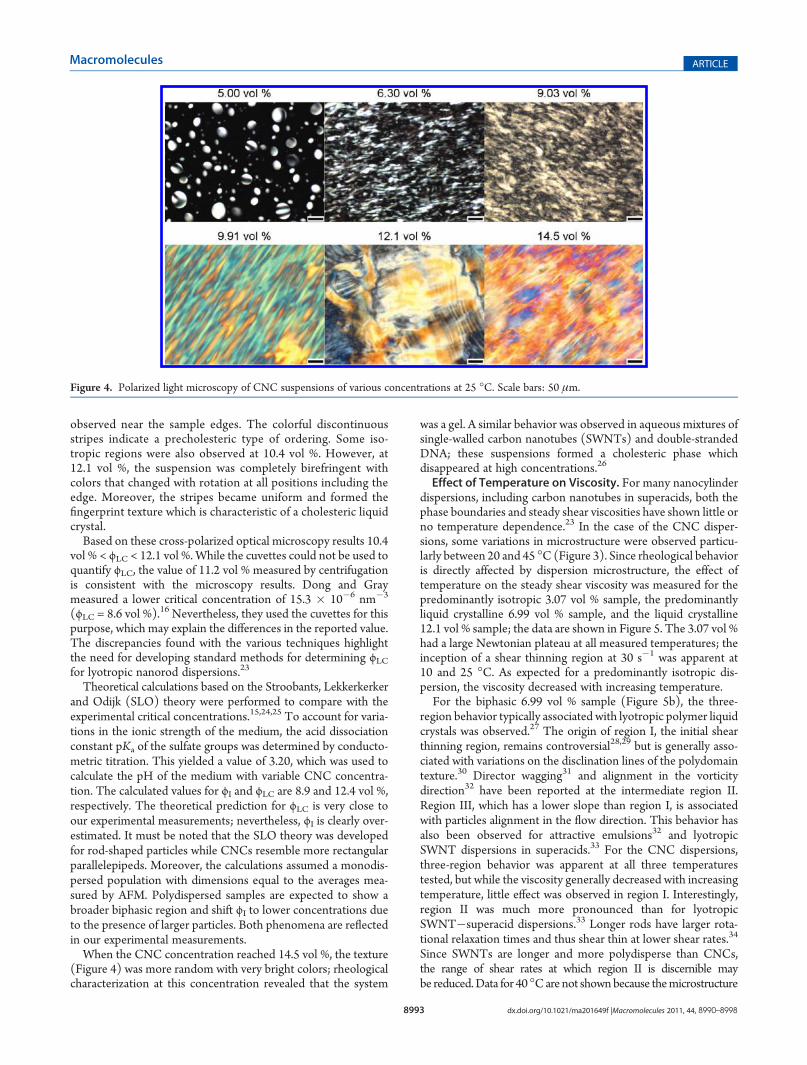
Effect of Temperature on Viscosity. For many nanocylinderdispersions, including carbon nanotubes in superacids, both thephase boundaries and steady shear viscosities have shown little orno temperature dependence.23 In the case of the CNC disper-sions, some variations in microstructure were observed particu-larly between 20 and 45 �C (Figure 3). Since rheological behavioris directly affected by dispersion microstructure, the effect oftemperature on the steady shear viscosity was measured for thepredominantly isotropic 3.07 vol % sample, the predominantlyliquid crystalline 6.99 vol % sample, and the liquid crystalline12.1 vol % sample; the data are shown in Figure 5. The 3.07 vol %had a large Newtonian plateau at all measured temperatures; theinception of a shear thinning region at 30 s�1 was apparent at10 and 25 �C. As expected for a predominantly isotropic dis-persion, the viscosity decreased with increasing temperature.For the biphasic 6.99 vol % sample (Figure 5b), the three-
region behavior typically associated with lyotropic polymer liquidcrystals was observed.27 The origin of region I, the initial shearthinning region, remains controversial28,29 but is generally asso-ciated with variations on the disclination lines of the polydomaintexture.30 Director wagging31 and alignment in the vorticitydirection32 have been reported at the intermediate region II.Region III, which has a lower slope than region I, is associatedwith particles alignment in the flow direction. This behavior hasalso been observed for attractive emulsions32 and lyotropicSWNT dispersions in superacids.33 For the CNC dispersions,three-region behavior was apparent at all three temperaturestested, but while the viscosity generally decreased with increasingtemperature, little effect was observed in region I. Interestingly,region II was much more pronounced than for lyotropicSWNT�superacid dispersions.33 Longer rods have larger rota-tional relaxation times and thus shear thin at lower shear rates.34
Since SWNTs are longer and more polydisperse than CNCs,the range of shear rates at which region II is discernible maybe reduced.Data for 40 �Care not shownbecause themicrostructure
Figure 4. Polarized light microscopy of CNC suspensions of various concentrations at 25 �C. Scale bars: 50 μm.
8994 dx.doi.org/10.1021/ma201649f |Macromolecules 2011, 44, 8990–8998
Macromolecules ARTICLE
was not stable at these conditions; this caused large variations inthe rheological measurements which are not unexpected forsamples near the center of the biphasic region.For the 12.1 vol % sample the viscosity was independent of
temperature between 10 and 35 �C. This result suggests that inspite of the relatively low aspect ratio of the CNC, temperaturehad little effect on mesogen rearrangement between 10 and35 �C. Interestingly, there was a marked viscosity increase at40 �C, particularly at low shear rates. Despite the use of anevaporation blocker, the possibility that the suspension sufferedfrom water evaporation was considered. However, this would
have likely led to a greater deviation at longer measurementtimes which corresponded to higher shear rates. For lyotropicsystems, temperature changes in viscosity can also be indicativeof changes in microstructure or the relative fractions of iso-tropic and liquid crystalline regions.35 Hot stage optical micro-scopy revealed a pronounced increase in isotropic domainsbetween 35 and 40 �C (shown in Figure S5 of the SupportingInformation); this confirmed that the observed change in viscositywas not an artifact.Effect of Concentration on Steady Shear and Complex
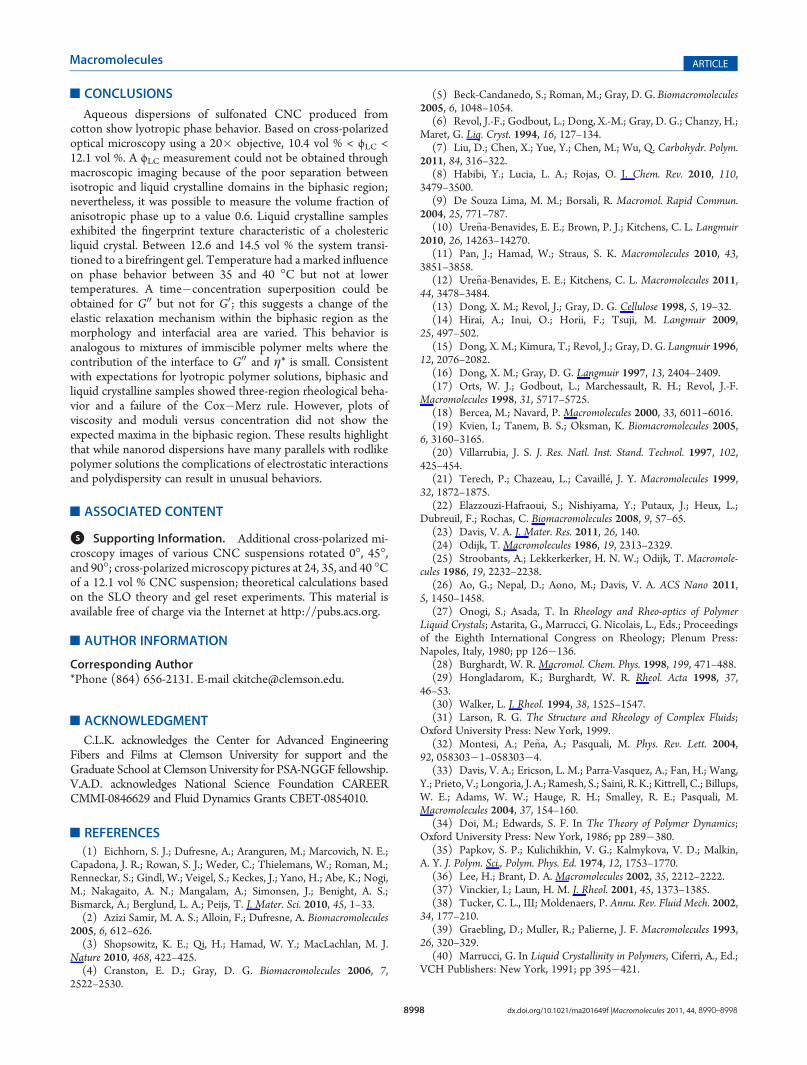
Viscosities. The dependence of the steady shear η and complexη* viscosities for each suspension at 10 �C is shown in Figure 6.As previously described, at the lowest concentration, the beha-vior was nearly Newtonian with the inception of a shear thinningregion at 30 s�1; even at 3.07 vol % the viscosity was an order ofmagnitude greater than that of the solvent. The 5.00 and 6.30 vol% suspensions had a three-region behavior like that observed inFigure 5b for the 6.99 vol % sample, but this is masked by thescale of Figure 6a. Between 7.69 and 10.4 vol %, a low shear/frequency plateau is followed by a shear thinning region. At 12.1vol % and above, the samples are power law fluids η = K _γn�1
where _γ is the shear rate, K is the consistency coefficient, and n isthe rate index. The power law coefficients for each sample are
Figure 5. Steady shear viscosity versus shear rate at 10 (red diamonds),25 (blue squares), 35 (orange triangles), and 40 �C (purple circles) ofCNC suspensions with concentrations of (a) 3.07, (b) 6.99, and (c)12.1 vol %.
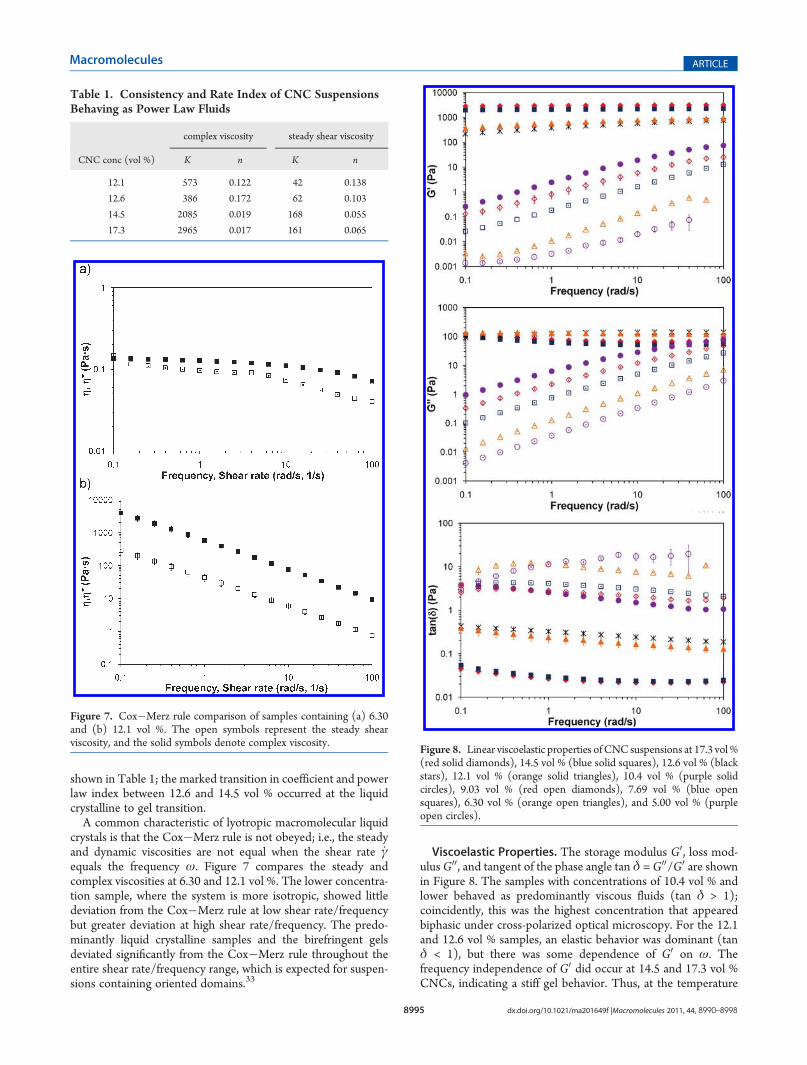
Figure 6. (a) Steady shear and (b) complex viscosities of CNCsuspensions at 17.3 vol % (red solid diamonds), 14.5 vol % (blue solidsquares), 12.6 vol % (black stars), 12.1 vol % (orange solid triangles),10.4 vol % (purple solid circles), 9.03 vol % (red open diamonds), 7.69vol % (blue open squares), 6.30 vol % (orange open triangles), 5.00 vol %(purple open circles), and 3.07 vol % (black crosses).
8995 dx.doi.org/10.1021/ma201649f |Macromolecules 2011, 44, 8990–8998
Macromolecules ARTICLE
shown in Table 1; the marked transition in coefficient and powerlaw index between 12.6 and 14.5 vol % occurred at the liquidcrystalline to gel transition.A common characteristic of lyotropic macromolecular liquid
crystals is that the Cox�Merz rule is not obeyed; i.e., the steadyand dynamic viscosities are not equal when the shear rate _γequals the frequency ω. Figure 7 compares the steady andcomplex viscosities at 6.30 and 12.1 vol %. The lower concentra-tion sample, where the system is more isotropic, showed littledeviation from the Cox�Merz rule at low shear rate/frequencybut greater deviation at high shear rate/frequency. The predo-minantly liquid crystalline samples and the birefringent gelsdeviated significantly from the Cox�Merz rule throughout theentire shear rate/frequency range, which is expected for suspen-sions containing oriented domains.33
Viscoelastic Properties. The storage modulus G0, loss mod-ulusG00, and tangent of the phase angle tan δ =G00/G0 are shownin Figure 8. The samples with concentrations of 10.4 vol % andlower behaved as predominantly viscous fluids (tan δ > 1);coincidently, this was the highest concentration that appearedbiphasic under cross-polarized optical microscopy. For the 12.1and 12.6 vol % samples, an elastic behavior was dominant (tanδ < 1), but there was some dependence of G0 on ω. Thefrequency independence of G0 did occur at 14.5 and 17.3 vol %CNCs, indicating a stiff gel behavior. Thus, at the temperature
Figure 8. Linear viscoelastic properties ofCNC suspensions at 17.3 vol %(red solid diamonds), 14.5 vol % (blue solid squares), 12.6 vol % (blackstars), 12.1 vol % (orange solid triangles), 10.4 vol % (purple solidcircles), 9.03 vol % (red open diamonds), 7.69 vol % (blue opensquares), 6.30 vol % (orange open triangles), and 5.00 vol % (purpleopen circles).
Table 1. Consistency and Rate Index of CNC SuspensionsBehaving as Power Law Fluids
complex viscosity steady shear viscosity
CNC conc (vol %) K n K n
12.1 573 0.122 42 0.138
12.6 386 0.172 62 0.103
14.5 2085 0.019 168 0.055
17.3 2965 0.017 161 0.065
Figure 7. Cox�Merz rule comparison of samples containing (a) 6.30and (b) 12.1 vol %. The open symbols represent the steady shearviscosity, and the solid symbols denote complex viscosity.

8996 dx.doi.org/10.1021/ma201649f |Macromolecules 2011, 44, 8990–8998
Macromolecules ARTICLE
used for the rheological measurements (10 �C), the transition toa gel occurred between 12.6 and 14.5 vol %. These resultssupport the hypothesis that the loss of fingerprint texturebetween 12.1 and 14.5 vol % (Figure 4), and change in powerlaw behavior (Table 1) between 12.6 and 14.5 vol %were due to aliquid crystal to gel transition.To determine if the gels were an equilibrium structure, a long
amplitude oscillatory shear (LAOS) experiment was performedon the 14.5 vol % sample at 20% strain to disturb the structure ofthe suspension. The G0 measured during LAOS was 50% smallerthan the one obtained with a 1.5% strain (in the LVE). Afterresting for 40 min the G0, measured within the LVE, was only 5%lower than original, and after 80 min the recovery was completewithin experimental error. This result indicates that the gels areequilibrium structures (data shown in Figure S7 of the Support-ing Information).Data Reduction. Figure 9 shows that below the liquid crystal-
line to gel transition both the steady shear and complex viscositydata could generally be reduced to a master curve. The mastercurves were prepared by plotting the reduced viscosities, definedas η*r = (η*bc)/a*c and ηr = (ηbc)/ac, versus the reducedfrequency ω = ωa*c and reduced shear rate _γr = _γac, where ηis the steady shear viscosity, η* is the complex viscosity, _γ is theshear rate, ω is the frequency, bc = cref/c is a stress shift factor, and
a*c = (η*0/η*0,ref)(cref/c) and ac = (η0/η0,ref)(cref/c) are inversetime shift factors; c is the CNC concentration. For the subscripts,0 refers to the Newtonian plateau value, r to a reduced variable,and ref the reference concentration, which was chosen to be 6.30vol %. There was a slight deviation in reduced steady shearviscosity at low shear rate for the predominantly isotropic 3.07vol % suspension. For the complex viscosity, the data collapsedon a master curve up to a concentration of 10.4 vol %, but adiscontinuity occurred afterward. This was also the highestconcentration at which an isotropic section was detected usingcross-polarized microscopy; therefore, the discontinuity may berelated to a change in the relaxation mechanism caused by aphase transition.Time�concentration superpositions of G0 and G00 were also
attempted by plotting the reduced storage G0r = G0bc and loss
G00r = G00bc, moduli against the reduced frequency. The super-
position results are shown in Figure 10. For most of the frequencyrange, G0 did not collapse onto a master curve; however, G00 didcollapse satisfactorily. An analogous behavior was observed byLee and Brant in biphasic xanthan solutions.36 For their samples,G00 and η* collapsed onto a master curve, but G0 and η did not;they suggested that the relaxation mechanism varied with con-centration under steady shear conditions, but under oscillatoryshear the relaxation processes were the same regardless ofthe microstructure. However, these authors did not provide an
Figure 9. Time�concentration superposition of the viscosities of CNCsuspensions at 12.6 vol % (black stars), 12.1 vol % (orange solidtriangles), 10.4 vol % (purple solid circles), 9.03 vol % (red opendiamonds), 7.69 vol % (blue open squares), 6.99 vol % (aqua openrectangles) 6.30 vol % (orange open triangles), 5.00 vol % (purple opencircles), and 3.07 vol % (black crosses).
Figure 10. Time�concentration superposition of the viscoelasticproperties of CNC suspensions at 12.6 vol % (black stars), 12.1 vol %(orange solid triangles), 10.4 vol % (purple solid circles), 9.03 vol % (redopen diamonds), 7.69 vol % (blue open squares), 6.30 vol % (orangeopen triangles), and 5.00 vol % (purple open circles).

8997 dx.doi.org/10.1021/ma201649f |Macromolecules 2011, 44, 8990–8998
Macromolecules ARTICLE
explanation for why the storage modulus did not conform to amaster curve. The data suggest that the elastic relaxation of CNCsuspensions was modified as the morphology and total interfacialarea between liquid crystalline and isotropic regions vary but thatthe viscous relaxation was unaffected by these microstructuralchanges.As previously mentioned, cross-polarized optical microscopy
showed that with increasing concentration the microstructure ofthe suspensions changed from dispersed liquid crystalline do-mains in a continuous isotropic matrix, to a seemingly cocontin-uous blend, then to dispersed droplets of isotropic domains in acontinuous liquid crystalline phase, followed by a totally liquidcrystalline material and finally to a gel. This microstructuralevolution impacts the relaxation times and mechanisms but has asmaller effect on G00 than G0. This behavior is analogous to thatobserved in mixtures of immiscible phases where the interfacialtension contributes to the viscoelastic properties.37 The relaxa-tion of a droplet after it is deformed affects mostly the elasticcomponent, while the viscous contribution is very small.38 Theeffect is larger as the interfacial tension and area increase; thelatter clearly varies depending on the volume of the anisotropicphase.39 Although the G0 data did not collapse uniformly, thegeneral shape of theG0
r versusωr curve resembled what would beexpected for a blend of two immiscible Maxwell fluids. Thismodel is simplistic for the complexity of the system, but it isuseful to visualize the effects of interfacial tension. There isevidence of a plateau or shoulder at low values ofωr and a secondplateau at high ωr; the low-frequency plateau is attributed to theelastic contribution of the interface.39 At intermediate frequenciesthe highest slope is 1.15, which deviates from the expected value of2.39 In the case of G00, the slope at low frequencies is 0.97, whichapproximates the expected value of 1 for an immiscible blend oftwo Maxwell fluids.39
Viscosity and Moduli versus Concentration. One of thehallmarks of polymeric lyotropic suspensions is that the low shearviscosity versus concentration goes through a maximum in thebiphasic region, and themagnitude of thismaximumdecreases withincreasing shear rate.31,40 This maximum is presumed to occurbecause when the sample is predominantly isotropic the resistanceto flow increases with increasing concentration. However, at someconcentration in the biphasic region, the increasing order resultingfrom the increasing fraction of liquid crystalline domains causes theviscosity to decrease with concentration. Similar behavior has alsobeen reported for the elastic and viscous moduli.31,40
Figure 11a shows the steady shear and complex viscosities as afunction of concentration; the phase boundaries are based onmicroscopic observation. Surprisingly, no maxima are observedin the biphasic region, although a change in the slope is detectedat 7.69 vol %. Instead, both η* andG0 show slight local maxima at12.1 vol %; based on optical microscopy, this concentration ispurely liquid crystalline. Increasing the concentration into the gelregion results in a plateau for both η* and G0. No maximum wasobserved for the steady shear viscosity; this may suggest that theordering is so tenuous as to be disrupted by a shear rate of 0.1 s�1.While the origin of this unexpected behavior is not evident, it isinteresting that another CNC system also deviated from thetypical behavior. Bercea and Navard reported that micrometerlength CNC showed only a very small reduction in viscosity atthe critical concentration where the sample became biphasicfollowed by a monotonic increase with concentration.18 It ispossible that changes in attractive interactions caused by varia-tions in the ionic strength with increasing CNC concentration
result in this anomalous behavior. This will be explored in futureresearch.
Figure 11. Rheological properties versus concentration. (a) Complexand steady shear viscosities at 0.1 rad/s (red diamonds), 1.0 rad/s (bluesquares), 0.1 s�1 (orange triangles), and 1 s�1 (purple circles); (b) storagemodulus; and (c) loss modulus at 0.1 rad/s (red diamonds), 1.0 rad/s(blue squares), 10 rad/s (orange triangles), and 100 rad/s (purple circles).The solid vertical lines indicate a phase transition; the discontinuousvertical line indicates that the liquid crystal to gel transition is approximate.
8998 dx.doi.org/10.1021/ma201649f |Macromolecules 2011, 44, 8990–8998
Macromolecules ARTICLE
’CONCLUSIONS
Aqueous dispersions of sulfonated CNC produced fromcotton show lyotropic phase behavior. Based on cross-polarizedoptical microscopy using a 20� objective, 10.4 vol % < ϕLC <12.1 vol %. A ϕLC measurement could not be obtained throughmacroscopic imaging because of the poor separation betweenisotropic and liquid crystalline domains in the biphasic region;nevertheless, it was possible to measure the volume fraction ofanisotropic phase up to a value 0.6. Liquid crystalline samplesexhibited the fingerprint texture characteristic of a cholestericliquid crystal. Between 12.6 and 14.5 vol % the system transi-tioned to a birefringent gel. Temperature had a marked influenceon phase behavior between 35 and 40 �C but not at lowertemperatures. A time�concentration superposition could beobtained for G00 but not for G0; this suggests a change of theelastic relaxation mechanism within the biphasic region as themorphology and interfacial area are varied. This behavior isanalogous to mixtures of immiscible polymer melts where thecontribution of the interface to G00 and η* is small. Consistentwith expectations for lyotropic polymer solutions, biphasic andliquid crystalline samples showed three-region rheological beha-vior and a failure of the Cox�Merz rule. However, plots ofviscosity and moduli versus concentration did not show theexpected maxima in the biphasic region. These results highlightthat while nanorod dispersions have many parallels with rodlikepolymer solutions the complications of electrostatic interactionsand polydispersity can result in unusual behaviors.
’ASSOCIATED CONTENT
bS Supporting Information. Additional cross-polarized mi-croscopy images of various CNC suspensions rotated 0�, 45�,and 90�; cross-polarizedmicroscopy pictures at 24, 35, and 40 �Cof a 12.1 vol % CNC suspension; theoretical calculations basedon the SLO theory and gel reset experiments. This material isavailable free of charge via the Internet at http://pubs.acs.org.
’AUTHOR INFORMATION
Corresponding Author*Phone (864) 656-2131. E-mail [email protected].
’ACKNOWLEDGMENT
C.L.K. acknowledges the Center for Advanced EngineeringFibers and Films at Clemson University for support and theGraduate School at ClemsonUniversity for PSA-NGGF fellowship.V.A.D. acknowledges National Science Foundation CAREERCMMI-0846629 and Fluid Dynamics Grants CBET-0854010.
’REFERENCES
(1) Eichhorn, S. J.; Dufresne, A.; Aranguren, M.; Marcovich, N. E.;Capadona, J. R.; Rowan, S. J.; Weder, C.; Thielemans, W.; Roman, M.;Renneckar, S.; Gindl, W.; Veigel, S.; Keckes, J.; Yano, H.; Abe, K.; Nogi,M.; Nakagaito, A. N.; Mangalam, A.; Simonsen, J.; Benight, A. S.;Bismarck, A.; Berglund, L. A.; Peijs, T. J. Mater. Sci. 2010, 45, 1–33.(2) Azizi Samir, M. A. S.; Alloin, F.; Dufresne, A. Biomacromolecules
2005, 6, 612–626.(3) Shopsowitz, K. E.; Qi, H.; Hamad, W. Y.; MacLachlan, M. J.
Nature 2010, 468, 422–425.(4) Cranston, E. D.; Gray, D. G. Biomacromolecules 2006, 7,
2522–2530.
(5) Beck-Candanedo, S.; Roman, M.; Gray, D. G. Biomacromolecules2005, 6, 1048–1054.
(6) Revol, J.-F.; Godbout, L.; Dong, X.-M.; Gray, D. G.; Chanzy, H.;Maret, G. Liq. Cryst. 1994, 16, 127–134.
(7) Liu, D.; Chen, X.; Yue, Y.; Chen, M.; Wu, Q. Carbohydr. Polym.2011, 84, 316–322.
(8) Habibi, Y.; Lucia, L. A.; Rojas, O. J. Chem. Rev. 2010, 110,3479–3500.
(9) De Souza Lima, M. M.; Borsali, R. Macromol. Rapid Commun.2004, 25, 771–787.
(10) Ure~na-Benavides, E. E.; Brown, P. J.; Kitchens, C. L. Langmuir2010, 26, 14263–14270.
(11) Pan, J.; Hamad, W.; Straus, S. K. Macromolecules 2010, 43,3851–3858.
(12) Ure~na-Benavides, E. E.; Kitchens, C. L. Macromolecules 2011,44, 3478–3484.
(13) Dong, X. M.; Revol, J.; Gray, D. G. Cellulose 1998, 5, 19–32.(14) Hirai, A.; Inui, O.; Horii, F.; Tsuji, M. Langmuir 2009,
25, 497–502.(15) Dong, X. M.; Kimura, T.; Revol, J.; Gray, D. G. Langmuir 1996,
12, 2076–2082.(16) Dong, X. M.; Gray, D. G. Langmuir 1997, 13, 2404–2409.(17) Orts, W. J.; Godbout, L.; Marchessault, R. H.; Revol, J.-F.
Macromolecules 1998, 31, 5717–5725.(18) Bercea, M.; Navard, P. Macromolecules 2000, 33, 6011–6016.(19) Kvien, I.; Tanem, B. S.; Oksman, K. Biomacromolecules 2005,
6, 3160–3165.(20) Villarrubia, J. S. J. Res. Natl. Inst. Stand. Technol. 1997, 102,
425–454.(21) Terech, P.; Chazeau, L.; Cavaill�e, J. Y. Macromolecules 1999,
32, 1872–1875.(22) Elazzouzi-Hafraoui, S.; Nishiyama, Y.; Putaux, J.; Heux, L.;
Dubreuil, F.; Rochas, C. Biomacromolecules 2008, 9, 57–65.(23) Davis, V. A. J. Mater. Res. 2011, 26, 140.(24) Odijk, T. Macromolecules 1986, 19, 2313–2329.(25) Stroobants, A.; Lekkerkerker, H. N. W.; Odijk, T. Macromole-
cules 1986, 19, 2232–2238.(26) Ao, G.; Nepal, D.; Aono, M.; Davis, V. A. ACS Nano 2011,
5, 1450–1458.(27) Onogi, S.; Asada, T. In Rheology and Rheo-optics of Polymer
Liquid Crystals; Astarita, G., Marrucci, G. Nicolais, L., Eds.; Proceedingsof the Eighth International Congress on Rheology; Plenum Press:Napoles, Italy, 1980; pp 126�136.
(28) Burghardt, W. R. Macromol. Chem. Phys. 1998, 199, 471–488.(29) Hongladarom, K.; Burghardt, W. R. Rheol. Acta 1998, 37,
46–53.(30) Walker, L. J. Rheol. 1994, 38, 1525–1547.(31) Larson, R. G. The Structure and Rheology of Complex Fluids;
Oxford University Press: New York, 1999.(32) Montesi, A.; Pe~na, A.; Pasquali, M. Phys. Rev. Lett. 2004,
92, 058303�1–058303�4.(33) Davis, V. A.; Ericson, L. M.; Parra-Vasquez, A.; Fan, H.; Wang,
Y.; Prieto, V.; Longoria, J. A.; Ramesh, S.; Saini, R. K.; Kittrell, C.; Billups,W. E.; Adams, W. W.; Hauge, R. H.; Smalley, R. E.; Pasquali, M.Macromolecules 2004, 37, 154–160.
(34) Doi, M.; Edwards, S. F. In The Theory of Polymer Dynamics;Oxford University Press: New York, 1986; pp 289�380.
(35) Papkov, S. P.; Kulichikhin, V. G.; Kalmykova, V. D.; Malkin,A. Y. J. Polym. Sci., Polym. Phys. Ed. 1974, 12, 1753–1770.
(36) Lee, H.; Brant, D. A. Macromolecules 2002, 35, 2212–2222.(37) Vinckier, I.; Laun, H. M. J. Rheol. 2001, 45, 1373–1385.(38) Tucker, C. L., III; Moldenaers, P. Annu. Rev. Fluid Mech. 2002,
34, 177–210.(39) Graebling, D.; Muller, R.; Palierne, J. F. Macromolecules 1993,
26, 320–329.(40) Marrucci, G. In Liquid Crystallinity in Polymers, Ciferri, A., Ed.;
VCH Publishers: New York, 1991; pp 395�421.


![Dispersions of multi-wall carbon nanotubes in ferroelectric liquid … · 2014-11-03 · 11] and lyotropic liquid crystals [12–16], while nanotubes themselves can form lyotropic](https://img.pdfslide.us/doc/110x75/5f47f8093d9b6934605cf5c2/dispersions-of-multi-wall-carbon-nanotubes-in-ferroelectric-liquid-2014-11-03.jpg)