Embed Size (px)
Citation preview

Korea-Australia Rheology Journal June 2010 Vol. 22, No. 2 119
Korea-Australia Rheology JournalVol. 22, No. 2, June 2010 pp. 119-127
Rheological properties of fish skin collagen solution :
Effects of temperature and concentration
Min Zhang1, Yihui Chen
1, Guoying Li
1,* and Zongliang Du2
1National Engineering Laboratory for Clean Technology of Leather Manufacture, Sichuan University,Chengdu 610065, PR China
2Textile Institute, Sichuan University, Chengdu 610065, PR China(Received February 18, 2010; final revision received April 9, 2010; accepted April 19, 2010)
Abstract
To use collagen from freshwater fish skin as an alternative source of mammalian collagens for biomedicalapplications, we tested the rheological and structural properties of collagen from the skin of largefin long-barbel catfish (Mystus macropterus) by dynamic viscoelastic measurements. Fish skin collagen solution(FSCS) exhibited a shear-thinning flow behavior. The complex viscosity (η*), loss tangent (tan δ) and relax-ation time of 1.5% FSCS decreased with the increase of temperature. Also, tan δ decreased while the relax-ation time increased with the increase of FSCS concentration. FSCS had considerably lower storagemodulus (G'), loss modulus (G"), η* values and relaxation time and a higher tan δ value than those of bovineskin collagen solution (BSCS). However, FSCS behaved without regularity above 27.5oC, which was inagreement with the result that the dynamic denaturation temperature of this collagen was approximately29.5oC. These results indicated that temperature and concentration could be tools suitable for adjustingFSCS viscosity. The Arrhenius-type time-temperature superposition (TTS) was applied. In addition, theactivation energy of 149.6 KJ mol-1 for 1.5% FSCS was calculated according to the Arrhenius equation,indicating a weaker entanglement effect amongst fish skin collagen molecules than that amongst bovineskin collagen molecules, which was in agreement with the results from AFM measurement.
Keywords : fish skin, collagen, rheological properties, temperature, concentration
1. Introduction
Collagen is a fibrous protein and the most abundant pro-
tein in animals, constituting approximately 30% of total
protein (Haug et al., 2004). Although the relative amounts
of these components vary substantially across tissue types,
type I collagen is the chief structural component of most
mammalian connective tissue such as tendons, bones and
skins (Yang and Kaufman, 2009). It is widely used in fields
including foods, medicines, cosmetics, and cell cultures
(Yoshimura et al., 2000). In most situations, collagen pro-
cessing involves liquid aqueous preparations. For instance
collagen solution was used for medial injection for the
repair of dermatological defects (Ford et al., 1992) or used
to be drug carriers for local application (Toung et al.,
1999). On the other hand, solutions may also be transferred
into solid implants such as sheets, tubes, fibers, powders,
eeces, sponges and membranes (Friess, 1998).
Considering that the physical properties of these medical
products are closely related to the rheological properties of
collagen, it is necessary to carry out rheological measure-
ment to provide some information for processing tech-
nique. Amis et al. (1985) investigated the effect of pH on
collagen flexibility by dilute solution viscoelastic mea-
surements. Friess and Schlapp (2001) showed the influence
of pH, temperature, collagen concentration and chemical
cross-linking on the rheological behavior of insoluble col-
lagen fiber dispersions with different isoelectrical point.
Forgacs et al. (2003) studied the assembly of collagen
matrices as a sol-gel phase transition by means of rhe-
ometry. Yang and Kaufman (2009) studied the self-assem-
bly of bovine collagen initiated by raising the temperature
by rheological measurements. Yoshimura et al. investi-
gated the viscoelastic properties of alkali-solubilized col-
lagen (2000) and pepsin-solubilized collagen (1999)
exacted from shark skin. Lai et al. (2008) investigated the
effect of concentration and temperature on the rheological
behavior of bovine skin collagen solutions, besides, the
rheological behavior of collagen dispersion/poly (vinyl
alcohol) blends was studied (Lai et al., 2007).
At present, the main sources of type I collagen in many
fields are limited to those of bovine or porcine dermis.
Nevertheless, bovine spongiform encephalopathy (BSE) or*Corresponding author: [email protected]© 2010 by The Korean Society of Rheology

Min Zhang, Yihui Chen, Guoying Li and Zongliang Du
120 Korea-Australia Rheology Journal
transmissible spongiform encephalopathy (TSE) is a hor-
rifying threat to collagen medical products based on bovine
material. Compared to mammalian collagens, fish col-
lagens have relatively low risk of possessing pathogens.
In our previous work, collagen from largefin longbarbel
catfish (a temperate freshwater fish) was exacted and par-
tially characterized. Some physicochemistry characteristics
such as the composition of amino acid were found to be
different between this fish collagen and mammalian col-
lagen (Zhang et al., 2009). It is well known that amino acid
composition could influence the structure of collagen mol-
ecules, while the physical properties such as rheological
properties of collagen are significantly influenced by their
structures and conformations in solution (Ramachandran,
1988). Therefore, the rheological behaviors between this
freshwater fish collagen and mammalian collagen might be
quite different. However, there is no information about the
different rheological behaviors between a temperate fresh-
water fish collagen and mammalian collagen. In this paper
we focused on the effects of temperature and concentration
on the rheological behaviors of collagen solution from
largefin longbarbel catfish skin.
2. Experimental
2.1. MaterialsAs described in our previous paper (Zhang et al., 2009),
type I collagen was derived from the purified skin of large-
fin longbarbel catfish (Mystus macropterus) with pepsin
(EC 3.4.23.1, 1:10,000, Sigma Chemical Co.). The solution
obtained was dialyzed against 0.1 M acetic acid, after this
step it was lyophilized in a freeze dryer (Labconco Fre-
eZone 2.5L, USA). Bovine skin collagen solution was pre-
pared through a process described by Zhang et al. (2006).
The solution obtained was also dialyzed against 0.1 M ace-
tic acid and lyophilized in a freeze dryer. Both of the
freeze-dried fish skin collagen and bovine skin collagen
were stored under the same conditions at 4oC within one
month before test.
Sodium dodecyl sulphate-polyacrylamide gel electro-
phoresis (SDS-PAGE) was conducted according to the
method of Laemmli (1970), using 7.5% resolving gel and
4% stacking gel. Both collagens (fish skin collagen and
bovine skin collagen) displayed two α bands (α1 and α2)
and one β band in the electrophoretic patterns, indicating
the similar molecular weight (approximately 300 kDa).
The enzymes remove only the non-helical ends (telopep-
tides) of the collagen. The cutting of the telopeptides
region would remove most of the intermolecular cross-
links of the collagen (Hickman et al., 2000).
2.2. Samples preparationFor the dynamic viscoelastic measurements, fish skin
collagen solutions (FSCSs) with concentrations of 1.0,
1.25, 1.5 and 2.0% (w/w) were prepared by dissolving the
freeze-dried fish collagen in 0.5 M acetic acid. All solu-
tions were centrifuged at 9000 × g for 15 min to remove
entrapped air-bubbles.
For the surface morphology measurements, fish skin col-
lagen solutions and bovine skin collagen solutions were
prepared by dissolving the freeze-dried collagens into
0.5 M acetic acid. Concentration used for both collagen
solutions was 8 µg/ml.
2.3. Investigation on the rheological properties offish skin collagen
Oscillatory rheological experiments were performed by
the method of Lai et al. (2008) with slightly modification.
The samples were tested on a Rheometer System Gemini
200 (Malvern Instruments, UK). For precise control of
sample temperature, a Peltier temperature controller, the
range of which was from −30 to 200oC with an accuracy of
±0.1oC, was used.
Effects of temperature on the viscoelastic behaviors of
1.5% FSCS were studied by both dynamic temperature
sweeps and dynamic frequency sweeps. The dynamic tem-
perature sweeps for 1.5% collagen solution were con-
ducted within the linear range at a constant strain of 5%
and a given frequency of 1 Hz and the solution was heated
from 20 to 32.5oC at a rate of 0.5oC/min. The dynamic fre-
quency sweeps for collagen solutions at different temper-
atures were induced from 0.1 to 10 Hz at a constant strain
of 5%. At the designated temperatures (17.5, 20, 22.5, 25,
27.5, and 30oC), each sample was equilibrated for 20 min
before measurement. Dynamic frequency sweeps for col-
lagen solutions with different concentrations (1.0, 1.25, 1.5
and 2.0%) were performed from 0.1 to 10 Hz at 20oC at a
constant strain of 5%. The storage modulus (G'), loss mod-
ulus (G"), complex viscosity (η*) and the loss tangent (tan
δ = G"/ G') were recorded. Duplicate experiments gave the
quite similar results and the data reported represent mean
values from two replicates.
2.4. Atomic force microscopy Droplets of collagen solutions (6 µl) were evaporated on
mica and dried at room temperature (~20oC) for two days.
The surface morphology was examined on the drying sam-
ples by Atomic force microscopy (AFM) measurements.
The AFM (SHIMADZU SPM 9600, Japan) with a pin-
point (NSG 11, Russia) was operated in the dynamic mode
at room temperature (~20oC). Each sample was scanned
with a scan rate of 2 Hz.
3. Results and discussion
3.1. The effect of temperature on dynamic rheo-logical properties
Fig. 1 shows how the η* and tan δ values of 1.5% FSCS

Rheological properties of fish skin collagen solution : Effects of temperature and concentration
Korea-Australia Rheology Journal June 2010 Vol. 22, No. 2 121
change as the temperature is increased from 20 to 32.5oC.
The η* values of FSCS decreased with the rising tem-
perature. This phenomenon might attribute to the fact that
the energy for heat motion of polypeptide chains increased
and thus the resistance to segment motion became weaker
as the temperature increased. Within the temperature range
from 24 to 30oC, a sudden decrease of η* in magnitudes and
a concomitant rapid increase in tan δ were observed. These
obvious changes reflected the collapse of the collagen triple
helix to a random coil, that is, the breakage of bonds that
stabilizes the secondary structure of collagen (Pietrucha,
2005). The temperature where tan δ reached the peak value
could be taken as the denaturation temperature (Td) under
dynamic rheological measurement. Therefore, Td of fish
skin collagen was observed to be 29.5oC (±0.3oC S.D.),
which was slightly lower than that measured by DSC
(31.6oC). It seemed that the stability of collagen triple helix
would be influenced by mechanical treatment. This result
indicated that changing the temperature could be an effec-
tive treatment for adjusting collagen viscosity for casting
and filling.
Under dynamic rheological measurement, the Td value of
FSCS was lower than that of BSCS (32.6±0.1oC S.D.) (Lai
et al., 2008). As reported in our previous paper (Zhang et
al., 2009), the amino acid composition of collagen from
skin of largefin longbarbel catfish was different from that of
bovine skin collagen. Therefore, in the acetic acid solution
with the same pH (~2.5), the electrostatic repelling force
amongst fish skin collagen chains might be different from
that amongst bovine skin collagen chains, which led to the
weaker stability for fish skin collagen helices.
Additionally, the general amino acid sequence in the type
I collagen chain is the repeating Gly-X-Y, where X is often
proline and Y is often hydroxyproline. Two different expla-
nations were proposed to explain the stabilizing effect of
the Hyp-OH group. The first explanation is a stabilizing
effect of water bridges between the Hyp-OH groups and
backbone carbonyl groups. Later on, questions were raised
about whether these indirect hydrogen bond networks pro-
vide stabilizing energy to the peptide (Ramachandran et
al., 1973). The second and now more generally accepted
explanation is that the stabilization is achieved from the
inductive effect of the Hyp-OH group (Jenkins and Raines,
2002). It seems that the Hyp-OH groups play an important
role in the stabilization of collagen molecules. For type I
collagen from largefin longbarbel catfish skin, the hydrox-
yproline content was 74 residues/1000 residues, which was
lower compared to that of bovine skin collagen (94 res-
idues/1000 residues) (Zhang et al., 2009). The lower con-
tent of the Hyp-OH groups led to a relatively lower Td
value for fish skin collagen.
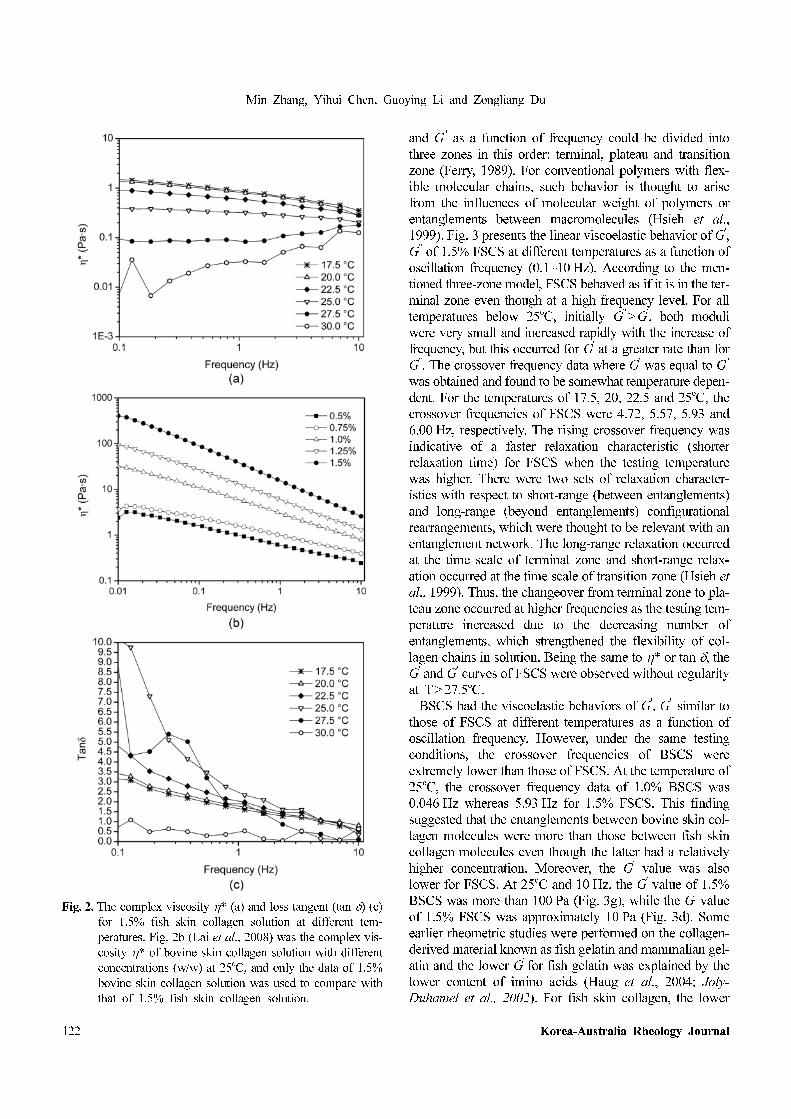
As a function of oscillation frequency (0.1~10 Hz), the
viscoelastic behavior of the η* values of 1.5% FSCS was
further studied. As can be seen from Fig. 2a, at T<25oC,
the collagen solution exhibited a shear-thinning flow
behavior as η* decreased with the rising frequency. How-
ever, the solution behaved without regularity at T>27.5oC.
The irregular behavior might reflect the thermal denatur-
ation of collagen. The η* value of FSCS was lower than
that of BSCS. For instance, at 25oC and 10 Hz, η* was
approximately 3.0 Pa·s for 1.5% BSCS (Fig. 2b) whereas
only 0.2037 Pa·s for 1.5% FSCS. Sai and Babu (2001) sug-
gested that viscosity of collagen was contributed by inter-
and intramolecular hydrogen bonding. In our study, the dif-
ferent viscoelastic behavior of η* values between the two
collagens might be caused by the different amino acid
composition including the hydroxyproline content. As
mentioned, this difference would influence inter- and
intramolecular interactions, and finally influence the vis-
cosity.
The loss tangent (tan δ) crossed the threshold from solid-
like to liquid-like behavior (tan δ =1) (Al-Ruqaie et al.,
1997). The smaller the value of tan δ, the more rubbery or
elastomeric was the behavior of the material (Korhonen et
al., 2001). Fig. 2c shows the loss tangent as a function of
oscillation frequency (0.1~10 Hz). The tan δ of 1.5%
FSCS increased with the increase of temperature within the
temperature range from 17.5 to 25oC. In addition, tan δ>1
was obtained when the testing temperature was below
25oC, which indicated that 1.5% FSCS exhibited a liquid-
like behavior but not a solid-like behavior. Also, the tan δ
curves of FSCS were observed without regularity above
27.5oC.
The technique of dynamic oscillation was useful in
resolving the structural properties of materials into a solid
and a liquid-like response (G' and G", respectively) (Kasa-
pis and Mitchell, 2001). The value of G' reflects energy
stored elastically in the system whereas the value of G"
reflects energy dissipated as a characteristic of the viscous
properties (Yang and Kaufman, 2009). According to the
relative magnitude of G' and G", a logarithmic plot of G'
Fig. 1. Temperature dependence of η* and tan δ for 1.5% fish
skin collagen solution.
Min Zhang, Yihui Chen, Guoying Li and Zongliang Du
122 Korea-Australia Rheology Journal
and G" as a function of frequency could be divided into
three zones in this order: terminal, plateau and transition
zone (Ferry, 1989). For conventional polymers with flex-
ible molecular chains, such behavior is thought to arise
from the influences of molecular weight of polymers or
entanglements between macromolecules (Hsieh et al.,
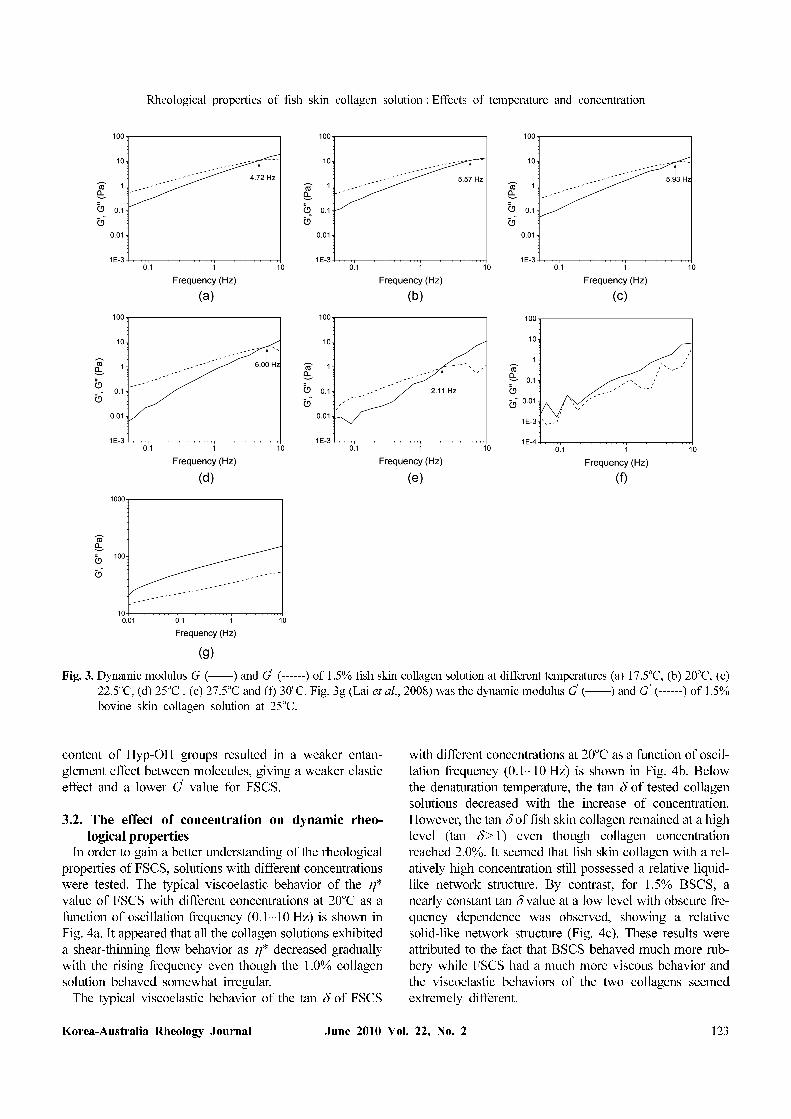
1999). Fig. 3 presents the linear viscoelastic behavior of G',
G" of 1.5% FSCS at different temperatures as a function of
oscillation frequency (0.1~10 Hz). According to the men-
tioned three-zone model, FSCS behaved as if it is in the ter-
minal zone even though at a high frequency level. For all
temperatures below 25oC, initially G" >G', both moduli
were very small and increased rapidly with the increase of
frequency, but this occurred for G' at a greater rate than for
G". The crossover frequency data where G' was equal to G"
was obtained and found to be somewhat temperature depen-
dent. For the temperatures of 17.5, 20, 22.5 and 25oC, the
crossover frequencies of FSCS were 4.72, 5.57, 5.93 and
6.00 Hz, respectively. The rising crossover frequency was
indicative of a faster relaxation characteristic (shorter
relaxation time) for FSCS when the testing temperature
was higher. There were two sets of relaxation character-
istics with respect to short-range (between entanglements)
and long-range (beyond entanglements) configurational
rearrangements, which were thought to be relevant with an
entanglement network. The long-range relaxation occurred
at the time scale of terminal zone and short-range relax-
ation occurred at the time scale of transition zone (Hsieh et
al., 1999). Thus, the changeover from terminal zone to pla-
teau zone occurred at higher frequencies as the testing tem-
perature increased due to the decreasing number of
entanglements, which strengthened the flexibility of col-
lagen chains in solution. Being the same to η* or tan δ, the
G' and G" curves of FSCS were observed without regularity
at T>27.5oC.
BSCS had the viscoelastic behaviors of G', G" similar to
those of FSCS at different temperatures as a function of
oscillation frequency. However, under the same testing
conditions, the crossover frequencies of BSCS were
extremely lower than those of FSCS. At the temperature of
25oC, the crossover frequency data of 1.0% BSCS was
0.046 Hz whereas 5.93 Hz for 1.5% FSCS. This finding
suggested that the entanglements between bovine skin col-
lagen molecules were more than those between fish skin
collagen molecules even though the latter had a relatively
higher concentration. Moreover, the G' value was also
lower for FSCS. At 25oC and 10 Hz, the G' value of 1.5%
BSCS was more than 100 Pa (Fig. 3g), while the G' value
of 1.5% FSCS was approximately 10 Pa (Fig. 3d). Some
earlier rheometric studies were performed on the collagen-
derived material known as fish gelatin and mammalian gel-
atin and the lower G' for fish gelatin was explained by the
lower content of imino acids (Haug et al., 2004; Joly-
Duhamel et al., 2002). For fish skin collagen, the lower
Fig. 2. The complex viscosity η* (a) and loss tangent (tan δ) (c)
for 1.5% fish skin collagen solution at different tem-
peratures. Fig. 2b (Lai et al., 2008) was the complex vis-
cosity η* of bovine skin collagen solution with different
concentrations (w/w) at 25oC, and only the data of 1.5%
bovine skin collagen solution was used to compare with
that of 1.5% fish skin collagen solution.
Rheological properties of fish skin collagen solution : Effects of temperature and concentration
Korea-Australia Rheology Journal June 2010 Vol. 22, No. 2 123
content of Hyp-OH groups resulted in a weaker entan-
glement effect between molecules, giving a weaker elastic
effect and a lower G' value for FSCS.
3.2. The effect of concentration on dynamic rheo-logical properties
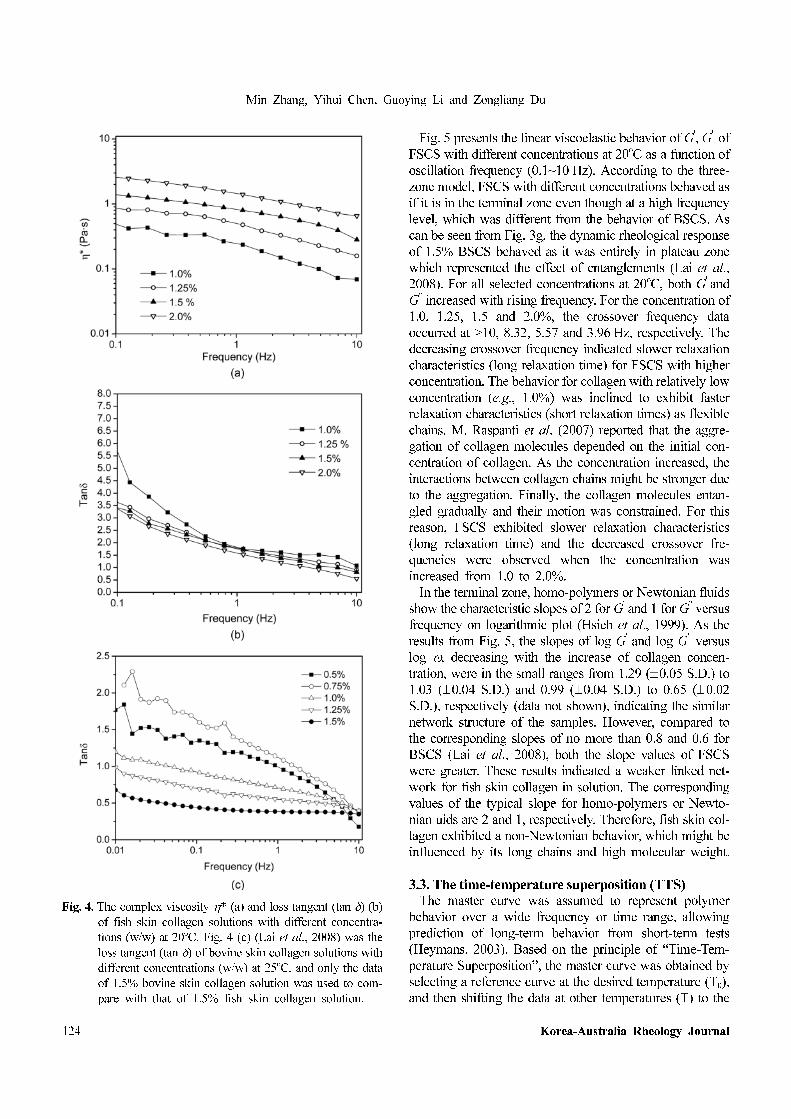
In order to gain a better understanding of the rheological
properties of FSCS, solutions with different concentrations
were tested. The typical viscoelastic behavior of the η*
value of FSCS with different concentrations at 20oC as a
function of oscillation frequency (0.1~10 Hz) is shown in
Fig. 4a. It appeared that all the collagen solutions exhibited
a shear-thinning flow behavior as η* decreased gradually
with the rising frequency even though the 1.0% collagen
solution behaved somewhat irregular.
The typical viscoelastic behavior of the tan δ of FSCS
with different concentrations at 20oC as a function of oscil-
lation frequency (0.1~10 Hz) is shown in Fig. 4b. Below
the denaturation temperature, the tan δ of tested collagen
solutions decreased with the increase of concentration.
However, the tan δ of fish skin collagen remained at a high
level (tan δ >1) even though collagen concentration
reached 2.0%. It seemed that fish skin collagen with a rel-
atively high concentration still possessed a relative liquid-
like network structure. By contrast, for 1.5% BSCS, a
nearly constant tan δ value at a low level with obscure fre-
quency dependence was observed, showing a relative
solid-like network structure (Fig. 4c). These results were
attributed to the fact that BSCS behaved much more rub-
bery while FSCS had a much more viscous behavior and
the viscoelastic behaviors of the two collagens seemed
extremely different.
Fig. 3. Dynamic modulus G' (——) and G" (------) of 1.5% fish skin collagen solution at different temperatures (a) 17.5oC, (b) 20oC, (c)
22.5oC, (d) 25oC , (e) 27.5oC and (f) 30oC. Fig. 3g (Lai et al., 2008) was the dynamic modulus G' (——) and G" (------) of 1.5%
bovine skin collagen solution at 25oC.
Min Zhang, Yihui Chen, Guoying Li and Zongliang Du
124 Korea-Australia Rheology Journal
Fig. 5 presents the linear viscoelastic behavior of G', G" of
FSCS with different concentrations at 20oC as a function of
oscillation frequency (0.1~10 Hz). According to the three-
zone model, FSCS with different concentrations behaved as
if it is in the terminal zone even though at a high frequency
level, which was different from the behavior of BSCS. As
can be seen from Fig. 3g, the dynamic rheological response
of 1.5% BSCS behaved as it was entirely in plateau zone
which represented the effect of entanglements (Lai et al.,
2008). For all selected concentrations at 20oC, both G' and
G" increased with rising frequency. For the concentration of
1.0, 1.25, 1.5 and 2.0%, the crossover frequency data
occurred at >10, 8.32, 5.57 and 3.96 Hz, respectively. The
decreasing crossover frequency indicated slower relaxation
characteristics (long relaxation time) for FSCS with higher
concentration. The behavior for collagen with relatively low
concentration (e.g., 1.0%) was inclined to exhibit faster
relaxation characteristics (short relaxation times) as flexible
chains. M. Raspanti et al. (2007) reported that the aggre-
gation of collagen molecules depended on the initial con-
centration of collagen. As the concentration increased, the
interactions between collagen chains might be stronger due
to the aggregation. Finally, the collagen molecules entan-
gled gradually and their motion was constrained. For this
reason, FSCS exhibited slower relaxation characteristics
(long relaxation time) and the decreased crossover fre-
quencies were observed when the concentration was
increased from 1.0 to 2.0%.
In the terminal zone, homo-polymers or Newtonian fluids
show the characteristic slopes of 2 for G' and 1 for G" versus
frequency on logarithmic plot (Hsieh et al., 1999). As the
results from Fig. 5, the slopes of log G' and log G" versus
log ω, decreasing with the increase of collagen concen-
tration, were in the small ranges from 1.29 (±0.05 S.D.) to
1.03 (±0.04 S.D.) and 0.99 (±0.04 S.D.) to 0.65 (±0.02
S.D.), respectively (data not shown), indicating the similar
network structure of the samples. However, compared to
the corresponding slopes of no more than 0.8 and 0.6 for
BSCS (Lai et al., 2008), both the slope values of FSCS
were greater. These results indicated a weaker linked net-
work for fish skin collagen in solution. The corresponding
values of the typical slope for homo-polymers or Newto-
nian uids are 2 and 1, respectively. Therefore, fish skin col-
lagen exhibited a non-Newtonian behavior, which might be
influenced by its long chains and high molecular weight.
3.3. The time-temperature superposition (TTS)The master curve was assumed to represent polymer
behavior over a wide frequency or time range, allowing
prediction of long-term behavior from short-term tests
(Heymans, 2003). Based on the principle of “Time-Tem-
perature Superposition”, the master curve was obtained by
selecting a reference curve at the desired temperature (T0),
and then shifting the data at other temperatures (T) to the
Fig. 4. The complex viscosity η* (a) and loss tangent (tan δ) (b)
of fish skin collagen solutions with different concentra-
tions (w/w) at 20oC. Fig. 4 (c) (Lai et al., 2008) was the
loss tangent (tan δ) of bovine skin collagen solutions with
different concentrations (w/w) at 25oC, and only the data
of 1.5% bovine skin collagen solution was used to com-
pare with that of 1.5% fish skin collagen solution.

Rheological properties of fish skin collagen solution : Effects of temperature and concentration
Korea-Australia Rheology Journal June 2010 Vol. 22, No. 2 125
reference temperature curve (by horizontally shifting along
the frequency axis and then overlapping on the curves at
the reference temperatures). The shift distance along the
frequency axis is called the frequency-temperature shift
factor (Vaidyanathan et al., 2003). The time-temperature
superposition curve is constructed by empirical shifts of
data and implemented in Fig. 6, with 22.5oC as the ref-
erence temperature. Obviously, the curve exhibited a
remarkable transition from the terminal zone to the plateau
zone with a wide frequency roughly range from 10-1 Hz to
101.5 Hz. However, as shown earlier by Lai et al. (2008),
the frequency data obtained at 27.5oC did not superimpose
well. Moreover, the frequency data obtained at 30oC failed
to superpose, which reflected the different relaxation times
involved in denaturation and phase transition. The acti-
vation energy was calculated by the Arrhenius equation:
(1)
in which R is the universal gas constant (8.314 J mol-1 K-1),
αT is the shift factor, and E is identified as the activation
energy for the jump of a molecule from one equilibrium
position in the solution to the next (Monkos, 1996). For
collagen molecules, E was associated with the relaxation
transition. The activation energy of 149.6 KJ mol-1 for 1.5%
FSCS was calculated from the linear regression plotting of
lnαT
E
R---
1
T---
1
T0
-----–⎝ ⎠⎛ ⎞=
Fig. 5. Dynamic modulus G' (——) and G" (------) of fish skin collagen solutions at 25oC with different concentrations (a) 1.0%, (b)
1.25%, (c) 1.5% and (d) 2.0%.
Fig. 6. Master curve of dynamic modulus (G' and G") for 1.5%
fish skin collagen solution at the reference temperature of
22.5oC.
Min Zhang, Yihui Chen, Guoying Li and Zongliang Du
126 Korea-Australia Rheology Journal
ln αT versus 1/T according to this equation. As previously
reported by Lai et al. (2008), the activation energy of 1.0%
BSCS was 161.4 KJ mol-1, which was higher than that of
1.5% FSCS. Considering that the activation energy
reflected the need to overcome an energetic barrier of local
rearrangements from one state to the other, the lower val-
ues of the activation energy for FSCS was in line with the
findings that fish skin collagen molecules were easier to
motion due to the weaker entanglement network.
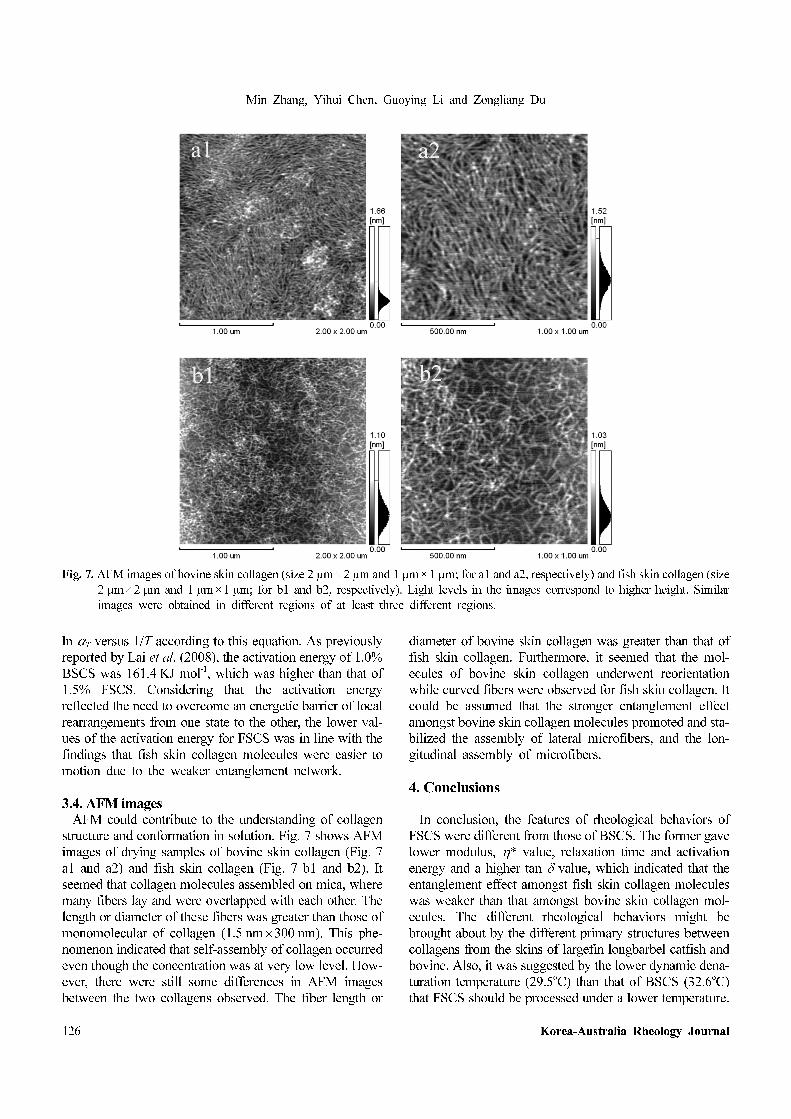
3.4. AFM imagesAFM could contribute to the understanding of collagen
structure and conformation in solution. Fig. 7 shows AFM
images of drying samples of bovine skin collagen (Fig. 7
a1 and a2) and fish skin collagen (Fig. 7 b1 and b2). It
seemed that collagen molecules assembled on mica, where
many fibers lay and were overlapped with each other. The
length or diameter of these fibers was greater than those of
monomolecular of collagen (1.5 nm×300 nm). This phe-
nomenon indicated that self-assembly of collagen occurred
even though the concentration was at very low level. How-
ever, there were still some differences in AFM images
between the two collagens observed. The fiber length or
diameter of bovine skin collagen was greater than that of
fish skin collagen. Furthermore, it seemed that the mol-
ecules of bovine skin collagen underwent reorientation
while curved fibers were observed for fish skin collagen. It
could be assumed that the stronger entanglement effect
amongst bovine skin collagen molecules promoted and sta-
bilized the assembly of lateral microfibers, and the lon-
gitudinal assembly of microfibers.
4. Conclusions
In conclusion, the features of rheological behaviors of
FSCS were different from those of BSCS. The former gave
lower modulus, η* value, relaxation time and activation
energy and a higher tan δ value, which indicated that the
entanglement effect amongst fish skin collagen molecules
was weaker than that amongst bovine skin collagen mol-
ecules. The different rheological behaviors might be
brought about by the different primary structures between
collagens from the skins of largefin longbarbel catfish and
bovine. Also, it was suggested by the lower dynamic dena-
turation temperature (29.5oC) than that of BSCS (32.6oC)
that FSCS should be processed under a lower temperature.
Fig. 7. AFM images of bovine skin collagen (size 2 µm ×2 µm and 1 µm ×1 µm; for a1 and a2, respectively) and fish skin collagen (size
2 µm ×2 µm and 1 µm ×1 µm; for b1 and b2, respectively). Light levels in the images correspond to higher height. Similar
images were obtained in different regions of at least three different regions.
Rheological properties of fish skin collagen solution : Effects of temperature and concentration
Korea-Australia Rheology Journal June 2010 Vol. 22, No. 2 127
FSCS viscosity could be adjusted effectively by increasing
the temperature carefully below 29.5oC during the treat-
ment. The surface morphology examined with AFM indi-
cated a weaker entanglement effect amongst fish skin
collagen molecules, which was consistent with the results
from dynamic viscoelastic measurements.
Acknowledgements
This work was financially supported by the National
Natural Science Foundation of China (No. 20876098/
B060805).
References
Al-Ruqaie, I.M., S. Kasapis, and R. Abeysekera, 1997, Structural
properties of pectin-gelatin gels. Part II: effect of sucrose/glu-
cose syrup, Carbohydr. Polym. 34, 309-321.
Amis, E.J., C.J. Carriere, J.D. Ferry, and A. Veis, 1985, Effect of
pH on collagen flexibility determined from dilute solution vis-
coelastic measurements, Int. J. Biol. Macromol. 7, 130-134.
Ferry, J.D. 1989, Viscoelastic Properties of Polymers, Wiley,
New York, p. 369.
Friess, W. 1998, Collagen-biomaterial for drug delivery, Eur. J.
Pharm. Biopharm. 45, 113-136.
Friess, W. and M. Schlapp, 2001, Effects of processing con-
ditions on the rheological behavior of collagen dispersions,
Eur. J. Pharm. Biopharm. 51, 259-265.
Ford, C.N., D.M. Bless, and J.M. Loftus, 1992, Role of injectable
collagen in the treatment of glottic insufficiency: a study of 119
patients, Ann Otol Rhinol Laryngol. 101, 237-247.
Forgacs, G., S.A. Newman, B. Hinner, C.W. Maier, and E. Sack-
mann, 2003, Assembly of collagen matrices as a phase tran-
sition revealed by structural and rheologic studies, Biophys. J.
84, 1272-1280.
Haug, I.J., K.I. Draget, and O. Smidsrød, 2004, Physical and
rheological properties of fish gelatin compared to mammalian
gelatin, Food Hydrocolloid. 18, 203-213.
Heymans, N. 2003, Constitutive equations for polymer viscoelas-
ticity derived from hierarchical models in cases of failure of
time-temperature superposition, Signal Process. 83, 2345-2357.
Hickman, D., T. J. Sims, C. A. Miles, A. J. Bailey, M. de Mari,
and M. Koopmans, 2000, Isinglass/collagen: Denaturation and
functionality, J. Biotech. 79, 245-257.
Hsieh, T.T., C. Tiu, G.P. Simon, and R.Y. Wu, 1999, Rheology
and miscibility of thermotropic liquid crystalline polymer
blends, J. Non-Newtonian Fluid Mech. 86, 15-35.
Jenkins, C.L. and R.T. Raines, 2002, Insights on the confor-
mational stability of collagen, Nat. Prod. Rep. 19, 49-59.
Joly-Duhamel, C., D. Hellio, A. Ajdari and M. Djabourov, 2002,
All gelatin networks: 2. The master curve for elasticity, Lang-
muir. 18, 7158-7166.
Kasapis, S. and J.R. Mitchell, 2001, Definition of the rheological
glass transition temperature in association with the concept of
iso-free-volume, Int. J. Biol. Macromol. 29, 315-321.
Korhonen, M., L. Hellen, J. Hirvonen, and J. Yliruusi, 2001,
Rheological properties of creams with four different surfactant
combinations-effect of storage time and conditions, Int. J.
Pharm. 221, 187-196.
Laemmli, U.K. 1970, Cleavage of structural proteins during
assembly of head of bacteriophage T4, Nature. 277, 680-685.
Lai, G.L., Y. Li, and G.Y. Li, 2008, Effect of concentration and
temperature on the rheological behavior of collagen solution,
Int. J. Biol. Macromol. 42, 285-291.
Lai, G.L., Z.L. Du, and G.Y. Li, 2007, The rheological behavior
of collagen dispersion/poly(vinyl alcohol) blends, Korea-Aus-
tralia Rheol J. 19, 81-88.
Monkos, K. 1996, Viscosity of bovine serum albumin aqueous
solutions as a function of temperature and concentration, Int. J.
Biol. Macromol. 18, 61-68.
Pietrucha, K. 2005, Changes in denaturation and rheological
properties of collagen-hyaluronic acid scaffolds as a result of
temperature dependencies, Int. J. Biol. Macromol. 36, 299-304.
Ramachandran, G.N. 1988, Stereochemistry of collagen, Int. J.
Peptide Protein Res. 31, 1-16.
Ramachandran, G.N., M. Bansal, and R.S. Bhatnagar, 1973, A
hypothesis on the role of hydroxyprohne in stabilizing collagen
structure, Biochim. Biophys. Acta. 322, 166-171.
Raspanti, M., M. Viola, M. Sonaggere, M.E. Tira, and R. Tenni,
2007, Collagen bril structure is affected by collagen concen-
tration and decorin, Biomacromolecules. 8, 2087-2091.
Sai, K.P. and M. Babu, 2001, Studies on Rana tigerrina skin col-
lagen, Comp. Biochem. Physiol. B: Biochem. Mol. Biol. 128,
81-90.
Toung, J.S., R.C. Ogle, R.F. Morgan, and W.H. Lindsey, 1999,
Insulinlike growth factor 1- and 2-augmented collagen gel
repair of facial osseous defects, Arch. Otolaryngol. Head Neck
Surg. 125, 451-455
Vaidyanathan, T.K., J. Vaidyanathan, and Z. Cherian, 2003,
Extended creep behavior of dental composites using time-tem-
parature superposition principle, Dent. Mater. 19, 46-53.
Woessner Jr, J.F, 1961, The determination of hydroxyproline in
tissue and protein samples containing small proportions of this
imino acid, Arch. Biochem. Biophys. 93, 440-447.
Yang, Y.L. and L.J. Kaufman, 2009, Rheology and confocal
reflectance microscopy as probes of mechanical properties and
structure during collagen and collagen/hyaluronan self-assem-
bly, Biophys. J. 96, 1566-1585.
Yoshimura, K., M. Terashima, D. Hozan, and K. Shirai, 2000,
Preparation and dynamic viscoelasticity characterization of
alkali-solubilized collagen from shark skin, J. Agric. Food
Chem. 48, 685-690.
Yoshimura, K., Y. Chonan, and K. Shirai, 1999, Preparation and
dynamic viscoelastic characterization of pepsin-solubilized
collagen from shark skin compared with pig skin, J. Anim. Sci.
70, 227-234.
Zhang, M., W.T. Liu, and G.Y. Li, 2009, Isolation and char-
acterization of collagens from the skin of largefin longbarbel
catfish (Mystus macropterus), Food Chem. 115, 826-831.
Zhang, Z.K., G.Y. Li, and B. Shi, 2006, Physicochemical Prop-
erties of Collagen, Gelatin and Collagen Hydrolysate derived
from Bovine Limed Split Wastes, J. Soc. Leather Technol.
Chem. 90, 23-28.